Fatal car crashes and road traffic accidents in Oro Valley, Arizona
- Fatal car crash and road traffic accident statistics for 2021
- Fatal accident count3
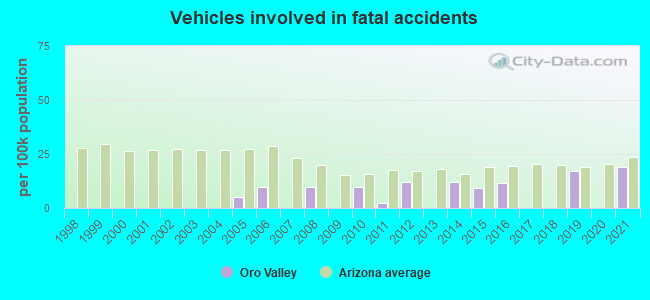
- Vehicles involved in fatal accidents9
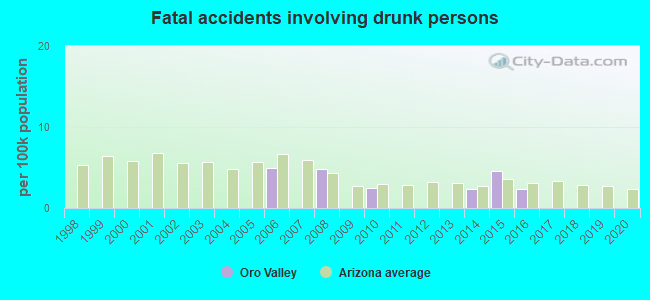
- Fatal accidents involving drunk persons0
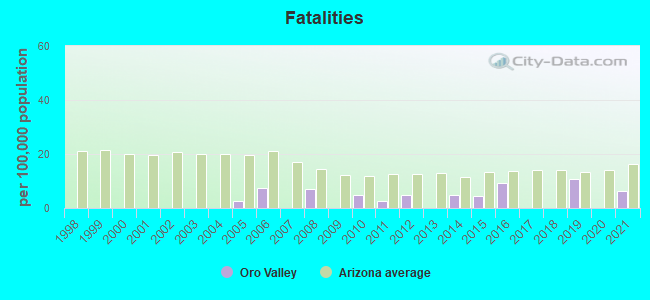
- Fatalities3
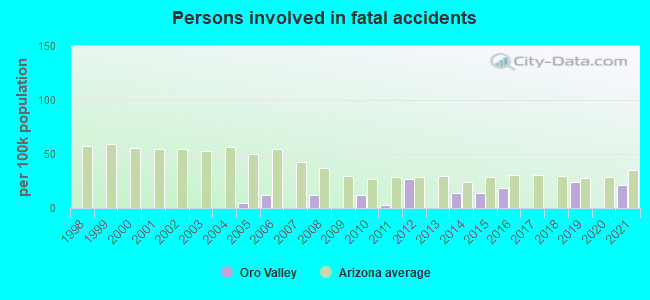
- Persons involved in fatal accidents10
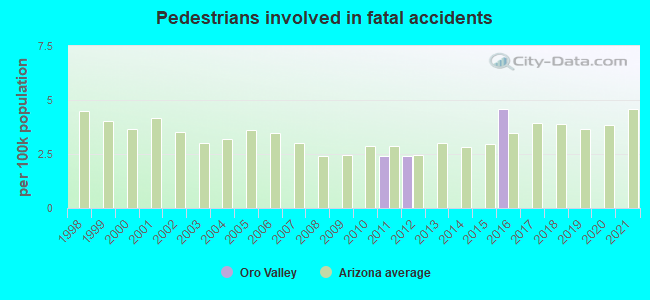
- Pedestrians involved in fatal accidents0
- Fatal car crash and road traffic accident statistics for 2019
- Fatal accident count3
- Vehicles involved in fatal accidents8
- Fatal accidents involving drunk persons0
- Fatalities5
- Persons involved in fatal accidents11
- Pedestrians involved in fatal accidents0
- Fatal car crash and road traffic accident statistics for 2016
- Fatal accident count4
- Vehicles involved in fatal accidents5
- Fatal accidents involving drunk persons1
- Fatalities4
- Persons involved in fatal accidents8
- Pedestrians involved in fatal accidents2
- Fatal car crash and road traffic accident statistics for 2015
- Fatal accident count2
- Vehicles involved in fatal accidents4
- Fatal accidents involving drunk persons2
- Fatalities2
- Persons involved in fatal accidents6
- Pedestrians involved in fatal accidents0
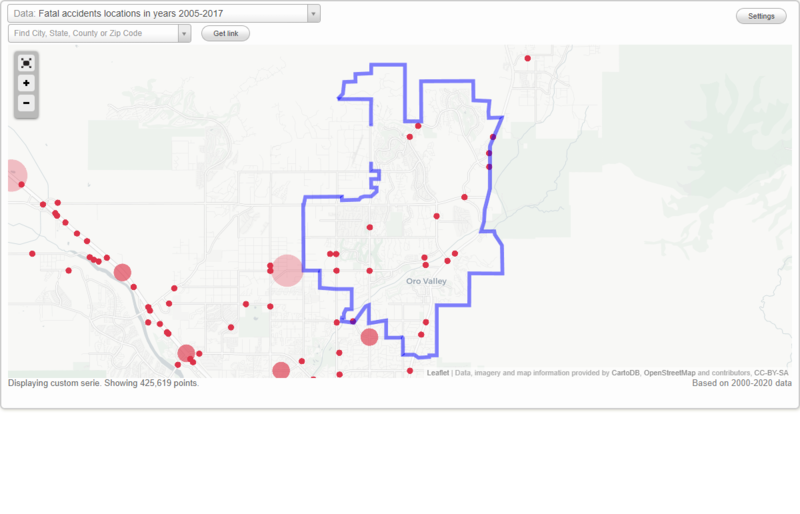
Data:
No street view available for this location
Oro Valley fatal accident statistics for 1998 - 2021
Average EMS response time
- Oro Valley(Based on 22 reports) 7.5 mins
- Pima County(Based on 3,105 reports) 9.8 mins
- Arizona(Based on 24,972 reports) 12.8 mins
Average hospital transport time
- Oro Valley(Based on 17 reports) 47.4 mins
- Pima County(Based on 712 reports) 43.8 mins
- Arizona(Based on 5,160 reports) 50.2 mins
Daylight
- Oro Valley(Based on 25 reports) 68.0%
- Pima County(Based on 5,216 reports) 42.8%
- Arizona(Based on 38,003 reports) 45.9%
Dark - Not Lighted
- Oro Valley(Based on 25 reports) 24.0%
- Pima County(Based on 5,216 reports) 32.5%
- Arizona(Based on 38,003 reports) 26.9%
Dark - Lighted
- Oro Valley(Based on 25 reports) 8.0%
- Pima County(Based on 5,216 reports) 19.3%
- Arizona(Based on 38,003 reports) 20.5%
Clear
- Oro Valley(Based on 24 reports) 100.0%
- Pima County(Based on 5,271 reports) 91.3%
- Arizona(Based on 37,899 reports) 90.2%
Oro Valley fatal car crash and road traffic accident list for 2021
Oro Valley fatal car crash and road traffic accident list for 2019
Oro Valley fatal car crash and road traffic accident list for 2016
- Fatal accident count4
- Vehicles involved in fatal accidents5
- Fatal accidents involving drunk persons1
- Fatalities4
- Persons involved in fatal accidents8
- Pedestrians involved in fatal accidents2
Average EMS response time
- Oro Valley(Based on 4 reports) 6.3 mins
- Pima County(Based on 82 reports) 8.4 mins
- Arizona(Based on 686 reports) 9.6 mins
Average hospital transport time
- Oro Valley(Based on 3 reports) 39.3 mins
- Pima County(Based on 53 reports) 25.5 mins
- Arizona(Based on 433 reports) 33.2 mins
Daylight
- Oro Valley(Based on 4 reports) 75.0%
- Pima County(Based on 95 reports) 46.3%
- Arizona(Based on 831 reports) 46.1%
Dark - Not Lighted
- Oro Valley(Based on 4 reports) 25.0%
- Pima County(Based on 95 reports) 17.9%
- Arizona(Based on 831 reports) 15.9%
Clear
- Oro Valley(Based on 4 reports) 100.0%
- Pima County(Based on 93 reports) 88.2%
- Arizona(Based on 800 reports) 86.9%
Oro Valley fatal car crash and road traffic accident list for 2015
| # | Date | Location | Vehicles | Drunk persons | Fatalites | Persons | Pedestrians |
|---|
| 1 | Jan 10, 2015 05:58 AM | Sr-77 Oracle Rd | 2 | 1
| 1 | 3 | - |
| 2 | Apr 12, 2015 07:45 PM | Sr-77 | 2 | 1
| 1 | 3 | - |
Oro Valley fatal car crash and road traffic accident list for 2014
Oro Valley fatal car crash and road traffic accident list for 2012
Oro Valley fatal car crash and road traffic accident list for 2011
Oro Valley fatal car crash and road traffic accident list for 2010
Oro Valley fatal car crash and road traffic accident list for 2008
Oro Valley fatal car crash and road traffic accident list for 2006
Oro Valley fatal car crash and road traffic accident list for 2005