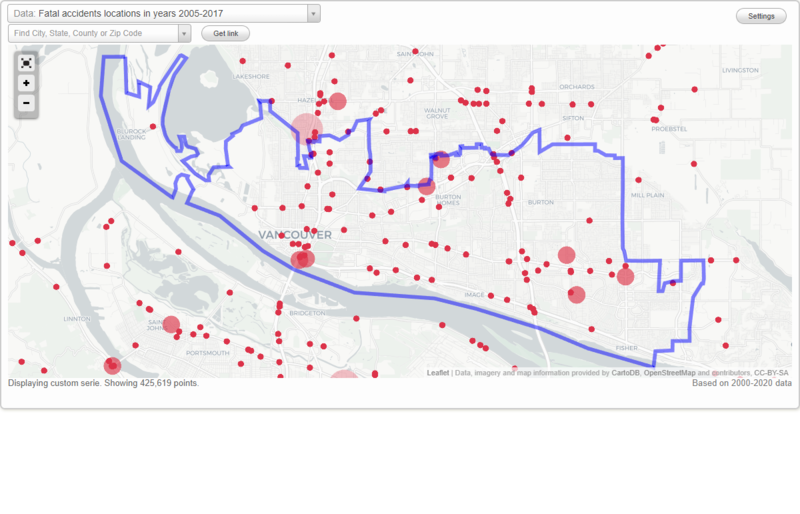
Fatal car crashes and road traffic accidents in Vancouver, Washington
- Fatal car crash and road traffic accident statistics for 2021
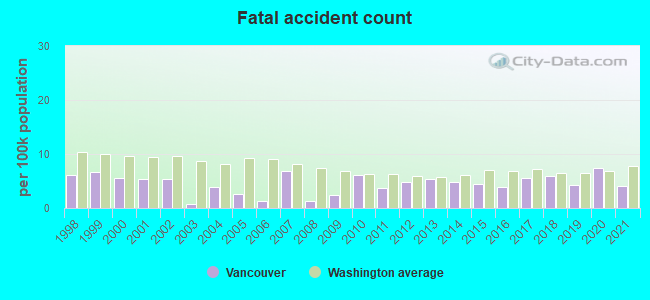
- Fatal accident count8
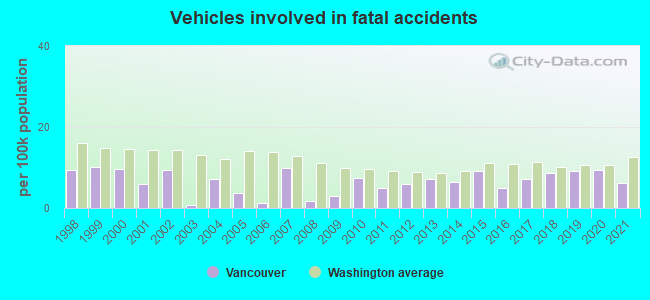
- Vehicles involved in fatal accidents12
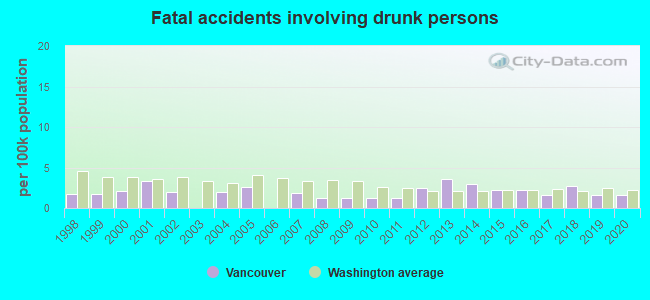
- Fatal accidents involving drunk persons0
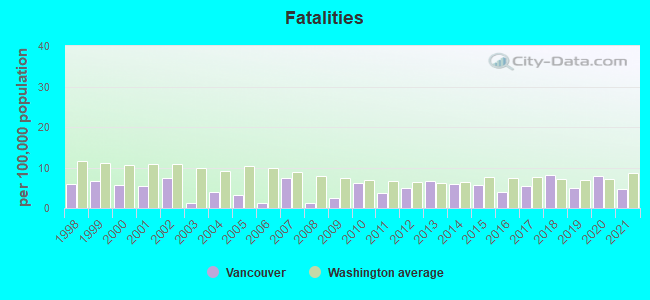
- Fatalities9
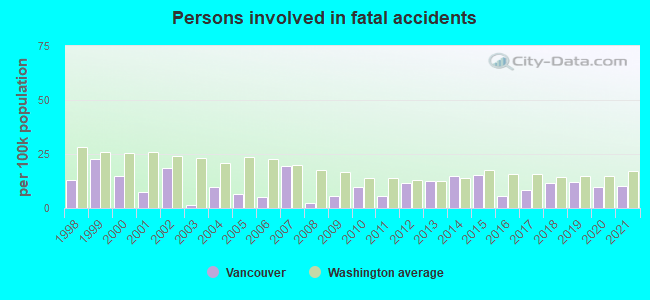
- Persons involved in fatal accidents20
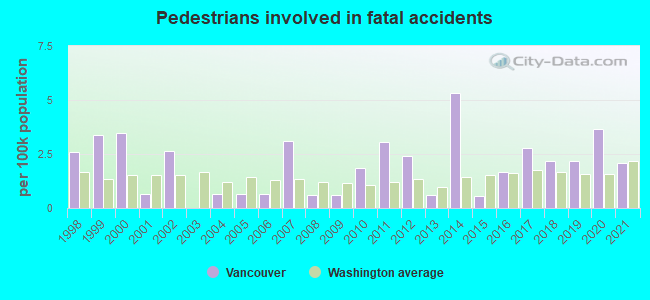
- Pedestrians involved in fatal accidents4
- Fatal car crash and road traffic accident statistics for 2020
- Fatal accident count14
- Vehicles involved in fatal accidents18
- Fatal accidents involving drunk persons3
- Fatalities15
- Persons involved in fatal accidents19
- Pedestrians involved in fatal accidents7
- Fatal car crash and road traffic accident statistics for 2019
- Fatal accident count8
- Vehicles involved in fatal accidents17
- Fatal accidents involving drunk persons3
- Fatalities9
- Persons involved in fatal accidents22
- Pedestrians involved in fatal accidents4
- Fatal car crash and road traffic accident statistics for 2018
- Fatal accident count11
- Vehicles involved in fatal accidents16
- Fatal accidents involving drunk persons5
- Fatalities15
- Persons involved in fatal accidents21
- Pedestrians involved in fatal accidents4
Data:
Latest news about accidents in Vancouver, WA collected exclusively by city-data.com from local newspapers, TV, and radio stations
No street view available for this location
Vancouver fatal accident statistics for 1998 - 2021
Average EMS response time
- Vancouver(Based on 173 reports) 5.2 mins
- Clark County(Based on 766 reports) 6.2 mins
- Washington(Based on 17,122 reports) 8.2 mins
Average hospital transport time
- Vancouver(Based on 65 reports) 56.8 mins
- Clark County(Based on 351 reports) 57.6 mins
- Washington(Based on 8,762 reports) 49.2 mins
Dark - Lighted
- Vancouver(Based on 300 reports) 46.3%
- Clark County(Based on 1,230 reports) 19.3%
- Washington(Based on 27,943 reports) 18.4%
Daylight
- Vancouver(Based on 300 reports) 37.7%
- Clark County(Based on 1,230 reports) 43.6%
- Washington(Based on 27,943 reports) 45.6%
Dark - Not Lighted
- Vancouver(Based on 300 reports) 11.7%
- Clark County(Based on 1,230 reports) 33.0%
- Washington(Based on 27,943 reports) 31.6%
Dusk
- Vancouver(Based on 300 reports) 2.3%
- Clark County(Based on 1,230 reports) 2.2%
- Washington(Based on 27,943 reports) 2.1%
Dark - Unknown Lighting
- Vancouver(Based on 300 reports) 1.0%
- Clark County(Based on 1,230 reports) 0.6%
- Washington(Based on 27,943 reports) 0.7%
Dawn
- Vancouver(Based on 300 reports) 1.0%
- Clark County(Based on 1,230 reports) 1.3%
- Washington(Based on 27,943 reports) 1.5%
Clear
- Vancouver(Based on 299 reports) 74.6%
- Clark County(Based on 1,227 reports) 78.3%
- Washington(Based on 27,933 reports) 80.2%
Rain
- Vancouver(Based on 299 reports) 17.7%
- Clark County(Based on 1,227 reports) 13.9%
- Washington(Based on 27,933 reports) 12.1%
Unknown
- Vancouver(Based on 299 reports) 5.0%
- Clark County(Based on 1,227 reports) 4.2%
- Washington(Based on 27,933 reports) 3.2%
Fog, Smog, Smoke
- Vancouver(Based on 299 reports) 2.0%
- Clark County(Based on 1,227 reports) 2.5%
- Washington(Based on 27,933 reports) 1.9%
Snow
- Vancouver(Based on 299 reports) 0.7%
- Clark County(Based on 1,227 reports) 0.6%
- Washington(Based on 27,933 reports) 1.5%

Vancouver fatal car crash and road traffic accident list for 2021
- Fatal accident count8
- Vehicles involved in fatal accidents12
- Fatalities9
- Persons involved in fatal accidents20
- Pedestrians involved in fatal accidents4
Dark - Lighted
- Vancouver(Based on 8 reports) 50.0%
- Clark County(Based on 31 reports) 25.8%
- Washington(Based on 593 reports) 23.9%
Daylight
- Vancouver(Based on 8 reports) 37.5%
- Clark County(Based on 31 reports) 48.4%
- Washington(Based on 593 reports) 46.7%
Dark - Not Lighted
- Vancouver(Based on 8 reports) 12.5%
- Clark County(Based on 31 reports) 22.6%
- Washington(Based on 593 reports) 21.9%
Clear
- Vancouver(Based on 8 reports) 87.5%
- Clark County(Based on 31 reports) 58.1%
- Washington(Based on 594 reports) 63.8%
Unknown
- Vancouver(Based on 8 reports) 12.5%
- Clark County(Based on 31 reports) 22.6%
- Washington(Based on 594 reports) 19.4%
| # | Date | Location | Vehicles | Drunk persons | Fatalites | Persons | Pedestrians |
|---|
| 1 | Feb 10, 2021 10:35 PM | I-205 | 1 | - | 1
| 5 | 1 |
| 2 | Mar 7, 2021 09:55 PM | E Mill Plain Blvd | 1 | - | 1
| 1 | - |
| 3 | Jul 9, 2021 11:59 AM | I-205 | 3 | - | 2
| 5 | - |
| 4 | Jul 30, 2021 10:17 PM | Sr-500, Stapleton Rd | 1 | - | 1
| 1 | - |
| 5 | Aug 24, 2021 04:09 PM | Ne Fourth Plain Blvd, Ne Vancouver Mall Dr | 3 | - | 1
| 5 | 1 |
| 6 | Aug 29, 2021 05:07 PM | I-205 Ramp | 1 | - | 1
| 1 | - |
| 7 | Sep 30, 2021 08:50 PM | I-205 | 1 | - | 1
| 1 | 1 |
| 8 | Dec 26, 2021 05:34 PM | Sr-14 | 1 | - | 1
| 1 | 1 |
Vancouver fatal car crash and road traffic accident list for 2020
- Fatal accident count14
- Vehicles involved in fatal accidents18
- Fatal accidents involving drunk persons3
- Fatalities15
- Persons involved in fatal accidents19
- Pedestrians involved in fatal accidents7
Daylight
- Vancouver(Based on 14 reports) 42.9%
- Clark County(Based on 35 reports) 51.4%
- Washington(Based on 522 reports) 46.4%
Dark - Lighted
- Vancouver(Based on 14 reports) 35.7%
- Clark County(Based on 35 reports) 22.9%
- Washington(Based on 522 reports) 22.4%
Dusk
- Vancouver(Based on 14 reports) 14.3%
- Clark County(Based on 35 reports) 8.6%
- Washington(Based on 522 reports) 3.8%
Dark - Not Lighted
- Vancouver(Based on 14 reports) 7.1%
- Clark County(Based on 35 reports) 17.1%
- Washington(Based on 522 reports) 24.7%
Clear
- Vancouver(Based on 14 reports) 78.6%
- Clark County(Based on 35 reports) 65.7%
- Washington(Based on 524 reports) 69.1%
Unknown
- Vancouver(Based on 14 reports) 14.3%
- Clark County(Based on 35 reports) 14.3%
- Washington(Based on 524 reports) 14.9%
Rain
- Vancouver(Based on 14 reports) 7.1%
- Clark County(Based on 35 reports) 17.1%
- Washington(Based on 524 reports) 11.5%
| # | Date | Location | Vehicles | Drunk persons | Fatalites | Persons | Pedestrians |
|---|
| 1 | Jan 21, 2020 06:29 AM | Ne 112th Ave | 1 | - | 2
| 1 | 2 |
| 2 | Mar 7, 2020 03:46 PM | Ne 49th St, Ne 137th Ave | 2 | - | 1
| 2 | - |
| 3 | Mar 12, 2020 05:19 AM | Ne Andresen Rd | 1 | - | 1
| 1 | 1 |
| 4 | Mar 15, 2020 09:56 PM | E Fourth Plain Blvd, Fort Vancouver Way | 1 | 1
| 1 | 1 | 1 |
| 5 | Feb 2, 2020 02:47 PM | Se 164th Ave, Se Mill Plain Blvd | 2 | - | 1
| 2 | - |
| 6 | Mar 20, 2020 05:59 AM | Ne 78th St | 1 | - | 1
| 1 | 1 |
| 7 | Apr 18, 2020 00:20 AM | E Mill Plain Blvd | 1 | 1
| 1 | 1 | - |
| 8 | Apr 24, 2020 07:32 PM | Se 164th Ave, Se 5th St | 1 | - | 1
| 2 | - |
| 9 | Aug 8, 2020 08:25 PM | Sr-501 | 1 | 1
| 1 | 1 | - |
| 10 | Aug 5, 2020 06:57 AM | I-5 | 3 | - | 1
| 3 | - |
| 11 | Sep 2, 2020 06:42 PM | E Mill Plain Blvd, Grand Blvd | 1 | - | 1
| 1 | 1 |
| 12 | Oct 12, 2020 10:41 PM | Sr-500 | 1 | - | 1
| 1 | 1 |
| 13 | Nov 13, 2020 03:37 PM | I-205 | 1 | - | 1
| 1 | - |
| 14 | Jul 5, 2020 05:47 PM | Se 192nd Ave | 1 | - | 1
| 1 | - |
Vancouver fatal car crash and road traffic accident list for 2019
- Fatal accident count8
- Vehicles involved in fatal accidents17
- Fatal accidents involving drunk persons3
- Fatalities9
- Persons involved in fatal accidents22
- Pedestrians involved in fatal accidents4
Daylight
- Vancouver(Based on 7 reports) 42.9%
- Clark County(Based on 23 reports) 56.5%
- Washington(Based on 488 reports) 45.3%
Dark - Lighted
- Vancouver(Based on 7 reports) 42.9%
- Clark County(Based on 23 reports) 17.4%
- Washington(Based on 488 reports) 21.7%
Dark - Not Lighted
- Vancouver(Based on 7 reports) 14.3%
- Clark County(Based on 23 reports) 21.7%
- Washington(Based on 488 reports) 27.7%
Clear
- Vancouver(Based on 7 reports) 85.7%
- Clark County(Based on 23 reports) 69.6%
- Washington(Based on 487 reports) 67.8%
Unknown
- Vancouver(Based on 7 reports) 14.3%
- Clark County(Based on 23 reports) 26.1%
- Washington(Based on 487 reports) 15.6%
| # | Date | Location | Vehicles | Drunk persons | Fatalites | Persons | Pedestrians |
|---|
| 1 | Jan 9, 2019 07:49 AM | Ne 136th Ave | 3 | - | 1
| 3 | - |
| 2 | Jul 26, 2019 11:44 PM | Ne 18th St, Ne 187th Ave | 3 | 2
| 2 | 4 | - |
| 3 | Aug 2, 2019 01:55 PM | I-205 Ramp Lx03111, Fourth Plain Blvd | 5 | - | 1
| 6 | - |
| 4 | Jun 24, 2019 09:31 PM | W Fourth Plain Blvd, Roosevelt Ave | 1 | 1
| 1 | 1 | 1 |
| 5 | Sep 1, 2019 05:17 PM | Se 164th Ave, Se 12th St | 2 | - | 1
| 3 | - |
| 6 | Oct 15, 2019 08:21 PM | Se Mill Plain Blvd, Se Chkalov Dr | 1 | - | 1
| 2 | 1 |
| 7 | Nov 3, 2019 08:03 PM | I-5 | 1 | - | 1
| 1 | 1 |
| 8 | Nov 9, 2019 01:42 AM | Sr-14 | 1 | - | 1
| 2 | 1 |
Vancouver fatal car crash and road traffic accident list for 2018
- Fatal accident count11
- Vehicles involved in fatal accidents16
- Fatal accidents involving drunk persons5
- Fatalities15
- Persons involved in fatal accidents21
- Pedestrians involved in fatal accidents4
Average EMS response time
- Vancouver(Based on 4 reports) 3.8 mins
- Clark County(Based on 11 reports) 6.9 mins
- Washington(Based on 158 reports) 13.5 mins
Dark - Lighted
- Vancouver(Based on 11 reports) 54.5%
- Clark County(Based on 28 reports) 25.0%
- Washington(Based on 483 reports) 23.4%
Daylight
- Vancouver(Based on 11 reports) 45.5%
- Clark County(Based on 28 reports) 53.6%
- Washington(Based on 483 reports) 45.3%
Clear
- Vancouver(Based on 11 reports) 63.6%
- Clark County(Based on 28 reports) 67.9%
- Washington(Based on 482 reports) 71.0%
Unknown
- Vancouver(Based on 11 reports) 27.3%
- Clark County(Based on 28 reports) 17.9%
- Washington(Based on 482 reports) 10.0%
Rain
- Vancouver(Based on 11 reports) 9.1%
- Clark County(Based on 28 reports) 3.6%
- Washington(Based on 482 reports) 12.7%
| # | Date | Location | Vehicles | Drunk persons | Fatalites | Persons | Pedestrians |
|---|
| 1 | Feb 10, 2018 04:25 PM | Se 7th St | 2 | - | 1
| 1 | - |
| 2 | Feb 11, 2018 01:17 AM | Sr-14 | 3 | 2
| 3 | 5 | - |
| 3 | May 21, 2018 08:24 PM | Ne Fourth Plain Blvd | 1 | - | 1
| 1 | - |
| 4 | May 11, 2018 10:19 PM | E Evergreen Blvd | 1 | 1
| 3 | 4 | - |
| 5 | Jun 7, 2018 12:24 AM | I-205 Ramp S502801 | 3 | - | 1
| 3 | - |
| 6 | May 10, 2018 09:10 PM | Sr-14 | 1 | - | 1
| 2 | 1 |
| 7 | Jun 22, 2018 03:01 AM | Ne Burton Rd, Ne 81st Ave | 1 | - | 1
| 1 | - |
| 8 | Sep 12, 2018 12:55 AM | N Andresen Rd | 1 | - | 1
| 1 | 1 |
| 9 | Sep 30, 2018 03:57 PM | E Mill Plain Blvd, N Morrison Rd | 1 | - | 1
| 1 | 1 |
| 10 | Oct 14, 2018 09:18 PM | I-5 | 1 | 1
| 1 | 1 | - |
| 11 | Nov 21, 2018 10:39 PM | Ne 28th St, Ne 132nd Ave | 1 | 1
| 1 | 1 | 1 |
Vancouver fatal car crash and road traffic accident list for 2017
- Fatal accident count10
- Vehicles involved in fatal accidents13
- Fatal accidents involving drunk persons3
- Fatalities10
- Persons involved in fatal accidents15
- Pedestrians involved in fatal accidents5
Dark - Lighted
- Vancouver(Based on 10 reports) 80.0%
- Clark County(Based on 28 reports) 35.7%
- Washington(Based on 530 reports) 22.6%
Daylight
- Vancouver(Based on 10 reports) 20.0%
- Clark County(Based on 28 reports) 25.0%
- Washington(Based on 530 reports) 46.8%
Clear
- Vancouver(Based on 9 reports) 55.6%
- Clark County(Based on 26 reports) 65.4%
- Washington(Based on 493 reports) 66.5%
Rain
- Vancouver(Based on 9 reports) 22.2%
- Clark County(Based on 26 reports) 11.5%
- Washington(Based on 493 reports) 12.4%
Snow
- Vancouver(Based on 9 reports) 11.1%
- Clark County(Based on 26 reports) 3.8%
- Washington(Based on 493 reports) 2.4%
Unknown
- Vancouver(Based on 9 reports) 11.1%
- Clark County(Based on 26 reports) 19.2%
- Washington(Based on 493 reports) 15.2%
| # | Date | Location | Vehicles | Drunk persons | Fatalites | Persons | Pedestrians |
|---|
| 1 | Jan 11, 2017 05:00 PM | Se 10th St, Se Nancy Rd | 1 | - | 1
| 1 | 2 |
| 2 | May 14, 2017 02:40 AM | Sr-14 | 1 | 1
| 1 | 1 | - |
| 3 | May 23, 2017 11:57 PM | Se Mill Plain Blvd, Se Park Crest Blvd | 1 | - | 1
| 1 | 1 |
| 4 | Jul 9, 2017 01:38 AM | E Fourth Plain St | 1 | - | 1
| 1 | 1 |
| 5 | Jul 25, 2017 03:17 PM | I-205 | 4 | - | 1
| 5 | - |
| 6 | Aug 15, 2017 02:01 AM | I-5 Ramp P500039 | 1 | 1
| 1 | 1 | - |
| 7 | Sep 20, 2017 06:41 PM | Se 164th Ave, Se 4th St | 1 | - | 1
| 2 | - |
| 8 | Nov 18, 2017 02:02 AM | Sr-501, St Francis Lane | 1 | 1
| 1 | 1 | - |
| 9 | Nov 3, 2017 09:39 PM | Main St, E 37th St | 1 | - | 1
| 1 | 1 |
| 10 | Dec 24, 2017 02:48 AM | I-205 | 1 | - | 1
| 1 | - |
Vancouver fatal car crash and road traffic accident list for 2016
- Fatal accident count7
- Vehicles involved in fatal accidents9
- Fatal accidents involving drunk persons4
- Fatalities7
- Persons involved in fatal accidents10
- Pedestrians involved in fatal accidents3
Average EMS response time
- Vancouver(Based on 2 reports) 4.0 mins
- Clark County(Based on 2 reports) 4.0 mins
- Washington(Based on 110 reports) 19.3 mins
Average hospital transport time
- Vancouver(Based on 2 reports) 16.0 mins
- Clark County(Based on 2 reports) 16.0 mins
- Washington(Based on 78 reports) 51.0 mins
Dark - Lighted
- Vancouver(Based on 7 reports) 57.1%
- Clark County(Based on 20 reports) 30.0%
- Washington(Based on 500 reports) 22.6%
Daylight
- Vancouver(Based on 7 reports) 28.6%
- Clark County(Based on 20 reports) 40.0%
- Washington(Based on 500 reports) 50.4%
Dawn
- Vancouver(Based on 7 reports) 14.3%
- Clark County(Based on 20 reports) 5.0%
- Washington(Based on 500 reports) 1.8%
Clear
- Vancouver(Based on 7 reports) 85.7%
- Clark County(Based on 19 reports) 68.4%
- Washington(Based on 489 reports) 68.5%
Unknown
- Vancouver(Based on 7 reports) 14.3%
- Clark County(Based on 19 reports) 21.1%
- Washington(Based on 489 reports) 16.2%
Vancouver fatal car crash and road traffic accident list for 2015
- Fatal accident count8
- Vehicles involved in fatal accidents16
- Fatal accidents involving drunk persons4
- Fatalities10
- Persons involved in fatal accidents27
- Pedestrians involved in fatal accidents1
Average EMS response time
- Vancouver(Based on 5 reports) 3.4 mins
- Clark County(Based on 10 reports) 5.5 mins
- Washington(Based on 148 reports) 13.7 mins
Average hospital transport time
- Vancouver(Based on 5 reports) 27.4 mins
- Clark County(Based on 10 reports) 38.3 mins
- Washington(Based on 115 reports) 40.1 mins
Daylight
- Vancouver(Based on 8 reports) 37.5%
- Clark County(Based on 21 reports) 47.6%
- Washington(Based on 496 reports) 51.4%
Dark - Not Lighted
- Vancouver(Based on 8 reports) 25.0%
- Clark County(Based on 21 reports) 33.3%
- Washington(Based on 496 reports) 24.2%
Dark - Lighted
- Vancouver(Based on 8 reports) 25.0%
- Clark County(Based on 21 reports) 14.3%
- Washington(Based on 496 reports) 19.2%
Dusk
- Vancouver(Based on 8 reports) 12.5%
- Clark County(Based on 21 reports) 4.8%
- Washington(Based on 496 reports) 3.0%
Clear
- Vancouver(Based on 8 reports) 87.5%
- Clark County(Based on 21 reports) 66.7%
- Washington(Based on 493 reports) 70.4%
Rain
- Vancouver(Based on 8 reports) 12.5%
- Clark County(Based on 21 reports) 19.0%
- Washington(Based on 493 reports) 12.6%
| # | Date | Location | Vehicles | Drunk persons | Fatalites | Persons | Pedestrians |
|---|
| 1 | Mar 7, 2015 11:59 PM | I-205, Sr-500 | 1 | 1
| 1 | 1 | - |
| 2 | Mar 31, 2015 09:35 AM | W Forth Plain Bl, Kauffman | 1 | - | 1
| 1 | - |
| 3 | Jun 12, 2015 02:49 AM | Sr-500 | 2 | 1
| 2 | 3 | - |
| 4 | Jun 14, 2015 07:45 PM | Ne 18th St, Ne 146th Ave | 2 | 1
| 1 | 3 | - |
| 5 | Aug 5, 2015 10:53 AM | Se 164th Ave, Se Mill Plain Rd | 4 | - | 2
| 9 | - |
| 6 | Oct 16, 2015 01:16 AM | Sr-14, Sb-205 | 1 | 1
| 1 | 1 | - |
| 7 | Nov 3, 2015 05:05 PM | Sr-500 | 4 | - | 1
| 8 | - |
| 8 | Dec 5, 2015 11:46 PM | N Blanford Dr | 1 | - | 1
| 1 | 1 |
Vancouver fatal car crash and road traffic accident list for 2014
- Fatal accident count8
- Vehicles involved in fatal accidents11
- Fatal accidents involving drunk persons5
- Fatalities10
- Persons involved in fatal accidents25
- Pedestrians involved in fatal accidents9
Dark - Lighted
- Vancouver(Based on 8 reports) 50.0%
- Clark County(Based on 32 reports) 28.1%
- Washington(Based on 425 reports) 22.4%
Daylight
- Vancouver(Based on 8 reports) 25.0%
- Clark County(Based on 32 reports) 46.9%
- Washington(Based on 425 reports) 50.1%
Dark - Not Lighted
- Vancouver(Based on 8 reports) 25.0%
- Clark County(Based on 32 reports) 25.0%
- Washington(Based on 425 reports) 24.5%
Clear
- Vancouver(Based on 8 reports) 50.0%
- Clark County(Based on 32 reports) 78.1%
- Washington(Based on 422 reports) 69.7%
Unknown
- Vancouver(Based on 8 reports) 37.5%
- Clark County(Based on 32 reports) 9.4%
- Washington(Based on 422 reports) 14.7%
Rain
- Vancouver(Based on 8 reports) 12.5%
- Clark County(Based on 32 reports) 6.3%
- Washington(Based on 422 reports) 9.7%
| # | Date | Location | Vehicles | Drunk persons | Fatalites | Persons | Pedestrians |
|---|
| 1 | Jan 19, 2014 08:00 PM | Ne Vancouver Mall Dr, Ne 72nd Ave | 1 | - | 2
| 1 | 3 |
| 2 | Mar 26, 2014 00:09 AM | Se Columbia Way | 1 | 1
| 1 | 1 | - |
| 3 | Apr 26, 2014 04:09 PM | 4th Plain Blvd, Ne 62nd Ave | 3 | - | 1
| 5 | - |
| 4 | Aug 16, 2014 03:04 AM | I-205 | 1 | 1
| 1 | 6 | - |
| 5 | Oct 31, 2014 09:45 PM | Ne 136th Ave, Ne 4th St | 1 | 1
| 2 | 2 | - |
| 6 | Oct 31, 2014 08:12 PM | Ne 112th Ave | 1 | 1
| 1 | 1 | 4 |
| 7 | Dec 7, 2014 05:55 AM | I-205 | 2 | - | 1
| 8 | 1 |
| 8 | Dec 8, 2014 11:10 AM | Ne Andersen Rd | 1 | 1
| 1 | 1 | 1 |
Vancouver fatal car crash and road traffic accident list for 2013
- Fatal accident count9
- Vehicles involved in fatal accidents12
- Fatal accidents involving drunk persons6
- Fatalities11
- Persons involved in fatal accidents21
- Pedestrians involved in fatal accidents1
Dark - Lighted
- Vancouver(Based on 9 reports) 77.8%
- Clark County(Based on 18 reports) 38.9%
- Washington(Based on 397 reports) 22.7%
Daylight
- Vancouver(Based on 9 reports) 11.1%
- Clark County(Based on 18 reports) 33.3%
- Washington(Based on 397 reports) 47.9%
Dark - Not Lighted
- Vancouver(Based on 9 reports) 11.1%
- Clark County(Based on 18 reports) 22.2%
- Washington(Based on 397 reports) 24.9%
Clear
- Vancouver(Based on 9 reports) 55.6%
- Clark County(Based on 18 reports) 61.1%
- Washington(Based on 396 reports) 64.4%
Rain
- Vancouver(Based on 9 reports) 22.2%
- Clark County(Based on 18 reports) 16.7%
- Washington(Based on 396 reports) 8.6%
Fog, Smog, Smoke
- Vancouver(Based on 9 reports) 11.1%
- Clark County(Based on 18 reports) 11.1%
- Washington(Based on 396 reports) 4.0%
Unknown
- Vancouver(Based on 9 reports) 11.1%
- Clark County(Based on 18 reports) 11.1%
- Washington(Based on 396 reports) 22.2%
| # | Date | Location | Vehicles | Drunk persons | Fatalites | Persons | Pedestrians |
|---|
| 1 | Jan 24, 2013 05:06 AM | Sr-14 | 1 | 1
| 1 | 1 | - |
| 2 | Apr 11, 2013 10:05 PM | P St, E 33rd St | 3 | 1
| 1 | 5 | - |
| 3 | Apr 27, 2013 01:55 AM | Se Mcgillivray Blvd | 1 | 1
| 2 | 2 | - |
| 4 | May 6, 2013 01:41 AM | Se Mill Creek Blvd, Se123rd Ave | 1 | 1
| 1 | 2 | - |
| 5 | May 26, 2013 01:37 AM | E Mill Plain Blvd | 1 | 1
| 1 | 1 | - |
| 6 | Jun 6, 2013 07:44 AM | Mcloughlin Blvd Ne | 2 | - | 1
| 3 | - |
| 7 | Sep 29, 2013 08:39 PM | Sr-14 | 1 | - | 1
| 2 | - |
| 8 | Oct 28, 2013 07:07 PM | Mill Plain Blvd | 1 | - | 1
| 1 | 1 |
| 9 | Nov 17, 2013 08:42 PM | Se Columbia Way | 1 | 1
| 2 | 4 | - |
Vancouver fatal car crash and road traffic accident list for 2012
- Fatal accident count8
- Vehicles involved in fatal accidents10
- Fatal accidents involving drunk persons4
- Fatalities8
- Persons involved in fatal accidents19
- Pedestrians involved in fatal accidents4
Average EMS response time
- Vancouver(Based on 6 reports) 6.2 mins
- Clark County(Based on 13 reports) 6.0 mins
- Washington(Based on 155 reports) 8.0 mins
Daylight
- Vancouver(Based on 8 reports) 50.0%
- Clark County(Based on 19 reports) 47.4%
- Washington(Based on 398 reports) 48.2%
Dark - Not Lighted
- Vancouver(Based on 8 reports) 25.0%
- Clark County(Based on 19 reports) 36.8%
- Washington(Based on 398 reports) 29.1%
Dark - Lighted
- Vancouver(Based on 8 reports) 25.0%
- Clark County(Based on 19 reports) 15.8%
- Washington(Based on 398 reports) 17.8%
Clear
- Vancouver(Based on 8 reports) 87.5%
- Clark County(Based on 19 reports) 57.9%
- Washington(Based on 399 reports) 66.9%
Unknown
- Vancouver(Based on 8 reports) 12.5%
- Clark County(Based on 19 reports) 26.3%
- Washington(Based on 399 reports) 15.0%
| # | Date | Location | Vehicles | Drunk persons | Fatalites | Persons | Pedestrians |
|---|
| 1 | Jun 6, 2012 11:36 PM | I-205 | 1 | 1
| 1 | 1 | - |
| 2 | Apr 28, 2012 01:42 PM | E 27th St, Main St | 1 | - | 1
| 1 | 1 |
| 3 | May 3, 2012 07:18 PM | E 4th Plain Rd, Neals Ln | 1 | 1
| 1 | 2 | 1 |
| 4 | Jul 9, 2012 04:23 PM | Se 136th Ave | 2 | - | 1
| 2 | - |
| 5 | Aug 5, 2012 09:25 PM | Nw Lower River Rd | 2 | 1
| 1 | 10 | - |
| 6 | Aug 23, 2012 07:06 PM | W 8th St | 1 | - | 1
| 1 | 1 |
| 7 | Sep 1, 2012 02:50 AM | Sr-14 | 1 | 1
| 1 | 1 | - |
| 8 | Dec 17, 2012 05:50 PM | Mill Plain Blvd | 1 | - | 1
| 1 | 1 |
Vancouver fatal car crash and road traffic accident list for 2011
- Fatal accident count6
- Vehicles involved in fatal accidents8
- Fatal accidents involving drunk persons2
- Fatalities6
- Persons involved in fatal accidents9
- Pedestrians involved in fatal accidents5
Average EMS response time
- Vancouver(Based on 5 reports) 4.4 mins
- Clark County(Based on 11 reports) 5.0 mins
- Washington(Based on 312 reports) 8.1 mins
Dark - Lighted
- Vancouver(Based on 6 reports) 50.0%
- Clark County(Based on 16 reports) 25.0%
- Washington(Based on 423 reports) 17.7%
Dark - Not Lighted
- Vancouver(Based on 6 reports) 33.3%
- Clark County(Based on 16 reports) 25.0%
- Washington(Based on 423 reports) 30.5%
Daylight
- Vancouver(Based on 6 reports) 16.7%
- Clark County(Based on 16 reports) 43.8%
- Washington(Based on 423 reports) 48.2%
Clear
- Vancouver(Based on 6 reports) 83.3%
- Clark County(Based on 16 reports) 81.3%
- Washington(Based on 421 reports) 72.2%
Rain
- Vancouver(Based on 6 reports) 16.7%
- Clark County(Based on 16 reports) 6.3%
- Washington(Based on 421 reports) 7.1%
Vancouver fatal car crash and road traffic accident list for 2010
- Fatal accident count10
- Vehicles involved in fatal accidents12
- Fatal accidents involving drunk persons2
- Fatalities10
- Persons involved in fatal accidents16
- Pedestrians involved in fatal accidents3
Average EMS response time
- Vancouver(Based on 10 reports) 4.8 mins
- Clark County(Based on 21 reports) 8.0 mins
- Washington(Based on 398 reports) 8.8 mins
Daylight
- Vancouver(Based on 10 reports) 60.0%
- Clark County(Based on 22 reports) 45.5%
- Washington(Based on 420 reports) 47.1%
Dark - Lighted
- Vancouver(Based on 10 reports) 30.0%
- Clark County(Based on 22 reports) 18.2%
- Washington(Based on 420 reports) 21.7%
Dawn
- Vancouver(Based on 10 reports) 10.0%
- Clark County(Based on 22 reports) 4.5%
- Washington(Based on 420 reports) 1.2%
Clear
- Vancouver(Based on 10 reports) 80.0%
- Clark County(Based on 22 reports) 72.7%
- Washington(Based on 418 reports) 63.2%
Fog, Smog, Smoke
- Vancouver(Based on 10 reports) 10.0%
- Clark County(Based on 22 reports) 4.5%
- Washington(Based on 418 reports) 2.4%
Unknown
- Vancouver(Based on 10 reports) 10.0%
- Clark County(Based on 22 reports) 18.2%
- Washington(Based on 418 reports) 20.1%
| # | Date | Location | Vehicles | Drunk persons | Fatalites | Persons | Pedestrians |
|---|
| 1 | Jan 9, 2010 04:37 PM | Sr-14 | 3 | 1
| 1 | 4 | - |
| 2 | Feb 5, 2010 06:10 PM | Sr-503 | 1 | - | 1
| 1 | - |
| 3 | Mar 13, 2010 02:05 PM | Ne 15th Ave, Ne Ross St | 1 | - | 1
| 1 | - |
| 4 | May 31, 2010 08:45 PM | C St | 1 | - | 1
| 1 | - |
| 5 | Aug 4, 2010 07:12 PM | I-5 | 1 | - | 1
| 1 | 1 |
| 6 | Sep 28, 2010 04:17 PM | Se French Rd | 1 | - | 1
| 3 | - |
| 7 | Oct 13, 2010 02:06 AM | Sr-500, Ne 54th Ave | 1 | - | 1
| 2 | - |
| 8 | Oct 17, 2010 06:00 AM | Se 1st St | 1 | 1
| 1 | 1 | - |
| 9 | Dec 10, 2010 05:33 PM | Jefferson St, W 12th St | 1 | - | 1
| 1 | 1 |
| 10 | Sep 15, 2010 03:20 PM | Ne 59th St | 1 | - | 1
| 1 | 1 |
Vancouver fatal car crash and road traffic accident list for 2009
- Fatal accident count4
- Vehicles involved in fatal accidents5
- Fatal accidents involving drunk persons2
- Fatalities4
- Persons involved in fatal accidents9
- Pedestrians involved in fatal accidents1
Average EMS response time
- Vancouver(Based on 4 reports) 5.8 mins
- Clark County(Based on 13 reports) 8.5 mins
- Washington(Based on 367 reports) 8.7 mins
Dark - Lighted
- Vancouver(Based on 4 reports) 75.0%
- Clark County(Based on 13 reports) 38.5%
- Washington(Based on 453 reports) 21.2%
Daylight
- Vancouver(Based on 4 reports) 25.0%
- Clark County(Based on 13 reports) 7.7%
- Washington(Based on 453 reports) 44.8%
Clear
- Vancouver(Based on 4 reports) 100.0%
- Clark County(Based on 13 reports) 69.2%
- Washington(Based on 453 reports) 85.2%
Vancouver fatal car crash and road traffic accident list for 2008
| # | Date | Location | Vehicles | Drunk persons | Fatalites | Persons | Pedestrians |
|---|
| 1 | Aug 7, 2008 01:38 AM | I-5 | 1 | 1
| 1 | 3 | 1 |
| 2 | Sep 5, 2008 01:42 AM | Se 121st Ave | 2 | 1
| 1 | 1 | - |
Vancouver fatal car crash and road traffic accident list for 2007
- Fatal accident count11
- Vehicles involved in fatal accidents16
- Fatal accidents involving drunk persons3
- Fatalities12
- Persons involved in fatal accidents31
- Pedestrians involved in fatal accidents5
Average EMS response time
- Vancouver(Based on 7 reports) 4.1 mins
- Clark County(Based on 19 reports) 5.4 mins
- Washington(Based on 417 reports) 8.8 mins
Average hospital transport time
- Vancouver(Based on 3 reports) 192.0 mins
- Clark County(Based on 6 reports) 119.8 mins
- Washington(Based on 196 reports) 60.7 mins
Daylight
- Vancouver(Based on 11 reports) 36.4%
- Clark County(Based on 28 reports) 50.0%
- Washington(Based on 529 reports) 50.3%
Dark - Lighted
- Vancouver(Based on 11 reports) 36.4%
- Clark County(Based on 28 reports) 17.9%
- Washington(Based on 529 reports) 18.3%
Dusk
- Vancouver(Based on 11 reports) 18.2%
- Clark County(Based on 28 reports) 10.7%
- Washington(Based on 529 reports) 3.2%
Dark - Not Lighted
- Vancouver(Based on 11 reports) 9.1%
- Clark County(Based on 28 reports) 21.4%
- Washington(Based on 529 reports) 26.8%
Clear
- Vancouver(Based on 11 reports) 81.8%
- Clark County(Based on 28 reports) 82.1%
- Washington(Based on 531 reports) 86.6%
Rain
- Vancouver(Based on 11 reports) 18.2%
- Clark County(Based on 28 reports) 14.3%
- Washington(Based on 531 reports) 9.6%
| # | Date | Location | Vehicles | Drunk persons | Fatalites | Persons | Pedestrians |
|---|
| 1 | Jan 28, 2007 05:56 PM | Se Mill Plain Blvd | 1 | - | 1
| 3 | 1 |
| 2 | Apr 1, 2007 11:29 AM | Se 188th Avenue, Se 11th Way | 1 | - | 1
| 2 | 1 |
| 3 | Apr 4, 2007 07:25 PM | Ne Ward Rd, Ne Davis Rd | 1 | 1
| 1 | 1 | - |
| 4 | Apr 18, 2007 11:20 AM | Ne St Johns Rd, Ne 49th St | 2 | - | 1
| 3 | - |
| 5 | Apr 29, 2007 02:56 AM | Sr-14 | 2 | 1
| 2 | 3 | - |
| 6 | Jun 1, 2007 07:26 PM | Se 136th Ave | 1 | - | 1
| 3 | 1 |
| 7 | Jun 27, 2007 08:29 PM | I-5 | 3 | - | 1
| 6 | - |
| 8 | Sep 1, 2007 07:09 PM | Andersen Rd, E Evergreen Blv | 2 | - | 1
| 2 | - |
| 9 | Oct 17, 2007 01:39 AM | Chkalov Dr | 1 | 1
| 1 | 1 | - |
| 10 | Dec 13, 2007 05:42 PM | Se Mill Plain Blvd, Lieser Road | 1 | - | 1
| 3 | 1 |
| 11 | Dec 29, 2007 08:58 PM | Mc Gillivray Blvd, Se 136th Ave | 1 | - | 1
| 4 | 1 |
Vancouver fatal car crash and road traffic accident list for 2006
| # | Date | Location | Vehicles | Drunk persons | Fatalites | Persons | Pedestrians |
|---|
| 1 | Feb 7, 2006 04:50 PM | Ne Andresen Rd | 1 | - | 1
| 2 | 1 |
| 2 | Sep 3, 2006 02:44 AM | I-205 | 1 | - | 1
| 6 | - |
Vancouver fatal car crash and road traffic accident list for 2005
- Fatal accident count4
- Vehicles involved in fatal accidents6
- Fatal accidents involving drunk persons4
- Fatalities5
- Persons involved in fatal accidents10
- Pedestrians involved in fatal accidents1
Average EMS response time
- Vancouver(Based on 3 reports) 6.0 mins
- Clark County(Based on 16 reports) 5.4 mins
- Washington(Based on 355 reports) 7.9 mins
Dark - Lighted
- Vancouver(Based on 4 reports) 50.0%
- Clark County(Based on 30 reports) 16.7%
- Washington(Based on 579 reports) 16.2%
Daylight
- Vancouver(Based on 4 reports) 25.0%
- Clark County(Based on 30 reports) 40.0%
- Washington(Based on 579 reports) 49.9%
Dark - Not Lighted
- Vancouver(Based on 4 reports) 25.0%
- Clark County(Based on 30 reports) 36.7%
- Washington(Based on 579 reports) 29.4%
Clear
- Vancouver(Based on 4 reports) 100.0%
- Clark County(Based on 30 reports) 86.7%
- Washington(Based on 580 reports) 84.1%
| # | Date | Location | Vehicles | Drunk persons | Fatalites | Persons | Pedestrians |
|---|
| 1 | Jan 22, 2005 00:47 AM | Ne 119th St | 2 | 2
| 2 | 4 | - |
| 2 | Jun 3, 2005 04:05 AM | Ne Burton Rd | 2 | 1
| 1 | 3 | - |
| 3 | Aug 3, 2005 04:38 PM | Anderson Rd | 1 | 1
| 1 | 2 | 1 |
| 4 | Oct 19, 2005 00:14 AM | Mill Plain Blvd | 1 | - | 1
| 1 | - |
Vancouver fatal car crash and road traffic accident list for 2004
- Fatal accident count6
- Vehicles involved in fatal accidents11
- Fatal accidents involving drunk persons3
- Fatalities6
- Persons involved in fatal accidents15
- Pedestrians involved in fatal accidents1
Average EMS response time
- Vancouver(Based on 4 reports) 7.3 mins
- Clark County(Based on 12 reports) 6.3 mins
- Washington(Based on 416 reports) 9.3 mins
Average hospital transport time
- Vancouver(Based on 2 reports) 54.5 mins
- Clark County(Based on 7 reports) 81.7 mins
- Washington(Based on 281 reports) 55.4 mins
Daylight
- Vancouver(Based on 6 reports) 50.0%
- Clark County(Based on 15 reports) 40.0%
- Washington(Based on 506 reports) 50.2%
Dark - Lighted
- Vancouver(Based on 6 reports) 50.0%
- Clark County(Based on 15 reports) 40.0%
- Washington(Based on 506 reports) 15.0%
Clear
- Vancouver(Based on 6 reports) 83.3%
- Clark County(Based on 15 reports) 86.7%
- Washington(Based on 509 reports) 86.8%
Rain
- Vancouver(Based on 6 reports) 16.7%
- Clark County(Based on 15 reports) 13.3%
- Washington(Based on 509 reports) 9.6%
| # | Date | Location | Vehicles | Drunk persons | Fatalites | Persons | Pedestrians |
|---|
| 1 | Jan 11, 2004 11:10 PM | Sr-14 | 1 | - | 1
| 1 | - |
| 2 | May 24, 2004 06:48 PM | Sr-14, I-205 Ramp | 1 | 1
| 1 | 1 | - |
| 3 | Jul 10, 2004 01:49 AM | Sr-500 | 2 | 1
| 1 | 2 | - |
| 4 | Jul 15, 2004 02:10 PM | I-5 | 1 | - | 1
| 2 | 1 |
| 5 | Aug 27, 2004 10:18 AM | Us-12, State Hwy 14 | 5 | - | 1
| 8 | - |
| 6 | Oct 23, 2004 00:59 AM | Nw Fruit Valley Rd, Nw 78th St | 1 | 1
| 1 | 1 | - |
Vancouver fatal car crash and road traffic accident list for 2003
| # | Date | Location | Vehicles | Drunk persons | Fatalites | Persons | Pedestrians |
|---|
| 1 | May 2, 2003 06:28 PM | Se Evergreen Hwy | 1 | - | 2
| 2 | - |
Vancouver fatal car crash and road traffic accident list for 2002
- Fatal accident count8
- Vehicles involved in fatal accidents14
- Fatal accidents involving drunk persons3
- Fatalities11
- Persons involved in fatal accidents28
- Pedestrians involved in fatal accidents4
Average EMS response time
- Vancouver(Based on 8 reports) 7.1 mins
- Clark County(Based on 33 reports) 6.6 mins
- Washington(Based on 548 reports) 9.3 mins
Average hospital transport time
- Vancouver(Based on 6 reports) 42.5 mins
- Clark County(Based on 20 reports) 66.6 mins
- Washington(Based on 415 reports) 54.2 mins
Daylight
- Vancouver(Based on 8 reports) 50.0%
- Clark County(Based on 33 reports) 51.5%
- Washington(Based on 583 reports) 47.2%
Dark - Not Lighted
- Vancouver(Based on 8 reports) 25.0%
- Clark County(Based on 33 reports) 36.4%
- Washington(Based on 583 reports) 34.5%
Dark - Lighted
- Vancouver(Based on 8 reports) 25.0%
- Clark County(Based on 33 reports) 12.1%
- Washington(Based on 583 reports) 14.8%
Clear
- Vancouver(Based on 8 reports) 87.5%
- Clark County(Based on 33 reports) 90.9%
- Washington(Based on 586 reports) 87.0%
Rain
- Vancouver(Based on 8 reports) 12.5%
- Clark County(Based on 33 reports) 9.1%
- Washington(Based on 586 reports) 8.5%
| # | Date | Location | Vehicles | Drunk persons | Fatalites | Persons | Pedestrians |
|---|
| 1 | Feb 16, 2002 04:53 PM | P Street | 1 | - | 2
| 3 | 2 |
| 2 | Feb 24, 2002 04:00 AM | I-205 | 1 | - | 2
| 2 | - |
| 3 | Feb 25, 2002 07:11 AM | Se Mill Plain Blvd | 1 | - | 1
| 2 | 1 |
| 4 | Jan 19, 2002 00:26 AM | Ne James Rd | 1 | 1
| 2 | 4 | - |
| 5 | Jul 27, 2002 01:13 PM | Nw Fruit Valley Rd | 1 | - | 1
| 2 | 1 |
| 6 | Aug 17, 2002 04:01 AM | Se Mcgillivray Blvd | 1 | 1
| 1 | 2 | - |
| 7 | Aug 29, 2002 04:25 AM | Sr-501 | 1 | 1
| 1 | 3 | - |
| 8 | Jun 26, 2002 01:00 PM | Ne Andersen Rd | 7 | - | 1
| 10 | - |
Vancouver fatal car crash and road traffic accident list for 2001
- Fatal accident count8
- Vehicles involved in fatal accidents9
- Fatal accidents involving drunk persons5
- Fatalities8
- Persons involved in fatal accidents11
- Pedestrians involved in fatal accidents1
Average EMS response time
- Vancouver(Based on 7 reports) 5.7 mins
- Clark County(Based on 19 reports) 6.2 mins
- Washington(Based on 521 reports) 8.4 mins
Average hospital transport time
- Vancouver(Based on 5 reports) 65.4 mins
- Clark County(Based on 15 reports) 65.2 mins
- Washington(Based on 411 reports) 53.4 mins
Dark - Not Lighted
- Vancouver(Based on 8 reports) 50.0%
- Clark County(Based on 22 reports) 27.3%
- Washington(Based on 567 reports) 29.1%
Dark - Lighted
- Vancouver(Based on 8 reports) 37.5%
- Clark County(Based on 22 reports) 18.2%
- Washington(Based on 567 reports) 17.3%
Daylight
- Vancouver(Based on 8 reports) 12.5%
- Clark County(Based on 22 reports) 50.0%
- Washington(Based on 567 reports) 48.3%
Clear
- Vancouver(Based on 8 reports) 50.0%
- Clark County(Based on 22 reports) 68.2%
- Washington(Based on 568 reports) 82.0%
Rain
- Vancouver(Based on 8 reports) 50.0%
- Clark County(Based on 22 reports) 31.8%
- Washington(Based on 568 reports) 13.9%
| # | Date | Location | Vehicles | Drunk persons | Fatalites | Persons | Pedestrians |
|---|
| 1 | Jan 3, 2001 08:30 PM | I-5 | 1 | 1
| 1 | 2 | - |
| 2 | Jan 14, 2001 01:34 AM | I-5 | 1 | 1
| 1 | 1 | - |
| 3 | Jan 28, 2001 09:27 PM | W39thstreet | 1 | 1
| 1 | 1 | - |
| 4 | Mar 13, 2001 10:21 PM | Sr-14 | 2 | 1
| 1 | 2 | - |
| 5 | May 16, 2001 09:37 PM | E4thplainblvd | 1 | 1
| 1 | 2 | 1 |
| 6 | Jul 12, 2001 00:01 AM | I-205 | 1 | - | 1
| 1 | - |
| 7 | Sep 22, 2001 03:50 AM | Emillplainblvd | 1 | - | 1
| 1 | - |
| 8 | Oct 22, 2001 10:30 AM | I-5 | 1 | - | 1
| 1 | - |
Vancouver fatal car crash and road traffic accident list for 2000
- Fatal accident count8
- Vehicles involved in fatal accidents14
- Fatal accidents involving drunk persons3
- Fatalities8
- Persons involved in fatal accidents21
- Pedestrians involved in fatal accidents5
Average EMS response time
- Vancouver(Based on 7 reports) 3.7 mins
- Clark County(Based on 23 reports) 4.3 mins
- Washington(Based on 536 reports) 8.9 mins
Average hospital transport time
- Vancouver(Based on 6 reports) 54.2 mins
- Clark County(Based on 18 reports) 65.2 mins
- Washington(Based on 400 reports) 56.1 mins
Dark - Lighted
- Vancouver(Based on 8 reports) 75.0%
- Clark County(Based on 24 reports) 33.3%
- Washington(Based on 570 reports) 20.5%
Daylight
- Vancouver(Based on 8 reports) 25.0%
- Clark County(Based on 24 reports) 37.5%
- Washington(Based on 570 reports) 47.5%
Clear
- Vancouver(Based on 8 reports) 62.5%
- Clark County(Based on 24 reports) 75.0%
- Washington(Based on 572 reports) 78.8%
Rain
- Vancouver(Based on 8 reports) 37.5%
- Clark County(Based on 24 reports) 20.8%
- Washington(Based on 572 reports) 14.0%
| # | Date | Location | Vehicles | Drunk persons | Fatalites | Persons | Pedestrians |
|---|
| 1 | Feb 23, 2000 09:04 PM | Necampusdr | 1 | - | 1
| 2 | - |
| 2 | Mar 17, 2000 11:16 AM | Nevancouvermalldr | 2 | - | 1
| 2 | - |
| 3 | Apr 13, 2000 09:58 PM | Ne28thst | 1 | 1
| 1 | 2 | 1 |
| 4 | Jun 5, 2000 11:40 PM | Sr-500 | 3 | 1
| 1 | 3 | - |
| 5 | Jun 7, 2000 04:49 AM | Sr-500west | 1 | - | 1
| 2 | 1 |
| 6 | Jul 14, 2000 09:41 PM | Sr-501 | 2 | - | 1
| 5 | 3 |
| 7 | Oct 8, 2000 00:24 AM | Neandresenrd | 2 | 1
| 1 | 3 | - |
| 8 | Dec 21, 2000 08:10 AM | Emillplainblvd | 2 | - | 1
| 2 | - |
Vancouver fatal car crash and road traffic accident list for 1999
- Fatal accident count8
- Vehicles involved in fatal accidents12
- Fatal accidents involving drunk persons2
- Fatalities8
- Persons involved in fatal accidents27
- Pedestrians involved in fatal accidents4
Average EMS response time
- Vancouver(Based on 6 reports) 3.8 mins
- Clark County(Based on 31 reports) 6.0 mins
- Washington(Based on 539 reports) 8.2 mins
Average hospital transport time
- Vancouver(Based on 6 reports) 40.3 mins
- Clark County(Based on 24 reports) 49.9 mins
- Washington(Based on 404 reports) 50.8 mins
Dark - Lighted
- Vancouver(Based on 8 reports) 62.5%
- Clark County(Based on 33 reports) 30.3%
- Washington(Based on 572 reports) 15.9%
Daylight
- Vancouver(Based on 8 reports) 25.0%
- Clark County(Based on 33 reports) 51.5%
- Washington(Based on 572 reports) 50.5%
Dark - Not Lighted
- Vancouver(Based on 8 reports) 12.5%
- Clark County(Based on 33 reports) 12.1%
- Washington(Based on 572 reports) 28.5%
Rain
- Vancouver(Based on 8 reports) 62.5%
- Clark County(Based on 33 reports) 30.3%
- Washington(Based on 574 reports) 15.0%
Clear
- Vancouver(Based on 8 reports) 37.5%
- Clark County(Based on 33 reports) 69.7%
- Washington(Based on 574 reports) 80.5%
| # | Date | Location | Vehicles | Drunk persons | Fatalites | Persons | Pedestrians |
|---|
| 1 | Jan 23, 1999 02:07 AM | Ne68thst | 1 | - | 1
| 1 | - |
| 2 | Jul 24, 1999 02:29 PM | Mcloughlin | 2 | - | 1
| 4 | 1 |
| 3 | Aug 7, 1999 08:40 PM | Ne28thst | 2 | 1
| 1 | 4 | - |
| 4 | Aug 19, 1999 07:20 AM | Sr-501 | 1 | - | 1
| 2 | 1 |
| 5 | Sep 4, 1999 09:04 PM | Semillplain | 1 | - | 1
| 1 | - |
| 6 | Dec 15, 1999 05:51 PM | Emillplain | 1 | - | 1
| 3 | 1 |
| 7 | Mar 28, 1999 08:41 PM | Fourthplain | 1 | 1
| 1 | 2 | 1 |
| 8 | Aug 13, 1999 09:10 PM | Emillplainblv | 3 | - | 1
| 10 | - |
Vancouver fatal car crash and road traffic accident list for 1998
- Fatal accident count7
- Vehicles involved in fatal accidents11
- Fatal accidents involving drunk persons2
- Fatalities7
- Persons involved in fatal accidents15
- Pedestrians involved in fatal accidents3
Average EMS response time
- Vancouver(Based on 7 reports) 6.0 mins
- Clark County(Based on 18 reports) 5.4 mins
- Washington(Based on 522 reports) 8.2 mins
Average hospital transport time
- Vancouver(Based on 5 reports) 124.2 mins
- Clark County(Based on 14 reports) 85.1 mins
- Washington(Based on 363 reports) 49.4 mins
Daylight
- Vancouver(Based on 7 reports) 42.9%
- Clark County(Based on 19 reports) 52.6%
- Washington(Based on 590 reports) 50.8%
Dark - Not Lighted
- Vancouver(Based on 7 reports) 42.9%
- Clark County(Based on 19 reports) 36.8%
- Washington(Based on 590 reports) 29.3%
Dusk
- Vancouver(Based on 7 reports) 14.3%
- Clark County(Based on 19 reports) 5.3%
- Washington(Based on 590 reports) 1.7%
Clear
- Vancouver(Based on 7 reports) 71.4%
- Clark County(Based on 19 reports) 84.2%
- Washington(Based on 590 reports) 81.7%
Rain
- Vancouver(Based on 7 reports) 28.6%
- Clark County(Based on 19 reports) 15.8%
- Washington(Based on 590 reports) 13.2%
| # | Date | Location | Vehicles | Drunk persons | Fatalites | Persons | Pedestrians |
|---|
| 1 | Mar 31, 1998 02:49 AM | Nwfruitvalley | 1 | 1
| 1 | 2 | - |
| 2 | Mar 3, 1998 01:15 PM | Se101stave | 1 | - | 1
| 1 | - |
| 3 | Mar 23, 1998 02:39 PM | I-5 | 3 | - | 1
| 3 | - |
| 4 | Apr 13, 1998 09:08 AM | Mainst | 1 | - | 1
| 2 | 1 |
| 5 | Apr 27, 1998 07:19 PM | Stapleton | 2 | 1
| 1 | 2 | - |
| 6 | Jan 1, 1998 08:47 PM | Burtonrd | 1 | - | 1
| 2 | 1 |
| 7 | Dec 8, 1998 05:34 PM | Emillplainblvd | 2 | - | 1
| 3 | 1 |
Vancouver fatal car crash and road traffic accident list for 1997
- Fatal accident count5
- Vehicles involved in fatal accidents7
- Fatal accidents involving drunk persons2
- Fatalities5
- Persons involved in fatal accidents12
- Pedestrians involved in fatal accidents1
Average EMS response time
- Vancouver(Based on 4 reports) 6.3 mins
- Clark County(Based on 22 reports) 6.8 mins
- Washington(Based on 537 reports) 8.3 mins
Average hospital transport time
- Vancouver(Based on 3 reports) 36.3 mins
- Clark County(Based on 16 reports) 65.0 mins
- Washington(Based on 410 reports) 47.7 mins
Daylight
- Vancouver(Based on 5 reports) 60.0%
- Clark County(Based on 24 reports) 41.7%
- Washington(Based on 585 reports) 46.7%
Dark - Lighted
- Vancouver(Based on 5 reports) 40.0%
- Clark County(Based on 24 reports) 16.7%
- Washington(Based on 585 reports) 16.9%
Clear
- Vancouver(Based on 5 reports) 60.0%
- Clark County(Based on 24 reports) 75.0%
- Washington(Based on 587 reports) 79.6%
Rain
- Vancouver(Based on 5 reports) 40.0%
- Clark County(Based on 24 reports) 25.0%
- Washington(Based on 587 reports) 15.5%
| # | Date | Location | Vehicles | Drunk persons | Fatalites | Persons | Pedestrians |
|---|
| 1 | Jul 29, 1997 06:00 PM | Millplnble | 1 | - | 1
| 2 | - |
| 2 | Oct 2, 1997 09:07 PM | I205 | 1 | 1
| 1 | 1 | - |
| 3 | Oct 30, 1997 11:45 AM | I5 | 2 | - | 1
| 4 | - |
| 4 | Dec 16, 1997 09:05 AM | Alley | 1 | - | 1
| 2 | 1 |
| 5 | Dec 31, 1997 09:30 PM | 14 | 2 | 1
| 1 | 3 | - |
Vancouver fatal car crash and road traffic accident list for 1996
- Fatal accident count8
- Vehicles involved in fatal accidents12
- Fatal accidents involving drunk persons3
- Fatalities8
- Persons involved in fatal accidents22
- Pedestrians involved in fatal accidents3
Average EMS response time
- Vancouver(Based on 8 reports) 4.5 mins
- Clark County(Based on 32 reports) 5.9 mins
- Washington(Based on 572 reports) 7.7 mins
Average hospital transport time
- Vancouver(Based on 3 reports) 158.3 mins
- Clark County(Based on 18 reports) 85.2 mins
- Washington(Based on 414 reports) 48.6 mins
Daylight
- Vancouver(Based on 8 reports) 50.0%
- Clark County(Based on 33 reports) 42.4%
- Washington(Based on 643 reports) 48.8%
Dark - Lighted
- Vancouver(Based on 8 reports) 50.0%
- Clark County(Based on 33 reports) 12.1%
- Washington(Based on 643 reports) 13.8%
Clear
- Vancouver(Based on 8 reports) 50.0%
- Clark County(Based on 33 reports) 60.6%
- Washington(Based on 643 reports) 82.1%
Rain
- Vancouver(Based on 8 reports) 25.0%
- Clark County(Based on 33 reports) 27.3%
- Washington(Based on 643 reports) 12.3%
Fog, Smog, Smoke
- Vancouver(Based on 8 reports) 25.0%
- Clark County(Based on 33 reports) 12.1%
- Washington(Based on 643 reports) 1.7%
| # | Date | Location | Vehicles | Drunk persons | Fatalites | Persons | Pedestrians |
|---|
| 1 | Jan 11, 1996 10:08 PM | Ftvancvrwy | 1 | - | 1
| 2 | 1 |
| 2 | Mar 11, 1996 00:14 AM | Burton | 2 | - | 1
| 2 | - |
| 3 | May 10, 1996 07:45 PM | 500 | 1 | 1
| 1 | 1 | - |
| 4 | May 12, 1996 05:35 PM | 500 | 3 | - | 1
| 5 | - |
| 5 | Jun 19, 1996 00:33 AM | I5 | 1 | - | 1
| 6 | - |
| 6 | Jun 27, 1996 06:30 PM | Columbiawy | 1 | 1
| 1 | 2 | 1 |
| 7 | Sep 18, 1996 06:25 PM | I5 | 1 | - | 1
| 2 | 1 |
| 8 | Nov 20, 1996 09:55 PM | E35thst | 2 | 1
| 1 | 2 | - |
Vancouver fatal car crash and road traffic accident list for 1995
- Fatal accident count4
- Vehicles involved in fatal accidents7
- Fatal accidents involving drunk persons1
- Fatalities4
- Persons involved in fatal accidents11
Average EMS response time
- Vancouver(Based on 3 reports) 3.0 mins
- Clark County(Based on 21 reports) 4.6 mins
- Washington(Based on 508 reports) 8.0 mins
Daylight
- Vancouver(Based on 4 reports) 50.0%
- Clark County(Based on 22 reports) 59.1%
- Washington(Based on 575 reports) 47.3%
Dark - Lighted
- Vancouver(Based on 4 reports) 25.0%
- Clark County(Based on 22 reports) 22.7%
- Washington(Based on 575 reports) 16.9%
Dark - Not Lighted
- Vancouver(Based on 4 reports) 25.0%
- Clark County(Based on 22 reports) 18.2%
- Washington(Based on 575 reports) 31.7%
Clear
- Vancouver(Based on 4 reports) 100.0%
- Clark County(Based on 22 reports) 81.8%
- Washington(Based on 576 reports) 84.7%
| # | Date | Location | Vehicles | Drunk persons | Fatalites | Persons | Pedestrians |
|---|
| 1 | Feb 25, 1995 11:57 AM | E19th | 1 | - | 1
| 4 | - |
| 2 | Mar 9, 1995 05:08 AM | E4thplain | 1 | - | 1
| 1 | - |
| 3 | Nov 18, 1995 04:32 AM | Burtonrd | 2 | 1
| 1 | 3 | - |
| 4 | May 18, 1995 08:30 AM | Neminehast | 3 | - | 1
| 3 | - |
Vancouver fatal car crash and road traffic accident list for 1994
- Fatal accident count5
- Vehicles involved in fatal accidents6
- Fatalities5
- Persons involved in fatal accidents11
- Pedestrians involved in fatal accidents3
Average EMS response time
- Vancouver(Based on 5 reports) 4.0 mins
- Clark County(Based on 26 reports) 6.5 mins
- Washington(Based on 513 reports) 7.7 mins
Daylight
- Vancouver(Based on 5 reports) 60.0%
- Clark County(Based on 27 reports) 48.1%
- Washington(Based on 574 reports) 47.9%
Dark - Lighted
- Vancouver(Based on 5 reports) 20.0%
- Clark County(Based on 27 reports) 11.1%
- Washington(Based on 574 reports) 16.2%
Dawn
- Vancouver(Based on 5 reports) 20.0%
- Clark County(Based on 27 reports) 11.1%
- Washington(Based on 574 reports) 1.9%
Rain
- Vancouver(Based on 5 reports) 60.0%
- Clark County(Based on 27 reports) 25.9%
- Washington(Based on 575 reports) 11.7%
Clear
- Vancouver(Based on 5 reports) 40.0%
- Clark County(Based on 27 reports) 74.1%
- Washington(Based on 575 reports) 84.2%
| # | Date | Location | Vehicles | Drunk persons | Fatalites | Persons | Pedestrians |
|---|
| 1 | Jan 3, 1994 07:35 AM | E18thst | 1 | - | 1
| 3 | 1 |
| 2 | Sep 10, 1994 06:10 PM | Garrisonrd | 1 | - | 1
| 1 | - |
| 3 | Nov 1, 1994 07:34 AM | Efrthplnbl | 2 | - | 1
| 3 | - |
| 4 | Dec 22, 1994 05:14 PM | Millplain | 1 | - | 1
| 2 | 1 |
| 5 | Aug 30, 1994 02:52 PM | Millplain | 1 | - | 1
| 2 | 1 |
Vancouver fatal car crash and road traffic accident list for 1993
| # | Date | Location | Vehicles | Drunk persons | Fatalites | Persons | Pedestrians |
|---|
| 1 | Feb 22, 1993 07:09 PM | Burtonrd | 1 | - | 1
| 2 | 1 |
| 2 | Sep 26, 1993 01:50 PM | 14 | 1 | 1
| 1 | 2 | 1 |
| 3 | Oct 20, 1993 02:25 AM | 14 | 1 | 1
| 1 | 1 | - |
Vancouver fatal car crash and road traffic accident list for 1992
- Fatal accident count4
- Vehicles involved in fatal accidents7
- Fatal accidents involving drunk persons1
- Fatalities4
- Persons involved in fatal accidents10
- Pedestrians involved in fatal accidents1
Average EMS response time
- Vancouver(Based on 4 reports) 6.8 mins
- Clark County(Based on 35 reports) 5.7 mins
- Washington(Based on 550 reports) 7.3 mins
Average hospital transport time
- Vancouver(Based on 2 reports) 26.0 mins
- Clark County(Based on 26 reports) 62.3 mins
- Washington(Based on 448 reports) 48.6 mins
Daylight
- Vancouver(Based on 4 reports) 75.0%
- Clark County(Based on 38 reports) 65.8%
- Washington(Based on 591 reports) 45.5%
Dark - Lighted
- Vancouver(Based on 4 reports) 25.0%
- Clark County(Based on 38 reports) 5.3%
- Washington(Based on 591 reports) 18.1%
Clear
- Vancouver(Based on 4 reports) 75.0%
- Clark County(Based on 38 reports) 84.2%
- Washington(Based on 592 reports) 84.1%
Rain
- Vancouver(Based on 4 reports) 25.0%
- Clark County(Based on 38 reports) 7.9%
- Washington(Based on 592 reports) 11.7%
| # | Date | Location | Vehicles | Drunk persons | Fatalites | Persons | Pedestrians |
|---|
| 1 | Jan 27, 1992 03:08 PM | Nefrthplan | 1 | - | 1
| 2 | 1 |
| 2 | Mar 9, 1992 04:51 PM | Washington | 2 | - | 1
| 2 | - |
| 3 | Jun 4, 1992 03:35 AM | I5 | 2 | 1
| 1 | 2 | - |
| 4 | Jul 24, 1992 03:31 PM | Milplainbl | 2 | - | 1
| 4 | - |
Vancouver fatal car crash and road traffic accident list for 1991
- Fatal accident count6
- Vehicles involved in fatal accidents9
- Fatal accidents involving drunk persons5
- Fatalities6
- Persons involved in fatal accidents13
- Pedestrians involved in fatal accidents2
Average EMS response time
- Vancouver(Based on 5 reports) 4.2 mins
- Clark County(Based on 26 reports) 5.0 mins
- Washington(Based on 544 reports) 8.3 mins
Average hospital transport time
- Vancouver(Based on 2 reports) 28.5 mins
- Clark County(Based on 20 reports) 38.9 mins
- Washington(Based on 415 reports) 48.5 mins
Dark - Lighted
- Vancouver(Based on 6 reports) 66.7%
- Clark County(Based on 30 reports) 20.0%
- Washington(Based on 601 reports) 15.3%
Daylight
- Vancouver(Based on 6 reports) 16.7%
- Clark County(Based on 30 reports) 40.0%
- Washington(Based on 601 reports) 45.6%
Dark - Not Lighted
- Vancouver(Based on 6 reports) 16.7%
- Clark County(Based on 30 reports) 40.0%
- Washington(Based on 601 reports) 35.1%
Clear
- Vancouver(Based on 6 reports) 66.7%
- Clark County(Based on 30 reports) 83.3%
- Washington(Based on 602 reports) 81.7%
Rain
- Vancouver(Based on 6 reports) 33.3%
- Clark County(Based on 30 reports) 13.3%
- Washington(Based on 602 reports) 13.6%
| # | Date | Location | Vehicles | Drunk persons | Fatalites | Persons | Pedestrians |
|---|
| 1 | Jan 11, 1991 06:50 AM | W39th | 1 | - | 1
| 1 | - |
| 2 | Jan 12, 1991 03:25 AM | I5 | 1 | 1
| 1 | 1 | - |
| 3 | Jul 1, 1991 02:01 AM | Columbiawy | 2 | 2
| 1 | 4 | - |
| 4 | Sep 18, 1991 01:30 PM | 501 | 2 | - | 1
| 2 | - |
| 5 | Dec 26, 1991 01:25 AM | I5 | 1 | 1
| 1 | 1 | - |
| 6 | Jan 11, 1991 08:30 PM | 500 | 2 | 1
| 1 | 4 | 2 |
Vancouver fatal car crash and road traffic accident list for 1990
| # | Date | Location | Vehicles | Drunk persons | Fatalites | Persons | Pedestrians |
|---|
| 1 | Jan 19, 1990 11:45 PM | Pst | 1 | - | 1
| 2 | - |
| 2 | Aug 3, 1990 12:55 AM | I5 | 1 | 1
| 1 | 1 | - |
| 3 | Aug 7, 1990 08:15 PM | Macarthur | 1 | - | 1
| 2 | - |
Vancouver fatal car crash and road traffic accident list for 1989
- Fatal accident count7
- Vehicles involved in fatal accidents8
- Fatal accidents involving drunk persons4
- Fatalities7
- Persons involved in fatal accidents13
Average EMS response time
- Vancouver(Based on 7 reports) 3.7 mins
- Clark County(Based on 27 reports) 5.7 mins
- Washington(Based on 572 reports) 7.9 mins
Average hospital transport time
- Vancouver(Based on 7 reports) 22.0 mins
- Clark County(Based on 25 reports) 30.8 mins
- Washington(Based on 441 reports) 44.2 mins
Dark - Lighted
- Vancouver(Based on 7 reports) 71.4%
- Clark County(Based on 31 reports) 19.4%
- Washington(Based on 694 reports) 16.3%
Daylight
- Vancouver(Based on 7 reports) 28.6%
- Clark County(Based on 31 reports) 35.5%
- Washington(Based on 694 reports) 44.1%
Clear
- Vancouver(Based on 7 reports) 85.7%
- Clark County(Based on 31 reports) 83.9%
- Washington(Based on 694 reports) 84.0%
Fog, Smog, Smoke
- Vancouver(Based on 7 reports) 14.3%
- Clark County(Based on 31 reports) 3.2%
- Washington(Based on 694 reports) 3.0%
| # | Date | Location | Vehicles | Drunk persons | Fatalites | Persons | Pedestrians |
|---|
| 1 | Jan 27, 1989 07:30 PM | Millplain | 1 | 1
| 1 | 1 | - |
| 2 | Feb 10, 1989 09:04 PM | Millplain | 1 | 1
| 1 | 1 | - |
| 3 | Mar 10, 1989 09:18 PM | I5 | 1 | 1
| 1 | 2 | - |
| 4 | May 20, 1989 07:00 PM | I5 | 1 | - | 1
| 3 | - |
| 5 | Jul 18, 1989 06:46 PM | E28thst | 1 | - | 1
| 2 | - |
| 6 | Oct 13, 1989 07:55 PM | Mainst | 2 | - | 1
| 3 | - |
| 7 | Dec 25, 1989 02:26 AM | E18thst | 1 | 1
| 1 | 1 | - |
Vancouver fatal car crash and road traffic accident list for 1988
| # | Date | Location | Vehicles | Drunk persons | Fatalites | Persons | Pedestrians |
|---|
| 1 | Jul 30, 1988 10:05 AM | Ecolmbiawy | 1 | - | 1
| 1 | - |
| 2 | Sep 7, 1988 05:50 PM | 29thst | 1 | - | 1
| 2 | - |
| 3 | Oct 1, 1988 11:05 AM | E20thst | 1 | - | 1
| 4 | - |
Vancouver fatal car crash and road traffic accident list for 1987
| # | Date | Location | Vehicles | Drunk persons | Fatalites | Persons | Pedestrians |
|---|
| 1 | Jul 21, 1987 12:04 AM | Devineroad | 2 | - | 1
| 2 | - |
Vancouver fatal car crash and road traffic accident list for 1986
- Fatal accident count4
- Vehicles involved in fatal accidents8
- Fatal accidents involving drunk persons4
- Fatalities5
- Persons involved in fatal accidents12
Average EMS response time
- Vancouver(Based on 3 reports) 4.3 mins
- Clark County(Based on 22 reports) 4.7 mins
- Washington(Based on 524 reports) 6.3 mins
Dark - Lighted
- Vancouver(Based on 4 reports) 100.0%
- Clark County(Based on 24 reports) 29.2%
- Washington(Based on 648 reports) 18.5%
Clear
- Vancouver(Based on 4 reports) 50.0%
- Clark County(Based on 24 reports) 70.8%
- Washington(Based on 648 reports) 83.6%
Rain
- Vancouver(Based on 4 reports) 25.0%
- Clark County(Based on 24 reports) 16.7%
- Washington(Based on 648 reports) 11.6%
Fog, Smog, Smoke
- Vancouver(Based on 4 reports) 25.0%
- Clark County(Based on 24 reports) 12.5%
- Washington(Based on 648 reports) 3.5%
| # | Date | Location | Vehicles | Drunk persons | Fatalites | Persons | Pedestrians |
|---|
| 1 | Jan 291986 06:56 PM | | 3 | 1
| 2 | 4 | - |
| 2 | May 29, 1986 00:48 AM | Blandfrddr | 2 | 2
| 1 | 2 | - |
| 3 | Oct 171986 11:48 PM | | 1 | 1
| 1 | 4 | - |
| 4 | Dec 21986 09:10 PM | | 2 | - | 1
| 2 | - |
Vancouver fatal car crash and road traffic accident list for 1985
- Fatal accident count5
- Vehicles involved in fatal accidents9
- Fatal accidents involving drunk persons2
- Fatalities5
- Persons involved in fatal accidents18
Average EMS response time
- Vancouver(Based on 3 reports) 3.3 mins
- Clark County(Based on 29 reports) 5.4 mins
- Washington(Based on 573 reports) 6.8 mins
Dark - Lighted
- Vancouver(Based on 5 reports) 60.0%
- Clark County(Based on 32 reports) 28.1%
- Washington(Based on 643 reports) 18.0%
Daylight
- Vancouver(Based on 5 reports) 40.0%
- Clark County(Based on 32 reports) 37.5%
- Washington(Based on 643 reports) 47.1%
Clear
- Vancouver(Based on 5 reports) 100.0%
- Clark County(Based on 32 reports) 100.0%
- Washington(Based on 645 reports) 85.4%
| # | Date | Location | Vehicles | Drunk persons | Fatalites | Persons | Pedestrians |
|---|
| 1 | Jan 31985 01:25 PM | | 3 | - | 1
| 4 | - |
| 2 | Mar 23, 1985 06:41 PM | Mainst | 2 | - | 1
| 6 | - |
| 3 | Apr 51985 06:35 PM | | 1 | 1
| 1 | 4 | - |
| 4 | May 211985 05:37 PM | | 2 | 1
| 1 | 3 | - |
| 5 | May 23, 1985 00:41 AM | 500 | 1 | - | 1
| 1 | - |
Vancouver fatal car crash and road traffic accident list for 1984
- Fatal accident count8
- Vehicles involved in fatal accidents12
- Fatal accidents involving drunk persons4
- Fatalities9
- Persons involved in fatal accidents20
Average EMS response time
- Vancouver(Based on 7 reports) 5.9 mins
- Clark County(Based on 21 reports) 6.6 mins
- Washington(Based on 579 reports) 6.9 mins
Daylight
- Vancouver(Based on 8 reports) 50.0%
- Clark County(Based on 25 reports) 36.0%
- Washington(Based on 673 reports) 47.8%
Dark - Lighted
- Vancouver(Based on 8 reports) 37.5%
- Clark County(Based on 25 reports) 16.0%
- Washington(Based on 673 reports) 15.5%
Dark - Not Lighted
- Vancouver(Based on 8 reports) 12.5%
- Clark County(Based on 25 reports) 44.0%
- Washington(Based on 673 reports) 34.6%
Clear
- Vancouver(Based on 8 reports) 62.5%
- Clark County(Based on 25 reports) 76.0%
- Washington(Based on 674 reports) 82.2%
Rain
- Vancouver(Based on 8 reports) 37.5%
- Clark County(Based on 25 reports) 24.0%
- Washington(Based on 674 reports) 14.1%
| # | Date | Location | Vehicles | Drunk persons | Fatalites | Persons | Pedestrians |
|---|
| 1 | Jan 201984 02:39 PM | | 1 | - | 1
| 2 | - |
| 2 | Jan 21, 1984 06:50 AM | Andresenrd | 2 | - | 1
| 3 | - |
| 3 | Feb 20, 1984 05:25 PM | 500 | 2 | - | 1
| 2 | - |
| 4 | Feb 171984 03:30 PM | | 1 | - | 1
| 2 | - |
| 5 | Mar 81984 02:05 AM | | 2 | 1
| 2 | 4 | - |
| 6 | Oct 41984 05:00 AM | | 1 | 1
| 1 | 2 | - |
| 7 | Oct 221984 05:18 PM | | 2 | 1
| 1 | 4 | - |
| 8 | Nov 25, 1984 01:00 AM | Evergreen | 1 | 1
| 1 | 1 | - |
Vancouver fatal car crash and road traffic accident list for 1983
- Fatal accident count7
- Vehicles involved in fatal accidents13
- Fatal accidents involving drunk persons4
- Fatalities7
- Persons involved in fatal accidents18
Average EMS response time
- Vancouver(Based on 4 reports) 5.5 mins
- Clark County(Based on 24 reports) 7.9 mins
- Washington(Based on 488 reports) 7.2 mins
Daylight
- Vancouver(Based on 7 reports) 57.1%
- Clark County(Based on 28 reports) 39.3%
- Washington(Based on 628 reports) 45.1%
Dark - Lighted
- Vancouver(Based on 7 reports) 42.9%
- Clark County(Based on 28 reports) 10.7%
- Washington(Based on 628 reports) 17.2%
Clear
- Vancouver(Based on 7 reports) 71.4%
- Clark County(Based on 28 reports) 85.7%
- Washington(Based on 628 reports) 83.1%
Rain
- Vancouver(Based on 7 reports) 28.6%
- Clark County(Based on 28 reports) 14.3%
- Washington(Based on 628 reports) 13.5%
| # | Date | Location | Vehicles | Drunk persons | Fatalites | Persons | Pedestrians |
|---|
| 1 | Jan 10, 1983 00:05 AM | Andreson | 1 | 1
| 1 | 1 | - |
| 2 | Jan 22, 1983 01:26 AM | 014 | 2 | 1
| 1 | 2 | - |
| 3 | Feb 5, 1983 12:16 AM | 500 | 3 | - | 1
| 5 | - |
| 4 | Jul 221983 05:37 PM | | 1 | - | 1
| 2 | - |
| 5 | Sep 231983 02:20 AM | | 2 | 1
| 1 | 2 | - |
| 6 | Oct 121983 08:46 AM | | 3 | - | 1
| 5 | - |
| 7 | Oct 211983 10:35 PM | | 1 | 1
| 1 | 1 | - |
Vancouver fatal car crash and road traffic accident list for 1982
- Fatal accident count9
- Vehicles involved in fatal accidents14
- Fatal accidents involving drunk persons5
- Fatalities10
- Persons involved in fatal accidents25
Average EMS response time
- Vancouver(Based on 7 reports) 7.1 mins
- Clark County(Based on 19 reports) 7.7 mins
- Washington(Based on 489 reports) 7.6 mins
Dark - Lighted
- Vancouver(Based on 9 reports) 66.7%
- Clark County(Based on 25 reports) 44.0%
- Washington(Based on 671 reports) 20.0%
Daylight
- Vancouver(Based on 9 reports) 22.2%
- Clark County(Based on 25 reports) 36.0%
- Washington(Based on 671 reports) 39.5%
Dark - Not Lighted
- Vancouver(Based on 9 reports) 11.1%
- Clark County(Based on 25 reports) 16.0%
- Washington(Based on 671 reports) 36.5%
Clear
- Vancouver(Based on 9 reports) 88.9%
- Clark County(Based on 25 reports) 96.0%
- Washington(Based on 671 reports) 86.9%
Rain
- Vancouver(Based on 9 reports) 11.1%
- Clark County(Based on 25 reports) 4.0%
- Washington(Based on 671 reports) 11.0%
| # | Date | Location | Vehicles | Drunk persons | Fatalites | Persons | Pedestrians |
|---|
| 1 | Mar 15, 1982 03:40 AM | 005 | 2 | - | 1
| 1 | - |
| 2 | Mar 2, 1982 03:00 PM | Grandblvd | 2 | - | 1
| 4 | - |
| 3 | Jul 30, 1982 03:05 AM | 005 | 1 | - | 1
| 1 | - |
| 4 | Aug 27, 1982 02:14 AM | 501 | 2 | 1
| 1 | 3 | - |
| 5 | Sep 6, 1982 00:48 AM | 92600 | 3 | 1
| 1 | 3 | - |
| 6 | Sep 18, 1982 02:35 AM | Devine | 1 | 1
| 1 | 4 | - |
| 7 | Nov 20, 1982 09:55 AM | 014 | 1 | - | 1
| 4 | - |
| 8 | Dec 11, 1982 11:15 PM | W39thst | 1 | 1
| 2 | 2 | - |
| 9 | Dec 18, 1982 10:08 PM | Millplain | 1 | 1
| 1 | 3 | - |
Vancouver fatal car crash and road traffic accident list for 1981
- Fatal accident count12
- Vehicles involved in fatal accidents15
- Fatal accidents involving drunk persons7
- Fatalities14
- Persons involved in fatal accidents29
Average EMS response time
- Vancouver(Based on 8 reports) 9.3 mins
- Clark County(Based on 22 reports) 10.4 mins
- Washington(Based on 552 reports) 8.4 mins
Daylight
- Vancouver(Based on 12 reports) 41.7%
- Clark County(Based on 28 reports) 35.7%
- Washington(Based on 783 reports) 37.4%
Dark - Lighted
- Vancouver(Based on 12 reports) 41.7%
- Clark County(Based on 28 reports) 21.4%
- Washington(Based on 783 reports) 20.1%
Dark - Not Lighted
- Vancouver(Based on 12 reports) 16.7%
- Clark County(Based on 28 reports) 39.3%
- Washington(Based on 783 reports) 38.4%
Clear
- Vancouver(Based on 12 reports) 91.7%
- Clark County(Based on 28 reports) 82.1%
- Washington(Based on 784 reports) 80.0%
Rain
- Vancouver(Based on 12 reports) 8.3%
- Clark County(Based on 28 reports) 14.3%
- Washington(Based on 784 reports) 14.5%
Vancouver fatal car crash and road traffic accident list for 1980
- Fatal accident count7
- Vehicles involved in fatal accidents13
- Fatal accidents involving drunk persons6
- Fatalities7
- Persons involved in fatal accidents18
Average EMS response time
- Vancouver(Based on 5 reports) 6.2 mins
- Clark County(Based on 26 reports) 7.8 mins
- Washington(Based on 577 reports) 7.7 mins
Daylight
- Vancouver(Based on 7 reports) 42.9%
- Clark County(Based on 38 reports) 39.5%
- Washington(Based on 847 reports) 37.2%
Dark - Lighted
- Vancouver(Based on 7 reports) 42.9%
- Clark County(Based on 38 reports) 13.2%
- Washington(Based on 847 reports) 19.6%
Dark - Not Lighted
- Vancouver(Based on 7 reports) 14.3%
- Clark County(Based on 38 reports) 44.7%
- Washington(Based on 847 reports) 38.5%
Clear
- Vancouver(Based on 7 reports) 71.4%
- Clark County(Based on 38 reports) 81.6%
- Washington(Based on 847 reports) 83.8%
Rain
- Vancouver(Based on 7 reports) 28.6%
- Clark County(Based on 38 reports) 13.2%
- Washington(Based on 847 reports) 10.6%
Vancouver fatal car crash and road traffic accident list for 1978
- Fatal accident count9
- Vehicles involved in fatal accidents12
- Fatal accidents involving drunk persons6
- Fatalities9
- Persons involved in fatal accidents18
Dark - Lighted
- Vancouver(Based on 9 reports) 55.6%
- Clark County(Based on 35 reports) 25.7%
- Washington(Based on 864 reports) 19.4%
Dark - Not Lighted
- Vancouver(Based on 9 reports) 22.2%
- Clark County(Based on 35 reports) 37.1%
- Washington(Based on 864 reports) 35.0%
Dark - Unknown Lighting
- Vancouver(Based on 9 reports) 11.1%
- Clark County(Based on 35 reports) 5.7%
- Washington(Based on 864 reports) 4.1%
Daylight
- Vancouver(Based on 9 reports) 11.1%
- Clark County(Based on 35 reports) 31.4%
- Washington(Based on 864 reports) 41.6%
Clear
- Vancouver(Based on 9 reports) 100.0%
- Clark County(Based on 35 reports) 82.9%
- Washington(Based on 865 reports) 83.9%
Vancouver fatal car crash and road traffic accident list for 1977
- Fatal accident count6
- Vehicles involved in fatal accidents10
- Fatal accidents involving drunk persons4
- Fatalities6
- Persons involved in fatal accidents17
Average EMS response time
- Vancouver(Based on 2 reports) 5.0 mins
- Clark County(Based on 5 reports) 4.0 mins
- Washington(Based on 97 reports) 13.0 mins
Dark - Lighted
- Vancouver(Based on 6 reports) 66.7%
- Clark County(Based on 26 reports) 19.2%
- Washington(Based on 796 reports) 17.2%
Daylight
- Vancouver(Based on 6 reports) 33.3%
- Clark County(Based on 26 reports) 46.2%
- Washington(Based on 796 reports) 40.2%
Clear
- Vancouver(Based on 6 reports) 66.7%
- Clark County(Based on 26 reports) 76.9%
- Washington(Based on 797 reports) 81.4%
Snow
- Vancouver(Based on 6 reports) 16.7%
- Clark County(Based on 26 reports) 3.8%
- Washington(Based on 797 reports) 1.1%
Rain
- Vancouver(Based on 6 reports) 16.7%
- Clark County(Based on 26 reports) 11.5%
- Washington(Based on 797 reports) 14.7%