Fatal car crashes and road traffic accidents in Ventura, California
- Fatal car crash and road traffic accident statistics for 2021
- Fatal accident count13
- Vehicles involved in fatal accidents19
- Fatal accidents involving drunk persons0
- Fatalities14
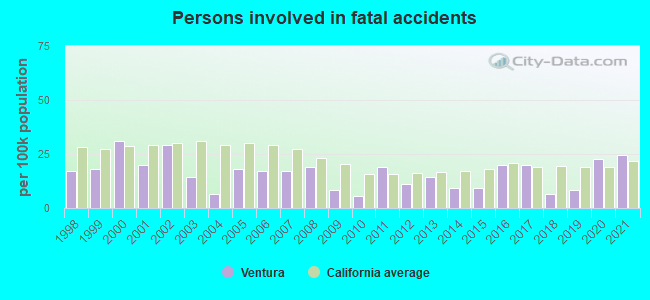
- Persons involved in fatal accidents26
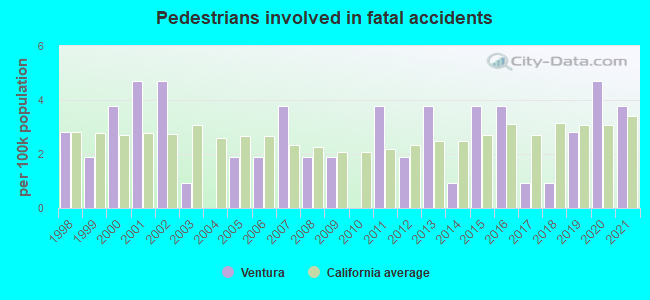
- Pedestrians involved in fatal accidents4
- Fatal car crash and road traffic accident statistics for 2020
- Fatal accident count10
- Vehicles involved in fatal accidents12
- Fatal accidents involving drunk persons3
- Fatalities10
- Persons involved in fatal accidents24
- Pedestrians involved in fatal accidents5
- Fatal car crash and road traffic accident statistics for 2019
- Fatal accident count4
- Vehicles involved in fatal accidents4
- Fatal accidents involving drunk persons1
- Fatalities4
- Persons involved in fatal accidents9
- Pedestrians involved in fatal accidents3
- Fatal car crash and road traffic accident statistics for 2018
- Fatal accident count4
- Vehicles involved in fatal accidents6
- Fatal accidents involving drunk persons2
- Fatalities4
- Persons involved in fatal accidents7
- Pedestrians involved in fatal accidents1
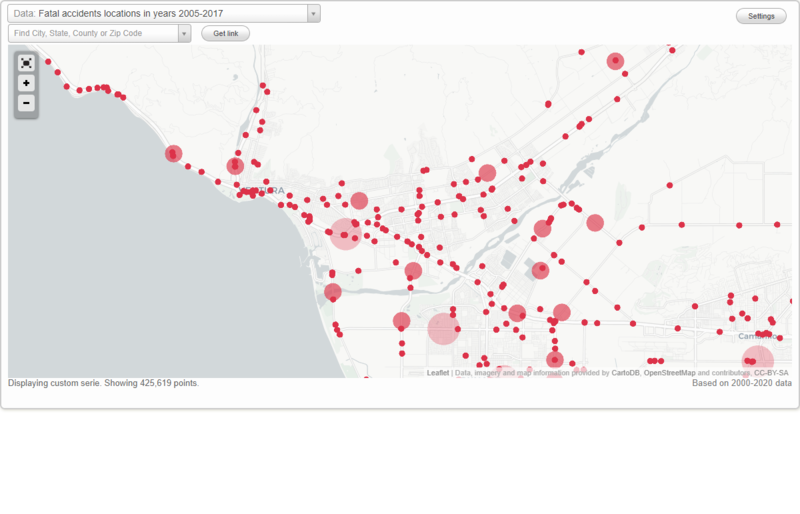
Data:
No street view available for this location
Ventura fatal accident statistics for 1998 - 2021
Average EMS response time
- Ventura(Based on 6 reports) 4.7 mins
- Ventura County(Based on 29 reports) 9.7 mins
- California(Based on 2,270 reports) 9.8 mins
Average hospital transport time
- Ventura(Based on 2 reports) 25.5 mins
- Ventura County(Based on 11 reports) 39.6 mins
- California(Based on 1,048 reports) 53.1 mins
Daylight
- Ventura(Based on 382 reports) 44.8%
- Ventura County(Based on 3,291 reports) 48.2%
- California(Based on 177,072 reports) 43.9%
Dark - Lighted
- Ventura(Based on 382 reports) 32.2%
- Ventura County(Based on 3,291 reports) 21.0%
- California(Based on 177,072 reports) 25.4%
Dark - Not Lighted
- Ventura(Based on 382 reports) 18.8%
- Ventura County(Based on 3,291 reports) 25.8%
- California(Based on 177,072 reports) 26.6%
Dusk
- Ventura(Based on 382 reports) 2.9%
- Ventura County(Based on 3,291 reports) 2.7%
- California(Based on 177,072 reports) 2.1%
Dawn
- Ventura(Based on 382 reports) 1.0%
- Ventura County(Based on 3,291 reports) 1.8%
- California(Based on 177,072 reports) 1.6%
Dark - Unknown Lighting
- Ventura(Based on 382 reports) 0.3%
- Ventura County(Based on 3,291 reports) 0.5%
- California(Based on 177,072 reports) 0.5%
Clear
- Ventura(Based on 382 reports) 93.5%
- Ventura County(Based on 3,296 reports) 92.0%
- California(Based on 177,248 reports) 91.0%
Rain
- Ventura(Based on 382 reports) 3.7%
- Ventura County(Based on 3,296 reports) 4.3%
- California(Based on 177,248 reports) 4.8%
Unknown
- Ventura(Based on 382 reports) 1.8%
- Ventura County(Based on 3,296 reports) 2.2%
- California(Based on 177,248 reports) 2.6%
Fog, Smog, Smoke
- Ventura(Based on 382 reports) 1.0%
- Ventura County(Based on 3,296 reports) 1.3%
- California(Based on 177,248 reports) 1.1%
Blowing Sand, Soil, Dirt
- Ventura(Based on 382 reports) 0.3%
- Ventura County(Based on 3,296 reports) 0.3%
- California(Based on 177,248 reports) 0.2%

Ventura fatal car crash and road traffic accident list for 2021
- Fatal accident count13
- Vehicles involved in fatal accidents19
- Fatalities14
- Persons involved in fatal accidents26
- Pedestrians involved in fatal accidents4
Dark - Not Lighted
- Ventura(Based on 13 reports) 46.2%
- Ventura County(Based on 51 reports) 31.4%
- California(Based on 3,972 reports) 27.4%
Daylight
- Ventura(Based on 13 reports) 30.8%
- Ventura County(Based on 51 reports) 47.1%
- California(Based on 3,972 reports) 36.7%
Dark - Lighted
- Ventura(Based on 13 reports) 23.1%
- Ventura County(Based on 51 reports) 13.7%
- California(Based on 3,972 reports) 31.4%
Clear
- Ventura(Based on 13 reports) 92.3%
- Ventura County(Based on 50 reports) 90.0%
- California(Based on 3,951 reports) 86.2%
Unknown
- Ventura(Based on 13 reports) 7.7%
- Ventura County(Based on 50 reports) 8.0%
- California(Based on 3,951 reports) 9.0%
| # | Date | Location | Vehicles | Drunk persons | Fatalites | Persons | Pedestrians |
|---|
| 1 | Apr 29, 2021 08:26 PM | Thompson Blvd | 1 | - | 1
| 1 | 1 |
| 2 | Jul 7, 2021 06:56 PM | Telephone Rd | 1 | - | 1
| 1 | 1 |
| 3 | Oct 3, 2021 02:00 AM | Sr-126 Santa Paula Fwy | 1 | - | 1
| 1 | - |
| 4 | Jul 11, 2021 02:20 AM | Us-101 | 1 | - | 1
| 1 | - |
| 5 | Sep 5, 2021 10:55 AM | Us-101 | 2 | - | 1
| 2 | - |
| 6 | Nov 28, 2021 06:06 PM | Thompson Bl | 1 | - | 1
| 1 | 1 |
| 7 | Dec 17, 2021 01:26 PM | Us-101 | 5 | - | 1
| 7 | - |
| 8 | Dec 12, 2021 02:26 AM | Us-101 Nb Ventura Fwy | 1 | - | 1
| 1 | - |
| 9 | Aug 6, 2021 06:44 PM | Us-101 Nb Ventura Fwy | 1 | - | 1
| 1 | - |
| 10 | Sep 28, 2021 00:30 AM | Us-101 Ventura Fwy | 1 | - | 1
| 1 | 1 |
| 11 | Jun 20, 2021 04:20 AM | Us-101 Ventura Fwy | 1 | - | 1
| 3 | - |
| 12 | Jul 12, 2021 03:28 AM | Us-101 Ramp | 1 | - | 1
| 3 | - |
| 13 | Oct 29, 2021 09:55 PM | Sr-126 Ramp, Sr-118 Wells Rd | 2 | - | 2
| 3 | - |
Ventura fatal car crash and road traffic accident list for 2020
- Fatal accident count10
- Vehicles involved in fatal accidents12
- Fatal accidents involving drunk persons3
- Fatalities10
- Persons involved in fatal accidents24
- Pedestrians involved in fatal accidents5
Dark - Lighted
- Ventura(Based on 10 reports) 50.0%
- Ventura County(Based on 52 reports) 28.8%
- California(Based on 3,555 reports) 31.5%
Dark - Not Lighted
- Ventura(Based on 10 reports) 30.0%
- Ventura County(Based on 52 reports) 25.0%
- California(Based on 3,555 reports) 24.8%
Daylight
- Ventura(Based on 10 reports) 20.0%
- Ventura County(Based on 52 reports) 42.3%
- California(Based on 3,555 reports) 38.6%
Clear
- Ventura(Based on 10 reports) 90.0%
- Ventura County(Based on 52 reports) 90.4%
- California(Based on 3,547 reports) 87.8%
Unknown
- Ventura(Based on 10 reports) 10.0%
- Ventura County(Based on 52 reports) 7.7%
- California(Based on 3,547 reports) 8.0%
| # | Date | Location | Vehicles | Drunk persons | Fatalites | Persons | Pedestrians |
|---|
| 1 | Feb 11, 2020 08:03 AM | Harbor Bl, San Pedro St | 2 | - | 1
| 5 | - |
| 2 | Feb 9, 2020 07:22 PM | Harbor Blvd | 1 | - | 1
| 1 | 1 |
| 3 | Mar 11, 2020 03:26 PM | Seaward Av | 1 | - | 1
| 1 | 1 |
| 4 | May 29, 2020 10:41 PM | Sr-33 | 1 | 1
| 1 | 1 | - |
| 5 | May 8, 2020 08:25 PM | Telegraph Rd | 1 | - | 1
| 1 | 1 |
| 6 | Jul 18, 2020 02:03 AM | Us-101 | 1 | 1
| 1 | 4 | - |
| 7 | Aug 23, 2020 08:54 PM | Us-101 | 2 | - | 1
| 8 | 1 |
| 8 | Oct 12, 2020 10:50 PM | Us-101 | 1 | - | 1
| 1 | - |
| 9 | Oct 28, 2020 09:13 PM | Us-101 | 1 | 1
| 1 | 1 | - |
| 10 | Dec 18, 2020 05:34 PM | Victoria Ave | 1 | - | 1
| 1 | 1 |
Ventura fatal car crash and road traffic accident list for 2019
- Fatal accident count4
- Vehicles involved in fatal accidents4
- Fatal accidents involving drunk persons1
- Fatalities4
- Persons involved in fatal accidents9
- Pedestrians involved in fatal accidents3
Dark - Lighted
- Ventura(Based on 4 reports) 75.0%
- Ventura County(Based on 43 reports) 27.9%
- California(Based on 3,314 reports) 31.1%
Daylight
- Ventura(Based on 4 reports) 25.0%
- Ventura County(Based on 43 reports) 44.2%
- California(Based on 3,314 reports) 38.4%
Clear
- Ventura(Based on 4 reports) 100.0%
- Ventura County(Based on 43 reports) 81.4%
- California(Based on 3,313 reports) 79.4%
Ventura fatal car crash and road traffic accident list for 2018
- Fatal accident count4
- Vehicles involved in fatal accidents6
- Fatal accidents involving drunk persons2
- Fatalities4
- Persons involved in fatal accidents7
- Pedestrians involved in fatal accidents1
Dark - Not Lighted
- Ventura(Based on 4 reports) 50.0%
- Ventura County(Based on 51 reports) 15.7%
- California(Based on 3,483 reports) 23.4%
Daylight
- Ventura(Based on 4 reports) 25.0%
- Ventura County(Based on 51 reports) 51.0%
- California(Based on 3,483 reports) 39.4%
Dark - Lighted
- Ventura(Based on 4 reports) 25.0%
- Ventura County(Based on 51 reports) 29.4%
- California(Based on 3,483 reports) 32.2%
Clear
- Ventura(Based on 4 reports) 50.0%
- Ventura County(Based on 51 reports) 84.3%
- California(Based on 3,478 reports) 85.0%
Rain
- Ventura(Based on 4 reports) 25.0%
- Ventura County(Based on 51 reports) 5.9%
- California(Based on 3,478 reports) 3.9%
Fog, Smog, Smoke
- Ventura(Based on 4 reports) 25.0%
- Ventura County(Based on 51 reports) 2.0%
- California(Based on 3,478 reports) 0.8%
Unknown
- Ventura(Based on 4 reports) 25.0%
- Ventura County(Based on 51 reports) 13.7%
- California(Based on 3,478 reports) 11.5%
Ventura fatal car crash and road traffic accident list for 2017
- Fatal accident count10
- Vehicles involved in fatal accidents16
- Fatal accidents involving drunk persons5
- Fatalities12
- Persons involved in fatal accidents21
- Pedestrians involved in fatal accidents1
Average EMS response time
- Ventura(Based on 2 reports) 3.5 mins
- Ventura County(Based on 2 reports) 3.5 mins
- California(Based on 8 reports) 9.4 mins
Daylight
- Ventura(Based on 10 reports) 60.0%
- Ventura County(Based on 42 reports) 50.0%
- California(Based on 3,300 reports) 40.9%
Dark - Lighted
- Ventura(Based on 10 reports) 20.0%
- Ventura County(Based on 42 reports) 14.3%
- California(Based on 3,300 reports) 28.8%
Dusk
- Ventura(Based on 10 reports) 10.0%
- Ventura County(Based on 42 reports) 7.1%
- California(Based on 3,300 reports) 2.3%
Dark - Not Lighted
- Ventura(Based on 10 reports) 10.0%
- Ventura County(Based on 42 reports) 21.4%
- California(Based on 3,300 reports) 25.4%
Clear
- Ventura(Based on 10 reports) 80.0%
- Ventura County(Based on 42 reports) 90.5%
- California(Based on 3,301 reports) 83.8%
Unknown
- Ventura(Based on 10 reports) 10.0%
- Ventura County(Based on 42 reports) 7.1%
- California(Based on 3,301 reports) 12.1%
Fog, Smog, Smoke
- Ventura(Based on 10 reports) 10.0%
- Ventura County(Based on 42 reports) 2.4%
- California(Based on 3,301 reports) 0.7%
| # | Date | Location | Vehicles | Drunk persons | Fatalites | Persons | Pedestrians |
|---|
| 1 | Jul 6, 2017 11:45 PM | Us-101 | 2 | 1
| 1 | 3 | - |
| 2 | Jul 15, 2017 06:52 PM | Sr-126 | 1 | 1
| 1 | 1 | - |
| 3 | Feb 19, 2017 06:47 AM | Victoria Ave, Telephone Rd | 2 | 1
| 1 | 3 | - |
| 4 | Jul 13, 2017 07:25 PM | Telegraph Rd | 1 | 1
| 1 | 1 | - |
| 5 | Jul 27, 2017 00:03 AM | Us-101 | 2 | 1
| 3 | 3 | - |
| 6 | Sep 26, 2017 07:03 PM | E Main St, N Katherine St | 1 | - | 1
| 1 | - |
| 7 | Apr 25, 2017 08:03 AM | John F Johnston Dr | 1 | - | 1
| 2 | 1 |
| 8 | Oct 19, 2017 06:55 AM | Sr-126 Santa Paula Fwy | 3 | - | 1
| 3 | - |
| 9 | Nov 25, 2017 06:49 PM | California St | 1 | - | 1
| 1 | - |
| 10 | Oct 28, 2017 03:37 PM | Cedar St, Cedar Pl | 2 | - | 1
| 3 | - |
Ventura fatal car crash and road traffic accident list for 2016
- Fatal accident count9
- Vehicles involved in fatal accidents14
- Fatal accidents involving drunk persons3
- Fatalities9
- Persons involved in fatal accidents21
- Pedestrians involved in fatal accidents4
Daylight
- Ventura(Based on 9 reports) 55.6%
- Ventura County(Based on 53 reports) 52.8%
- California(Based on 3,535 reports) 40.5%
Dark - Not Lighted
- Ventura(Based on 9 reports) 22.2%
- Ventura County(Based on 53 reports) 28.3%
- California(Based on 3,535 reports) 23.4%
Dark - Lighted
- Ventura(Based on 9 reports) 22.2%
- Ventura County(Based on 53 reports) 13.2%
- California(Based on 3,535 reports) 31.1%
Clear
- Ventura(Based on 9 reports) 88.9%
- Ventura County(Based on 53 reports) 79.2%
- California(Based on 3,533 reports) 82.3%
Unknown
- Ventura(Based on 9 reports) 11.1%
- Ventura County(Based on 53 reports) 20.8%
- California(Based on 3,533 reports) 14.0%
| # | Date | Location | Vehicles | Drunk persons | Fatalites | Persons | Pedestrians |
|---|
| 1 | Feb 2, 2016 11:36 PM | Us-101 | 1 | - | 1
| 1 | - |
| 2 | Feb 18, 2016 10:04 AM | Bristol Road, Sunridge Drive | 1 | - | 1
| 1 | 1 |
| 3 | Jul 3, 2016 08:45 PM | Sr-126 | 1 | 1
| 1 | 1 | - |
| 4 | May 31, 2016 08:35 AM | Darling Rd | 2 | - | 1
| 2 | - |
| 5 | Oct 16, 2016 01:40 PM | Sr-126 | 2 | 1
| 1 | 2 | - |
| 6 | May 30, 2016 03:00 AM | Blackburn Rd | 1 | - | 1
| 1 | 1 |
| 7 | Jul 22, 2016 02:25 PM | Sr-126 Ramp, Kimball Rd | 4 | - | 1
| 10 | - |
| 8 | Feb 19, 2016 00:02 AM | Telegraph Rd, Saticoy Ave | 1 | - | 1
| 1 | 1 |
| 9 | Aug 6, 2016 06:21 PM | Telephone Rd, Ramelli Ave | 1 | 1
| 1 | 2 | 1 |
Ventura fatal car crash and road traffic accident list for 2015
- Fatal accident count7
- Vehicles involved in fatal accidents11
- Fatal accidents involving drunk persons1
- Fatalities7
- Persons involved in fatal accidents10
- Pedestrians involved in fatal accidents4
Daylight
- Ventura(Based on 7 reports) 42.9%
- Ventura County(Based on 52 reports) 51.9%
- California(Based on 3,118 reports) 41.2%
Dark - Lighted
- Ventura(Based on 7 reports) 42.9%
- Ventura County(Based on 52 reports) 19.2%
- California(Based on 3,118 reports) 29.8%
Dark - Unknown Lighting
- Ventura(Based on 7 reports) 14.3%
- Ventura County(Based on 52 reports) 1.9%
- California(Based on 3,118 reports) 0.5%
Clear
- Ventura(Based on 7 reports) 100.0%
- Ventura County(Based on 52 reports) 82.7%
- California(Based on 3,114 reports) 84.9%
Ventura fatal car crash and road traffic accident list for 2014
- Fatal accident count6
- Vehicles involved in fatal accidents8
- Fatal accidents involving drunk persons2
- Fatalities6
- Persons involved in fatal accidents10
- Pedestrians involved in fatal accidents1
Dark - Lighted
- Ventura(Based on 6 reports) 50.0%
- Ventura County(Based on 44 reports) 27.3%
- California(Based on 2,819 reports) 29.9%
Daylight
- Ventura(Based on 6 reports) 33.3%
- Ventura County(Based on 44 reports) 47.7%
- California(Based on 2,819 reports) 42.9%
Dark - Not Lighted
- Ventura(Based on 6 reports) 16.7%
- Ventura County(Based on 44 reports) 22.7%
- California(Based on 2,819 reports) 22.6%
Clear
- Ventura(Based on 6 reports) 83.3%
- Ventura County(Based on 45 reports) 88.9%
- California(Based on 2,819 reports) 84.2%
Unknown
- Ventura(Based on 6 reports) 16.7%
- Ventura County(Based on 45 reports) 11.1%
- California(Based on 2,819 reports) 13.6%
Ventura fatal car crash and road traffic accident list for 2013
- Fatal accident count9
- Vehicles involved in fatal accidents11
- Fatalities11
- Persons involved in fatal accidents15
- Pedestrians involved in fatal accidents4
Daylight
- Ventura(Based on 9 reports) 66.7%
- Ventura County(Based on 61 reports) 54.1%
- California(Based on 2,765 reports) 44.7%
Dawn
- Ventura(Based on 9 reports) 22.2%
- Ventura County(Based on 61 reports) 4.9%
- California(Based on 2,765 reports) 2.1%
Dusk
- Ventura(Based on 9 reports) 11.1%
- Ventura County(Based on 61 reports) 1.6%
- California(Based on 2,765 reports) 2.6%
Clear
- Ventura(Based on 9 reports) 100.0%
- Ventura County(Based on 61 reports) 90.2%
- California(Based on 2,760 reports) 88.1%
| # | Date | Location | Vehicles | Drunk persons | Fatalites | Persons | Pedestrians |
|---|
| 1 | Feb 3, 2013 09:43 AM | Sr-3 | 1 | - | 1
| 1 | - |
| 2 | May 31, 2013 05:38 AM | Aurora Dr | 1 | - | 1
| - | 1 |
| 3 | Jul 3, 2013 10:59 AM | Halifax Ct | 2 | - | 1
| 1 | 1 |
| 4 | Aug 20, 2013 04:24 PM | Sr-23 | 1 | - | 1
| 2 | - |
| 5 | Sep 24, 2013 01:31 PM | Telegraph Rd | 1 | - | 2
| 5 | - |
| 6 | Oct 8, 2013 08:37 AM | Telegraph Rd | 2 | - | 2
| 2 | - |
| 7 | Oct 29, 2013 08:34 AM | Loma Vista Rd, Hillmont Ave | 1 | - | 1
| 1 | 1 |
| 8 | Nov 17, 2013 12:43 AM | Thompson Blvd, Figueroa St | 1 | - | 1
| 2 | 1 |
| 9 | Nov 19, 2013 04:40 PM | Sr-126 | 1 | - | 1
| 1 | - |
Ventura fatal car crash and road traffic accident list for 2012
- Fatal accident count6
- Vehicles involved in fatal accidents8
- Fatal accidents involving drunk persons3
- Fatalities7
- Persons involved in fatal accidents12
- Pedestrians involved in fatal accidents2
Daylight
- Ventura(Based on 6 reports) 50.0%
- Ventura County(Based on 46 reports) 69.6%
- California(Based on 2,727 reports) 44.2%
Dark - Lighted
- Ventura(Based on 6 reports) 33.3%
- Ventura County(Based on 46 reports) 17.4%
- California(Based on 2,727 reports) 27.5%
Dusk
- Ventura(Based on 6 reports) 16.7%
- Ventura County(Based on 46 reports) 6.5%
- California(Based on 2,727 reports) 2.2%
Clear
- Ventura(Based on 6 reports) 66.7%
- Ventura County(Based on 46 reports) 91.3%
- California(Based on 2,728 reports) 82.3%
Unknown
- Ventura(Based on 6 reports) 16.7%
- Ventura County(Based on 46 reports) 6.5%
- California(Based on 2,728 reports) 15.0%
Rain
- Ventura(Based on 6 reports) 16.7%
- Ventura County(Based on 46 reports) 2.2%
- California(Based on 2,728 reports) 4.3%
Ventura fatal car crash and road traffic accident list for 2011
- Fatal accident count10
- Vehicles involved in fatal accidents14
- Fatal accidents involving drunk persons6
- Fatalities10
- Persons involved in fatal accidents20
- Pedestrians involved in fatal accidents4
Dark - Not Lighted
- Ventura(Based on 10 reports) 40.0%
- Ventura County(Based on 62 reports) 32.3%
- California(Based on 2,591 reports) 22.3%
Daylight
- Ventura(Based on 10 reports) 30.0%
- Ventura County(Based on 62 reports) 43.5%
- California(Based on 2,591 reports) 45.3%
Dark - Lighted
- Ventura(Based on 10 reports) 30.0%
- Ventura County(Based on 62 reports) 21.0%
- California(Based on 2,591 reports) 28.1%
Clear
- Ventura(Based on 10 reports) 100.0%
- Ventura County(Based on 62 reports) 88.7%
- California(Based on 2,581 reports) 81.3%
| # | Date | Location | Vehicles | Drunk persons | Fatalites | Persons | Pedestrians |
|---|
| 1 | Feb 12, 2011 11:57 PM | Us-101 | 1 | 1
| 1 | 1 | - |
| 2 | Mar 18, 2011 06:56 AM | Ventura Ave | 1 | - | 1
| 1 | - |
| 3 | May 11, 2011 06:45 PM | Telegraph Rd, Mara Ave | 1 | 1
| 1 | 1 | 1 |
| 4 | May 27, 2011 04:50 AM | Us-101 | 3 | - | 1
| 4 | - |
| 5 | Jul 29, 2011 11:00 PM | Us-101 | 1 | - | 1
| 3 | 1 |
| 6 | Oct 19, 2011 11:57 PM | Wendy Dr | 1 | 1
| 1 | 1 | - |
| 7 | Apr 3, 2011 02:35 AM | Fir St (Aly), Poli St | 1 | 1
| 1 | 3 | 1 |
| 8 | Dec 30, 2011 09:39 AM | Harbor Bl | 2 | 1
| 1 | 3 | - |
| 9 | Oct 8, 2011 11:28 PM | Thompson Blvd | 2 | 1
| 1 | 2 | - |
| 10 | Dec 21, 2011 06:25 AM | Ventura Ave, Shoshone St | 1 | - | 1
| 1 | 1 |
Ventura fatal car crash and road traffic accident list for 2010
- Fatal accident count4
- Vehicles involved in fatal accidents6
- Fatal accidents involving drunk persons2
- Fatalities4
- Persons involved in fatal accidents6
Daylight
- Ventura(Based on 4 reports) 75.0%
- Ventura County(Based on 40 reports) 52.5%
- California(Based on 2,501 reports) 42.5%
Dark - Lighted
- Ventura(Based on 4 reports) 25.0%
- Ventura County(Based on 40 reports) 20.0%
- California(Based on 2,501 reports) 28.1%
Clear
- Ventura(Based on 4 reports) 100.0%
- Ventura County(Based on 40 reports) 72.5%
- California(Based on 2,495 reports) 77.2%
Ventura fatal car crash and road traffic accident list for 2009
- Fatal accident count4
- Vehicles involved in fatal accidents6
- Fatalities4
- Persons involved in fatal accidents9
- Pedestrians involved in fatal accidents2
Daylight
- Ventura(Based on 4 reports) 75.0%
- Ventura County(Based on 57 reports) 52.6%
- California(Based on 2,811 reports) 45.3%
Dark - Lighted
- Ventura(Based on 4 reports) 25.0%
- Ventura County(Based on 57 reports) 26.3%
- California(Based on 2,811 reports) 26.0%
Clear
- Ventura(Based on 4 reports) 100.0%
- Ventura County(Based on 57 reports) 94.7%
- California(Based on 2,816 reports) 94.7%
Ventura fatal car crash and road traffic accident list for 2008
- Fatal accident count8
- Vehicles involved in fatal accidents14
- Fatal accidents involving drunk persons2
- Fatalities8
- Persons involved in fatal accidents20
- Pedestrians involved in fatal accidents2
Daylight
- Ventura(Based on 8 reports) 50.0%
- Ventura County(Based on 65 reports) 56.9%
- California(Based on 3,141 reports) 45.7%
Dark - Lighted
- Ventura(Based on 8 reports) 37.5%
- Ventura County(Based on 65 reports) 18.5%
- California(Based on 3,141 reports) 25.0%
Dusk
- Ventura(Based on 8 reports) 12.5%
- Ventura County(Based on 65 reports) 3.1%
- California(Based on 3,141 reports) 2.0%
Clear
- Ventura(Based on 8 reports) 100.0%
- Ventura County(Based on 65 reports) 95.4%
- California(Based on 3,145 reports) 94.2%
| # | Date | Location | Vehicles | Drunk persons | Fatalites | Persons | Pedestrians |
|---|
| 1 | Jan 31, 2008 07:04 PM | Sr-126, Kimball Rd | 2 | - | 1
| 2 | - |
| 2 | Mar 4, 2008 05:24 PM | Thompson Bl, Ash St | 1 | 1
| 1 | 3 | 1 |
| 3 | Mar 21, 2008 08:40 PM | Harbor Bl | 1 | 1
| 1 | 2 | 1 |
| 4 | Mar 14, 2008 01:33 PM | Montgomery Ave, Cheshire St | 2 | - | 1
| 2 | - |
| 5 | Apr 20, 2008 06:40 PM | Sr-33 | 1 | - | 1
| 4 | - |
| 6 | Jul 11, 2008 10:03 PM | Johnson Dr | 1 | - | 1
| 1 | - |
| 7 | Jul 25, 2008 09:50 AM | Us-101 | 2 | - | 1
| 2 | - |
| 8 | Sep 18, 2008 03:10 PM | Main St | 4 | - | 1
| 4 | - |
Ventura fatal car crash and road traffic accident list for 2007
- Fatal accident count8
- Vehicles involved in fatal accidents9
- Fatal accidents involving drunk persons3
- Fatalities8
- Persons involved in fatal accidents18
- Pedestrians involved in fatal accidents4
Dark - Lighted
- Ventura(Based on 8 reports) 50.0%
- Ventura County(Based on 71 reports) 23.9%
- California(Based on 3,574 reports) 25.2%
Daylight
- Ventura(Based on 8 reports) 25.0%
- Ventura County(Based on 71 reports) 47.9%
- California(Based on 3,574 reports) 46.4%
Dawn
- Ventura(Based on 8 reports) 12.5%
- Ventura County(Based on 71 reports) 4.2%
- California(Based on 3,574 reports) 1.8%
Dark - Not Lighted
- Ventura(Based on 8 reports) 12.5%
- Ventura County(Based on 71 reports) 22.5%
- California(Based on 3,574 reports) 24.2%
Clear
- Ventura(Based on 8 reports) 100.0%
- Ventura County(Based on 72 reports) 90.3%
- California(Based on 3,591 reports) 95.4%
| # | Date | Location | Vehicles | Drunk persons | Fatalites | Persons | Pedestrians |
|---|
| 1 | Apr 12, 2007 09:02 PM | Harbor Blvd | 1 | 1
| 1 | 2 | 1 |
| 2 | Apr 25, 2007 09:20 PM | Sr-126 | 1 | - | 1
| 1 | - |
| 3 | Jun 16, 2007 06:50 AM | Us-101 Ramp | 1 | - | 1
| 2 | - |
| 4 | Jul 20, 2007 09:07 PM | Victoria Ave, Thille St | 1 | - | 1
| 2 | 1 |
| 5 | Jun 24, 2007 10:45 AM | Telephone Rd, Johnson Dr | 2 | - | 1
| 6 | - |
| 6 | Sep 9, 2007 06:05 AM | Us-101 | 1 | - | 1
| 1 | - |
| 7 | Oct 11, 2007 06:50 PM | Us-101 | 1 | 1
| 1 | 2 | 1 |
| 8 | Oct 31, 2007 11:40 PM | Us-101 Ramp | 1 | 1
| 1 | 2 | 1 |
Ventura fatal car crash and road traffic accident list for 2006
- Fatal accident count10
- Vehicles involved in fatal accidents12
- Fatal accidents involving drunk persons4
- Fatalities11
- Persons involved in fatal accidents18
- Pedestrians involved in fatal accidents2
Daylight
- Ventura(Based on 10 reports) 40.0%
- Ventura County(Based on 74 reports) 56.8%
- California(Based on 3,824 reports) 45.4%
Dark - Not Lighted
- Ventura(Based on 10 reports) 30.0%
- Ventura County(Based on 74 reports) 18.9%
- California(Based on 3,824 reports) 25.2%
Dark - Lighted
- Ventura(Based on 10 reports) 20.0%
- Ventura County(Based on 74 reports) 20.3%
- California(Based on 3,824 reports) 25.2%
Dusk
- Ventura(Based on 10 reports) 10.0%
- Ventura County(Based on 74 reports) 4.1%
- California(Based on 3,824 reports) 2.2%
Clear
- Ventura(Based on 10 reports) 90.0%
- Ventura County(Based on 74 reports) 91.9%
- California(Based on 3,839 reports) 93.9%
Rain
- Ventura(Based on 10 reports) 10.0%
- Ventura County(Based on 74 reports) 5.4%
- California(Based on 3,839 reports) 4.3%
| # | Date | Location | Vehicles | Drunk persons | Fatalites | Persons | Pedestrians |
|---|
| 1 | Jan 27, 2006 00:01 AM | Foothill Rd | 1 | 1
| 1 | 1 | - |
| 2 | Mar 18, 2006 11:12 PM | Seaward Ave | 1 | - | 1
| 1 | - |
| 3 | Jul 21, 2006 10:08 PM | Avenida Delas Flores | 1 | 1
| 1 | 3 | 1 |
| 4 | Mar 26, 2006 00:18 AM | Us-101 | 1 | 1
| 1 | 1 | - |
| 5 | Jun 20, 2006 01:00 PM | Sr-33 Ramp | 1 | - | 1
| 3 | 1 |
| 6 | Sep 10, 2006 03:34 PM | Sr-33 | 1 | - | 2
| 2 | - |
| 7 | Sep 7, 2006 06:40 PM | Moon Dr | 1 | - | 1
| 1 | - |
| 8 | Oct 1, 2006 12:48 AM | Foothill Rd | 2 | - | 1
| 3 | - |
| 9 | Sep 25, 2006 00:02 AM | Sr-33 | 1 | 1
| 1 | 1 | - |
| 10 | Nov 6, 2006 11:57 AM | Telephone Rd | 2 | - | 1
| 2 | - |
Ventura fatal car crash and road traffic accident list for 2005
- Fatal accident count10
- Vehicles involved in fatal accidents13
- Fatal accidents involving drunk persons6
- Fatalities10
- Persons involved in fatal accidents19
- Pedestrians involved in fatal accidents2
Daylight
- Ventura(Based on 10 reports) 40.0%
- Ventura County(Based on 63 reports) 57.1%
- California(Based on 3,842 reports) 46.3%
Dark - Lighted
- Ventura(Based on 10 reports) 40.0%
- Ventura County(Based on 63 reports) 25.4%
- California(Based on 3,842 reports) 24.4%
Dark - Not Lighted
- Ventura(Based on 10 reports) 20.0%
- Ventura County(Based on 63 reports) 17.5%
- California(Based on 3,842 reports) 25.3%
Clear
- Ventura(Based on 10 reports) 100.0%
- Ventura County(Based on 63 reports) 90.5%
- California(Based on 3,849 reports) 92.3%
| # | Date | Location | Vehicles | Drunk persons | Fatalites | Persons | Pedestrians |
|---|
| 1 | Apr 27, 2005 02:42 AM | Lomita Ave | 1 | 1
| 1 | 1 | - |
| 2 | Apr 20, 2005 06:57 PM | Telegraph Rd, Brookshire Ave | 2 | - | 1
| 2 | - |
| 3 | Apr 30, 2005 00:51 AM | Us-101 | 1 | 1
| 1 | 2 | - |
| 4 | Jun 1, 2005 07:50 PM | Us-101 | 1 | 1
| 1 | 2 | - |
| 5 | Jun 3, 2005 08:11 AM | Market | 2 | - | 1
| 2 | - |
| 6 | Jul 16, 2005 01:43 PM | Foothill Rd, Agnus Dr | 2 | - | 1
| 2 | - |
| 7 | Sep 11, 2005 09:17 PM | Thompson Blvd, Christman Ave | 1 | 1
| 1 | 2 | 1 |
| 8 | Oct 26, 2005 03:03 PM | California St | 1 | - | 1
| 1 | - |
| 9 | Dec 7, 2005 09:05 PM | Olivas Park Dr | 1 | 1
| 1 | 1 | - |
| 10 | Dec 18, 2005 00:35 AM | Us-101 | 1 | 1
| 1 | 4 | 1 |
Ventura fatal car crash and road traffic accident list for 2004
- Fatal accident count4
- Vehicles involved in fatal accidents5
- Fatal accidents involving drunk persons2
- Fatalities5
- Persons involved in fatal accidents7
Daylight
- Ventura(Based on 4 reports) 50.0%
- Ventura County(Based on 66 reports) 53.0%
- California(Based on 3,720 reports) 47.3%
Dark - Lighted
- Ventura(Based on 4 reports) 50.0%
- Ventura County(Based on 66 reports) 19.7%
- California(Based on 3,720 reports) 23.6%
Clear
- Ventura(Based on 4 reports) 75.0%
- Ventura County(Based on 66 reports) 89.4%
- California(Based on 3,727 reports) 93.5%
Rain
- Ventura(Based on 4 reports) 25.0%
- Ventura County(Based on 66 reports) 7.6%
- California(Based on 3,727 reports) 4.3%
| # | Date | Location | Vehicles | Drunk persons | Fatalites | Persons | Pedestrians |
|---|
| 1 | May 7, 2004 00:22 AM | Golf Course Rd | 1 | - | 1
| 1 | - |
| 2 | Jun 17, 2004 10:40 PM | Kimball Rd, Sr-126 | 2 | 2
| 2 | 3 | - |
| 3 | Sep 30, 2004 01:50 PM | Sr-33 | 1 | - | 1
| 2 | - |
| 4 | Dec 27, 2004 09:25 AM | Us-101 | 1 | - | 1
| 1 | - |
Ventura fatal car crash and road traffic accident list for 2003
- Fatal accident count7
- Vehicles involved in fatal accidents8
- Fatal accidents involving drunk persons1
- Fatalities8
- Persons involved in fatal accidents15
- Pedestrians involved in fatal accidents1
Daylight
- Ventura(Based on 7 reports) 57.1%
- Ventura County(Based on 72 reports) 54.2%
- California(Based on 3,724 reports) 48.3%
Dark - Not Lighted
- Ventura(Based on 7 reports) 28.6%
- Ventura County(Based on 72 reports) 26.4%
- California(Based on 3,724 reports) 25.5%
Dark - Lighted
- Ventura(Based on 7 reports) 14.3%
- Ventura County(Based on 72 reports) 15.3%
- California(Based on 3,724 reports) 22.7%
Clear
- Ventura(Based on 7 reports) 100.0%
- Ventura County(Based on 72 reports) 94.4%
- California(Based on 3,731 reports) 93.3%
| # | Date | Location | Vehicles | Drunk persons | Fatalites | Persons | Pedestrians |
|---|
| 1 | Apr 10, 2003 03:14 AM | Quincy St | 1 | - | 1
| 2 | - |
| 2 | Jun 19, 2003 09:38 AM | Us-101 | 1 | - | 1
| 2 | - |
| 3 | Aug 14, 2003 05:34 PM | Us-101 | 1 | - | 2
| 2 | - |
| 4 | Aug 16, 2003 09:50 PM | Potrero Rd | 1 | - | 1
| 4 | - |
| 5 | Oct 28, 2003 10:26 AM | Telegraph Rd | 1 | - | 1
| 2 | 1 |
| 6 | Jul 10, 2003 04:03 PM | Us-101 | 2 | - | 1
| 2 | - |
| 7 | Dec 3, 2003 08:47 PM | Foothill Rd | 1 | 1
| 1 | 1 | - |
Ventura fatal car crash and road traffic accident list for 2002
- Fatal accident count9
- Vehicles involved in fatal accidents15
- Fatal accidents involving drunk persons1
- Fatalities10
- Persons involved in fatal accidents31
- Pedestrians involved in fatal accidents5
Daylight
- Ventura(Based on 9 reports) 44.4%
- Ventura County(Based on 62 reports) 43.5%
- California(Based on 3,640 reports) 46.9%
Dark - Lighted
- Ventura(Based on 9 reports) 33.3%
- Ventura County(Based on 62 reports) 25.8%
- California(Based on 3,640 reports) 22.7%
Dusk
- Ventura(Based on 9 reports) 11.1%
- Ventura County(Based on 62 reports) 6.5%
- California(Based on 3,640 reports) 2.6%
Dark - Not Lighted
- Ventura(Based on 9 reports) 11.1%
- Ventura County(Based on 62 reports) 19.4%
- California(Based on 3,640 reports) 26.0%
Clear
- Ventura(Based on 9 reports) 100.0%
- Ventura County(Based on 62 reports) 95.2%
- California(Based on 3,654 reports) 93.8%
| # | Date | Location | Vehicles | Drunk persons | Fatalites | Persons | Pedestrians |
|---|
| 1 | Feb 14, 2002 04:37 PM | Ventura Ave | 1 | 1
| 1 | 3 | 1 |
| 2 | Mar 1, 2002 01:53 PM | Sr-126 | 4 | - | 1
| 4 | - |
| 3 | Mar 30, 2002 10:45 PM | Foothill Rd | 1 | - | 1
| 1 | - |
| 4 | Jul 25, 2002 08:30 PM | Telephone Rd | 1 | - | 2
| 4 | 2 |
| 5 | Aug 7, 2002 07:25 PM | Telephone Rd | 1 | - | 1
| 2 | 1 |
| 6 | May 19, 2002 03:36 AM | Victoria Ave | 1 | - | 1
| 2 | - |
| 7 | Oct 29, 2002 06:00 PM | Telephone Rd | 4 | - | 1
| 11 | - |
| 8 | Dec 10, 2002 12:13 AM | Main St | 1 | - | 1
| 2 | 1 |
| 9 | Oct 23, 2002 01:55 PM | Sr-33 | 1 | - | 1
| 2 | - |
Ventura fatal car crash and road traffic accident list for 2001
- Fatal accident count9
- Vehicles involved in fatal accidents10
- Fatal accidents involving drunk persons1
- Fatalities10
- Persons involved in fatal accidents21
- Pedestrians involved in fatal accidents5
Daylight
- Ventura(Based on 9 reports) 55.6%
- Ventura County(Based on 65 reports) 56.9%
- California(Based on 3,532 reports) 48.8%
Dark - Lighted
- Ventura(Based on 9 reports) 33.3%
- Ventura County(Based on 65 reports) 18.5%
- California(Based on 3,532 reports) 22.6%
Dark - Not Lighted
- Ventura(Based on 9 reports) 11.1%
- Ventura County(Based on 65 reports) 18.5%
- California(Based on 3,532 reports) 24.3%
Clear
- Ventura(Based on 9 reports) 88.9%
- Ventura County(Based on 66 reports) 89.4%
- California(Based on 3,543 reports) 92.0%
Rain
- Ventura(Based on 9 reports) 11.1%
- Ventura County(Based on 66 reports) 9.1%
- California(Based on 3,543 reports) 6.0%
| # | Date | Location | Vehicles | Drunk persons | Fatalites | Persons | Pedestrians |
|---|
| 1 | Feb 9, 2001 00:35 AM | Us-101 | 1 | - | 1
| 2 | 1 |
| 2 | Apr 30, 2001 02:35 AM | Us-101 | 1 | - | 1
| 1 | - |
| 3 | May 4, 2001 00:59 AM | Thompson Blvd | 1 | - | 1
| 1 | - |
| 4 | May 10, 2001 11:37 PM | Harbor Blvd | 2 | - | 1
| 5 | - |
| 5 | May 3, 2001 05:42 PM | Us-101 | 1 | - | 1
| 4 | 3 |
| 6 | May 27, 2001 12:35 AM | Sr-33 | 1 | - | 1
| 1 | - |
| 7 | Jul 28, 2001 08:34 AM | Telephone Rd | 1 | - | 1
| 3 | 1 |
| 8 | Jun 11, 2001 10:58 AM | Us-101 | 1 | 1
| 2 | 3 | - |
| 9 | Dec 20, 2001 08:52 AM | Sr-33 | 1 | - | 1
| 1 | - |
Ventura fatal car crash and road traffic accident list for 2000
- Fatal accident count12
- Vehicles involved in fatal accidents17
- Fatal accidents involving drunk persons4
- Fatalities13
- Persons involved in fatal accidents33
- Pedestrians involved in fatal accidents4
Daylight
- Ventura(Based on 12 reports) 41.7%
- Ventura County(Based on 83 reports) 47.0%
- California(Based on 3,343 reports) 48.2%
Dark - Lighted
- Ventura(Based on 12 reports) 33.3%
- Ventura County(Based on 83 reports) 25.3%
- California(Based on 3,343 reports) 22.7%
Dark - Not Lighted
- Ventura(Based on 12 reports) 25.0%
- Ventura County(Based on 83 reports) 24.1%
- California(Based on 3,343 reports) 24.9%
Clear
- Ventura(Based on 12 reports) 100.0%
- Ventura County(Based on 83 reports) 92.8%
- California(Based on 3,348 reports) 93.2%
| # | Date | Location | Vehicles | Drunk persons | Fatalites | Persons | Pedestrians |
|---|
| 1 | Jan 16, 2000 08:40 AM | Us-101 | 1 | 1
| 1 | 3 | - |
| 2 | Jan 16, 2000 09:04 AM | Harbor Blvd | 2 | - | 1
| 3 | - |
| 3 | Apr 7, 2000 00:32 AM | Us-101 | 1 | - | 2
| 2 | - |
| 4 | Jul 15, 2000 09:52 PM | Ventura Ave | 1 | - | 1
| 2 | - |
| 5 | Mar 24, 2000 09:29 PM | Victoria Ave | 2 | - | 1
| 4 | - |
| 6 | Aug 17, 2000 11:20 PM | Los Angeles Ave | 1 | 1
| 1 | 1 | - |
| 7 | Sep 26, 2000 05:12 PM | Harbor Blvd | 2 | - | 1
| 5 | - |
| 8 | Nov 6, 2000 07:21 AM | Telephone Rd | 1 | - | 1
| 2 | 1 |
| 9 | Jun 4, 2000 06:32 PM | Thompson Blvd | 3 | 2
| 1 | 5 | - |
| 10 | Dec 16, 2000 11:31 PM | Sr-33 | 1 | - | 1
| 2 | 1 |
| 11 | Dec 23, 2000 11:48 PM | Donlon St | 1 | - | 1
| 2 | 1 |
| 12 | Dec 25, 2000 08:20 PM | Us-101 | 1 | - | 1
| 2 | 1 |
Ventura fatal car crash and road traffic accident list for 1999
- Fatal accident count6
- Vehicles involved in fatal accidents7
- Fatal accidents involving drunk persons2
- Fatalities7
- Persons involved in fatal accidents19
- Pedestrians involved in fatal accidents2
Daylight
- Ventura(Based on 6 reports) 50.0%
- Ventura County(Based on 53 reports) 54.7%
- California(Based on 3,137 reports) 48.1%
Dark - Lighted
- Ventura(Based on 6 reports) 33.3%
- Ventura County(Based on 53 reports) 18.9%
- California(Based on 3,137 reports) 22.8%
Dark - Not Lighted
- Ventura(Based on 6 reports) 16.7%
- Ventura County(Based on 53 reports) 24.5%
- California(Based on 3,137 reports) 25.2%
Clear
- Ventura(Based on 6 reports) 100.0%
- Ventura County(Based on 53 reports) 98.1%
- California(Based on 3,148 reports) 93.8%
| # | Date | Location | Vehicles | Drunk persons | Fatalites | Persons | Pedestrians |
|---|
| 1 | Jan 26, 1999 08:58 PM | Us-101 | 1 | 1
| 1 | 2 | 1 |
| 2 | Apr 17, 1999 04:26 PM | Prospect St | 1 | 1
| 1 | 1 | - |
| 3 | Jul 17, 1999 07:39 PM | Us-101 | 1 | - | 1
| 2 | - |
| 4 | Feb 2, 1999 09:48 PM | Main St | 1 | - | 2
| 2 | - |
| 5 | Nov 25, 1999 02:10 AM | Main St | 1 | - | 1
| 3 | 1 |
| 6 | Nov 21, 1999 12:30 AM | Valentine Road | 2 | - | 1
| 9 | - |
Ventura fatal car crash and road traffic accident list for 1998
- Fatal accident count8
- Vehicles involved in fatal accidents9
- Fatal accidents involving drunk persons2
- Fatalities8
- Persons involved in fatal accidents18
- Pedestrians involved in fatal accidents3
Daylight
- Ventura(Based on 8 reports) 62.5%
- Ventura County(Based on 56 reports) 53.6%
- California(Based on 3,110 reports) 49.0%
Dark - Lighted
- Ventura(Based on 8 reports) 25.0%
- Ventura County(Based on 56 reports) 23.2%
- California(Based on 3,110 reports) 22.2%
Dark - Not Lighted
- Ventura(Based on 8 reports) 12.5%
- Ventura County(Based on 56 reports) 19.6%
- California(Based on 3,110 reports) 24.4%
Clear
- Ventura(Based on 8 reports) 100.0%
- Ventura County(Based on 56 reports) 94.6%
- California(Based on 3,112 reports) 89.7%
| # | Date | Location | Vehicles | Drunk persons | Fatalites | Persons | Pedestrians |
|---|
| 1 | Feb 28, 1998 06:37 PM | Thompson Blvd | 1 | 1
| 1 | 2 | 1 |
| 2 | May 19, 1998 01:13 PM | Ventura Ave | 1 | - | 1
| 2 | 1 |
| 3 | Jun 2, 1998 05:47 PM | Us-101 | 1 | - | 1
| 3 | - |
| 4 | Jul 27, 1998 06:01 PM | Lincoln Dr | 1 | - | 1
| 1 | - |
| 5 | Aug 31, 1998 09:45 AM | Sr-126 | 1 | - | 1
| 3 | - |
| 6 | Aug 12, 1998 06:49 PM | Telephone Road | 2 | - | 1
| 2 | - |
| 7 | Oct 18, 1998 07:55 PM | Main St | 1 | - | 1
| 3 | 1 |
| 8 | Dec 27, 1998 01:45 AM | Sr-33 | 1 | 1
| 1 | 2 | - |
Ventura fatal car crash and road traffic accident list for 1997
- Fatal accident count11
- Vehicles involved in fatal accidents13
- Fatal accidents involving drunk persons4
- Fatalities11
- Persons involved in fatal accidents25
- Pedestrians involved in fatal accidents3
Daylight
- Ventura(Based on 11 reports) 45.5%
- Ventura County(Based on 58 reports) 62.1%
- California(Based on 3,271 reports) 49.1%
Dark - Lighted
- Ventura(Based on 11 reports) 45.5%
- Ventura County(Based on 58 reports) 19.0%
- California(Based on 3,271 reports) 21.9%
Dark - Not Lighted
- Ventura(Based on 11 reports) 9.1%
- Ventura County(Based on 58 reports) 12.1%
- California(Based on 3,271 reports) 24.6%
Clear
- Ventura(Based on 11 reports) 90.9%
- Ventura County(Based on 58 reports) 96.6%
- California(Based on 3,279 reports) 93.8%
Rain
- Ventura(Based on 11 reports) 9.1%
- Ventura County(Based on 58 reports) 1.7%
- California(Based on 3,279 reports) 4.8%
| # | Date | Location | Vehicles | Drunk persons | Fatalites | Persons | Pedestrians |
|---|
| 1 | Jan 22, 1997 11:15 PM | 101 | 1 | - | 1
| 1 | - |
| 2 | Feb 27, 1997 09:41 AM | Telegraph | 1 | - | 1
| 2 | 1 |
| 3 | May 27, 1997 03:38 PM | 101 | 1 | - | 1
| 1 | - |
| 4 | Jul 9, 1997 01:35 PM | 126 | 2 | 1
| 1 | 4 | - |
| 5 | Jul 25, 1997 09:15 PM | 101 | 1 | 1
| 1 | 1 | - |
| 6 | Apr 24, 1997 02:35 AM | Olive St | 1 | 1
| 1 | 2 | - |
| 7 | Aug 25, 1997 06:35 AM | 101 | 2 | - | 1
| 3 | - |
| 8 | Jan 12, 1997 11:50 PM | Telephone | 1 | 1
| 1 | 2 | - |
| 9 | Aug 31, 1997 12:16 AM | Telegraph | 1 | - | 1
| 2 | 1 |
| 10 | Oct 16, 1997 06:48 PM | Thompsonbl | 1 | - | 1
| 2 | 1 |
| 11 | Oct 16, 1997 07:25 PM | 33 | 1 | - | 1
| 5 | - |
Ventura fatal car crash and road traffic accident list for 1996
- Fatal accident count6
- Vehicles involved in fatal accidents10
- Fatal accidents involving drunk persons1
- Fatalities6
- Persons involved in fatal accidents18
- Pedestrians involved in fatal accidents1
Daylight
- Ventura(Based on 6 reports) 66.7%
- Ventura County(Based on 63 reports) 49.2%
- California(Based on 3,568 reports) 46.5%
Dawn
- Ventura(Based on 6 reports) 16.7%
- Ventura County(Based on 63 reports) 6.3%
- California(Based on 3,568 reports) 2.2%
Dark - Lighted
- Ventura(Based on 6 reports) 16.7%
- Ventura County(Based on 63 reports) 25.4%
- California(Based on 3,568 reports) 23.8%
Clear
- Ventura(Based on 6 reports) 100.0%
- Ventura County(Based on 63 reports) 92.1%
- California(Based on 3,576 reports) 91.7%
| # | Date | Location | Vehicles | Drunk persons | Fatalites | Persons | Pedestrians |
|---|
| 1 | Mar 23, 1996 04:52 PM | Main St | 2 | 1
| 1 | 5 | - |
| 2 | May 19, 1996 11:40 AM | Telegraph | 1 | - | 1
| 2 | 1 |
| 3 | Jul 26, 1996 05:50 AM | 101 | 1 | - | 1
| 1 | - |
| 4 | Aug 1, 1996 01:14 AM | Telephonrd | 1 | - | 1
| 1 | - |
| 5 | Oct 10, 1996 11:14 AM | Telephone | 3 | - | 1
| 4 | - |
| 6 | Oct 24, 1996 11:36 AM | Telegraph | 2 | - | 1
| 5 | - |
Ventura fatal car crash and road traffic accident list for 1995
| # | Date | Location | Vehicles | Drunk persons | Fatalites | Persons | Pedestrians |
|---|
| 1 | Apr 29, 1995 06:33 AM | Thompsonbl | 1 | - | 1
| 2 | 1 |
| 2 | Aug 2, 1995 03:29 PM | Bristol Rd | 2 | - | 1
| 3 | - |
Ventura fatal car crash and road traffic accident list for 1994
- Fatal accident count10
- Vehicles involved in fatal accidents13
- Fatal accidents involving drunk persons2
- Fatalities10
- Persons involved in fatal accidents26
- Pedestrians involved in fatal accidents5
Daylight
- Ventura(Based on 10 reports) 60.0%
- Ventura County(Based on 77 reports) 59.7%
- California(Based on 3,784 reports) 48.6%
Dark - Not Lighted
- Ventura(Based on 10 reports) 20.0%
- Ventura County(Based on 77 reports) 20.8%
- California(Based on 3,784 reports) 23.9%
Dark - Lighted
- Ventura(Based on 10 reports) 20.0%
- Ventura County(Based on 77 reports) 14.3%
- California(Based on 3,784 reports) 23.3%
Clear
- Ventura(Based on 10 reports) 100.0%
- Ventura County(Based on 77 reports) 93.5%
- California(Based on 3,787 reports) 93.1%
| # | Date | Location | Vehicles | Drunk persons | Fatalites | Persons | Pedestrians |
|---|
| 1 | Feb 26, 1994 02:55 PM | Telephone | 2 | - | 1
| 4 | - |
| 2 | Apr 1, 1994 01:30 PM | Simpson St | 1 | - | 1
| 2 | 1 |
| 3 | Jun 3, 1994 04:48 PM | Valentine | 2 | - | 1
| 4 | - |
| 4 | Jul 7, 1994 01:25 AM | 101 | 1 | 1
| 1 | 1 | - |
| 5 | Aug 17, 1994 08:25 AM | Telephone | 1 | - | 1
| 2 | 1 |
| 6 | Sep 11, 1994 09:06 PM | Thompsonbl | 1 | - | 1
| 2 | 1 |
| 7 | Aug 31, 1994 11:50 PM | Victoriaav | 1 | - | 1
| 3 | 1 |
| 8 | Sep 21, 1994 06:04 PM | Blackburn | 1 | - | 1
| 2 | 1 |
| 9 | Dec 4, 1994 02:10 AM | 101 | 1 | 1
| 1 | 1 | - |
| 10 | Nov 3, 1994 12:00 AM | Telegraph | 2 | - | 1
| 5 | - |
Ventura fatal car crash and road traffic accident list for 1993
- Fatal accident count5
- Vehicles involved in fatal accidents6
- Fatal accidents involving drunk persons2
- Fatalities5
- Persons involved in fatal accidents9
- Pedestrians involved in fatal accidents2
Daylight
- Ventura(Based on 5 reports) 40.0%
- Ventura County(Based on 62 reports) 46.8%
- California(Based on 3,682 reports) 46.1%
Dark - Not Lighted
- Ventura(Based on 5 reports) 40.0%
- Ventura County(Based on 62 reports) 25.8%
- California(Based on 3,682 reports) 26.0%
Dark - Lighted
- Ventura(Based on 5 reports) 20.0%
- Ventura County(Based on 62 reports) 27.4%
- California(Based on 3,682 reports) 24.0%
Clear
- Ventura(Based on 5 reports) 100.0%
- Ventura County(Based on 63 reports) 95.2%
- California(Based on 3,687 reports) 93.4%
| # | Date | Location | Vehicles | Drunk persons | Fatalites | Persons | Pedestrians |
|---|
| 1 | Jul 18, 1993 03:48 AM | Telegraph | 1 | 1
| 1 | 1 | - |
| 2 | Aug 31, 1993 06:49 PM | Foothillrd | 1 | - | 1
| 2 | 1 |
| 3 | Nov 23, 1993 10:35 PM | 126 | 1 | - | 1
| 2 | 1 |
| 4 | Sep 6, 1993 01:55 AM | 101 | 1 | 1
| 1 | 2 | - |
| 5 | Oct 24, 1993 04:35 PM | Harbor Bl | 2 | - | 1
| 2 | - |
Ventura fatal car crash and road traffic accident list for 1992
- Fatal accident count8
- Vehicles involved in fatal accidents13
- Fatal accidents involving drunk persons4
- Fatalities8
- Persons involved in fatal accidents27
- Pedestrians involved in fatal accidents4
Daylight
- Ventura(Based on 8 reports) 50.0%
- Ventura County(Based on 70 reports) 48.6%
- California(Based on 3,717 reports) 45.5%
Dark - Not Lighted
- Ventura(Based on 8 reports) 25.0%
- Ventura County(Based on 70 reports) 24.3%
- California(Based on 3,717 reports) 25.6%
Dark - Lighted
- Ventura(Based on 8 reports) 25.0%
- Ventura County(Based on 70 reports) 22.9%
- California(Based on 3,717 reports) 25.2%
Clear
- Ventura(Based on 8 reports) 100.0%
- Ventura County(Based on 70 reports) 94.3%
- California(Based on 3,722 reports) 92.3%
| # | Date | Location | Vehicles | Drunk persons | Fatalites | Persons | Pedestrians |
|---|
| 1 | Jan 17, 1992 12:35 AM | Wells Road | 3 | - | 1
| 4 | - |
| 2 | Apr 4, 1992 02:06 PM | Telegraph | 3 | - | 1
| 7 | 2 |
| 3 | Apr 18, 1992 01:29 AM | Foothillrd | 1 | 1
| 1 | 4 | - |
| 4 | Jun 16, 1992 09:06 PM | Foothillrd | 1 | 1
| 1 | 3 | - |
| 5 | Sep 24, 1992 08:14 PM | Telegraph | 1 | 1
| 1 | 2 | 1 |
| 6 | Oct 4, 1992 07:41 AM | Victoriaav | 2 | - | 1
| 2 | - |
| 7 | Dec 16, 1992 01:47 PM | Viaarroyo | 1 | - | 1
| 3 | 1 |
| 8 | Dec 22, 1992 09:15 PM | 33 | 1 | 1
| 1 | 2 | - |
Ventura fatal car crash and road traffic accident list for 1991
- Fatal accident count9
- Vehicles involved in fatal accidents14
- Fatal accidents involving drunk persons2
- Fatalities9
- Persons involved in fatal accidents31
- Pedestrians involved in fatal accidents4
Daylight
- Ventura(Based on 9 reports) 33.3%
- Ventura County(Based on 63 reports) 42.9%
- California(Based on 4,189 reports) 45.2%
Dark - Lighted
- Ventura(Based on 9 reports) 33.3%
- Ventura County(Based on 63 reports) 25.4%
- California(Based on 4,189 reports) 25.1%
Dark - Not Lighted
- Ventura(Based on 9 reports) 22.2%
- Ventura County(Based on 63 reports) 28.6%
- California(Based on 4,189 reports) 25.8%
Dusk
- Ventura(Based on 9 reports) 11.1%
- Ventura County(Based on 63 reports) 3.2%
- California(Based on 4,189 reports) 2.1%
Clear
- Ventura(Based on 9 reports) 100.0%
- Ventura County(Based on 63 reports) 92.1%
- California(Based on 4,194 reports) 93.7%
| # | Date | Location | Vehicles | Drunk persons | Fatalites | Persons | Pedestrians |
|---|
| 1 | Jan 18, 1991 01:05 PM | Mainstreet | 1 | - | 1
| 3 | 1 |
| 2 | Feb 4, 1991 06:40 PM | 101 | 2 | 1
| 1 | 5 | - |
| 3 | Feb 28, 1991 01:30 PM | Garden St | 1 | - | 1
| 1 | - |
| 4 | May 2, 1991 06:55 PM | Telephone | 1 | - | 1
| 2 | 1 |
| 5 | May 9, 1991 02:21 PM | Harbor Blv | 4 | - | 1
| 12 | - |
| 6 | Jun 8, 1991 01:41 AM | Harbor Blv | 1 | 1
| 1 | 1 | - |
| 7 | Jun 14, 1991 03:50 AM | 101 | 1 | - | 1
| 2 | 1 |
| 8 | Sep 21, 1991 09:30 PM | 101 | 2 | - | 1
| 3 | - |
| 9 | Oct 6, 1991 11:26 PM | 101 | 1 | - | 1
| 2 | 1 |
Ventura fatal car crash and road traffic accident list for 1990
- Fatal accident count4
- Vehicles involved in fatal accidents10
- Fatal accidents involving drunk persons4
- Fatalities4
- Persons involved in fatal accidents14
Dark - Lighted
- Ventura(Based on 4 reports) 50.0%
- Ventura County(Based on 79 reports) 16.5%
- California(Based on 4,679 reports) 25.0%
Daylight
- Ventura(Based on 4 reports) 25.0%
- Ventura County(Based on 79 reports) 53.2%
- California(Based on 4,679 reports) 44.7%
Dark - Not Lighted
- Ventura(Based on 4 reports) 25.0%
- Ventura County(Based on 79 reports) 26.6%
- California(Based on 4,679 reports) 26.6%
Clear
- Ventura(Based on 4 reports) 100.0%
- Ventura County(Based on 79 reports) 98.7%
- California(Based on 4,685 reports) 95.4%
| # | Date | Location | Vehicles | Drunk persons | Fatalites | Persons | Pedestrians |
|---|
| 1 | Apr 13, 1990 11:51 PM | Seawardave | 2 | 2
| 1 | 5 | - |
| 2 | Jun 22, 1990 09:36 PM | 126 | 5 | 1
| 1 | 5 | - |
| 3 | Jul 8, 1990 10:57 PM | Foothillrd | 1 | 1
| 1 | 1 | - |
| 4 | Aug 17, 1990 01:20 PM | Henderson | 2 | - | 1
| 3 | - |
Ventura fatal car crash and road traffic accident list for 1989
- Fatal accident count11
- Vehicles involved in fatal accidents17
- Fatal accidents involving drunk persons5
- Fatalities14
- Persons involved in fatal accidents29
Dark - Lighted
- Ventura(Based on 11 reports) 45.5%
- Ventura County(Based on 95 reports) 27.4%
- California(Based on 4,869 reports) 22.2%
Daylight
- Ventura(Based on 11 reports) 36.4%
- Ventura County(Based on 95 reports) 46.3%
- California(Based on 4,869 reports) 43.8%
Dark - Not Lighted
- Ventura(Based on 11 reports) 18.2%
- Ventura County(Based on 95 reports) 20.0%
- California(Based on 4,869 reports) 29.5%
Clear
- Ventura(Based on 11 reports) 81.8%
- Ventura County(Based on 95 reports) 91.6%
- California(Based on 4,877 reports) 94.5%
Fog, Smog, Smoke
- Ventura(Based on 11 reports) 18.2%
- Ventura County(Based on 95 reports) 3.2%
- California(Based on 4,877 reports) 2.2%
| # | Date | Location | Vehicles | Drunk persons | Fatalites | Persons | Pedestrians |
|---|
| 1 | Jan 29, 1989 02:02 AM | Main St | 2 | 1
| 1 | 2 | - |
| 2 | Mar 10, 1989 09:25 PM | Villanova | 2 | - | 1
| 4 | - |
| 3 | May 12, 1989 11:16 AM | Telegraph | 2 | - | 2
| 4 | - |
| 4 | May 19, 1989 11:57 PM | Harborblvd | 1 | 1
| 1 | 2 | - |
| 5 | Jul 21, 1989 01:35 AM | 101 | 1 | 1
| 1 | 1 | - |
| 6 | Sep 14, 1989 06:35 AM | 101 | 2 | - | 1
| 2 | - |
| 7 | Oct 6, 1989 10:54 AM | Foothillrd | 1 | - | 1
| 4 | - |
| 8 | Oct 8, 1989 11:55 PM | Harbor Blv | 1 | 1
| 1 | 1 | - |
| 9 | Nov 17, 1989 09:57 PM | Main St | 1 | - | 1
| 3 | - |
| 10 | Dec 16, 1989 11:12 PM | 101 | 2 | 1
| 2 | 2 | - |
| 11 | Dec 20, 1989 02:55 PM | 126 | 2 | - | 2
| 4 | - |
Ventura fatal car crash and road traffic accident list for 1988
- Fatal accident count10
- Vehicles involved in fatal accidents21
- Fatal accidents involving drunk persons3
- Fatalities10
- Persons involved in fatal accidents37
Daylight
- Ventura(Based on 10 reports) 60.0%
- Ventura County(Based on 83 reports) 37.3%
- California(Based on 4,868 reports) 43.7%
Dark - Not Lighted
- Ventura(Based on 10 reports) 20.0%
- Ventura County(Based on 83 reports) 36.1%
- California(Based on 4,868 reports) 28.0%
Dusk
- Ventura(Based on 10 reports) 10.0%
- Ventura County(Based on 83 reports) 2.4%
- California(Based on 4,868 reports) 2.6%
Dark - Lighted
- Ventura(Based on 10 reports) 10.0%
- Ventura County(Based on 83 reports) 21.7%
- California(Based on 4,868 reports) 24.1%
Clear
- Ventura(Based on 10 reports) 100.0%
- Ventura County(Based on 84 reports) 95.2%
- California(Based on 4,875 reports) 94.0%
| # | Date | Location | Vehicles | Drunk persons | Fatalites | Persons | Pedestrians |
|---|
| 1 | Feb 1, 1988 02:55 PM | 101 | 3 | - | 1
| 8 | - |
| 2 | Jan 2, 1988 04:43 PM | Telegraph | 2 | 1
| 1 | 2 | - |
| 3 | Jul 12, 1988 10:11 PM | Thompsonbl | 1 | - | 1
| 2 | - |
| 4 | Aug 17, 1988 08:40 PM | 101 | 5 | 1
| 1 | 9 | - |
| 5 | Aug 6, 1988 02:40 AM | 33 | 1 | - | 1
| 3 | - |
| 6 | Aug 23, 1988 05:52 PM | Mainstreet | 3 | 1
| 1 | 5 | - |
| 7 | Sep 22, 1988 10:35 AM | Johnson Dr | 2 | - | 1
| 3 | - |
| 8 | Oct 26, 1988 04:05 PM | Stanleyave | 2 | - | 1
| 2 | - |
| 9 | Nov 4, 1988 08:24 AM | Telegraph | 1 | - | 1
| 1 | - |
| 10 | Dec 1, 1988 04:38 PM | Foothillrd | 1 | - | 1
| 2 | - |
Ventura fatal car crash and road traffic accident list for 1987
- Fatal accident count11
- Vehicles involved in fatal accidents17
- Fatal accidents involving drunk persons6
- Fatalities11
- Persons involved in fatal accidents26
Daylight
- Ventura(Based on 11 reports) 72.7%
- Ventura County(Based on 90 reports) 45.6%
- California(Based on 4,923 reports) 43.9%
Dark - Lighted
- Ventura(Based on 11 reports) 18.2%
- Ventura County(Based on 90 reports) 18.9%
- California(Based on 4,923 reports) 23.5%
Dark - Not Lighted
- Ventura(Based on 11 reports) 9.1%
- Ventura County(Based on 90 reports) 33.3%
- California(Based on 4,923 reports) 28.9%
Clear
- Ventura(Based on 11 reports) 100.0%
- Ventura County(Based on 90 reports) 95.6%
- California(Based on 4,935 reports) 93.0%
| # | Date | Location | Vehicles | Drunk persons | Fatalites | Persons | Pedestrians |
|---|
| 1 | Feb 12, 1987 12:00 PM | Pierpontbl | 1 | 1
| 1 | 2 | - |
| 2 | Feb 15, 1987 02:57 PM | E Harbor | 2 | - | 1
| 4 | - |
| 3 | Mar 23, 1987 11:09 AM | Ventura St | 1 | - | 1
| 2 | - |
| 4 | Apr 5, 1987 06:00 PM | 101 | 2 | - | 1
| 3 | - |
| 5 | May 26, 1987 03:00 AM | 101 | 1 | 1
| 1 | 1 | - |
| 6 | Jun 3, 1987 08:52 AM | Preble Ave | 3 | - | 1
| 5 | - |
| 7 | Jul 11, 1987 08:20 PM | Spinnaker | 1 | 1
| 1 | 1 | - |
| 8 | Sep 23, 1987 06:43 PM | Aurora Dr | 1 | 1
| 1 | 1 | - |
| 9 | Nov 20, 1987 10:55 AM | Telegraph | 2 | - | 1
| 3 | - |
| 10 | Dec 2, 1987 03:15 PM | Venturaave | 1 | 1
| 1 | 2 | - |
| 11 | Nov 18, 1987 02:20 PM | 101 | 2 | 1
| 1 | 2 | - |
Ventura fatal car crash and road traffic accident list for 1986
- Fatal accident count9
- Vehicles involved in fatal accidents15
- Fatal accidents involving drunk persons3
- Fatalities9
- Persons involved in fatal accidents23
Daylight
- Ventura(Based on 9 reports) 44.4%
- Ventura County(Based on 101 reports) 42.6%
- California(Based on 4,674 reports) 44.7%
Dark - Lighted
- Ventura(Based on 9 reports) 33.3%
- Ventura County(Based on 101 reports) 16.8%
- California(Based on 4,674 reports) 23.4%
Dusk
- Ventura(Based on 9 reports) 11.1%
- Ventura County(Based on 101 reports) 4.0%
- California(Based on 4,674 reports) 2.7%
Dark - Not Lighted
- Ventura(Based on 9 reports) 11.1%
- Ventura County(Based on 101 reports) 33.7%
- California(Based on 4,674 reports) 27.9%
Clear
- Ventura(Based on 9 reports) 77.8%
- Ventura County(Based on 101 reports) 90.1%
- California(Based on 4,683 reports) 93.3%
Rain
- Ventura(Based on 9 reports) 22.2%
- Ventura County(Based on 101 reports) 7.9%
- California(Based on 4,683 reports) 4.7%
| # | Date | Location | Vehicles | Drunk persons | Fatalites | Persons | Pedestrians |
|---|
| 1 | Jan 28, 1986 11:33 PM | Harborblvd | 2 | 1
| 1 | 2 | - |
| 2 | Jan 6, 1986 11:00 AM | Mainstreet | 2 | - | 1
| 2 | - |
| 3 | Apr 51986 02:00 PM | | 2 | - | 1
| 4 | - |
| 4 | Sep 23, 1986 07:45 PM | Telehpone | 2 | - | 1
| 3 | - |
| 5 | Sep 20, 1986 01:56 AM | Foothillrd | 1 | 1
| 1 | 1 | - |
| 6 | Sep 24, 1986 06:21 PM | Foothillbl | 2 | - | 1
| 5 | - |
| 7 | Aug 26, 1986 11:05 PM | Reino Road | 1 | - | 1
| 1 | - |
| 8 | Sep 30, 1986 07:40 AM | Telphonerd | 1 | - | 1
| 3 | - |
| 9 | Oct 18, 1986 06:05 PM | Telegraph | 2 | 1
| 1 | 2 | - |
Ventura fatal car crash and road traffic accident list for 1985
- Fatal accident count16
- Vehicles involved in fatal accidents21
- Fatal accidents involving drunk persons8
- Fatalities17
- Persons involved in fatal accidents37
Daylight
- Ventura(Based on 16 reports) 50.0%
- Ventura County(Based on 92 reports) 52.2%
- California(Based on 4,436 reports) 44.6%
Dark - Lighted
- Ventura(Based on 16 reports) 31.3%
- Ventura County(Based on 92 reports) 17.4%
- California(Based on 4,436 reports) 24.5%
Dark - Not Lighted
- Ventura(Based on 16 reports) 18.8%
- Ventura County(Based on 92 reports) 28.3%
- California(Based on 4,436 reports) 26.8%
Clear
- Ventura(Based on 16 reports) 93.8%
- Ventura County(Based on 92 reports) 92.4%
- California(Based on 4,447 reports) 92.9%
Rain
- Ventura(Based on 16 reports) 6.3%
- Ventura County(Based on 92 reports) 4.3%
- California(Based on 4,447 reports) 3.9%
| # | Date | Location | Vehicles | Drunk persons | Fatalites | Persons | Pedestrians |
|---|
| 1 | Jan 181985 05:02 AM | | 1 | - | 1
| 6 | - |
| 2 | Jan 9, 1985 11:11 PM | Bristol Rd | 1 | 1
| 1 | 2 | - |
| 3 | Jan 30, 1985 08:29 AM | Harbor Blv | 2 | - | 1
| 2 | - |
| 4 | Feb 22, 1985 06:59 PM | Harborblvd | 1 | 1
| 1 | 2 | - |
| 5 | Jan 111985 11:30 PM | | 1 | 1
| 1 | 1 | - |
| 6 | Feb 7, 1985 03:50 PM | Loma Vista | 2 | - | 1
| 2 | - |
| 7 | Feb 21, 1985 08:00 AM | Hillcrest | 1 | - | 1
| 1 | - |
| 8 | Mar 21, 1985 02:50 PM | Harborblvd | 2 | 1
| 1 | 2 | - |
| 9 | Feb 6, 1985 12:00 AM | Wells Road | 2 | - | 1
| 3 | - |
| 10 | Apr 71985 03:05 PM | | 1 | - | 1
| 4 | - |
| 11 | Apr 18, 1985 08:46 PM | Harbor Blv | 1 | 1
| 1 | 2 | - |
| 12 | Apr 12, 1985 07:45 PM | Telegrphrd | 2 | 1
| 1 | 2 | - |
| 13 | Apr 26, 1985 08:58 AM | Victoriaav | 1 | - | 1
| 2 | - |
| 14 | Jul 26, 1985 11:35 PM | Foothillrd | 1 | 1
| 1 | 1 | - |
| 15 | Aug 13, 1985 02:45 PM | Spinnaker | 1 | - | 2
| 4 | - |
| 16 | Dec 25, 1985 01:19 AM | Aurora Dr | 1 | 1
| 1 | 1 | - |
Ventura fatal car crash and road traffic accident list for 1984
- Fatal accident count10
- Vehicles involved in fatal accidents13
- Fatal accidents involving drunk persons8
- Fatalities10
- Persons involved in fatal accidents18
Daylight
- Ventura(Based on 10 reports) 40.0%
- Ventura County(Based on 89 reports) 38.2%
- California(Based on 4,504 reports) 43.0%
Dark - Not Lighted
- Ventura(Based on 10 reports) 30.0%
- Ventura County(Based on 89 reports) 38.2%
- California(Based on 4,504 reports) 29.5%
Dark - Lighted
- Ventura(Based on 10 reports) 30.0%
- Ventura County(Based on 89 reports) 15.7%
- California(Based on 4,504 reports) 24.2%
Clear
- Ventura(Based on 10 reports) 90.0%
- Ventura County(Based on 89 reports) 98.9%
- California(Based on 4,517 reports) 93.9%
Rain
- Ventura(Based on 10 reports) 10.0%
- Ventura County(Based on 89 reports) 1.1%
- California(Based on 4,517 reports) 4.0%
| # | Date | Location | Vehicles | Drunk persons | Fatalites | Persons | Pedestrians |
|---|
| 1 | May 24, 1984 04:55 AM | Valntinerd | 1 | 1
| 1 | 1 | - |
| 2 | Jun 151984 08:50 PM | | 1 | 1
| 1 | 1 | - |
| 3 | Jun 151984 11:45 PM | | 1 | 1
| 1 | 1 | - |
| 4 | Sep 2, 1984 00:10 AM | Venturaave | 2 | 1
| 1 | 2 | - |
| 5 | Sep 23, 1984 04:36 PM | Mainstreet | 1 | - | 1
| 2 | - |
| 6 | Oct 6, 1984 11:35 AM | Seawardave | 1 | - | 1
| 1 | - |
| 7 | Nov 111984 04:35 PM | | 2 | 1
| 1 | 3 | - |
| 8 | Dec 1, 1984 01:47 AM | Roswell St | 1 | 1
| 1 | 1 | - |
| 9 | Dec 15, 1984 08:55 PM | Spinnaker | 2 | 1
| 1 | 5 | - |
| 10 | Dec 16, 1984 03:46 PM | Spinnaker | 1 | 1
| 1 | 1 | - |
Ventura fatal car crash and road traffic accident list for 1983
- Fatal accident count11
- Vehicles involved in fatal accidents18
- Fatal accidents involving drunk persons7
- Fatalities12
- Persons involved in fatal accidents37
Daylight
- Ventura(Based on 11 reports) 45.5%
- Ventura County(Based on 95 reports) 38.9%
- California(Based on 4,082 reports) 42.4%
Dark - Lighted
- Ventura(Based on 11 reports) 36.4%
- Ventura County(Based on 95 reports) 21.1%
- California(Based on 4,082 reports) 23.9%
Dusk
- Ventura(Based on 11 reports) 9.1%
- Ventura County(Based on 95 reports) 5.3%
- California(Based on 4,082 reports) 2.3%
Dark - Not Lighted
- Ventura(Based on 11 reports) 9.1%
- Ventura County(Based on 95 reports) 30.5%
- California(Based on 4,082 reports) 29.8%
Clear
- Ventura(Based on 11 reports) 90.9%
- Ventura County(Based on 95 reports) 93.7%
- California(Based on 4,089 reports) 89.6%
Rain
- Ventura(Based on 11 reports) 9.1%
- Ventura County(Based on 95 reports) 4.2%
- California(Based on 4,089 reports) 8.5%
| # | Date | Location | Vehicles | Drunk persons | Fatalites | Persons | Pedestrians |
|---|
| 1 | Feb 7, 1983 06:00 PM | Kimballrd | 2 | - | 1
| 6 | - |
| 2 | Feb 12, 1983 00:50 AM | Venturablv | 1 | 1
| 1 | 2 | - |
| 3 | Mar 8, 1983 09:05 AM | Callensrd | 2 | - | 1
| 2 | - |
| 4 | Mar 3, 1983 06:05 PM | Deandrive | 2 | 2
| 1 | 3 | - |
| 5 | Apr 9, 1983 11:55 PM | Santaclara | 2 | 2
| 1 | 4 | - |
| 6 | Jul 101983 12:50 AM | | 2 | - | 2
| 6 | - |
| 7 | Sep 8, 1983 05:23 PM | Blackburn | 1 | - | 1
| 2 | - |
| 8 | Sep 141983 11:05 AM | | 1 | - | 1
| 1 | - |
| 9 | Sep 171983 05:25 PM | | 1 | 1
| 1 | 2 | - |
| 10 | Oct 10, 1983 07:33 PM | Harborblvd | 1 | 1
| 1 | 1 | - |
| 11 | Dec 31983 10:40 PM | | 3 | - | 1
| 8 | - |
Ventura fatal car crash and road traffic accident list for 1982
- Fatal accident count9
- Vehicles involved in fatal accidents11
- Fatal accidents involving drunk persons8
- Fatalities11
- Persons involved in fatal accidents28
Dark - Lighted
- Ventura(Based on 9 reports) 44.4%
- Ventura County(Based on 76 reports) 25.0%
- California(Based on 4,116 reports) 27.0%
Daylight
- Ventura(Based on 9 reports) 33.3%
- Ventura County(Based on 76 reports) 32.9%
- California(Based on 4,116 reports) 39.7%
Dark - Not Lighted
- Ventura(Based on 9 reports) 22.2%
- Ventura County(Based on 76 reports) 39.5%
- California(Based on 4,116 reports) 29.9%
Clear
- Ventura(Based on 9 reports) 100.0%
- Ventura County(Based on 76 reports) 92.1%
- California(Based on 4,119 reports) 90.8%
| # | Date | Location | Vehicles | Drunk persons | Fatalites | Persons | Pedestrians |
|---|
| 1 | Jan 18, 1982 09:32 PM | Nventuraav | 1 | 1
| 1 | 2 | - |
| 2 | Jun 30, 1982 10:42 PM | Blackbrnrd | 1 | 1
| 1 | 2 | - |
| 3 | Jul 101982 01:50 PM | | 1 | 1
| 1 | 1 | - |
| 4 | Jul 10, 1982 03:20 PM | Telephone | 2 | - | 1
| 11 | - |
| 5 | Aug 7, 1982 02:15 AM | Victoriaav | 1 | 1
| 1 | 1 | - |
| 6 | Oct 22, 1982 10:54 PM | Venturaave | 1 | 1
| 1 | 1 | - |
| 7 | Sep 29, 1982 04:48 PM | Seawardave | 2 | 1
| 1 | 5 | - |
| 8 | Sep 91982 03:20 AM | | 1 | 1
| 2 | 2 | - |
| 9 | Dec 23, 1982 06:59 PM | Telephonrd | 1 | 1
| 2 | 3 | - |
Ventura fatal car crash and road traffic accident list for 1981
- Fatal accident count9
- Vehicles involved in fatal accidents13
- Fatal accidents involving drunk persons3
- Fatalities9
- Persons involved in fatal accidents18
Daylight
- Ventura(Based on 9 reports) 55.6%
- Ventura County(Based on 87 reports) 35.6%
- California(Based on 4,670 reports) 39.8%
Dark - Lighted
- Ventura(Based on 9 reports) 33.3%
- Ventura County(Based on 87 reports) 34.5%
- California(Based on 4,670 reports) 26.4%
Dark - Not Lighted
- Ventura(Based on 9 reports) 11.1%
- Ventura County(Based on 87 reports) 26.4%
- California(Based on 4,670 reports) 30.3%
Clear
- Ventura(Based on 9 reports) 88.9%
- Ventura County(Based on 87 reports) 89.7%
- California(Based on 4,670 reports) 93.0%
Rain
- Ventura(Based on 9 reports) 11.1%
- Ventura County(Based on 87 reports) 5.7%
- California(Based on 4,670 reports) 4.8%
Ventura fatal car crash and road traffic accident list for 1980
- Fatal accident count10
- Vehicles involved in fatal accidents12
- Fatal accidents involving drunk persons6
- Fatalities10
- Persons involved in fatal accidents19
Dark - Not Lighted
- Ventura(Based on 10 reports) 60.0%
- Ventura County(Based on 108 reports) 38.9%
- California(Based on 4,928 reports) 31.3%
Dark - Lighted
- Ventura(Based on 10 reports) 20.0%
- Ventura County(Based on 108 reports) 17.6%
- California(Based on 4,928 reports) 25.8%
Dusk
- Ventura(Based on 10 reports) 10.0%
- Ventura County(Based on 108 reports) 4.6%
- California(Based on 4,928 reports) 2.5%
Daylight
- Ventura(Based on 10 reports) 10.0%
- Ventura County(Based on 108 reports) 37.0%
- California(Based on 4,928 reports) 39.5%
Clear
- Ventura(Based on 10 reports) 90.0%
- Ventura County(Based on 108 reports) 90.7%
- California(Based on 4,930 reports) 93.0%
Rain
- Ventura(Based on 10 reports) 10.0%
- Ventura County(Based on 108 reports) 4.6%
- California(Based on 4,930 reports) 4.8%
Ventura fatal car crash and road traffic accident list for 1979
- Fatal accident count7
- Vehicles involved in fatal accidents12
- Fatal accidents involving drunk persons4
- Fatalities7
- Persons involved in fatal accidents16
Dark - Lighted
- Ventura(Based on 7 reports) 57.1%
- Ventura County(Based on 94 reports) 19.1%
- California(Based on 4,970 reports) 25.7%
Daylight
- Ventura(Based on 7 reports) 28.6%
- Ventura County(Based on 94 reports) 44.7%
- California(Based on 4,970 reports) 41.5%
Dark - Not Lighted
- Ventura(Based on 7 reports) 14.3%
- Ventura County(Based on 94 reports) 33.0%
- California(Based on 4,970 reports) 29.4%
Clear
- Ventura(Based on 7 reports) 85.7%
- Ventura County(Based on 95 reports) 94.7%
- California(Based on 4,975 reports) 92.9%
Rain
- Ventura(Based on 7 reports) 14.3%
- Ventura County(Based on 95 reports) 4.2%
- California(Based on 4,975 reports) 5.1%
Ventura fatal car crash and road traffic accident list for 1978
- Fatal accident count9
- Vehicles involved in fatal accidents14
- Fatal accidents involving drunk persons3
- Fatalities10
- Persons involved in fatal accidents22
Dark - Lighted
- Ventura(Based on 9 reports) 55.6%
- Ventura County(Based on 101 reports) 17.8%
- California(Based on 4,722 reports) 23.9%
Daylight
- Ventura(Based on 9 reports) 44.4%
- Ventura County(Based on 101 reports) 46.5%
- California(Based on 4,722 reports) 42.5%
Clear
- Ventura(Based on 9 reports) 88.9%
- Ventura County(Based on 101 reports) 89.1%
- California(Based on 4,724 reports) 90.7%
Blowing Sand, Soil, Dirt
- Ventura(Based on 9 reports) 11.1%
- Ventura County(Based on 101 reports) 4.0%
- California(Based on 4,724 reports) 2.0%
Ventura fatal car crash and road traffic accident list for 1977
- Fatal accident count8
- Vehicles involved in fatal accidents11
- Fatal accidents involving drunk persons4
- Fatalities8
- Persons involved in fatal accidents17
Daylight
- Ventura(Based on 8 reports) 50.0%
- Ventura County(Based on 95 reports) 51.6%
- California(Based on 4,347 reports) 40.0%
Dark - Not Lighted
- Ventura(Based on 8 reports) 37.5%
- Ventura County(Based on 95 reports) 31.6%
- California(Based on 4,347 reports) 32.9%
Dark - Lighted
- Ventura(Based on 8 reports) 12.5%
- Ventura County(Based on 95 reports) 12.6%
- California(Based on 4,347 reports) 23.7%
Clear
- Ventura(Based on 8 reports) 100.0%
- Ventura County(Based on 95 reports) 96.8%
- California(Based on 4,351 reports) 93.2%
Ventura fatal car crash and road traffic accident list for 1976
- Fatal accident count5
- Vehicles involved in fatal accidents7
- Fatal accidents involving drunk persons4
- Fatalities5
- Persons involved in fatal accidents14
Dark - Lighted
- Ventura(Based on 5 reports) 60.0%
- Ventura County(Based on 77 reports) 26.0%
- California(Based on 3,663 reports) 24.5%
Daylight
- Ventura(Based on 5 reports) 20.0%
- Ventura County(Based on 77 reports) 50.6%
- California(Based on 3,663 reports) 42.8%
Dark - Not Lighted
- Ventura(Based on 5 reports) 20.0%
- Ventura County(Based on 77 reports) 20.8%
- California(Based on 3,663 reports) 29.3%
Clear
- Ventura(Based on 5 reports) 100.0%
- Ventura County(Based on 77 reports) 92.2%
- California(Based on 3,667 reports) 91.8%
Ventura fatal car crash and road traffic accident list for 1975
- Fatal accident count5
- Vehicles involved in fatal accidents7
- Fatal accidents involving drunk persons4
- Fatalities5
- Persons involved in fatal accidents14
Dark - Lighted
- Ventura(Based on 5 reports) 60.0%
- Ventura County(Based on 77 reports) 26.0%
- California(Based on 3,663 reports) 24.5%
Daylight
- Ventura(Based on 5 reports) 20.0%
- Ventura County(Based on 77 reports) 50.6%
- California(Based on 3,663 reports) 42.8%
Dark - Not Lighted
- Ventura(Based on 5 reports) 20.0%
- Ventura County(Based on 77 reports) 20.8%
- California(Based on 3,663 reports) 29.3%
Clear
- Ventura(Based on 5 reports) 100.0%
- Ventura County(Based on 77 reports) 92.2%
- California(Based on 3,667 reports) 91.8%