Attleboro, Massachusetts Submit your own pictures of this city and show them to the world
OSM Map
General Map
Google Map
MSN Map
OSM Map
General Map
Google Map
MSN Map
OSM Map
General Map
Google Map
MSN Map
OSM Map
General Map
Google Map
MSN Map
Please wait while loading the map...
Population in 2022: 46,601 (100% urban, 0% rural). Population change since 2000: +10.8%Males: 22,722 Females: 23,879
March 2022 cost of living index in Attleboro: 131.0 (high, U.S. average is 100) Percentage of residents living in poverty in 2022: 9.2%for White Non-Hispanic residents , 15.6% for Black residents , 23.4% for Hispanic or Latino residents , 4.7% for other race residents , 26.8% for two or more races residents )
Profiles of local businesses
Business Search - 14 Million verified businesses
Data:
Median household income ($)
Median household income (% change since 2000)
Household income diversity
Ratio of average income to average house value (%)
Ratio of average income to average rent
Median household income ($) - White
Median household income ($) - Black or African American
Median household income ($) - Asian
Median household income ($) - Hispanic or Latino
Median household income ($) - American Indian and Alaska Native
Median household income ($) - Multirace
Median household income ($) - Other Race
Median household income for houses/condos with a mortgage ($)
Median household income for apartments without a mortgage ($)
Races - White alone (%)
Races - White alone (% change since 2000)
Races - Black alone (%)
Races - Black alone (% change since 2000)
Races - American Indian alone (%)
Races - American Indian alone (% change since 2000)
Races - Asian alone (%)
Races - Asian alone (% change since 2000)
Races - Hispanic (%)
Races - Hispanic (% change since 2000)
Races - Native Hawaiian and Other Pacific Islander alone (%)
Races - Native Hawaiian and Other Pacific Islander alone (% change since 2000)
Races - Two or more races (%)
Races - Two or more races (% change since 2000)
Races - Other race alone (%)
Races - Other race alone (% change since 2000)
Racial diversity
Unemployment (%)
Unemployment (% change since 2000)
Unemployment (%) - White
Unemployment (%) - Black or African American
Unemployment (%) - Asian
Unemployment (%) - Hispanic or Latino
Unemployment (%) - American Indian and Alaska Native
Unemployment (%) - Multirace
Unemployment (%) - Other Race
Population density (people per square mile)
Population - Males (%)
Population - Females (%)
Population - Males (%) - White
Population - Males (%) - Black or African American
Population - Males (%) - Asian
Population - Males (%) - Hispanic or Latino
Population - Males (%) - American Indian and Alaska Native
Population - Males (%) - Multirace
Population - Males (%) - Other Race
Population - Females (%) - White
Population - Females (%) - Black or African American
Population - Females (%) - Asian
Population - Females (%) - Hispanic or Latino
Population - Females (%) - American Indian and Alaska Native
Population - Females (%) - Multirace
Population - Females (%) - Other Race
Coronavirus confirmed cases (Apr 25, 2024)
Deaths caused by coronavirus (Apr 25, 2024)
Coronavirus confirmed cases (per 100k population) (Apr 25, 2024)
Deaths caused by coronavirus (per 100k population) (Apr 25, 2024)
Daily increase in number of cases (Apr 25, 2024)
Weekly increase in number of cases (Apr 25, 2024)
Cases doubled (in days) (Apr 25, 2024)
Hospitalized patients (Apr 18, 2022)
Negative test results (Apr 18, 2022)
Total test results (Apr 18, 2022)
COVID Vaccine doses distributed (per 100k population) (Sep 19, 2023)
COVID Vaccine doses administered (per 100k population) (Sep 19, 2023)
COVID Vaccine doses distributed (Sep 19, 2023)
COVID Vaccine doses administered (Sep 19, 2023)
Likely homosexual households (%)
Likely homosexual households (% change since 2000)
Likely homosexual households - Lesbian couples (%)
Likely homosexual households - Lesbian couples (% change since 2000)
Likely homosexual households - Gay men (%)
Likely homosexual households - Gay men (% change since 2000)
Cost of living index
Median gross rent ($)
Median contract rent ($)
Median monthly housing costs ($)
Median house or condo value ($)
Median house or condo value ($ change since 2000)
Mean house or condo value by units in structure - 1, detached ($)
Mean house or condo value by units in structure - 1, attached ($)
Mean house or condo value by units in structure - 2 ($)
Mean house or condo value by units in structure by units in structure - 3 or 4 ($)
Mean house or condo value by units in structure - 5 or more ($)
Mean house or condo value by units in structure - Boat, RV, van, etc. ($)
Mean house or condo value by units in structure - Mobile home ($)
Median house or condo value ($) - White
Median house or condo value ($) - Black or African American
Median house or condo value ($) - Asian
Median house or condo value ($) - Hispanic or Latino
Median house or condo value ($) - American Indian and Alaska Native
Median house or condo value ($) - Multirace
Median house or condo value ($) - Other Race
Median resident age
Resident age diversity
Median resident age - Males
Median resident age - Females
Median resident age - White
Median resident age - Black or African American
Median resident age - Asian
Median resident age - Hispanic or Latino
Median resident age - American Indian and Alaska Native
Median resident age - Multirace
Median resident age - Other Race
Median resident age - Males - White
Median resident age - Males - Black or African American
Median resident age - Males - Asian
Median resident age - Males - Hispanic or Latino
Median resident age - Males - American Indian and Alaska Native
Median resident age - Males - Multirace
Median resident age - Males - Other Race
Median resident age - Females - White
Median resident age - Females - Black or African American
Median resident age - Females - Asian
Median resident age - Females - Hispanic or Latino
Median resident age - Females - American Indian and Alaska Native
Median resident age - Females - Multirace
Median resident age - Females - Other Race
Commute - mean travel time to work (minutes)
Travel time to work - Less than 5 minutes (%)
Travel time to work - Less than 5 minutes (% change since 2000)
Travel time to work - 5 to 9 minutes (%)
Travel time to work - 5 to 9 minutes (% change since 2000)
Travel time to work - 10 to 19 minutes (%)
Travel time to work - 10 to 19 minutes (% change since 2000)
Travel time to work - 20 to 29 minutes (%)
Travel time to work - 20 to 29 minutes (% change since 2000)
Travel time to work - 30 to 39 minutes (%)
Travel time to work - 30 to 39 minutes (% change since 2000)
Travel time to work - 40 to 59 minutes (%)
Travel time to work - 40 to 59 minutes (% change since 2000)
Travel time to work - 60 to 89 minutes (%)
Travel time to work - 60 to 89 minutes (% change since 2000)
Travel time to work - 90 or more minutes (%)
Travel time to work - 90 or more minutes (% change since 2000)
Marital status - Never married (%)
Marital status - Now married (%)
Marital status - Separated (%)
Marital status - Widowed (%)
Marital status - Divorced (%)
Median family income ($)
Median family income (% change since 2000)
Median non-family income ($)
Median non-family income (% change since 2000)
Median per capita income ($)
Median per capita income (% change since 2000)
Median family income ($) - White
Median family income ($) - Black or African American
Median family income ($) - Asian
Median family income ($) - Hispanic or Latino
Median family income ($) - American Indian and Alaska Native
Median family income ($) - Multirace
Median family income ($) - Other Race
Median year house/condo built
Median year apartment built
Year house built - Built 2005 or later (%)
Year house built - Built 2000 to 2004 (%)
Year house built - Built 1990 to 1999 (%)
Year house built - Built 1980 to 1989 (%)
Year house built - Built 1970 to 1979 (%)
Year house built - Built 1960 to 1969 (%)
Year house built - Built 1950 to 1959 (%)
Year house built - Built 1940 to 1949 (%)
Year house built - Built 1939 or earlier (%)
Average household size
Household density (households per square mile)
Average household size - White
Average household size - Black or African American
Average household size - Asian
Average household size - Hispanic or Latino
Average household size - American Indian and Alaska Native
Average household size - Multirace
Average household size - Other Race
Occupied housing units (%)
Vacant housing units (%)
Owner occupied housing units (%)
Renter occupied housing units (%)
Vacancy status - For rent (%)
Vacancy status - For sale only (%)
Vacancy status - Rented or sold, not occupied (%)
Vacancy status - For seasonal, recreational, or occasional use (%)
Vacancy status - For migrant workers (%)
Vacancy status - Other vacant (%)
Residents with income below the poverty level (%)
Residents with income below 50% of the poverty level (%)
Children below poverty level (%)
Poor families by family type - Married-couple family (%)
Poor families by family type - Male, no wife present (%)
Poor families by family type - Female, no husband present (%)
Poverty status for native-born residents (%)
Poverty status for foreign-born residents (%)
Poverty among high school graduates not in families (%)
Poverty among people who did not graduate high school not in families (%)
Residents with income below the poverty level (%) - White
Residents with income below the poverty level (%) - Black or African American
Residents with income below the poverty level (%) - Asian
Residents with income below the poverty level (%) - Hispanic or Latino
Residents with income below the poverty level (%) - American Indian and Alaska Native
Residents with income below the poverty level (%) - Multirace
Residents with income below the poverty level (%) - Other Race
Air pollution - Air Quality Index (AQI)
Air pollution - CO
Air pollution - NO2
Air pollution - SO2
Air pollution - Ozone
Air pollution - PM10
Air pollution - PM25
Air pollution - Pb
Crime - Murders per 100,000 population
Crime - Rapes per 100,000 population
Crime - Robberies per 100,000 population
Crime - Assaults per 100,000 population
Crime - Burglaries per 100,000 population
Crime - Thefts per 100,000 population
Crime - Auto thefts per 100,000 population
Crime - Arson per 100,000 population
Crime - City-data.com crime index
Crime - Violent crime index
Crime - Property crime index
Crime - Murders per 100,000 population (5 year average)
Crime - Rapes per 100,000 population (5 year average)
Crime - Robberies per 100,000 population (5 year average)
Crime - Assaults per 100,000 population (5 year average)
Crime - Burglaries per 100,000 population (5 year average)
Crime - Thefts per 100,000 population (5 year average)
Crime - Auto thefts per 100,000 population (5 year average)
Crime - Arson per 100,000 population (5 year average)
Crime - City-data.com crime index (5 year average)
Crime - Violent crime index (5 year average)
Crime - Property crime index (5 year average)
1996 Presidential Elections Results (%) - Democratic Party (Clinton)
1996 Presidential Elections Results (%) - Republican Party (Dole)
1996 Presidential Elections Results (%) - Other
2000 Presidential Elections Results (%) - Democratic Party (Gore)
2000 Presidential Elections Results (%) - Republican Party (Bush)
2000 Presidential Elections Results (%) - Other
2004 Presidential Elections Results (%) - Democratic Party (Kerry)
2004 Presidential Elections Results (%) - Republican Party (Bush)
2004 Presidential Elections Results (%) - Other
2008 Presidential Elections Results (%) - Democratic Party (Obama)
2008 Presidential Elections Results (%) - Republican Party (McCain)
2008 Presidential Elections Results (%) - Other
2012 Presidential Elections Results (%) - Democratic Party (Obama)
2012 Presidential Elections Results (%) - Republican Party (Romney)
2012 Presidential Elections Results (%) - Other
2016 Presidential Elections Results (%) - Democratic Party (Clinton)
2016 Presidential Elections Results (%) - Republican Party (Trump)
2016 Presidential Elections Results (%) - Other
2020 Presidential Elections Results (%) - Democratic Party (Biden)
2020 Presidential Elections Results (%) - Republican Party (Trump)
2020 Presidential Elections Results (%) - Other
Ancestries Reported - Arab (%)
Ancestries Reported - Czech (%)
Ancestries Reported - Danish (%)
Ancestries Reported - Dutch (%)
Ancestries Reported - English (%)
Ancestries Reported - French (%)
Ancestries Reported - French Canadian (%)
Ancestries Reported - German (%)
Ancestries Reported - Greek (%)
Ancestries Reported - Hungarian (%)
Ancestries Reported - Irish (%)
Ancestries Reported - Italian (%)
Ancestries Reported - Lithuanian (%)
Ancestries Reported - Norwegian (%)
Ancestries Reported - Polish (%)
Ancestries Reported - Portuguese (%)
Ancestries Reported - Russian (%)
Ancestries Reported - Scotch-Irish (%)
Ancestries Reported - Scottish (%)
Ancestries Reported - Slovak (%)
Ancestries Reported - Subsaharan African (%)
Ancestries Reported - Swedish (%)
Ancestries Reported - Swiss (%)
Ancestries Reported - Ukrainian (%)
Ancestries Reported - United States (%)
Ancestries Reported - Welsh (%)
Ancestries Reported - West Indian (%)
Ancestries Reported - Other (%)
Educational Attainment - No schooling completed (%)
Educational Attainment - Less than high school (%)
Educational Attainment - High school or equivalent (%)
Educational Attainment - Less than 1 year of college (%)
Educational Attainment - 1 or more years of college (%)
Educational Attainment - Associate degree (%)
Educational Attainment - Bachelor's degree (%)
Educational Attainment - Master's degree (%)
Educational Attainment - Professional school degree (%)
Educational Attainment - Doctorate degree (%)
School Enrollment - Nursery, preschool (%)
School Enrollment - Kindergarten (%)
School Enrollment - Grade 1 to 4 (%)
School Enrollment - Grade 5 to 8 (%)
School Enrollment - Grade 9 to 12 (%)
School Enrollment - College undergrad (%)
School Enrollment - Graduate or professional (%)
School Enrollment - Not enrolled in school (%)
School enrollment - Public schools (%)
School enrollment - Private schools (%)
School enrollment - Not enrolled (%)
Median number of rooms in houses and condos
Median number of rooms in apartments
Housing units lacking complete plumbing facilities (%)
Housing units lacking complete kitchen facilities (%)
Density of houses
Urban houses (%)
Rural houses (%)
Households with people 60 years and over (%)
Households with people 65 years and over (%)
Households with people 75 years and over (%)
Households with one or more nonrelatives (%)
Households with no nonrelatives (%)
Population in households (%)
Family households (%)
Nonfamily households (%)
Population in families (%)
Family households with own children (%)
Median number of bedrooms in owner occupied houses
Mean number of bedrooms in owner occupied houses
Median number of bedrooms in renter occupied houses
Mean number of bedrooms in renter occupied houses
Median number of vehichles in owner occupied houses
Mean number of vehichles in owner occupied houses
Median number of vehichles in renter occupied houses
Mean number of vehichles in renter occupied houses
Mortgage status - with mortgage (%)
Mortgage status - with second mortgage (%)
Mortgage status - with home equity loan (%)
Mortgage status - with both second mortgage and home equity loan (%)
Mortgage status - without a mortgage (%)
Average family size
Average family size - White
Average family size - Black or African American
Average family size - Asian
Average family size - Hispanic or Latino
Average family size - American Indian and Alaska Native
Average family size - Multirace
Average family size - Other Race
Geographical mobility - Same house 1 year ago (%)
Geographical mobility - Moved within same county (%)
Geographical mobility - Moved from different county within same state (%)
Geographical mobility - Moved from different state (%)
Geographical mobility - Moved from abroad (%)
Place of birth - Born in state of residence (%)
Place of birth - Born in other state (%)
Place of birth - Native, outside of US (%)
Place of birth - Foreign born (%)
Housing units in structures - 1, detached (%)
Housing units in structures - 1, attached (%)
Housing units in structures - 2 (%)
Housing units in structures - 3 or 4 (%)
Housing units in structures - 5 to 9 (%)
Housing units in structures - 10 to 19 (%)
Housing units in structures - 20 to 49 (%)
Housing units in structures - 50 or more (%)
Housing units in structures - Mobile home (%)
Housing units in structures - Boat, RV, van, etc. (%)
House/condo owner moved in on average (years ago)
Renter moved in on average (years ago)
Year householder moved into unit - Moved in 1999 to March 2000 (%)
Year householder moved into unit - Moved in 1995 to 1998 (%)
Year householder moved into unit - Moved in 1990 to 1994 (%)
Year householder moved into unit - Moved in 1980 to 1989 (%)
Year householder moved into unit - Moved in 1970 to 1979 (%)
Year householder moved into unit - Moved in 1969 or earlier (%)
Means of transportation to work - Drove car alone (%)
Means of transportation to work - Carpooled (%)
Means of transportation to work - Public transportation (%)
Means of transportation to work - Bus or trolley bus (%)
Means of transportation to work - Streetcar or trolley car (%)
Means of transportation to work - Subway or elevated (%)
Means of transportation to work - Railroad (%)
Means of transportation to work - Ferryboat (%)
Means of transportation to work - Taxicab (%)
Means of transportation to work - Motorcycle (%)
Means of transportation to work - Bicycle (%)
Means of transportation to work - Walked (%)
Means of transportation to work - Other means (%)
Working at home (%)
Industry diversity
Most Common Industries - Agriculture, forestry, fishing and hunting, and mining (%)
Most Common Industries - Agriculture, forestry, fishing and hunting (%)
Most Common Industries - Mining, quarrying, and oil and gas extraction (%)
Most Common Industries - Construction (%)
Most Common Industries - Manufacturing (%)
Most Common Industries - Wholesale trade (%)
Most Common Industries - Retail trade (%)
Most Common Industries - Transportation and warehousing, and utilities (%)
Most Common Industries - Transportation and warehousing (%)
Most Common Industries - Utilities (%)
Most Common Industries - Information (%)
Most Common Industries - Finance and insurance, and real estate and rental and leasing (%)
Most Common Industries - Finance and insurance (%)
Most Common Industries - Real estate and rental and leasing (%)
Most Common Industries - Professional, scientific, and management, and administrative and waste management services (%)
Most Common Industries - Professional, scientific, and technical services (%)
Most Common Industries - Management of companies and enterprises (%)
Most Common Industries - Administrative and support and waste management services (%)
Most Common Industries - Educational services, and health care and social assistance (%)
Most Common Industries - Educational services (%)
Most Common Industries - Health care and social assistance (%)
Most Common Industries - Arts, entertainment, and recreation, and accommodation and food services (%)
Most Common Industries - Arts, entertainment, and recreation (%)
Most Common Industries - Accommodation and food services (%)
Most Common Industries - Other services, except public administration (%)
Most Common Industries - Public administration (%)
Occupation diversity
Most Common Occupations - Management, business, science, and arts occupations (%)
Most Common Occupations - Management, business, and financial occupations (%)
Most Common Occupations - Management occupations (%)
Most Common Occupations - Business and financial operations occupations (%)
Most Common Occupations - Computer, engineering, and science occupations (%)
Most Common Occupations - Computer and mathematical occupations (%)
Most Common Occupations - Architecture and engineering occupations (%)
Most Common Occupations - Life, physical, and social science occupations (%)
Most Common Occupations - Education, legal, community service, arts, and media occupations (%)
Most Common Occupations - Community and social service occupations (%)
Most Common Occupations - Legal occupations (%)
Most Common Occupations - Education, training, and library occupations (%)
Most Common Occupations - Arts, design, entertainment, sports, and media occupations (%)
Most Common Occupations - Healthcare practitioners and technical occupations (%)
Most Common Occupations - Health diagnosing and treating practitioners and other technical occupations (%)
Most Common Occupations - Health technologists and technicians (%)
Most Common Occupations - Service occupations (%)
Most Common Occupations - Healthcare support occupations (%)
Most Common Occupations - Protective service occupations (%)
Most Common Occupations - Fire fighting and prevention, and other protective service workers including supervisors (%)
Most Common Occupations - Law enforcement workers including supervisors (%)
Most Common Occupations - Food preparation and serving related occupations (%)
Most Common Occupations - Building and grounds cleaning and maintenance occupations (%)
Most Common Occupations - Personal care and service occupations (%)
Most Common Occupations - Sales and office occupations (%)
Most Common Occupations - Sales and related occupations (%)
Most Common Occupations - Office and administrative support occupations (%)
Most Common Occupations - Natural resources, construction, and maintenance occupations (%)
Most Common Occupations - Farming, fishing, and forestry occupations (%)
Most Common Occupations - Construction and extraction occupations (%)
Most Common Occupations - Installation, maintenance, and repair occupations (%)
Most Common Occupations - Production, transportation, and material moving occupations (%)
Most Common Occupations - Production occupations (%)
Most Common Occupations - Transportation occupations (%)
Most Common Occupations - Material moving occupations (%)
People in Group quarters - Institutionalized population (%)
People in Group quarters - Correctional institutions (%)
People in Group quarters - Federal prisons and detention centers (%)
People in Group quarters - Halfway houses (%)
People in Group quarters - Local jails and other confinement facilities (including police lockups) (%)
People in Group quarters - Military disciplinary barracks (%)
People in Group quarters - State prisons (%)
People in Group quarters - Other types of correctional institutions (%)
People in Group quarters - Nursing homes (%)
People in Group quarters - Hospitals/wards, hospices, and schools for the handicapped (%)
People in Group quarters - Hospitals/wards and hospices for chronically ill (%)
People in Group quarters - Hospices or homes for chronically ill (%)
People in Group quarters - Military hospitals or wards for chronically ill (%)
People in Group quarters - Other hospitals or wards for chronically ill (%)
People in Group quarters - Hospitals or wards for drug/alcohol abuse (%)
People in Group quarters - Mental (Psychiatric) hospitals or wards (%)
People in Group quarters - Schools, hospitals, or wards for the mentally retarded (%)
People in Group quarters - Schools, hospitals, or wards for the physically handicapped (%)
People in Group quarters - Institutions for the deaf (%)
People in Group quarters - Institutions for the blind (%)
People in Group quarters - Orthopedic wards and institutions for the physically handicapped (%)
People in Group quarters - Wards in general hospitals for patients who have no usual home elsewhere (%)
People in Group quarters - Wards in military hospitals for patients who have no usual home elsewhere (%)
People in Group quarters - Juvenile institutions (%)
People in Group quarters - Long-term care (%)
People in Group quarters - Homes for abused, dependent, and neglected children (%)
People in Group quarters - Residential treatment centers for emotionally disturbed children (%)
People in Group quarters - Training schools for juvenile delinquents (%)
People in Group quarters - Short-term care, detention or diagnostic centers for delinquent children (%)
People in Group quarters - Type of juvenile institution unknown (%)
People in Group quarters - Noninstitutionalized population (%)
People in Group quarters - College dormitories (includes college quarters off campus) (%)
People in Group quarters - Military quarters (%)
People in Group quarters - On base (%)
People in Group quarters - Barracks, unaccompanied personnel housing (UPH), (Enlisted/Officer), ;and similar group living quarters for military personnel (%)
People in Group quarters - Transient quarters for temporary residents (%)
People in Group quarters - Military ships (%)
People in Group quarters - Group homes (%)
People in Group quarters - Homes or halfway houses for drug/alcohol abuse (%)
People in Group quarters - Homes for the mentally ill (%)
People in Group quarters - Homes for the mentally retarded (%)
People in Group quarters - Homes for the physically handicapped (%)
People in Group quarters - Other group homes (%)
People in Group quarters - Religious group quarters (%)
People in Group quarters - Dormitories (%)
People in Group quarters - Agriculture workers' dormitories on farms (%)
People in Group quarters - Job Corps and vocational training facilities (%)
People in Group quarters - Other workers' dormitories (%)
People in Group quarters - Crews of maritime vessels (%)
People in Group quarters - Other nonhousehold living situations (%)
People in Group quarters - Other noninstitutional group quarters (%)
Residents speaking English at home (%)
Residents speaking English at home - Born in the United States (%)
Residents speaking English at home - Native, born elsewhere (%)
Residents speaking English at home - Foreign born (%)
Residents speaking Spanish at home (%)
Residents speaking Spanish at home - Born in the United States (%)
Residents speaking Spanish at home - Native, born elsewhere (%)
Residents speaking Spanish at home - Foreign born (%)
Residents speaking other language at home (%)
Residents speaking other language at home - Born in the United States (%)
Residents speaking other language at home - Native, born elsewhere (%)
Residents speaking other language at home - Foreign born (%)
Class of Workers - Employee of private company (%)
Class of Workers - Self-employed in own incorporated business (%)
Class of Workers - Private not-for-profit wage and salary workers (%)
Class of Workers - Local government workers (%)
Class of Workers - State government workers (%)
Class of Workers - Federal government workers (%)
Class of Workers - Self-employed workers in own not incorporated business and Unpaid family workers (%)
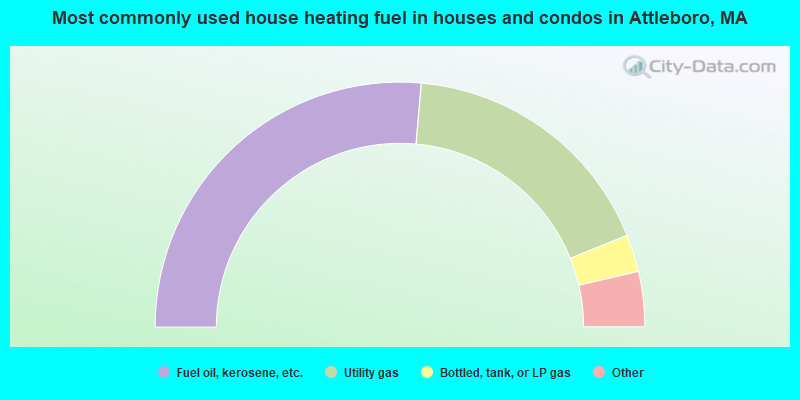
House heating fuel used in houses and condos - Utility gas (%)
House heating fuel used in houses and condos - Bottled, tank, or LP gas (%)
House heating fuel used in houses and condos - Electricity (%)
House heating fuel used in houses and condos - Fuel oil, kerosene, etc. (%)
House heating fuel used in houses and condos - Coal or coke (%)
House heating fuel used in houses and condos - Wood (%)
House heating fuel used in houses and condos - Solar energy (%)
House heating fuel used in houses and condos - Other fuel (%)
House heating fuel used in houses and condos - No fuel used (%)
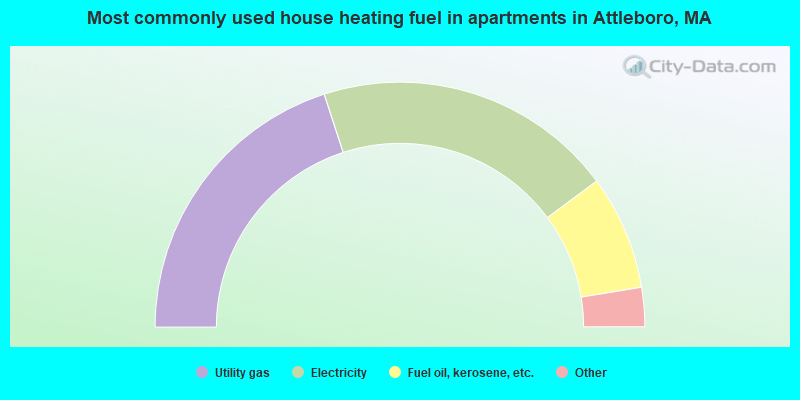
House heating fuel used in apartments - Utility gas (%)
House heating fuel used in apartments - Bottled, tank, or LP gas (%)
House heating fuel used in apartments - Electricity (%)
House heating fuel used in apartments - Fuel oil, kerosene, etc. (%)
House heating fuel used in apartments - Coal or coke (%)
House heating fuel used in apartments - Wood (%)
House heating fuel used in apartments - Solar energy (%)
House heating fuel used in apartments - Other fuel (%)
House heating fuel used in apartments - No fuel used (%)
Armed forces status - In Armed Forces (%)
Armed forces status - Civilian (%)
Armed forces status - Civilian - Veteran (%)
Armed forces status - Civilian - Nonveteran (%)
Fatal accidents locations in years 2005-2021
Fatal accidents locations in 2005
Fatal accidents locations in 2006
Fatal accidents locations in 2007
Fatal accidents locations in 2008
Fatal accidents locations in 2009
Fatal accidents locations in 2010
Fatal accidents locations in 2011
Fatal accidents locations in 2012
Fatal accidents locations in 2013
Fatal accidents locations in 2014
Fatal accidents locations in 2015
Fatal accidents locations in 2016
Fatal accidents locations in 2017
Fatal accidents locations in 2018
Fatal accidents locations in 2019
Fatal accidents locations in 2020
Fatal accidents locations in 2021
Alcohol use - People drinking some alcohol every month (%)
Alcohol use - People not drinking at all (%)
Alcohol use - Average days/month drinking alcohol
Alcohol use - Average drinks/week
Alcohol use - Average days/year people drink much
Audiometry - Average condition of hearing (%)
Audiometry - People that can hear a whisper from across a quiet room (%)
Audiometry - People that can hear normal voice from across a quiet room (%)
Audiometry - Ears ringing, roaring, buzzing (%)
Audiometry - Had a job exposure to loud noise (%)
Audiometry - Had off-work exposure to loud noise (%)
Blood Pressure & Cholesterol - Has high blood pressure (%)
Blood Pressure & Cholesterol - Checking blood pressure at home (%)
Blood Pressure & Cholesterol - Frequently checking blood cholesterol (%)
Blood Pressure & Cholesterol - Has high cholesterol level (%)
Consumer Behavior - Money monthly spent on food at supermarket/grocery store
Consumer Behavior - Money monthly spent on food at other stores
Consumer Behavior - Money monthly spent on eating out
Consumer Behavior - Money monthly spent on carryout/delivered foods
Consumer Behavior - Income spent on food at supermarket/grocery store (%)
Consumer Behavior - Income spent on food at other stores (%)
Consumer Behavior - Income spent on eating out (%)
Consumer Behavior - Income spent on carryout/delivered foods (%)
Current Health Status - General health condition (%)
Current Health Status - Blood donors (%)
Current Health Status - Has blood ever tested for HIV virus (%)
Current Health Status - Left-handed people (%)
Dermatology - People using sunscreen (%)
Diabetes - Diabetics (%)
Diabetes - Had a blood test for high blood sugar (%)
Diabetes - People taking insulin (%)
Diet Behavior & Nutrition - Diet health (%)
Diet Behavior & Nutrition - Milk product consumption (# of products/month)
Diet Behavior & Nutrition - Meals not home prepared (#/week)
Diet Behavior & Nutrition - Meals from fast food or pizza place (#/week)
Diet Behavior & Nutrition - Ready-to-eat foods (#/month)
Diet Behavior & Nutrition - Frozen meals/pizza (#/month)
Drug Use - People that ever used marijuana or hashish (%)
Drug Use - Ever used hard drugs (%)
Drug Use - Ever used any form of cocaine (%)
Drug Use - Ever used heroin (%)
Drug Use - Ever used methamphetamine (%)
Health Insurance - People covered by health insurance (%)
Kidney Conditions-Urology - Avg. # of times urinating at night
Medical Conditions - People with asthma (%)
Medical Conditions - People with anemia (%)
Medical Conditions - People with psoriasis (%)
Medical Conditions - People with overweight (%)
Medical Conditions - Elderly people having difficulties in thinking or remembering (%)
Medical Conditions - People who ever received blood transfusion (%)
Medical Conditions - People having trouble seeing even with glass/contacts (%)
Medical Conditions - People with arthritis (%)
Medical Conditions - People with gout (%)
Medical Conditions - People with congestive heart failure (%)
Medical Conditions - People with coronary heart disease (%)
Medical Conditions - People with angina pectoris (%)
Medical Conditions - People who ever had heart attack (%)
Medical Conditions - People who ever had stroke (%)
Medical Conditions - People with emphysema (%)
Medical Conditions - People with thyroid problem (%)
Medical Conditions - People with chronic bronchitis (%)
Medical Conditions - People with any liver condition (%)
Medical Conditions - People who ever had cancer or malignancy (%)
Mental Health - People who have little interest in doing things (%)
Mental Health - People feeling down, depressed, or hopeless (%)
Mental Health - People who have trouble sleeping or sleeping too much (%)
Mental Health - People feeling tired or having little energy (%)
Mental Health - People with poor appetite or overeating (%)
Mental Health - People feeling bad about themself (%)
Mental Health - People who have trouble concentrating on things (%)
Mental Health - People moving or speaking slowly or too fast (%)
Mental Health - People having thoughts they would be better off dead (%)
Oral Health - Average years since last visit a dentist
Oral Health - People embarrassed because of mouth (%)
Oral Health - People with gum disease (%)
Oral Health - General health of teeth and gums (%)
Oral Health - Average days a week using dental floss/device
Oral Health - Average days a week using mouthwash for dental problem
Oral Health - Average number of teeth
Pesticide Use - Households using pesticides to control insects (%)
Pesticide Use - Households using pesticides to kill weeds (%)
Physical Activity - People doing vigorous-intensity work activities (%)
Physical Activity - People doing moderate-intensity work activities (%)
Physical Activity - People walking or bicycling (%)
Physical Activity - People doing vigorous-intensity recreational activities (%)
Physical Activity - People doing moderate-intensity recreational activities (%)
Physical Activity - Average hours a day doing sedentary activities
Physical Activity - Average hours a day watching TV or videos
Physical Activity - Average hours a day using computer
Physical Functioning - People having limitations keeping them from working (%)
Physical Functioning - People limited in amount of work they can do (%)
Physical Functioning - People that need special equipment to walk (%)
Physical Functioning - People experiencing confusion/memory problems (%)
Physical Functioning - People requiring special healthcare equipment (%)
Prescription Medications - Average number of prescription medicines taking
Preventive Aspirin Use - Adults 40+ taking low-dose aspirin (%)
Reproductive Health - Vaginal deliveries (%)
Reproductive Health - Cesarean deliveries (%)
Reproductive Health - Deliveries resulted in a live birth (%)
Reproductive Health - Pregnancies resulted in a delivery (%)
Reproductive Health - Women breastfeeding newborns (%)
Reproductive Health - Women that had a hysterectomy (%)
Reproductive Health - Women that had both ovaries removed (%)
Reproductive Health - Women that have ever taken birth control pills (%)
Reproductive Health - Women taking birth control pills (%)
Reproductive Health - Women that have ever used Depo-Provera or injectables (%)
Reproductive Health - Women that have ever used female hormones (%)
Sexual Behavior - People 18+ that ever had sex (vaginal, anal, or oral) (%)
Sexual Behavior - Males 18+ that ever had vaginal sex with a woman (%)
Sexual Behavior - Males 18+ that ever performed oral sex on a woman (%)
Sexual Behavior - Males 18+ that ever had anal sex with a woman (%)
Sexual Behavior - Males 18+ that ever had any sex with a man (%)
Sexual Behavior - Females 18+ that ever had vaginal sex with a man (%)
Sexual Behavior - Females 18+ that ever performed oral sex on a man (%)
Sexual Behavior - Females 18+ that ever had anal sex with a man (%)
Sexual Behavior - Females 18+ that ever had any kind of sex with a woman (%)
Sexual Behavior - Average age people first had sex
Sexual Behavior - Average number of female sex partners in lifetime (males 18+)
Sexual Behavior - Average number of female vaginal sex partners in lifetime (males 18+)
Sexual Behavior - Average age people first performed oral sex on a woman (18+)
Sexual Behavior - Average number of woman performed oral sex on in lifetime (18+)
Sexual Behavior - Average number of male sex partners in lifetime (males 18+)
Sexual Behavior - Average number of male anal sex partners in lifetime (males 18+)
Sexual Behavior - Average age people first performed oral sex on a man (18+)
Sexual Behavior - Average number of male oral sex partners in lifetime (18+)
Sexual Behavior - People using protection when performing oral sex (%)
Sexual Behavior - Average number of times people have vaginal or anal sex a year
Sexual Behavior - People having sex without condom (%)
Sexual Behavior - Average number of male sex partners in lifetime (females 18+)
Sexual Behavior - Average number of male vaginal sex partners in lifetime (females 18+)
Sexual Behavior - Average number of female sex partners in lifetime (females 18+)
Sexual Behavior - Circumcised males 18+ (%)
Sleep Disorders - Average hours sleeping at night
Sleep Disorders - People that has trouble sleeping (%)
Smoking-Cigarette Use - People smoking cigarettes (%)
Taste & Smell - People 40+ having problems with smell (%)
Taste & Smell - People 40+ having problems with taste (%)
Taste & Smell - People 40+ that ever had wisdom teeth removed (%)
Taste & Smell - People 40+ that ever had tonsils teeth removed (%)
Taste & Smell - People 40+ that ever had a loss of consciousness because of a head injury (%)
Taste & Smell - People 40+ that ever had a broken nose or other serious injury to face or skull (%)
Taste & Smell - People 40+ that ever had two or more sinus infections (%)
Weight - Average height (inches)
Weight - Average weight (pounds)
Weight - Average BMI
Weight - People that are obese (%)
Weight - People that ever were obese (%)
Weight - People trying to lose weight (%)
Officers per 1,000 residents here:
1.52Massachusetts average:
2.53
Latest news from Attleboro, MA collected exclusively by city-data.com from local newspapers, TV, and radio stations
Attleboro, MA City Guides: Ancestries: Irish (15.2%), Portuguese (8.2%), Italian (7.6%), English (7.5%), French (6.1%), French Canadian (5.7%).
Current Local Time:
Land area: 27.5 square miles.
Population density: 1,694 people per square mile (low).
5,042 residents are foreign born (3.9% Latin America , 2.7% Europe , 2.4% Asia ).
This city:
10.8%Massachusetts:
17.6%
Median real estate property taxes paid for housing units with mortgages in 2022: $4,791 (1.1%)Median real estate property taxes paid for housing units with no mortgage in 2022: $4,643 (1.3%)
Nearest city with pop. 50,000+: Pawtucket, RI
Nearest city with pop. 200,000+: Boston, MA
Nearest city with pop. 1,000,000+: Bronx, NY
Nearest cities:
Latitude: 41.93 N, Longitude: 71.31 W
Daytime population change due to commuting: -3,874 (-8.3%)Workers who live and work in this city: 7,942 (31.1%)
Attleboro tourist attractions:
Single-family new house construction building permits:
2022: 29 buildings , average cost: $276,6002021: 52 buildings , average cost: $251,6002020: 81 buildings , average cost: $205,8002019: 74 buildings , average cost: $218,8002018: 55 buildings , average cost: $234,3002017: 76 buildings , average cost: $171,5002016: 57 buildings , average cost: $162,2002015: 94 buildings , average cost: $137,5002014: 80 buildings , average cost: $135,2002013: 34 buildings , average cost: $153,1002012: 52 buildings , average cost: $118,2002011: 46 buildings , average cost: $134,3002010: 44 buildings , average cost: $115,5002009: 41 buildings , average cost: $131,2002008: 45 buildings , average cost: $140,4002007: 54 buildings , average cost: $147,3002006: 100 buildings , average cost: $109,0002005: 116 buildings , average cost: $184,4002004: 120 buildings , average cost: $152,3002003: 102 buildings , average cost: $116,4002002: 114 buildings , average cost: $122,2002001: 127 buildings , average cost: $76,0002000: 141 buildings , average cost: $76,0001999: 155 buildings , average cost: $76,0001998: 154 buildings , average cost: $76,2001997: 144 buildings , average cost: $75,400Unemployment in December 2023: Here:
3.6%Massachusetts:
3.5%
Population change in the 1990s: +3,627 (+9.4%).
Most common occupations in Attleboro, MA (%)
Both Males Females
Other production occupations, including supervisors (6.8%)
Other office and administrative support workers, including supervisors (4.6%)
Metal workers and plastic workers (4.0%)
Other sales and related occupations, including supervisors (3.7%)
Material recording, scheduling, dispatching, and distributing workers (3.0%)
Secretaries and administrative assistants (3.0%)
Computer specialists (2.9%)
Other production occupations, including supervisors (8.1%)
Metal workers and plastic workers (5.8%)
Driver/sales workers and truck drivers (5.0%)
Engineers (4.2%)
Material recording, scheduling, dispatching, and distributing workers (4.1%)
Other sales and related occupations, including supervisors (3.9%)
Computer specialists (3.6%)
Other office and administrative support workers, including supervisors (7.3%)
Secretaries and administrative assistants (6.3%)
Other production occupations, including supervisors (5.4%)
Preschool, kindergarten, elementary, and middle school teachers (4.6%)
Registered nurses (3.8%)
Other sales and related occupations, including supervisors (3.4%)
Bookkeeping, accounting, and auditing clerks (3.1%)
Tornado activity:
Attleboro-area historical tornado activity is slightly below Massachusetts state average. It is 47% smaller than the overall U.S. average.
On 6/9/1953, a category F4 (max. wind speeds 207-260 mph) tornado 27.8 miles away from the Attleboro city center killed 90 people and injured 1228 people and caused between $50,000,000 and $500,000,000 in damages.
On 6/9/1953, a category F3 (max. wind speeds 158-206 mph) tornado 10.3 miles away from the city center injured 17 people and caused between $500,000 and $5,000,000 in damages.
Earthquake activity:
Attleboro-area historical earthquake activity is significantly above Massachusetts state average. It is 73% smaller than the overall U.S. average. On 10/7/1983 at 10:18:46, a magnitude 5.3 (5.1 MB, 5.3 LG, 5.1 ML, Class: Moderate, Intensity: VI - VII) earthquake occurred 207.6 miles away from the city center On 4/20/2002 at 10:50:47, a magnitude 5.3 (5.3 ML, Depth: 3.0 mi) earthquake occurred 215.3 miles away from Attleboro center On 1/19/1982 at 00:14:42, a magnitude 4.7 (4.5 MB, 4.7 MD, 4.5 LG, Class: Light, Intensity: IV - V) earthquake occurred 109.7 miles away from the city center On 4/20/2002 at 10:50:47, a magnitude 5.2 (5.2 MB, 4.2 MS, 5.2 MW, 5.0 MW) earthquake occurred 214.5 miles away from the city center On 10/16/2012 at 23:12:25, a magnitude 4.7 (4.7 ML, Depth: 10.0 mi) earthquake occurred 120.2 miles away from Attleboro center On 8/22/1992 at 12:20:32, a magnitude 4.8 (4.8 MB, 3.8 MS, 4.7 LG, Depth: 6.2 mi) earthquake occurred 202.1 miles away from the city center Magnitude types: regional Lg-wave magnitude (LG), body-wave magnitude (MB), duration magnitude (MD), local magnitude (ML), surface-wave magnitude (MS), moment magnitude (MW) Natural disasters: The number of natural disasters in Bristol County (23) is greater than the US average (15).Major Disasters (Presidential) Declared: 12Emergencies Declared: 11Floods: 8, Hurricanes: 7, Storms: 5, Snows: 3, Snowstorms: 3, Winter Storms: 3, Blizzards: 2, Explosion: 1, Heavy Rain: 1, Snowfall: 1, Tropical Storm: 1, Wind: 1 (Note: some incidents may be assigned to more than one category). Main business address for: SWANK, INC. LEATHER & LEATHER PRODUCTS ).
Hospitals and medical centers in Attleboro: STURDY MEMORIAL HOSPITAL (Voluntary non-profit - Other, 211 PARK STREET) COMMUNITY VISITING NURSE AGENCY, INC (10 EMORY STREET)
BRISTOL NURSING HOME (1000 OAK HILL AVENUE)
GOLDEN LIVING CENTER - GARDEN PLACE (193-195 PLEASANT STREET)
GOLDEN LIVING CENTER-ATTLEBORO (27 GEORGE STREET)
LIFE CARE CENTER OF ATTLEBORO (969 PARK STREET)
PLEASANT MANOR NURSING HOME (193-195 PLEASANT ST)
RIDGEWOOD COURT NURS HOME (27 GEORGE ST)
Amtrak station near Attleboro: 9 miles: PROVIDENCE (100 GASPEE ST.) Services: ticket office, fully wheelchair accessible, enclosed waiting area, public restrooms, public payphones, snack bar, ATM, paid short-term parking, paid long-term parking, call for car rental service, taxi stand, public transit connection.
Colleges/universities with over 2000 students nearest to Attleboro:
Brown University (about 9 miles; Providence, RI ; Full-time enrollment: 8,458)
Rhode Island School of Design (about 9 miles; Providence, RI ; FT enrollment: 2,714)
Providence College (about 9 miles; Providence, RI ; FT enrollment: 4,312)
Johnson & Wales University-Providence (about 10 miles; Providence, RI ; FT enrollment: 10,898)
Rhode Island College (about 10 miles; Providence, RI ; FT enrollment: 7,189)
Bryant University (about 12 miles; Smithfield, RI ; FT enrollment: 3,440)
Stonehill College (about 16 miles; Easton, MA ; FT enrollment: 2,563)
Public high schools in Attleboro: ATTLEBORO HIGH Students: 1,828, Location: 100 RATHBUN WILLARD DRIVE, Grades: 9-12)ATTLEBORO COMMUNITY ACADEMY Location: 100 RATHBUN WILLARD DRIVE, Grades: 9-12)
Private high schools in Attleboro: GRACE BAPTIST CHRISTIAN ACADEMY Students: 97, Location: 1000 OAKHILL AVE, Grades: PK-12)
AMEGO Students: 19, Location: 33 PERRY AVE, Grades: UG-12)
Public elementary/middle schools in Attleboro: ROBERT J. COELHO MIDDLE SCHOOL Students: 649, Location: 99 BROWN STREET, Grades: 5-8)WAMSUTTA MIDDLE SCHOOL Students: 635, Location: 300 LOCUST STREET, Grades: 5-8)CYRIL K. BRENNAN MIDDLE SCHOOL Students: 580, Location: 320 RATHBUN WILLARD DRIVE, Grades: 5-8)A. IRVIN STUDLEY ELEMENTARY SCHOOL Students: 471, Location: 299 RATHBUN WILLARD DRIVE, Grades: KG-4)PETER THACHER ELEMENTARY SCHOOL Students: 467, Location: 160 JAMES STREET, Grades: KG-4)HILL-ROBERTS ELEMENTARY SCHOOL Students: 461, Location: 80 ROY AVENUE, Grades: KG-4)HYMAN FINE ELEMENTARY SCHOOL Students: 411, Location: 790 OAK HILL AVENUE, Grades: KG-4)THOMAS WILLETT ELEMENTARY SCHOOL Students: 388, Location: 32 WATSON AVENUE, Grades: KG-4)Private elementary/middle school in Attleboro: ST JOHN THE EVANGELIST SCHOOL Students: 271, Location: 13 HODGES ST, Grades: KG-8)
See full list of schools located in Attleboro Library in Attleboro: ATTLEBORO PUBLIC LIBRARY Operating income: $1,116,176; Location: 74 NORTH MAIN STREET; 90,651 books ; 523 e-books ; 6,777 audio materials ; 4,788 video materials ; 7 local licensed databases ; 34 state licensed databases ; 1 other licensed databases ; 197 print serial subscriptions ; 1 electronic serial subscriptions )
Notable locations in Attleboro: (A) , South Attleboro Station (B) , Highland Country Club (C) , Locust Valley Country Club (D) , Camp Hebron (E) , Washington Plaza (F) , Attleboro City Hall (G) , Attleboro Fire Department Twin Village (H) , Attleboro Fire Department Briggs Corner (I) , Attleboro Fire Department South Attleboro (J) , Attleboro Fire Department Station 1 Headquarters (K) , Attleboro Public Library (L) . Display/hide their locations on the map
Shopping Center: (1) . Display/hide its location on the map
Main business address in Attleboro: (A) . Display/hide its location on the map
Cemeteries: (1) , Saint Marys Cemetery (2) , Newell Cemetery (3) , Woodlawn Cemetery (4) , Hillside Cemetery (5) , Saint Josephs Cemetery (6) . Display/hide their locations on the map
Lakes, reservoirs, and swamps: (A) , Farmers Pond (B) , Little Cranberry Pond (C) , Dodgeville Pond (D) , Lake Como (E) , Luther Reservoir (F) , Manchester Pond Reservoir (G) , Mechanics Pond (H) . Display/hide their locations on the map
Streams, rivers, and creeks: (A) , Fourmile Brook (B) , Thacher Brook (C) . Display/hide their locations on the map
Park in Attleboro: (1) . Display/hide its location on the map
Tourist attractions: (1) , Attleboro Area Industrial Museum (42 Union Street) (2) . Display/hide their approximate locations on the map
Hotels: (1) , Days Inn (1116 Washington Street) (2) , Hollywood (46 Washington Street) (3) , Magical Escapes (63 Curtis Avenue) (4) . Display/hide their approximate locations on the map
Birthplace of: Jeff Perry (politician) - Politician, Ray Conniff - (1916-2002), band leader, musician, George Bradburn - Politician, Brendan Doherty - Rhode Island politician, Charles Goslin - Graphic designer, David Cobb (Massachusetts) - Politician, David Daggett - Politician, Ezekiel Robinson - Educationist, Frederick Warren Allen - Sculptor, Geoff Cameron - Soccer player.
Bristol County has a predicted average indoor radon screening level between 2 and 4 pCi/L (pico curies per liter) - Moderate Potential Drinking water stations with addresses in Attleboro and their reported violations in the past:
ATTLEBORO WATER DEPT (Population served: 43,593, Surface water):
Past monitoring violations:
13 regular monitoring violations
Population served: 434, Groundwater):
Past health violations:
MCL, Monthly (TCR) - In NOV-2012, Contaminant: Coliform. Follow-up actions: St AO (w/o penalty) issued (FEB-27-2013), St Compliance achieved (FEB-27-2013)
Past monitoring violations:
One regular monitoring violation
Serves RI, Population served: 200, Groundwater):
Past health violations:
MCL, Monthly (TCR) - In NOV-2006, Contaminant: Coliform. Follow-up actions: St Public Notif requested (NOV-14-2006), St Formal NOV issued (NOV-14-2006), St Violation/Reminder Notice (NOV-14-2006), St Compliance achieved (DEC-22-2006), St Public Notif received (DEC-22-2006)
MCL, Monthly (TCR) - In OCT-2006, Contaminant: Coliform. Follow-up actions: St Public Notif requested (OCT-16-2006), St Formal NOV issued (OCT-16-2006), St Violation/Reminder Notice (OCT-16-2006), St Compliance achieved (DEC-22-2006), St Public Notif received (DEC-22-2006)
MCL, Monthly (TCR) - In SEP-2006, Contaminant: Coliform. Follow-up actions: St Public Notif requested (SEP-08-2006), St Formal NOV issued (SEP-08-2006), St Violation/Reminder Notice (SEP-08-2006), St Compliance achieved (OCT-18-2006), St Public Notif received (OCT-18-2006)
MCL, Monthly (TCR) - In AUG-2006, Contaminant: Coliform. Follow-up actions: St Public Notif requested (AUG-07-2006), St Formal NOV issued (AUG-07-2006), St Violation/Reminder Notice (AUG-07-2006), St Compliance achieved (AUG-29-2006), St Public Notif received (AUG-29-2006)
MCL, Monthly (TCR) - Between JUL-2006 and SEP-2006, Contaminant: Coliform. Follow-up actions: St Public Notif requested (JUL-21-2006), St Formal NOV issued (JUL-21-2006), St Violation/Reminder Notice (JUL-21-2006), St Compliance achieved (AUG-29-2006), St Public Notif received (AUG-29-2006)
Past monitoring violations:
Follow-up Or Routine LCR Tap M/R - In OCT-01-2012, Contaminant: Lead and Copper Rule. Follow-up actions: St Violation/Reminder Notice (OCT-31-2013), St Public Notif requested (OCT-31-2013), St Formal NOV issued (OCT-31-2013)
Follow-up Or Routine LCR Tap M/R - In JUL-01-2008, Contaminant: Lead and Copper Rule. Follow-up actions: St Public Notif requested (MAR-16-2009), St Formal NOV issued (MAR-16-2009), St Violation/Reminder Notice (MAR-16-2009), St Public Notif received (JUL-01-2009), St Compliance achieved (OCT-29-2009)
Follow-up Or Routine LCR Tap M/R - In JUL-01-2007, Contaminant: Lead and Copper Rule. Follow-up actions: St Public Notif requested (OCT-15-2007), St Formal NOV issued (OCT-15-2007), St Violation/Reminder Notice (OCT-15-2007), St Compliance achieved (DEC-31-2007), St Public Notif received (DEC-31-2007)
Average household size: This city:
2.5 peopleMassachusetts:
2.5 people
Percentage of family households: This city:
66.4%Whole state:
63.0%
Percentage of households with unmarried partners: This city:
7.9%Whole state:
7.0%
Likely homosexual households (counted as self-reported same-sex unmarried-partner households)
Lesbian couples: 0.6% of all households Gay men: 0.4% of all households
People in group quarters in Attleboro in 2010:
429 people in nursing facilities/skilled-nursing facilities
76 people in group homes intended for adults
37 people in other noninstitutional facilities
22 people in group homes for juveniles (non-correctional)
People in group quarters in Attleboro in 2000:
609 people in nursing homes
79 people in other noninstitutional group quarters
50 people in homes or halfway houses for drug/alcohol abuse
31 people in homes for the mentally ill
30 people in religious group quarters
22 people in homes for the mentally retarded
10 people in other nonhousehold living situations
Banks with branches in Attleboro (2011 data):
Bank of America, National Association: Bronson Branch at 8 North Main Street, branch established on 1910/11/23; Pleasant Street Branch at 505 Pleasant Street, branch established on 1963/11/06. Info updated 2009/11/18: Bank assets: $1,451,969.3 mil, Deposits: $1,077,176.8 mil, headquarters in Charlotte, NC, positive income , 5782 total offices , Holding Company: Bank Of America Corporation
RBS Citizens, National Association: Atteboro Stop & Shop Branch at 469 Pleasant Street, branch established on 2001/12/12; Attleboro Stop & Shop Branch at 251 Washington Street, branch established on 2006/06/14. Info updated 2007/09/19: Bank assets: $106,940.6 mil, Deposits: $75,690.2 mil, headquarters in Providence, RI, positive income , 1135 total offices , Holding Company: Uk Financial Investments Limited
Bristol County Savings Bank: Attleboro Branch at 130 Pleasant Street, branch established on 1994/10/12; Attleborough High School Branch at 100 Rathbun Willard Drive, branch established on 1996/02/14. Info updated 2007/09/11: Bank assets: $1,338.8 mil, Deposits: $1,027.4 mil, headquarters in Taunton, MA, positive income , Commercial Lending Specialization, 13 total offices , Holding Company: Beacon Bancorp
Rockland Trust Company: Attleboro Branch at 490 Pleasant St, branch established on 1995/04/10. Info updated 2009/05/20: Bank assets: $4,974.4 mil, Deposits: $3,903.9 mil, headquarters in Rockland, MA, positive income , Commercial Lending Specialization, 67 total offices , Holding Company: Independent Bank Corp.
Webster Bank, National Association: 27 Park St Branch at 27 Park Street, branch established on 1876/01/01. Info updated 2008/12/23: Bank assets: $18,674.3 mil, Deposits: $13,861.5 mil, headquarters in Waterbury, CT, positive income , Commercial Lending Specialization, 167 total offices , Holding Company: Webster Financial Corporation
Sovereign Bank, National Association: Attleboro - 16 Park Street Branch at 16 Park Street, branch established on 1860/01/01. Info updated 2012/01/31: Bank assets: $78,146.9 mil, Deposits: $48,042.9 mil, headquarters in Wilmington, DE, positive income , Commercial Lending Specialization, 718 total offices , Holding Company: Banco Santander, S.A.
For population 15 years and over in Attleboro:
Never married: 31.7%Now married: 48.2%Separated: 1.3%Widowed: 6.3%Divorced: 12.5% For population 25 years and over in Attleboro:
High school or higher: 90.1%Bachelor's degree or higher: 32.3%Graduate or professional degree: 10.2%Unemployed: 3.7%Mean travel time to work (commute): 25.5 minutes
Education Gini index (Inequality in education) Here:
11.4Massachusetts average:
13.0
Religion statistics for Attleboro, MA (based on Bristol County data)
Religion Adherents Congregations Catholic 286,113 72 Evangelical Protestant 18,765 128 Mainline Protestant 18,246 83 Other 7,807 33 Orthodox 1,565 4 Black Protestant 511 5 None 215,278 -
Source: Clifford Grammich, Kirk Hadaway, Richard Houseal, Dale E.Jones, Alexei Krindatch, Richie Stanley and Richard H.Taylor. 2012. 2010 U.S.Religion Census: Religious Congregations & Membership Study. Association of Statisticians of American Religious Bodies. Jones, Dale E., et al. 2002. Congregations and Membership in the United States 2000. Nashville, TN: Glenmary Research Center. Graphs represent county-level data
Food Environment Statistics: Number of grocery stores : 109Bristol County :
2.00 / 10,000 pop.Massachusetts :
1.98 / 10,000 pop.
Number of supercenters and club stores : 5This county :
0.09 / 10,000 pop.State :
0.05 / 10,000 pop.
Number of convenience stores (no gas) : 105Bristol County :
1.93 / 10,000 pop.Massachusetts :
2.22 / 10,000 pop.
Number of convenience stores (with gas) : 128Bristol County :
2.35 / 10,000 pop.State :
1.77 / 10,000 pop.
Number of full-service restaurants : 447Here :
8.20 / 10,000 pop.State :
8.76 / 10,000 pop.
Adult diabetes rate : This county :
9.5%Massachusetts :
8.1%
Adult obesity rate : Bristol County :
26.9%Massachusetts :
22.5%
Low-income preschool obesity rate : This county :
14.4%State :
16.5%
Health and Nutrition: Healthy diet rate : Here:
49.7%Massachusetts:
50.5%
Average overall health of teeth and gums : Here:
46.6%Massachusetts:
48.0%
Average BMI : Here:
28.9Massachusetts:
28.4
People feeling badly about themselves : This city:
20.7%Massachusetts:
20.7%
People not drinking alcohol at all : Attleboro:
11.1%State:
10.4%
Average hours sleeping at night : Attleboro:
6.8Massachusetts:
6.8
Overweight people : Attleboro:
34.4%State:
33.4%
General health condition : This city:
56.6%Massachusetts:
57.1%
Average condition of hearing : This city:
78.6%Massachusetts:
79.2%
More about Health and Nutrition of Attleboro, MA Residents
Local government employment and payroll (March 2022)
Function
Full-time employees
Monthly full-time payroll
Average yearly full-time wage
Part-time employees
Monthly part-time payroll
Elementary and Secondary - Instruction
540 $3,896,609 $86,591 64 $177,710 Elementary and Secondary - Other Total
313 $1,051,423 $40,310 30 $51,766 Firefighters
101 $746,290 $88,668 0 $0 Police Protection - Officers
83 $611,227 $88,370 12 $41,531 Parks and Recreation
34 $188,471 $66,519 12 $8,450 Sewerage
32 $192,049 $72,018 0 $0 Water Supply
30 $172,307 $68,923 0 $0 Financial Administration
25 $147,821 $70,954 0 $0 Streets and Highways
20 $121,051 $72,631 0 $0 Other Government Administration
19 $127,596 $80,587 1 $1,050 Local Libraries
12 $63,833 $63,833 10 $14,384 Police - Other
11 $64,604 $70,477 33 $47,625 Fire - Other
9 $52,735 $70,313 0 $0 Welfare
9 $38,586 $51,448 7 $7,560 Health
9 $50,371 $67,161 1 $1,678 Other and Unallocable
1 $8,219 $98,628 0 $0
Totals for Government
1,248 $7,533,192 $72,435 170 $351,753
Attleboro government finances - Expenditure in 2018 (per resident):
Construction - Water Utilities: $2,652,000 ($56.91)
Sewerage: $2,321,000 ($49.81)General - Other: $1,636,000 ($35.11)Housing and Community Development: $250,000 ($5.36)General Public Buildings: $99,000 ($2.12)Current Operations - Elementary and Secondary Education: $82,419,000 ($1768.61)
General - Other: $9,574,000 ($205.45)Local Fire Protection: $8,459,000 ($181.52)Police Protection: $8,007,000 ($171.82)Sewerage: $4,945,000 ($106.11)Water Utilities: $4,635,000 ($99.46)Regular Highways: $4,387,000 ($94.14)Health - Other: $2,660,000 ($57.08)Financial Administration: $2,117,000 ($45.43)Central Staff Services: $2,024,000 ($43.43)Parks and Recreation: $1,772,000 ($38.02)Libraries: $1,191,000 ($25.56)Public Welfare - Other: $964,000 ($20.69)Protective Inspection and Regulation - Other: $700,000 ($15.02)Housing and Community Development: $223,000 ($4.79)General - Interest on Debt: $1,337,000 ($28.69)
Intergovernmental to Local - Other - Elementary and Secondary Education: $2,567,000 ($55.08)
Other - Health - Other: $102,000 ($2.19)Intergovernmental to State - Transit Utilities: $408,000 ($8.76)
General - Other: $74,000 ($1.59)Other Capital Outlay - Sewerage: $2,407,000 ($51.65)
Water Utilities: $1,584,000 ($33.99)Elementary and Secondary Education: $889,000 ($19.08)General - Other: $746,000 ($16.01)Regular Highways: $152,000 ($3.26)General Public Building: $89,000 ($1.91)Parks and Recreation: $38,000 ($0.82)Central Staff Services: $28,000 ($0.60)Total Salaries and Wages: $65,915,000 ($1414.45)
Water Utilities - Interest on Debt: $178,000 ($3.82)
Attleboro government finances - Revenue in 2018 (per resident):
Charges - Sewerage: $9,810,000 ($210.51)
Other: $2,605,000 ($55.90)Solid Waste Management: $2,576,000 ($55.28)Elementary and Secondary Education School Tuition and Transportation: $1,464,000 ($31.42)Elementary and Secondary Education School Lunch: $1,132,000 ($24.29)Elementary and Secondary Education - Other: $222,000 ($4.76)Parks and Recreation: $3,000 ($0.06)Federal Intergovernmental - Housing and Community Development: $303,000 ($6.50)
Other: $225,000 ($4.83)Education: $63,000 ($1.35)Miscellaneous - General Revenue - Other: $1,062,000 ($22.79)
Donations From Private Sources: $721,000 ($15.47)Fines and Forfeits: $141,000 ($3.03)Interest Earnings: $84,000 ($1.80)Revenue - Water Utilities: $7,562,000 ($162.27)
State Intergovernmental - Education: $42,877,000 ($920.09)
General Local Government Support: $5,852,000 ($125.58)Other: $2,149,000 ($46.11)Highways: $1,100,000 ($23.60)Public Welfare: $592,000 ($12.70)Sewerage: $360,000 ($7.73)Tax - Property: $75,537,000 ($1620.93)
Other License: $1,356,000 ($29.10)Other Selective Sales: $1,276,000 ($27.38)
Attleboro government finances - Debt in 2018 (per resident):
Long Term Debt - Outstanding Unspecified Public Purpose: $53,616,000 ($1150.53)
Beginning Outstanding - Unspecified Public Purpose: $48,004,000 ($1030.11)Issue, Unspecified Public Purpose: $13,180,000 ($282.83)Retired Unspecified Public Purpose: $7,568,000 ($162.40)Short Term Debt Outstanding - Beginning: $12,003,000 ($257.57)
End of Fiscal Year: $6,499,000 ($139.46)
Attleboro government finances - Cash and Securities in 2018 (per resident):
Bond Funds - Cash and Securities: $14,311,000 ($307.10)
Other Funds - Cash and Securities: $18,851,000 ($404.52)
4.76% of this county's 2021 resident taxpayers lived in other counties in 2020 ($70,162 average adjusted gross income )
Here:
4.76%Massachusetts average:
6.35%
0.01% of residents moved from foreign countries ($64 average AGI )Bristol County:
0.01%Massachusetts average:
0.01%
Top counties from which taxpayers relocated into this county between 2020 and 2021:
4.63% of this county's 2020 resident taxpayers moved to other counties in 2021 ($72,404 average adjusted gross income )
Here:
4.63%Massachusetts average:
7.18%
0.01% of residents moved to foreign countries ($83 average AGI )Bristol County:
0.01%Massachusetts average:
0.02%
Top counties to which taxpayers relocated from this county between 2020 and 2021:
Businesses in Attleboro, MA
Name Count Name Count
7-Eleven 1 H&R Block 1 Advance Auto Parts 1 KFC 1 Ashley Furniture 1 MasterBrand Cabinets 1 AutoZone 1 McDonald's 2 Avenue 1 Payless 2 CVS 2 Ruby Tuesday 1 Chuck E. Cheese's 1 Stop & Shop 2 Curves 1 Taco Bell 1 Days Inn 1 U-Haul 1 Domino's Pizza 1 UPS 5 Dunkin Donuts 9 Verizon Wireless 1 FedEx 5 Walgreens 1 Finish Line 1 YMCA 2
Strongest AM radio stations in Attleboro:
WARL (1320 AM; 5 kW; ATTLEBORO, MA; Owner: THE ADD RADIO GROUP, INC.)
WDDZ (550 AM; 5 kW; PAWTUCKET, RI; Owner: ABC, INC.)
WALE (990 AM; 50 kW; GREENVILLE, RI; Owner: NORTH AMERICAN BROADCASTING CO., INC.)
WSKO (790 AM; 5 kW; PROVIDENCE, RI; Owner: CITADEL BROADCASTING COMPANY)
WRNI (1290 AM; 10 kW; PROVIDENCE, RI; Owner: WRNI FOUNDATION)
WEEI (850 AM; 50 kW; BOSTON, MA; Owner: ENTERCOM BOSTON LICENSE, LLC)
WPMZ (1110 AM; daytime; 5 kW; EAST PROVIDENCE, RI; Owner: VIDEO MUNDO B/CASTING CO., LLC)
WPRO (630 AM; 5 kW; PROVIDENCE, RI; Owner: CITADEL BROADCASTING COMPANY)
WKOX (1200 AM; 50 kW; FRAMINGHAM, MA; Owner: CAPSTAR TX LIMITED PARTNERSHIP)
WBIX (1060 AM; 40 kW; NATICK, MA; Owner: LANGER BROADCASTING CORPORATION)
WAMG (890 AM; 25 kW; DEDHAM, MA; Owner: MEGA COMMUNICATIONS OF DEDHAM LICENSEE, LLC)
WHJJ (920 AM; 5 kW; PROVIDENCE, RI)
WRKO (680 AM; 50 kW; BOSTON, MA; Owner: ENTERCOM BOSTON LICENSE, LLC)
Strongest FM radio stations in Attleboro:
WWBB (101.5 FM; PROVIDENCE, RI; Owner: CLEAR CHANNEL BROADCASTING LICENSES, INC.)
WSNE-FM (93.3 FM; TAUNTON, MA; Owner: CAPSTAR TX LIMITED PARTNERSHIP)
WBRU (95.5 FM; PROVIDENCE, RI; Owner: BROWN BROADCASTING SERVICE, INC.)
WHJY (94.1 FM; PROVIDENCE, RI; Owner: CAPSTAR TX LIMITED PARTNERSHIP)
WWKX (106.3 FM; WOONSOCKET, RI; Owner: AAA ENTERTAINMENT LICENSING LLC)
WPRO-FM (92.3 FM; PROVIDENCE, RI; Owner: CITADEL BROADCASTING COMPANY)
WWLI (105.1 FM; PROVIDENCE, RI; Owner: CITADEL BROADCASTING COMPANY)
WBMX (98.5 FM; BOSTON, MA; Owner: INFINITY RADIO OPERATIONS INC.)
WBOS (92.9 FM; BROOKLINE, MA; Owner: GREATER BOSTON RADIO, INC.)
WJMN (94.5 FM; BOSTON, MA; Owner: AMFM RADIO LICENSES, L.L.C.)
WCRB (102.5 FM; WALTHAM, MA; Owner: CHARLES RIVER BROADCASTING WCRB LICE)
WTKK (96.9 FM; BOSTON, MA; Owner: GREATER BOSTON RADIO, INC.)
WROR-FM (105.7 FM; FRAMINGHAM, MA; Owner: GREATER BOSTON RADIO, INC.)
WGBH (89.7 FM; BOSTON, MA; Owner: WGBH EDUCATIONAL FOUNDATION)
WBUR-FM (90.9 FM; BOSTON, MA; Owner: TRUSTEES OF BOSTON UNIVERSITY)
WBOT (97.7 FM; BROCKTON, MA; Owner: RADIO ONE LICENSES, LLC)
WXKS-FM (107.9 FM; MEDFORD, MA; Owner: AMFM RADIO LICENSES, L.L.C.)
WELH (88.1 FM; PROVIDENCE, RI; Owner: THE WHEELER SCHOOL)
WMJX (106.7 FM; BOSTON, MA; Owner: GREATER BOSTON RADIO, INC.)
WODS (103.3 FM; BOSTON, MA; Owner: INFINITY BROADCASTING OPERATIONS, INC.)
TV broadcast stations around Attleboro:
WPRI-TV (Channel 12; PROVIDENCE, RI; Owner: TVL BROADCASTING OF RHODE ISLAND, LLC)
WNAC-TV (Channel 64; PROVIDENCE, RI; Owner: WNAC, LLC)
WJAR (Channel 10; PROVIDENCE, RI; Owner: OUTLET BROADCASTING, INC.)
WSBE-TV (Channel 36; PROVIDENCE, RI; Owner: RHODE ISLAND PUBLIC TELECOM. AUTHORITY)
WLNE-TV (Channel 6; NEW BEDFORD, MA; Owner: FREEDOM BROADCASTING OF SOUTHERN NEW ENGLAND, INC.)
WWDP (Channel 46; NORWELL, MA; Owner: NORWELL TELEVISION, LLC)
WCVB-TV (Channel 5; BOSTON, MA; Owner: WCVB HEARST-ARGYLE TV, INC.)
WGBH-TV (Channel 2; BOSTON, MA; Owner: WGBH EDUCATIONAL FOUNDATION)
WHDH-TV (Channel 7; BOSTON, MA; Owner: WHDH-TV)
WMFP (Channel 62; LAWRENCE, MA; Owner: WSAH LICENSE, INC.)
WSBK-TV (Channel 38; BOSTON, MA; Owner: VIACOM INC.)
WLVI-TV (Channel 56; CAMBRIDGE, MA; Owner: WLVI, INC.)
WBZ-TV (Channel 4; BOSTON, MA; Owner: VIACOM INC.)
WGBX-TV (Channel 44; BOSTON, MA; Owner: WGBH EDUCATIONAL FOUNDATION)
WPXQ (Channel 69; BLOCK ISLAND, RI; Owner: OCEAN STATE TELEVISION, L.L.C.)
WFXT (Channel 25; BOSTON, MA; Owner: FOX TELEVISION STATIONS INC.)
WRIW-LP (Channel 50; PROVIDENCE, RI; Owner: ZGS PROVIDENCE, INC.)
WUTF (Channel 66; MARLBOROUGH, MA; Owner: TELEFUTURA BOSTON LLC)
WLWC (Channel 28; NEW BEDFORD, MA; Owner: C-28 FCC LICENSEE SUBSIDIARY, LLC)
WUNI (Channel 27; WORCESTER, MA; Owner: ENTRAVISION HOLDINGS, LLC)
W40BO (Channel 40; BOSTON, MA; Owner: PAXSON COMMUNICATIONS LPTV, INC.)
WBPX (Channel 68; BOSTON, MA; Owner: PAXSON BOSTON-68 LICENSE, INC.)
WTMU-LP (Channel 32; BOSTON, MA; Owner: ZGS BOSTON, INC.)
WCEA-LP (Channel 58; BOSTON, MA; Owner: CHANNEL 19 TV CORPORATION)
National Bridge Inventory (NBI) Statistics 58 Number of bridges558ft / 170m Total length $126,047,000 Total costs1,648,753 Total average daily traffic79,314 Total average daily truck traffic
New bridges - historical statistics
2 Before 1900 2 1900-1909 2 1920-1929 1 1930-1939 1 1940-1949 13 1950-1959 19 1960-1969 1 1970-1979 1 1980-1989 6 1990-1999 4 2000-2009 6 2010-2019
See full National Bridge Inventory statistics for Attleboro, MA
Home Mortgage Disclosure Act Aggregated Statistics For Year 2009(Based on 8 full tracts) A) FHA, FSA/RHS & VA B) Conventional C) Refinancings D) Home Improvement Loans E) Loans on Dwellings For 5+ Families F) Non-occupant Loans on G) Loans On Manufactured Number Average Value Number Average Value Number Average Value Number Average Value Number Average Value Number Average Value Number Average Value
LOANS ORIGINATED 199 $240,477 201 $190,612 1,105 $207,844 67 $101,104 1 $444,000 41 $152,585 9 $42,889 APPLICATIONS APPROVED, NOT ACCEPTED 16 $205,812 21 $192,476 81 $212,938 8 $28,875 1 $260,000 3 $180,000 4 $53,000 APPLICATIONS DENIED 31 $210,032 57 $149,263 335 $227,687 30 $92,200 2 $687,500 29 $178,069 10 $45,000 APPLICATIONS WITHDRAWN 22 $214,000 18 $203,556 209 $221,014 4 $113,750 0 $0 6 $188,333 0 $0 FILES CLOSED FOR INCOMPLETENESS 5 $161,800 7 $196,571 61 $219,328 2 $244,500 0 $0 2 $200,000 0 $0
Aggregated Statistics For Year 2008(Based on 8 full tracts) A) FHA, FSA/RHS & VA B) Conventional C) Refinancings D) Home Improvement Loans E) Loans on Dwellings For 5+ Families F) Non-occupant Loans on G) Loans On Manufactured Number Average Value Number Average Value Number Average Value Number Average Value Number Average Value Number Average Value Number Average Value
LOANS ORIGINATED 122 $230,107 270 $211,163 571 $200,123 98 $43,806 10 $714,200 55 $194,400 22 $60,455 APPLICATIONS APPROVED, NOT ACCEPTED 10 $235,700 29 $208,483 99 $202,273 14 $43,786 0 $0 5 $223,200 6 $113,167 APPLICATIONS DENIED 29 $231,069 62 $175,000 352 $217,088 61 $63,902 3 $487,333 28 $174,286 14 $59,071 APPLICATIONS WITHDRAWN 7 $249,429 39 $212,436 142 $223,458 6 $126,000 1 $262,000 14 $202,286 2 $77,500 FILES CLOSED FOR INCOMPLETENESS 1 $142,000 6 $216,000 24 $212,708 8 $79,000 0 $0 1 $130,000 0 $0
Aggregated Statistics For Year 2007(Based on 8 full tracts) A) FHA, FSA/RHS & VA B) Conventional C) Refinancings D) Home Improvement Loans E) Loans on Dwellings For 5+ Families F) Non-occupant Loans on G) Loans On Manufactured Number Average Value Number Average Value Number Average Value Number Average Value Number Average Value Number Average Value Number Average Value
LOANS ORIGINATED 26 $262,885 566 $208,857 741 $192,893 209 $78,933 8 $481,125 95 $213,800 23 $64,652 APPLICATIONS APPROVED, NOT ACCEPTED 3 $234,667 71 $200,803 146 $216,925 37 $63,189 0 $0 16 $213,500 8 $80,375 APPLICATIONS DENIED 4 $297,500 125 $227,096 563 $229,758 82 $79,793 1 $350,000 44 $211,750 7 $56,571 APPLICATIONS WITHDRAWN 0 $0 37 $223,378 216 $227,278 22 $124,909 1 $323,000 12 $208,500 0 $0 FILES CLOSED FOR INCOMPLETENESS 0 $0 14 $207,929 86 $259,035 6 $132,667 1 $480,000 4 $265,500 1 $50,000
Aggregated Statistics For Year 2006(Based on 8 full tracts) A) FHA, FSA/RHS & VA B) Conventional C) Refinancings D) Home Improvement Loans E) Loans on Dwellings For 5+ Families F) Non-occupant Loans on G) Loans On Manufactured Number Average Value Number Average Value Number Average Value Number Average Value Number Average Value Number Average Value Number Average Value
LOANS ORIGINATED 12 $306,833 849 $188,549 1,132 $183,188 283 $70,081 13 $983,538 108 $202,639 33 $77,212 APPLICATIONS APPROVED, NOT ACCEPTED 0 $0 94 $197,213 193 $177,316 50 $60,460 4 $417,500 15 $245,200 6 $71,833 APPLICATIONS DENIED 2 $253,000 151 $177,483 653 $223,035 124 $92,976 5 $217,400 44 $221,795 15 $77,467 APPLICATIONS WITHDRAWN 1 $332,000 70 $188,186 440 $214,841 39 $103,795 2 $195,000 23 $160,130 5 $79,800 FILES CLOSED FOR INCOMPLETENESS 0 $0 16 $209,562 105 $238,410 9 $85,000 1 $450,000 3 $263,333 1 $194,000
Aggregated Statistics For Year 2005(Based on 8 full tracts) A) FHA, FSA/RHS & VA B) Conventional C) Refinancings D) Home Improvement Loans E) Loans on Dwellings For 5+ Families F) Non-occupant Loans on G) Loans On Manufactured Number Average Value Number Average Value Number Average Value Number Average Value Number Average Value Number Average Value Number Average Value
LOANS ORIGINATED 10 $265,600 997 $201,200 1,576 $196,799 276 $88,989 8 $410,375 155 $224,477 32 $56,094 APPLICATIONS APPROVED, NOT ACCEPTED 3 $270,333 78 $193,000 205 $192,620 22 $94,364 2 $484,500 19 $207,421 3 $51,333 APPLICATIONS DENIED 4 $264,000 208 $176,274 650 $214,758 110 $90,000 1 $360,000 70 $206,629 28 $78,536 APPLICATIONS WITHDRAWN 7 $258,714 166 $190,723 708 $206,362 76 $176,645 4 $249,250 46 $208,674 5 $75,200 FILES CLOSED FOR INCOMPLETENESS 1 $395,000 25 $214,200 95 $242,937 6 $80,000 0 $0 10 $210,600 0 $0
Aggregated Statistics For Year 2004(Based on 8 full tracts) A) FHA, FSA/RHS & VA B) Conventional C) Refinancings D) Home Improvement Loans E) Loans on Dwellings For 5+ Families F) Non-occupant Loans on G) Loans On Manufactured Number Average Value Number Average Value Number Average Value Number Average Value Number Average Value Number Average Value Number Average Value
LOANS ORIGINATED 45 $249,644 961 $208,977 1,680 $187,206 247 $82,279 12 $610,583 156 $203,519 23 $52,478 APPLICATIONS APPROVED, NOT ACCEPTED 4 $224,500 106 $216,151 237 $190,143 48 $82,625 2 $1,230,000 16 $195,250 8 $109,875 APPLICATIONS DENIED 7 $290,857 141 $191,574 502 $191,528 141 $73,518 5 $329,000 34 $179,529 19 $58,737 APPLICATIONS WITHDRAWN 4 $295,250 103 $208,544 631 $192,098 52 $107,058 2 $87,500 29 $173,759 2 $254,000 FILES CLOSED FOR INCOMPLETENESS 1 $290,000 21 $194,762 103 $210,019 8 $198,250 0 $0 3 $223,667 0 $0
Aggregated Statistics For Year 2003(Based on 8 full tracts) A) FHA, FSA/RHS & VA B) Conventional C) Refinancings D) Home Improvement Loans E) Loans on Dwellings For 5+ Families F) Non-occupant Loans on Number Average Value Number Average Value Number Average Value Number Average Value Number Average Value Number Average Value
LOANS ORIGINATED 70 $234,543 713 $202,861 3,698 $160,666 168 $51,661 7 $1,113,571 184 $170,076 APPLICATIONS APPROVED, NOT ACCEPTED 5 $267,600 83 $197,458 436 $161,268 39 $56,821 0 $0 25 $135,080 APPLICATIONS DENIED 16 $217,375 136 $167,353 613 $158,347 67 $62,448 1 $240,000 39 $168,282 APPLICATIONS WITHDRAWN 4 $260,000 71 $190,958 663 $176,615 21 $35,810 2 $351,500 23 $195,304 FILES CLOSED FOR INCOMPLETENESS 4 $226,250 9 $138,556 76 $174,184 4 $25,000 0 $0 1 $137,000
Aggregated Statistics For Year 2002(Based on 8 full tracts) A) FHA, FSA/RHS & VA B) Conventional C) Refinancings D) Home Improvement Loans E) Loans on Dwellings For 5+ Families F) Non-occupant Loans on Number Average Value Number Average Value Number Average Value Number Average Value Number Average Value Number Average Value
LOANS ORIGINATED 100 $208,220 718 $176,163 2,654 $153,424 227 $40,101 12 $560,417 158 $150,525 APPLICATIONS APPROVED, NOT ACCEPTED 6 $265,833 63 $190,460 338 $133,556 51 $35,941 1 $188,000 20 $119,500 APPLICATIONS DENIED 13 $178,538 96 $138,885 457 $127,536 115 $30,043 2 $298,000 36 $139,722 APPLICATIONS WITHDRAWN 7 $195,429 52 $161,423 377 $139,594 30 $42,067 1 $8,150,000 14 $137,143 FILES CLOSED FOR INCOMPLETENESS 1 $146,000 9 $183,889 63 $140,952 2 $15,000 0 $0 6 $95,500
Aggregated Statistics For Year 2001(Based on 8 full tracts) A) FHA, FSA/RHS & VA B) Conventional C) Refinancings D) Home Improvement Loans E) Loans on Dwellings For 5+ Families F) Non-occupant Loans on Number Average Value Number Average Value Number Average Value Number Average Value Number Average Value Number Average Value
LOANS ORIGINATED 157 $171,191 705 $155,196 2,045 $133,468 206 $37,655 13 $677,154 116 $127,379 APPLICATIONS APPROVED, NOT ACCEPTED 3 $182,333 83 $153,120 235 $108,983 62 $35,823 2 $198,500 14 $120,357 APPLICATIONS DENIED 17 $166,294 95 $123,442 455 $109,879 118 $30,441 1 $202,000 21 $134,857 APPLICATIONS WITHDRAWN 11 $159,636 51 $137,569 306 $117,536 46 $43,696 1 $192,000 8 $115,250 FILES CLOSED FOR INCOMPLETENESS 1 $160,000 9 $173,000 47 $120,362 3 $25,000 0 $0 2 $127,500
Aggregated Statistics For Year 2000(Based on 8 full tracts) A) FHA, FSA/RHS & VA B) Conventional C) Refinancings D) Home Improvement Loans E) Loans on Dwellings For 5+ Families F) Non-occupant Loans on Number Average Value Number Average Value Number Average Value Number Average Value Number Average Value Number Average Value
LOANS ORIGINATED 154 $140,214 614 $131,230 469 $93,593 199 $24,955 8 $285,125 58 $120,966 APPLICATIONS APPROVED, NOT ACCEPTED 10 $154,200 59 $120,186 84 $88,417 75 $24,320 0 $0 11 $96,636 APPLICATIONS DENIED 14 $129,929 125 $90,688 268 $79,993 120 $23,842 0 $0 14 $87,000 APPLICATIONS WITHDRAWN 15 $150,600 65 $121,908 223 $84,135 27 $42,333 0 $0 12 $91,750 FILES CLOSED FOR INCOMPLETENESS 6 $133,333 5 $148,200 24 $88,833 4 $24,000 0 $0 4 $103,750
Aggregated Statistics For Year 1999(Based on 8 full tracts) A) FHA, FSA/RHS & VA B) Conventional C) Refinancings D) Home Improvement Loans E) Loans on Dwellings For 5+ Families F) Non-occupant Loans on Number Average Value Number Average Value Number Average Value Number Average Value Number Average Value Number Average Value
LOANS ORIGINATED 169 $131,448 567 $131,337 856 $98,269 192 $26,031 8 $256,152 81 $92,379 APPLICATIONS APPROVED, NOT ACCEPTED 7 $127,444 57 $124,571 113 $105,310 58 $22,372 0 $0 16 $120,817 APPLICATIONS DENIED 24 $120,352 91 $102,092 237 $100,789 108 $21,386 1 $157,500 19 $92,222 APPLICATIONS WITHDRAWN 14 $121,382 65 $109,364 239 $93,051 27 $51,426 1 $1,012,000 19 $97,434 FILES CLOSED FOR INCOMPLETENESS 2 $81,500 11 $148,302 32 $102,048 1 $13,000 0 $0 3 $95,323
Detailed HMDA statistics for the following Tracts:
6311.00
, 6312.00 , 6313.00 , 6314.00 , 6315.00 , 6316.00 , 6317.00 , 6318.00
Private Mortgage Insurance Companies Aggregated Statistics For Year 2009(Based on 8 full tracts) A) Conventional B) Refinancings Number Average Value Number Average Value
LOANS ORIGINATED 36 $258,556 29 $279,207 APPLICATIONS APPROVED, NOT ACCEPTED 8 $242,000 11 $243,091 APPLICATIONS DENIED 4 $174,500 4 $254,000 APPLICATIONS WITHDRAWN 0 $0 0 $0 FILES CLOSED FOR INCOMPLETENESS 1 $334,000 0 $0
Aggregated Statistics For Year 2008(Based on 8 full tracts) A) Conventional B) Refinancings C) Non-occupant Loans on Number Average Value Number Average Value Number Average Value
LOANS ORIGINATED 96 $256,125 54 $295,685 3 $192,333 APPLICATIONS APPROVED, NOT ACCEPTED 25 $251,800 33 $306,152 2 $310,000 APPLICATIONS DENIED 6 $184,500 7 $255,286 2 $257,000 APPLICATIONS WITHDRAWN 6 $281,500 2 $256,500 1 $106,000 FILES CLOSED FOR INCOMPLETENESS 2 $259,000 2 $287,000 0 $0
Aggregated Statistics For Year 2007(Based on 8 full tracts) A) Conventional B) Refinancings C) Non-occupant Loans on Number Average Value Number Average Value Number Average Value
LOANS ORIGINATED 162 $250,654 68 $270,588 12 $251,917 APPLICATIONS APPROVED, NOT ACCEPTED 32 $273,906 20 $303,950 3 $324,667 APPLICATIONS DENIED 2 $293,500 1 $385,000 0 $0 APPLICATIONS WITHDRAWN 5 $316,200 4 $298,750 1 $208,000 FILES CLOSED FOR INCOMPLETENESS 0 $0 0 $0 0 $0
Aggregated Statistics For Year 2006(Based on 8 full tracts) A) Conventional B) Refinancings C) Non-occupant Loans on Number Average Value Number Average Value Number Average Value
LOANS ORIGINATED 70 $258,843 47 $271,383 4 $271,500 APPLICATIONS APPROVED, NOT ACCEPTED 19 $260,053 16 $300,438 2 $253,500 APPLICATIONS DENIED 1 $184,000 1 $332,000 0 $0 APPLICATIONS WITHDRAWN 2 $235,500 2 $319,500 1 $383,000 FILES CLOSED FOR INCOMPLETENESS 0 $0 0 $0 0 $0
Aggregated Statistics For Year 2005(Based on 8 full tracts) A) Conventional B) Refinancings C) Non-occupant Loans on Number Average Value Number Average Value Number Average Value
LOANS ORIGINATED 82 $257,037 44 $273,682 3 $239,667 APPLICATIONS APPROVED, NOT ACCEPTED 24 $296,208 11 $294,091 1 $248,000 APPLICATIONS DENIED 1 $330,000 1 $304,000 0 $0 APPLICATIONS WITHDRAWN 5 $260,600 0 $0 0 $0 FILES CLOSED FOR INCOMPLETENESS 1 $243,000 0 $0 0 $0
Aggregated Statistics For Year 2004(Based on 8 full tracts) A) Conventional B) Refinancings C) Non-occupant Loans on Number Average Value Number Average Value Number Average Value
LOANS ORIGINATED 130 $252,762 41 $238,927 8 $242,500 APPLICATIONS APPROVED, NOT ACCEPTED 31 $248,742 18 $222,778 1 $182,000 APPLICATIONS DENIED 4 $358,000 4 $260,500 3 $265,333 APPLICATIONS WITHDRAWN 9 $293,556 1 $195,000 2 $272,000 FILES CLOSED FOR INCOMPLETENESS 1 $175,000 3 $254,333 1 $270,000
Aggregated Statistics For Year 2003(Based on 8 full tracts) A) Conventional B) Refinancings C) Non-occupant Loans on Number Average Value Number Average Value Number Average Value
LOANS ORIGINATED 206 $224,830 107 $227,495 11 $221,636 APPLICATIONS APPROVED, NOT ACCEPTED 30 $233,500 50 $216,020 3 $148,000 APPLICATIONS DENIED 3 $234,000 2 $188,500 0 $0 APPLICATIONS WITHDRAWN 3 $151,667 4 $192,500 0 $0 FILES CLOSED FOR INCOMPLETENESS 0 $0 0 $0 0 $0
Aggregated Statistics For Year 2002(Based on 8 full tracts) A) Conventional B) Refinancings C) Non-occupant Loans on Number Average Value Number Average Value Number Average Value
LOANS ORIGINATED 224 $205,000 126 $197,889 25 $181,640 APPLICATIONS APPROVED, NOT ACCEPTED 38 $210,079 25 $187,440 1 $189,000 APPLICATIONS DENIED 2 $190,000 3 $168,000 1 $144,000 APPLICATIONS WITHDRAWN 3 $255,000 14 $187,429 1 $165,000 FILES CLOSED FOR INCOMPLETENESS 1 $220,000 1 $170,000 0 $0
Aggregated Statistics For Year 2001(Based on 8 full tracts) A) Conventional B) Refinancings C) Non-occupant Loans on Number Average Value Number Average Value Number Average Value
LOANS ORIGINATED 270 $171,767 128 $168,711 14 $145,500 APPLICATIONS APPROVED, NOT ACCEPTED 28 $153,000 36 $169,306 6 $127,333 APPLICATIONS DENIED 8 $170,125 2 $116,500 2 $185,000 APPLICATIONS WITHDRAWN 2 $213,500 2 $173,000 0 $0 FILES CLOSED FOR INCOMPLETENESS 0 $0 1 $149,000 0 $0
Aggregated Statistics For Year 2000(Based on 8 full tracts) A) Conventional B) Refinancings C) Non-occupant Loans on Number Average Value Number Average Value Number Average Value
LOANS ORIGINATED 242 $151,901 44 $140,114 16 $120,688 APPLICATIONS APPROVED, NOT ACCEPTED 18 $148,167 5 $151,800 0 $0 APPLICATIONS DENIED 9 $140,333 0 $0 2 $106,000 APPLICATIONS WITHDRAWN 5 $160,600 2 $117,000 0 $0 FILES CLOSED FOR INCOMPLETENESS 1 $119,000 0 $0 0 $0
Aggregated Statistics For Year 1999(Based on 8 full tracts) A) Conventional B) Refinancings C) Non-occupant Loans on Number Average Value Number Average Value Number Average Value
LOANS ORIGINATED 265 $139,904 112 $130,030 11 $106,969 APPLICATIONS APPROVED, NOT ACCEPTED 17 $177,051 19 $124,688 0 $0 APPLICATIONS DENIED 9 $138,510 5 $108,614 0 $0 APPLICATIONS WITHDRAWN 5 $138,542 3 $111,113 0 $0 FILES CLOSED FOR INCOMPLETENESS 1 $146,690 2 $154,975 0 $0
Detailed PMIC statistics for the following Tracts:
6311.00
, 6312.00 , 6313.00 , 6314.00 , 6315.00 , 6316.00 , 6317.00 , 6318.00 Attleboro compared to Massachusetts state average:
Unemployed percentage significantly below state average. Length of stay since moving in significantly above state average.
#80 on the list of "Top 101 cities with the most residents born in Portugal (population 500+)"
#101 on the list of "Top 101 cities with the biggest property tax revenues per resident (population 10,000+)"
#82 (02861) on the list of "Top 101 zip codes with the largest percentage of Portuguese first ancestries (pop 5,000+)"
#14 on the list of "Top 101 counties with the lowest percentage of residents that keep firearms around their homes"
#29 on the list of "Top 101 counties with the lowest percentage of residents relocating to foreign countries in 2011 (pop. 50,000+)"
#32 on the list of "Top 101 counties with the most Catholic congregations"
#34 on the list of "Top 101 counties with the highest percentage of residents that smoked 100+ cigarettes in their lives"
#41 on the list of "Top 101 counties with the most Catholic adherents"
Top Patent Applicants
Raymond A. Bojarski (52)
Oscar R. Carrillo, Jr. (19)
James G. Calvin (16)
Les Hull (15)
Ray Bojarski (14)
William E. Tucker (14)
Binod B. De (13)
Russell F. Durgin (13)
Philip T. Stokoe (11)
Sanjay Malik (11)
Total of 537 patent applications in 2008-2024.


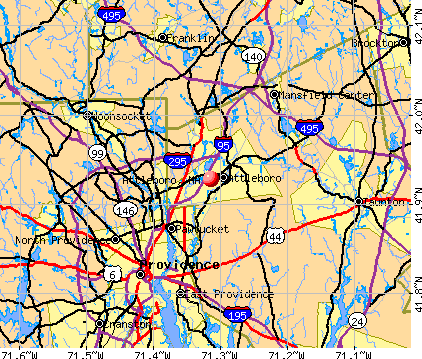


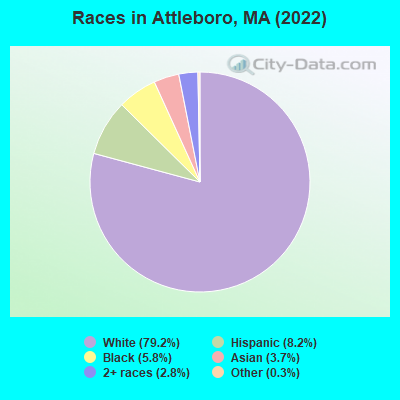
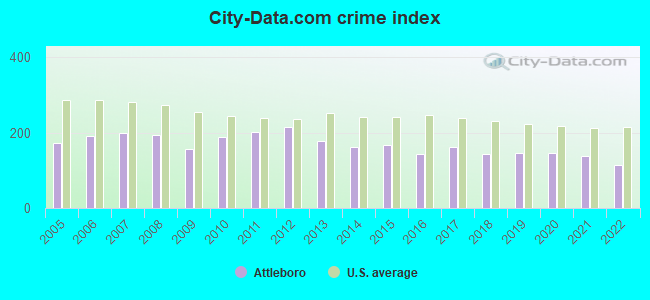
 Recent articles from our blog. Our writers, many of them Ph.D. graduates or candidates, create easy-to-read articles on a wide variety of topics.


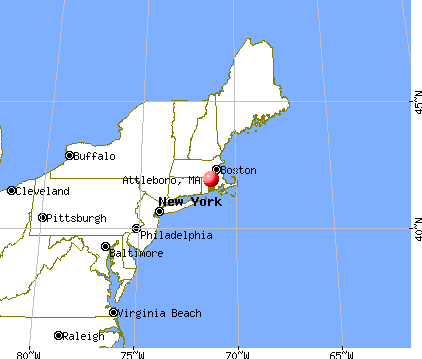
 (4.8 miles
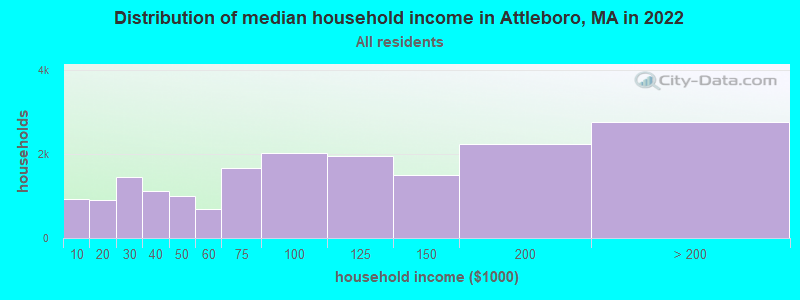
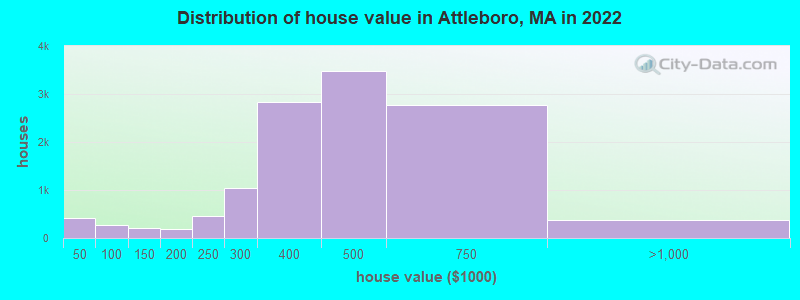
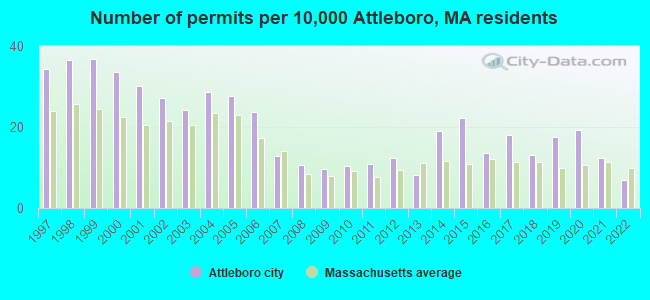
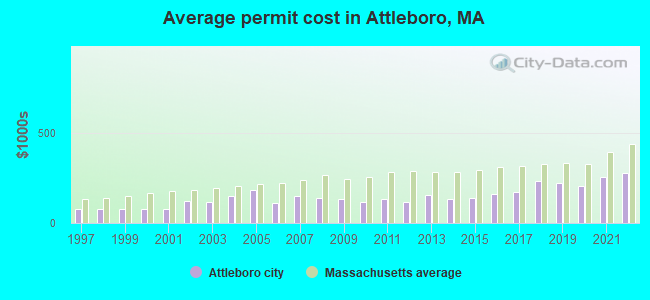
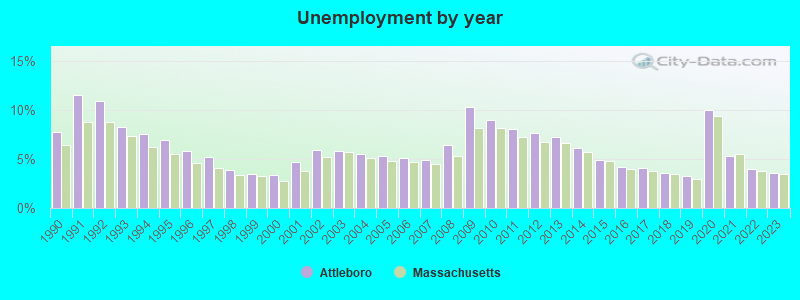
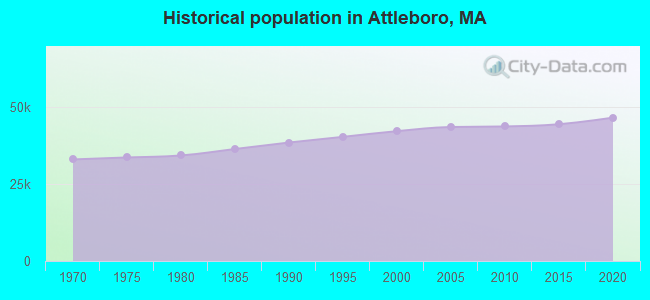
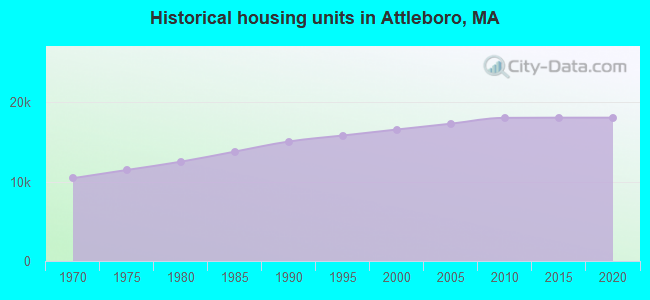
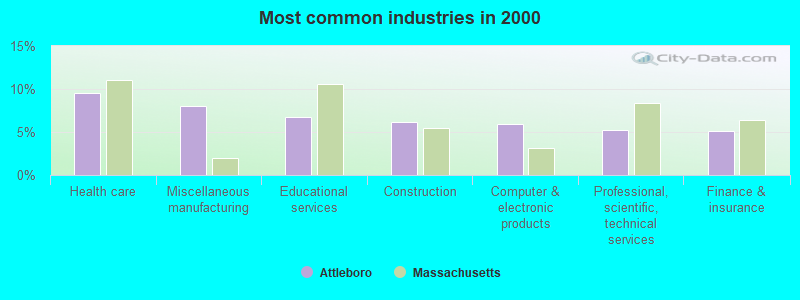
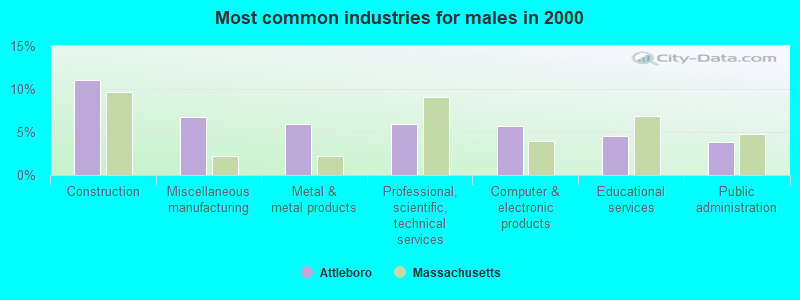
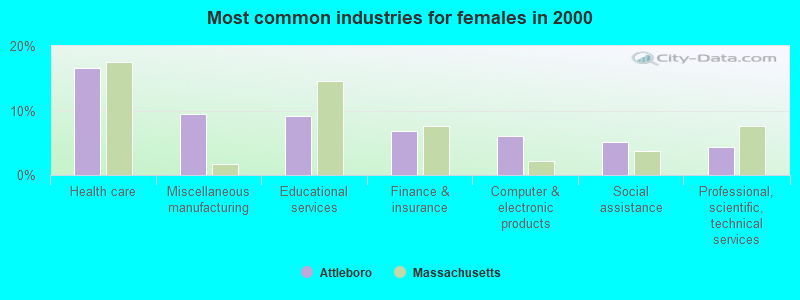
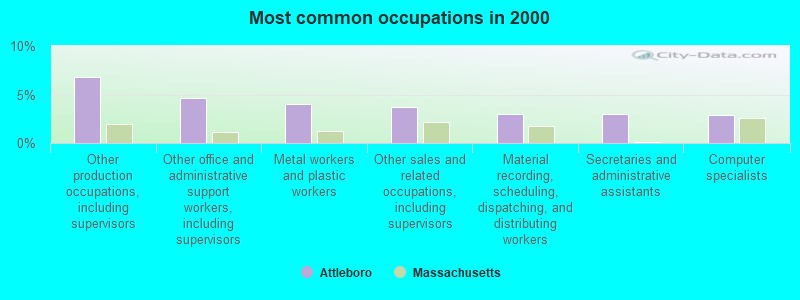
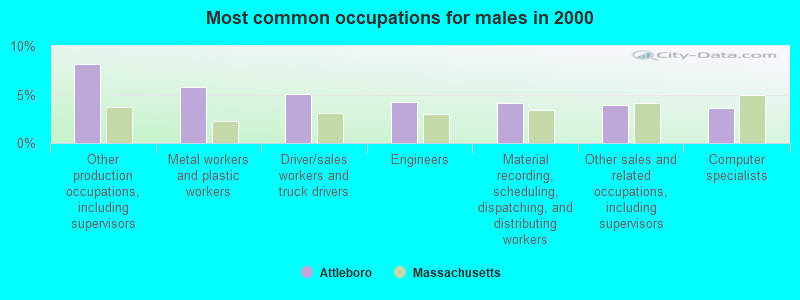
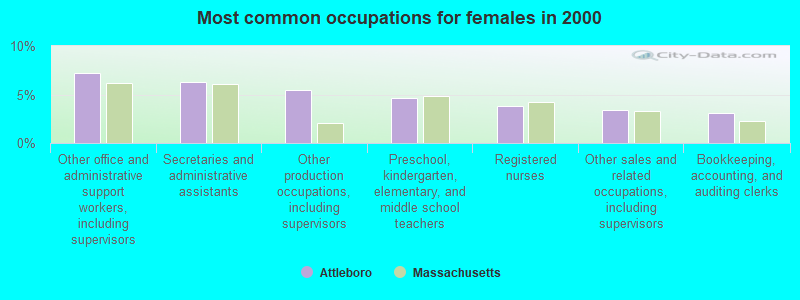
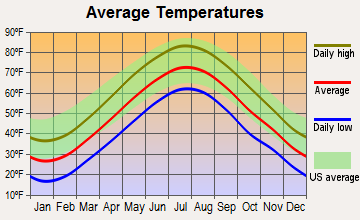
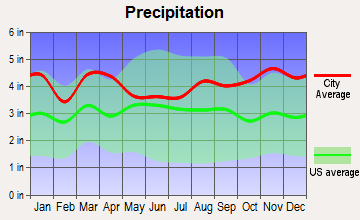
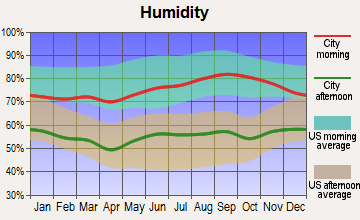
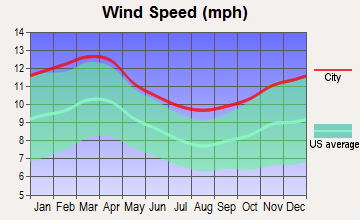
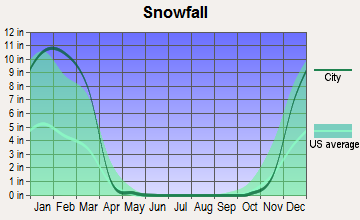
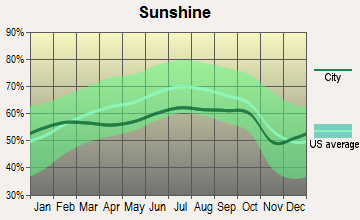
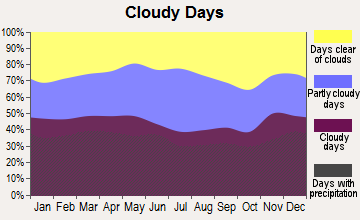
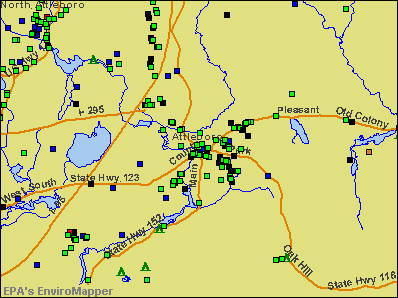

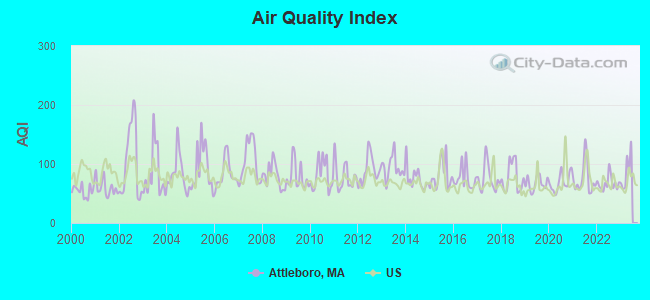
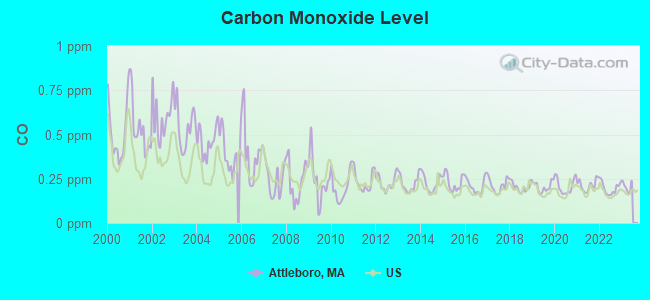
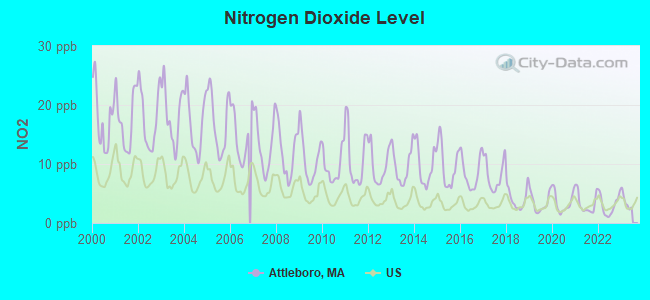
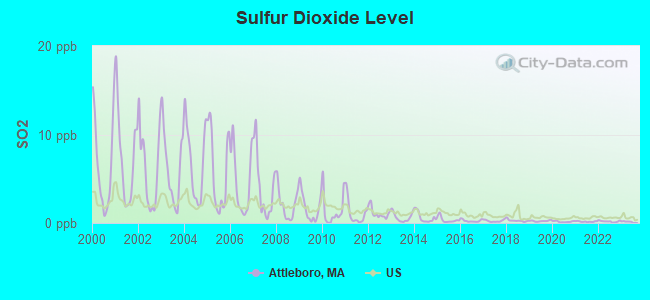
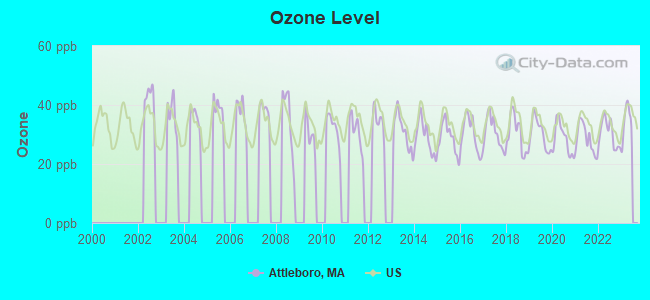
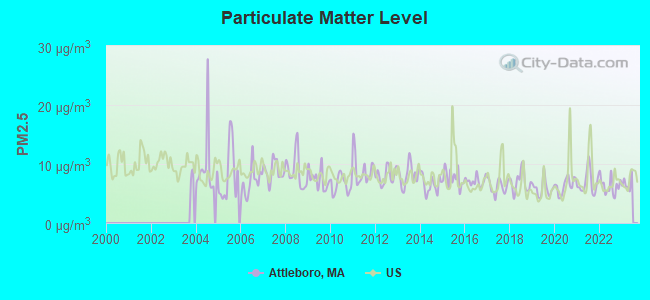
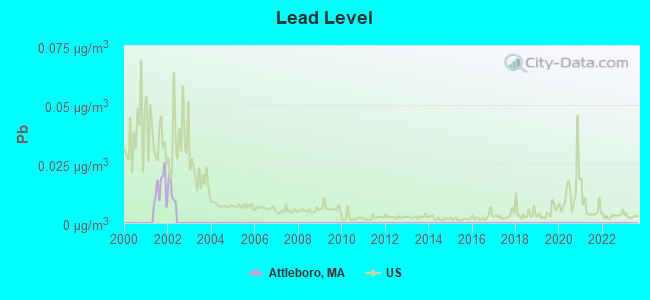

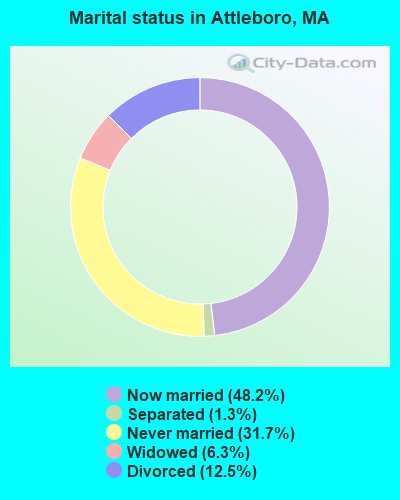
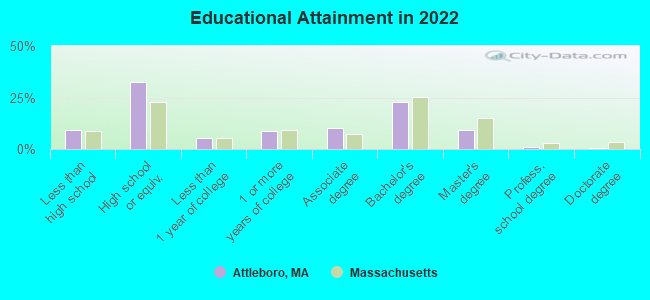
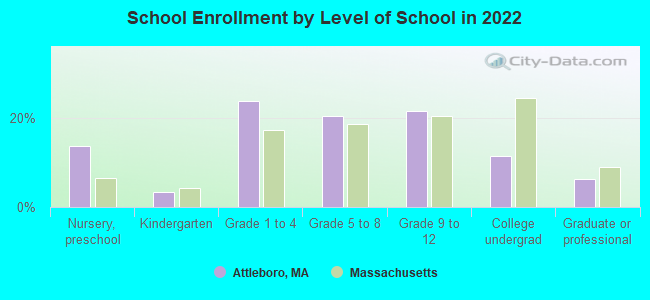
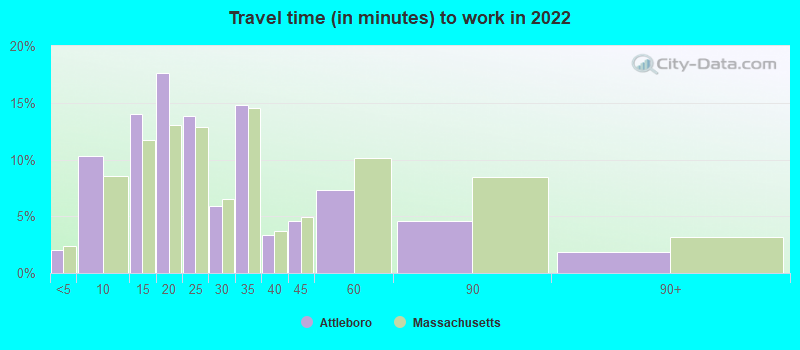
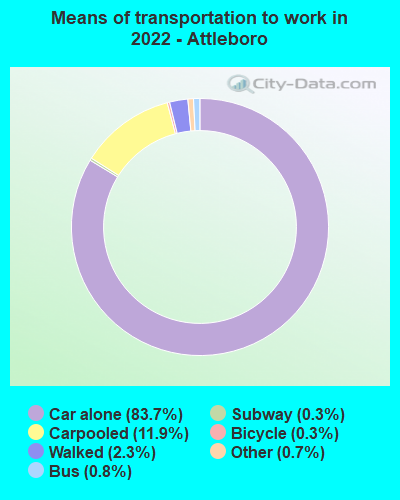
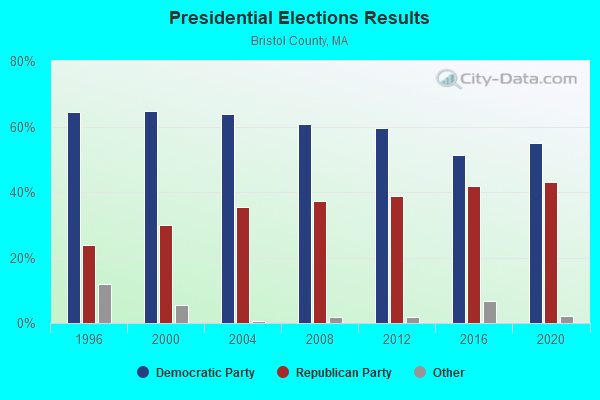
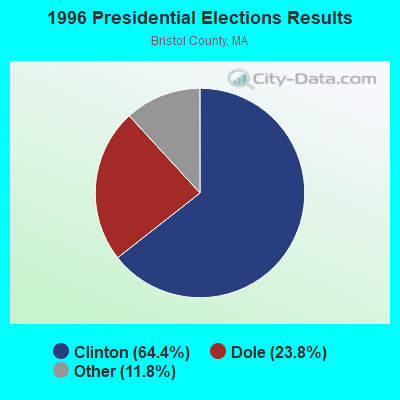
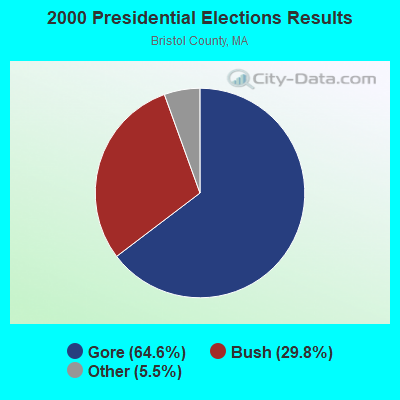
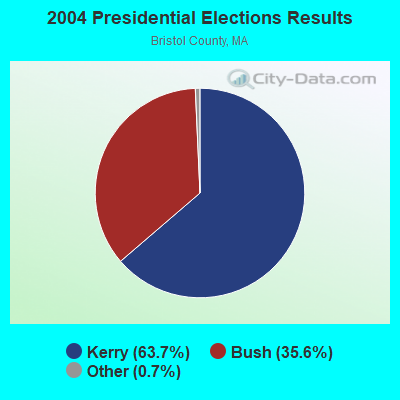
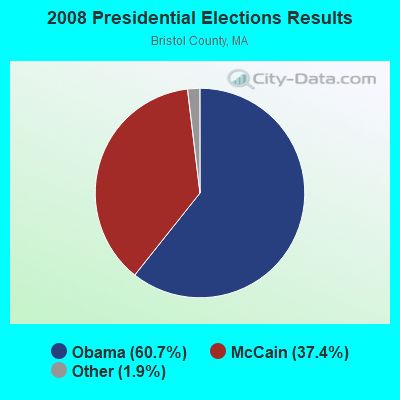
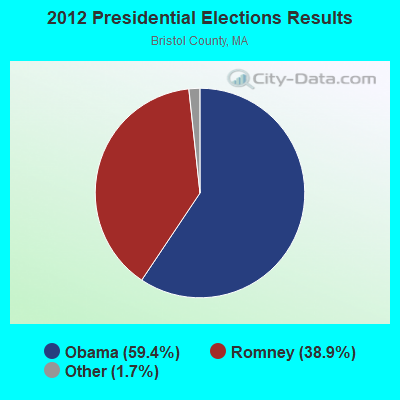
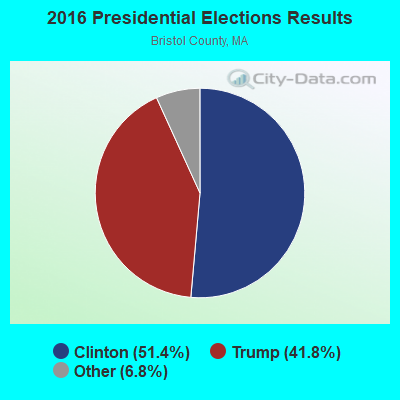
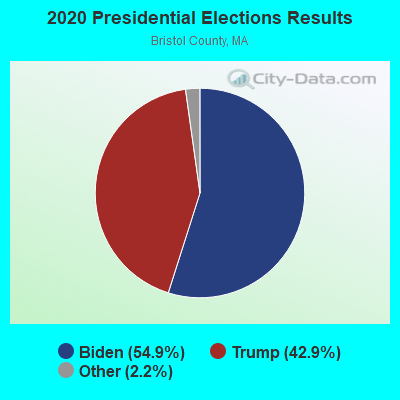
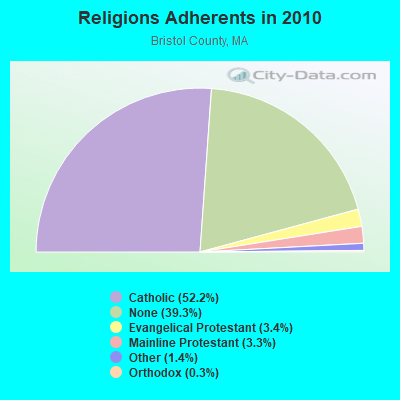
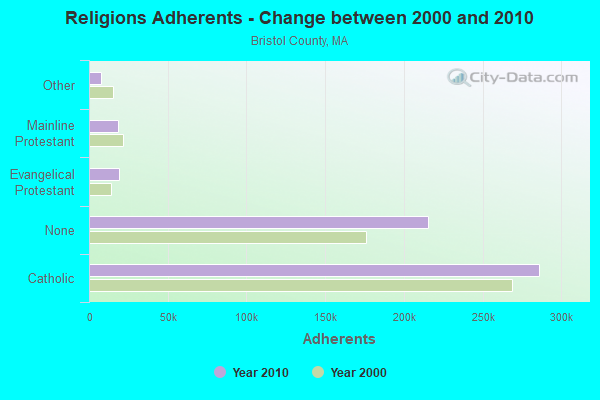
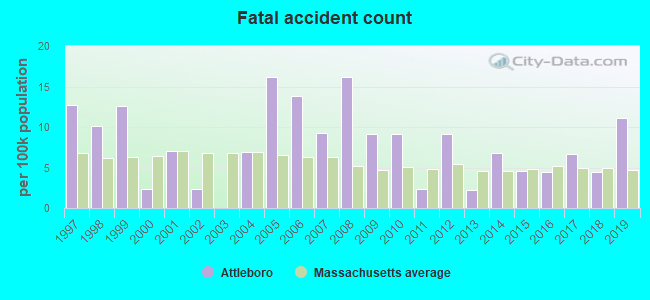
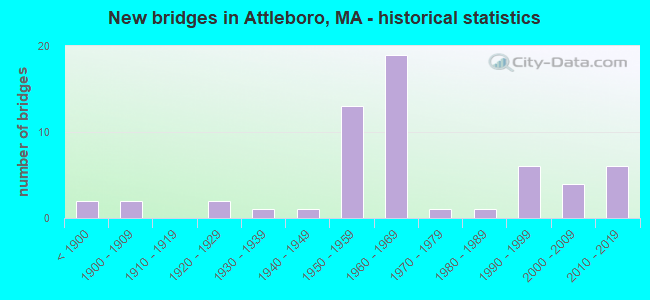
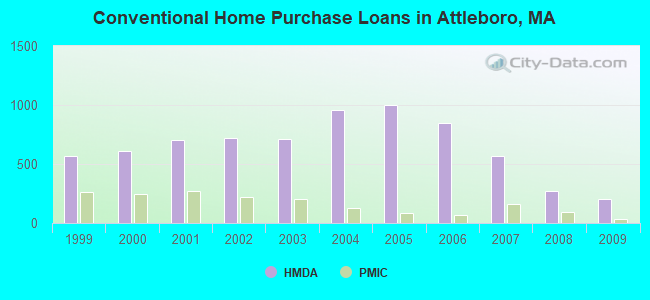
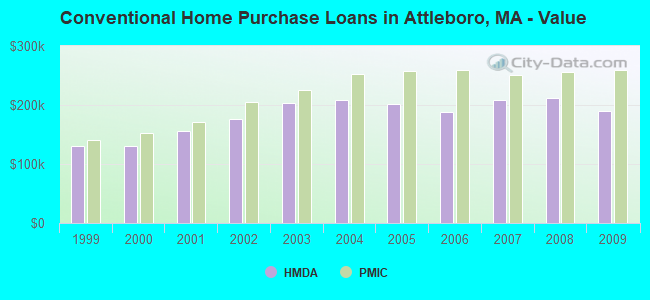
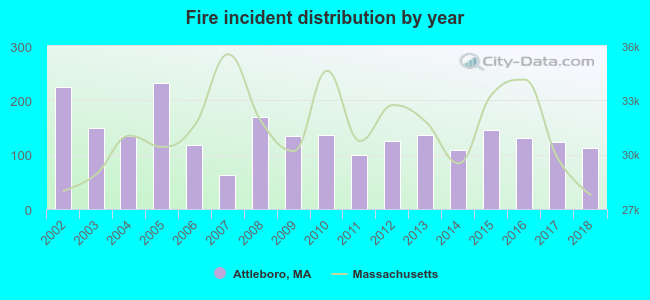 Based on the data from the years 2002 - 2018 the average number of fires per year is 138. The highest number of fire incidents - 232 took place in 2005, and the least - 62 in 2007. The data has a dropping trend.
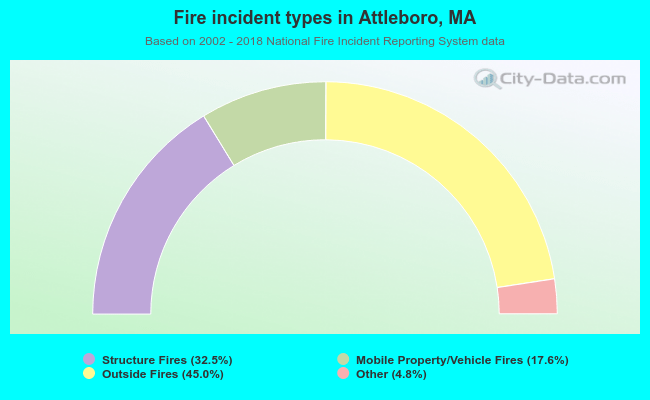 When looking into fire subcategories, the most reports belonged to: Outside Fires (45.0%), and Structure Fires (32.5%).