Bay City, Michigan
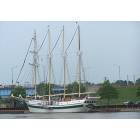
Bay City: Tall Ship docked on the west side of the river in Bay City during the Tall Ships Celebration 2006
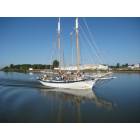
Bay City: Boat AppleDore
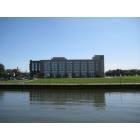
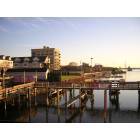
Bay City: Double Tree Hotel
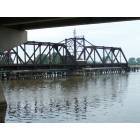
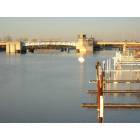
Bay City: Railroad bridge crossing the Saginaw River
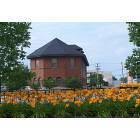
Bay City: Bay City Historical Depot taken from 5th street angle.
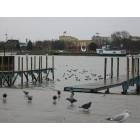
Bay City: Waterfowl at Saginaw River
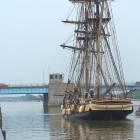
Bay City: Tall Ship getting ready to dock on the east side of the river in Bay City during the Tall Ships Celebration 2006
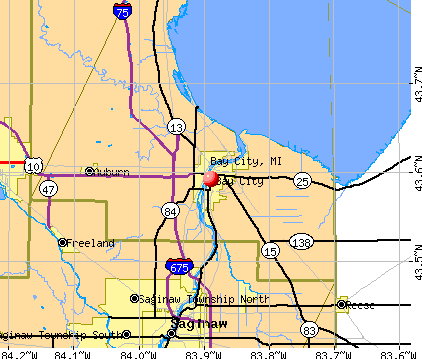
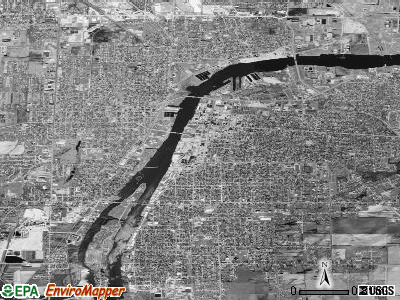
Bay City: Bay City, Michigan
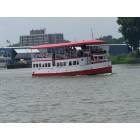
Bay City: Bay City Tour Boat, 2006
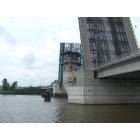
Bay City: Bay City Liberty Bridge open for river traffic
Bay City: Bay City, MI
- see
31
more - add
your


Submit your own pictures of this city and show them to the world
- OSM Map
- General Map
- Google Map
- MSN Map
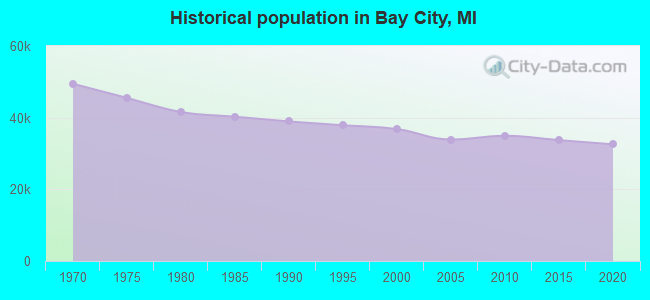
Population change since 2000: -12.4%
 |
| Males: 15,580 | |
| Females: 16,688 |
| Median resident age: | 39.4 years |
| Michigan median age: | 40.3 years |
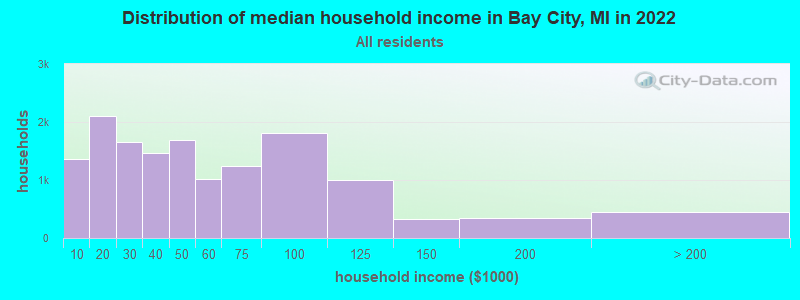
| Bay City: | $42,885 |
| MI: | $66,986 |
Estimated per capita income in 2022: $27,898 (it was $16,550 in 2000)
Bay City city income, earnings, and wages data
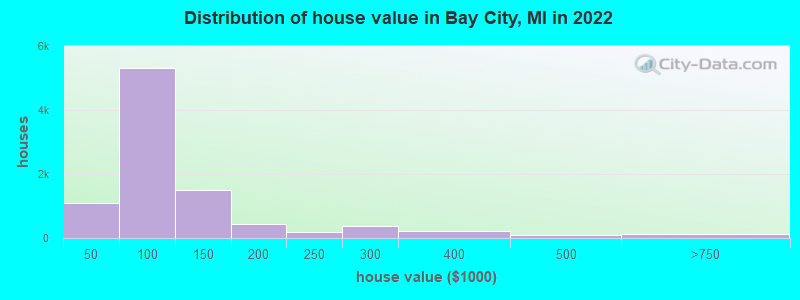
Estimated median house or condo value in 2022: $93,117 (it was $65,800 in 2000)
| Bay City: | $93,117 |
| MI: | $224,400 |
Mean prices in 2022: all housing units: $109,518; detached houses: $106,352; townhouses or other attached units: $131,905; in 2-unit structures: $205,535; in 3-to-4-unit structures: $277,393; in 5-or-more-unit structures: $207,017; mobile homes: $41,131
Median gross rent in 2022: $765.
(23.1% for White Non-Hispanic residents, 37.9% for Black residents, 31.4% for Hispanic or Latino residents, 26.9% for American Indian residents, 41.6% for other race residents, 25.2% for two or more races residents)
Detailed information about poverty and poor residents in Bay City, MI


Compare current foreclosures in Bay City, MI:
| Photo | Address | Area | Beds / Baths | Price | Details |
|---|---|---|---|---|---|

|
#1
Fitzhugh St
Bay City, MI 48708
|
1,540 sq. feet
|
1 baths 3 beds |
$67,450
|
show details |

|
#2
N Walnut St
Bay City, MI 48706
|
1,830 sq. feet
|
1 baths 4 beds |
show details | |

|
#3
Ridgewood Dr
Bay City, MI 48706
|
1,357 sq. feet
|
3 baths 4 beds |
show details | |

|
#4
S Mountain St
Bay City, MI 48706
|
1,235 sq. feet
|
1 baths 2 beds |
show details | |

|
#5
James St
Bay City, MI 48706
|
1,129 sq. feet
|
1 baths 3 beds |
show details | |

|
#6
S Jefferson St
Bay City, MI 48708
|
1,392 sq. feet
|
1 baths 3 beds |
show details | |

|
#7
Broadway St
Bay City, MI 48708
|
1,288 sq. feet
|
1 baths 2 beds |
show details | |

|
#8
Marston St
Bay City, MI 48706
|
944 sq. feet
|
1 baths 3 beds |
show details | |

|
#9
Howard St
Bay City, MI 48708
|
870 sq. feet
|
1 baths 3 beds |
show details | |

|
#10
W Hart St
Bay City, MI 48706
|
972 sq. feet
|
1 baths 2 beds |
show details |
| Photo | Address | Area | Beds / Baths | Price | Details |
|---|---|---|---|---|---|

|
#11
21st St
Bay City, MI 48708
|
1,236 sq. feet
|
1 baths 3 beds |
show details | |

|
#12
Litchfield St
Bay City, MI 48706
|
1,344 sq. feet
|
1 baths 3 beds |
show details | |

|
#13
E Jenny St
Bay City, MI 48706
|
1,092 sq. feet
|
1 baths 4 beds |
show details | |

|
#14
S Catherine St
Bay City, MI 48706
|
838 sq. feet
|
1 baths 2 beds |
show details | |

|
#15
Taylor St
Bay City, MI 48708
|
960 sq. feet
|
1 baths 2 beds |
show details | |

|
#16
E Hart St
Bay City, MI 48706
|
1,188 sq. feet
|
1 baths 2 beds |
show details | |

|
#17
19th St
Bay City, MI 48708
|
1,872 sq. feet
|
1 baths 5 beds |
show details | |

|
#18
N Grant St
Bay City, MI 48708
|
1,968 sq. feet
|
2 baths 3 beds |
show details | |

|
#19
7th St
Bay City, MI 48708
|
2,240 sq. feet
|
1 baths 3 beds |
show details | |

|
#20
S Madison Ave
Bay City, MI 48708
|
1,504 sq. feet
|
2 baths 3 beds |
show details |
| Photo | Address | Area | Beds / Baths | Price | Details |
|---|---|---|---|---|---|

|
#21
N Jackson St
Bay City, MI 48708
|
1,350 sq. feet
|
1 baths 3 beds |
show details | |

|
#22
S Kiesel St
Bay City, MI 48706
|
1,043 sq. feet
|
1 baths 3 beds |
show details | |

|
#23
S Farragut St
Bay City, MI 48708
|
1,315 sq. feet
|
1 baths 3 beds |
show details | |

|
#24
Marquette St
Bay City, MI 48706
|
988 sq. feet
|
1 baths 2 beds |
show details | |

|
#25
S Wenona St
Bay City, MI 48706
|
2,359 sq. feet
|
1 baths 5 beds |
show details | |

|
#26
11th St
Bay City, MI 48708
|
1,274 sq. feet
|
1 baths 3 beds |
show details | |

|
#27
Michigan Ave
Bay City, MI 48708
|
1,008 sq. feet
|
1 baths 2 beds |
show details | |

|
#28
S Dewitt St
Bay City, MI 48706
|
899 sq. feet
|
1 baths 2 beds |
show details | |

|
#29
S Van Buren St
Bay City, MI 48708
|
1,320 sq. feet
|
1 baths 3 beds |
show details | |

|
#30
State St
Bay City, MI 48706
|
1,463 sq. feet
|
1 baths 2 beds |
show details |
| Photo | Address | Area | Beds / Baths | Price | Details |
|---|---|---|---|---|---|

|
#31
Stanton St
Bay City, MI 48708
|
1,818 sq. feet
|
1 baths 3 beds |
show details | |

|
#32
E White St
Bay City, MI 48706
|
1,014 sq. feet
|
1 baths 3 beds |
show details | |

|
#33
S Madison Ave
Bay City, MI 48708
|
2,518 sq. feet
|
2 baths 6 beds |
show details | |

|
#34
16th St
Bay City, MI 48708
|
1,159 sq. feet
|
2 baths 3 beds |
show details | |

|
#35
N Williams St
Bay City, MI 48706
|
1,052 sq. feet
|
1 baths 4 beds |
show details | |

|
#36
N Hampton St
Bay City, MI 48708
|
1,365 sq. feet
|
1 baths 3 beds |
show details | |

|
#37
S Farragut St
Bay City, MI 48708
|
1,075 sq. feet
|
1 baths 3 beds |
show details | |

|
#38
Deens Ln
Bay City, MI 48706
|
1,656 sq. feet
|
1 baths 3 beds |
show details | |

|
#39
Fitzhugh St
Bay City, MI 48708
|
814 sq. feet
|
1 baths 2 beds |
show details | |

|
#40
E Salzburg Rd
Bay City, MI 48706
|
1,450 sq. feet
|
2 baths - beds |
show details |
| Photo | Address | Area | Beds / Baths | Price | Details |
|---|---|---|---|---|---|

|
#41
S Erie St
Bay City, MI 48706
|
960 sq. feet
|
1 baths 3 beds |
show details | |

|
#42
S Erie St
Bay City, MI 48706
|
927 sq. feet
|
1 baths 2 beds |
show details | |

|
#43
S Farragut St
Bay City, MI 48708
|
572 sq. feet
|
1 baths 3 beds |
show details | |

|
#44
S Wenona St
Bay City, MI 48706
|
1,350 sq. feet
|
1 baths 4 beds |
show details | |

|
#45
N Wenona St
Bay City, MI 48706
|
1,178 sq. feet
|
1 baths 2 beds |
show details | |

|
#46
Kosciuszko Ave
Bay City, MI 48708
|
1,460 sq. feet
|
2 baths 3 beds |
show details | |

|
#47
Lafayette Ave
Bay City, MI 48708
|
1,744 sq. feet
|
1 baths 3 beds |
show details | |

|
#48
Elm St
Bay City, MI 48706
|
753 sq. feet
|
1 baths 2 beds |
show details | |

|
#49
2nd St
Bay City, MI 48708
|
1,056 sq. feet
|
1 baths 3 beds |
show details | |

|
Check over 1 million property listings on Foreclosure.com!
|
browse all offers | |||


- 26,01680.4%White alone
- 3,55811.0%Hispanic
- 1,5074.7%Two or more races
- 1,0753.3%Black alone
- 970.3%Asian alone
- 1050.3%Other race alone
- 610.2%Native Hawaiian and Other
Pacific Islander alone - 210.06%American Indian alone
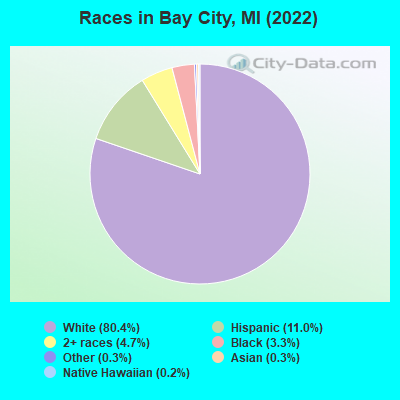
Races in Bay City detailed stats: ancestries, foreign born residents, place of birth
According to our research of Michigan and other state lists, there were 306 registered sex offenders living in Bay City, Michigan as of April 24, 2024.
The ratio of all residents to sex offenders in Bay City is 112 to 1.
Type |
2009 |
2010 |
2011 |
2012 |
2013 |
2014 |
2015 |
2016 |
2017 |
2018 |
2019 |
2020 |
2021 |
2022 |
|---|---|---|---|---|---|---|---|---|---|---|---|---|---|---|
| Murders (per 100,000) | 1 (3.0) | 2 (5.7) | 0 (0.0) | 1 (2.9) | 0 (0.0) | 1 (2.9) | 0 (0.0) | 1 (3.0) | 1 (3.0) | 0 (0.0) | 2 (6.1) | 0 (0.0) | 1 (3.1) | 0 (0.0) |
| Rapes (per 100,000) | 35 (104.3) | 57 (163.2) | 37 (106.0) | 43 (123.8) | 67 (194.8) | 55 (160.3) | 51 (150.2) | 51 (151.2) | 65 (195.3) | 44 (133.5) | 39 (118.9) | 52 (160.1) | 33 (102.5) | 29 (89.9) |
| Robberies (per 100,000) | 44 (131.1) | 46 (131.7) | 35 (100.3) | 29 (83.5) | 21 (61.1) | 19 (55.4) | 29 (85.4) | 26 (77.1) | 35 (105.1) | 28 (85.0) | 20 (61.0) | 25 (77.0) | 15 (46.6) | 5 (15.5) |
| Assaults (per 100,000) | 137 (408.1) | 151 (432.3) | 99 (283.6) | 144 (414.5) | 133 (386.7) | 107 (311.9) | 128 (376.9) | 129 (382.5) | 150 (450.6) | 160 (485.5) | 216 (658.7) | 202 (621.8) | 196 (608.7) | 145 (449.6) |
| Burglaries (per 100,000) | 300 (893.6) | 340 (973.3) | 241 (690.4) | 204 (587.2) | 209 (607.6) | 273 (795.8) | 312 (918.6) | 291 (862.9) | 223 (670.0) | 164 (497.7) | 136 (414.7) | 98 (301.7) | 91 (282.6) | 59 (183.0) |
| Thefts (per 100,000) | 734 (2,186) | 684 (1,958) | 525 (1,504) | 554 (1,595) | 679 (1,974) | 696 (2,029) | 739 (2,176) | 601 (1,782) | 718 (2,157) | 527 (1,599) | 478 (1,458) | 339 (1,044) | 343 (1,065) | 288 (893.1) |
| Auto thefts (per 100,000) | 40 (119.1) | 38 (108.8) | 29 (83.1) | 39 (112.3) | 49 (142.5) | 36 (104.9) | 39 (114.8) | 34 (100.8) | 60 (180.3) | 46 (139.6) | 44 (134.2) | 66 (203.2) | 73 (226.7) | 37 (114.7) |
| Arson (per 100,000) | 11 (32.8) | 9 (25.8) | 14 (40.1) | 10 (28.8) | 5 (14.5) | 4 (11.7) | 5 (14.7) | 10 (29.7) | 10 (30.0) | 6 (18.2) | 4 (12.2) | 7 (21.5) | 3 (9.3) | 5 (15.5) |
| City-Data.com crime index | 369.8 | 423.1 | 286.7 | 326.6 | 384.4 | 358.3 | 381.6 | 366.3 | 431.5 | 339.4 | 355.4 | 354.6 | 304.4 | 224.2 |
The City-Data.com crime index weighs serious crimes and violent crimes more heavily. Higher means more crime, U.S. average is 246.1. It adjusts for the number of visitors and daily workers commuting into cities.
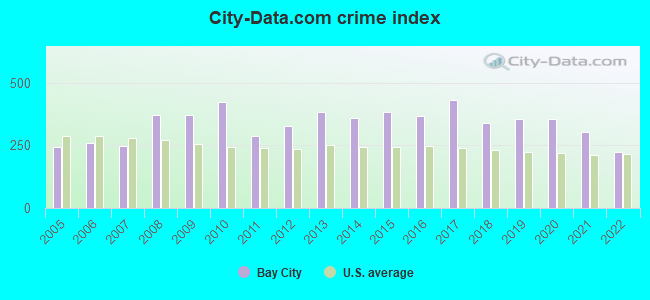
Crime rate in Bay City detailed stats: murders, rapes, robberies, assaults, burglaries, thefts, arson
Full-time law enforcement employees in 2021, including police officers: 50 (47 officers - 41 male; 6 female).
| Officers per 1,000 residents here: | 1.46 |
| Michigan average: | 1.86 |
 Recent articles from our blog. Our writers, many of them Ph.D. graduates or candidates, create easy-to-read articles on a wide variety of topics.


 | Considering coming home to Bay City...... (2 replies) |
| Crime in Bay City? (6 replies) |
| Bay City MI (16 replies) |
| Brain Drain Within Michigan (37 replies) |
| Bay City now days (8 replies) |
| Bay City info? (17 replies) |
Latest news from Bay City, MI collected exclusively by city-data.com from local newspapers, TV, and radio stations
Ancestries: German (18.1%), Polish (13.9%), Irish (6.2%), American (5.8%), English (5.4%), French (2.9%).
Current Local Time: EST time zone
Elevation: 600 feet
Land area: 10.4 square miles.
Population density: 3,100 people per square mile (average).
351 residents are foreign born
| This city: | 1.1% |
| Michigan: | 6.9% |
Median real estate property taxes paid for housing units with mortgages in 2022: $1,731 (1.8%)
Median real estate property taxes paid for housing units with no mortgage in 2022: $1,645 (2.0%)
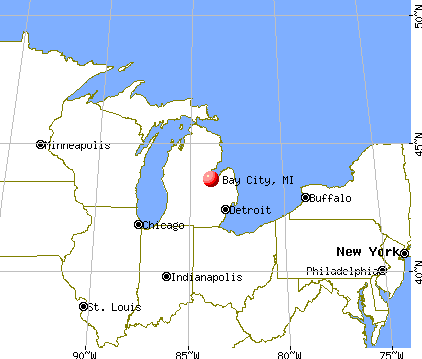
Nearest city with pop. 50,000+: Saginaw, MI  (12.2 miles , pop. 61,799).
Nearest city with pop. 200,000+: Detroit, MI (92.4 miles , pop. 951,270).
Nearest city with pop. 1,000,000+: Chicago, IL (227.5 miles , pop. 2,896,016).
Nearest cities:
), ), ), ), ), )Latitude: 43.59 N, Longitude: 83.89 W
Daytime population change due to commuting: +1,997 (+6.2%)
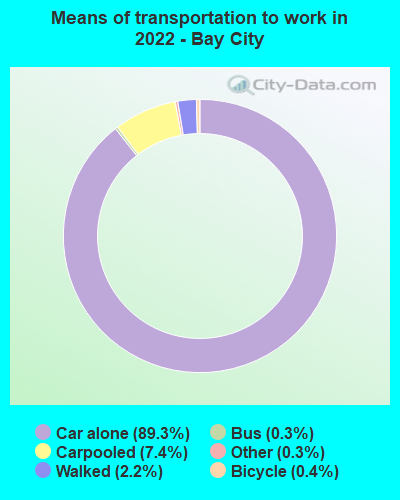
Workers who live and work in this city: 5,907 (42.3%)
Area code: 989
Bay City, Michigan accommodation & food services, waste management - Economy and Business Data
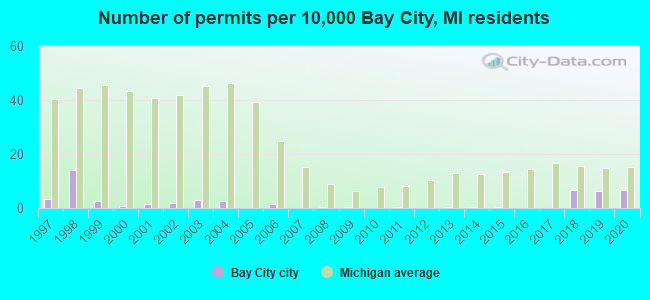
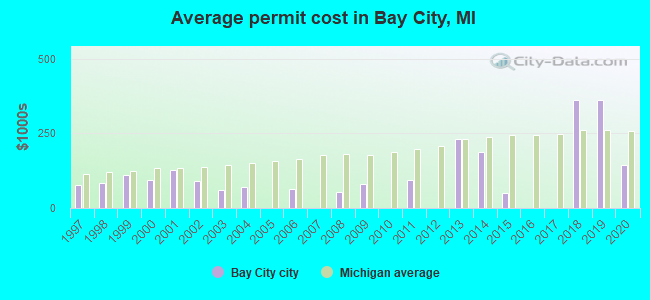
Single-family new house construction building permits:
- 2020: 24 buildings, average cost: $144,000
- 2019: 23 buildings, average cost: $362,500
- 2018: 24 buildings, average cost: $362,500
- 2015: 1 building, cost: $50,000
- 2014: 1 building, cost: $189,000
- 2013: 1 building, cost: $229,900
- 2011: 2 buildings, average cost: $94,500
- 2009: 1 building, cost: $78,500
- 2008: 2 buildings, average cost: $53,800
- 2006: 5 buildings, average cost: $63,000
- 2004: 9 buildings, average cost: $70,600
- 2003: 11 buildings, average cost: $60,100
- 2002: 7 buildings, average cost: $91,300
- 2001: 5 buildings, average cost: $127,300
- 2000: 3 buildings, average cost: $92,700
- 1999: 10 buildings, average cost: $110,000
- 1998: 52 buildings, average cost: $84,700
- 1997: 12 buildings, average cost: $76,600
| Here: | 5.8% |
| Michigan: | 3.5% |
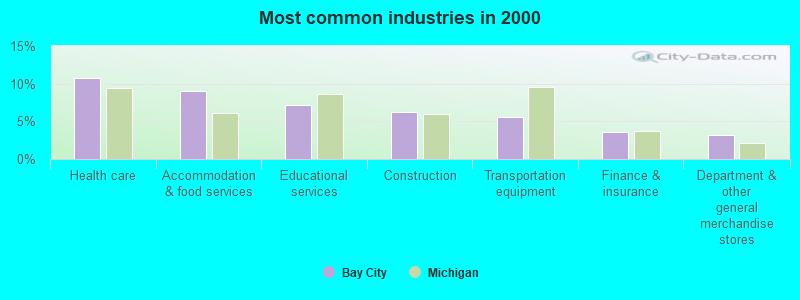
- Health care (10.8%)
- Accommodation & food services (9.0%)
- Educational services (7.2%)
- Construction (6.2%)
- Transportation equipment (5.6%)
- Finance & insurance (3.5%)
- Department & other general merchandise stores (3.2%)
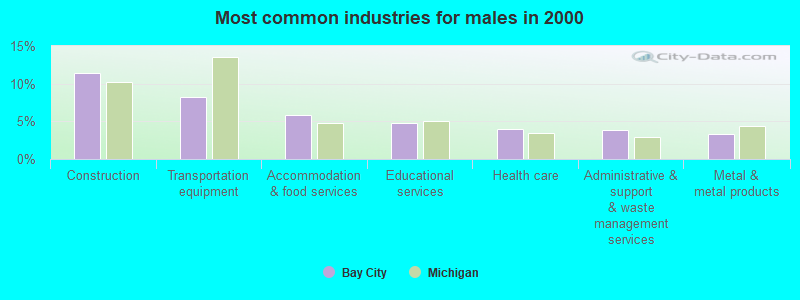
- Construction (11.4%)
- Transportation equipment (8.3%)
- Accommodation & food services (5.9%)
- Educational services (4.8%)
- Health care (3.9%)
- Administrative & support & waste management services (3.8%)
- Metal & metal products (3.4%)
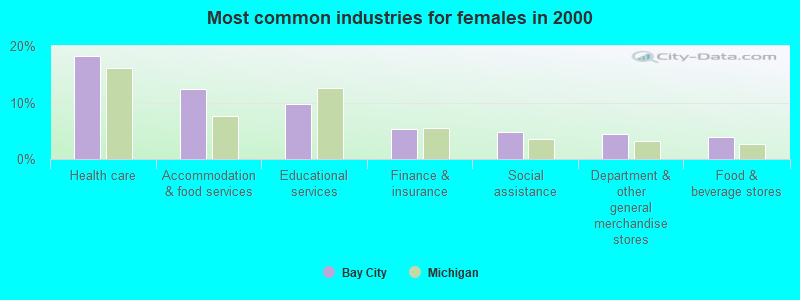
- Health care (18.2%)
- Accommodation & food services (12.3%)
- Educational services (9.8%)
- Finance & insurance (5.2%)
- Social assistance (4.7%)
- Department & other general merchandise stores (4.4%)
- Food & beverage stores (3.8%)
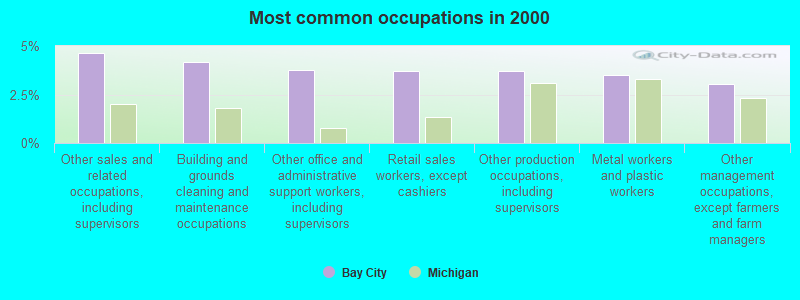
- Other sales and related occupations, including supervisors (4.7%)
- Building and grounds cleaning and maintenance occupations (4.2%)
- Other office and administrative support workers, including supervisors (3.7%)
- Retail sales workers, except cashiers (3.7%)
- Other production occupations, including supervisors (3.7%)
- Metal workers and plastic workers (3.5%)
- Other management occupations, except farmers and farm managers (3.0%)
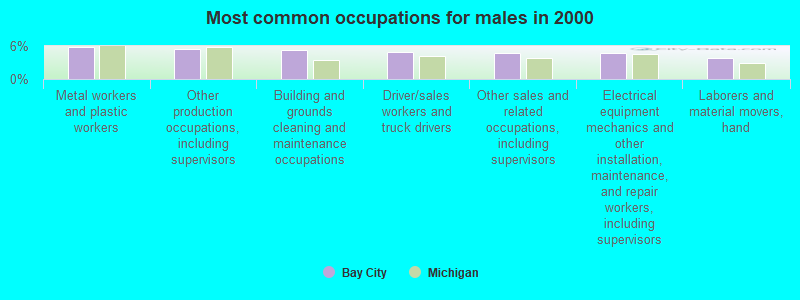
- Metal workers and plastic workers (5.8%)
- Other production occupations, including supervisors (5.5%)
- Building and grounds cleaning and maintenance occupations (5.3%)
- Driver/sales workers and truck drivers (4.9%)
- Other sales and related occupations, including supervisors (4.7%)
- Electrical equipment mechanics and other installation, maintenance, and repair workers, including supervisors (4.7%)
- Laborers and material movers, hand (3.8%)
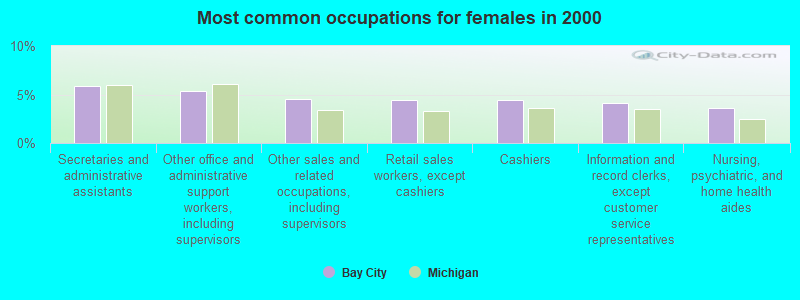
- Secretaries and administrative assistants (5.9%)
- Other office and administrative support workers, including supervisors (5.4%)
- Other sales and related occupations, including supervisors (4.6%)
- Retail sales workers, except cashiers (4.5%)
- Cashiers (4.4%)
- Information and record clerks, except customer service representatives (4.1%)
- Nursing, psychiatric, and home health aides (3.7%)
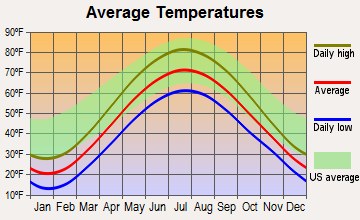
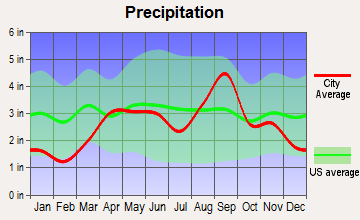
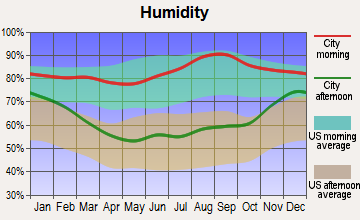
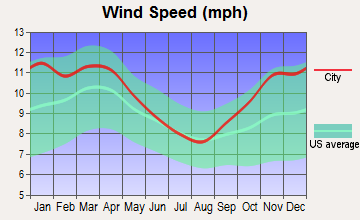
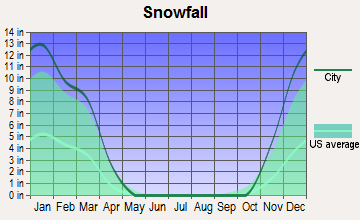
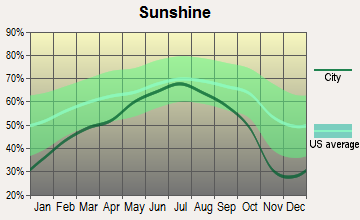
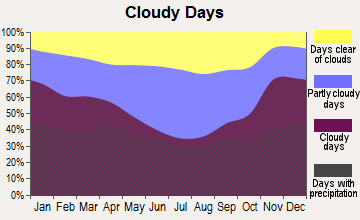
Average climate in Bay City, Michigan
Based on data reported by over 4,000 weather stations
|
|

(lower is better)
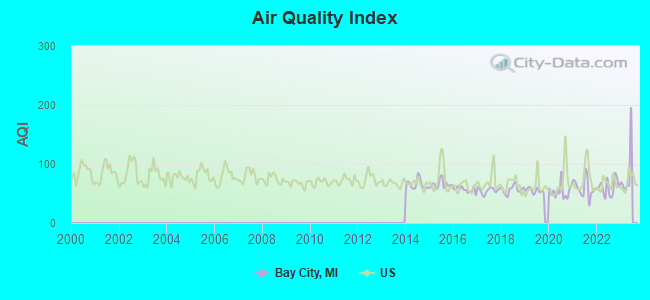
Air Quality Index (AQI) level in 2022 was 60.6. This is about average.
| City: | 60.6 |
| U.S.: | 72.6 |
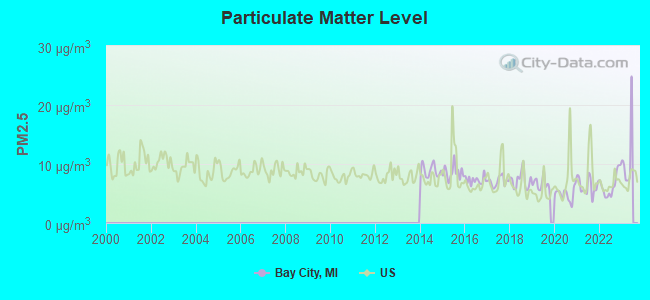
Particulate Matter (PM2.5) [µg/m3] level in 2022 was 6.47. This is better than average. Closest monitor was 1.4 miles away from the city center.
| City: | 6.47 |
| U.S.: | 8.11 |
Tornado activity:
Bay City-area historical tornado activity is near Michigan state average. It is 9% greater than the overall U.S. average.
On 6/8/1953, a category F5 (max. wind speeds 261-318 mph) tornado 34.1 miles away from the Bay City city center killed 116 people and injured 844 people and caused between $5,000,000 and $50,000,000 in damages.
On 6/12/1984, a category F3 (max. wind speeds 158-206 mph) tornado 2.2 miles away from the city center injured 2 people and caused between $500,000 and $5,000,000 in damages.
Earthquake activity:
Bay City-area historical earthquake activity is significantly above Michigan state average. It is 55% smaller than the overall U.S. average.On 9/25/1998 at 19:52:52, a magnitude 5.2 (4.8 MB, 4.3 MS, 5.2 LG, 4.5 MW, Depth: 3.1 mi, Class: Moderate, Intensity: VI - VII) earthquake occurred 229.8 miles away from Bay City center
On 1/31/1986 at 16:46:43, a magnitude 5.0 (5.0 MB) earthquake occurred 195.6 miles away from the city center
On 5/2/2015 at 16:23:07, a magnitude 4.2 (4.2 MW, Depth: 2.8 mi, Class: Light, Intensity: IV - V) earthquake occurred 122.0 miles away from the city center
On 7/12/1986 at 08:19:37, a magnitude 4.5 (4.5 MB) earthquake occurred 212.7 miles away from Bay City center
On 7/27/1980 at 18:52:21, a magnitude 5.2 (5.1 MB, 4.7 MS, 5.0 UK, 5.2 UK) earthquake occurred 372.6 miles away from the city center
On 9/2/1994 at 21:23:06, a magnitude 3.5 (3.4 LG, 3.5 LG, Depth: 3.1 mi, Class: Light, Intensity: II - III) earthquake occurred 65.7 miles away from the city center
Magnitude types: regional Lg-wave magnitude (LG), body-wave magnitude (MB), surface-wave magnitude (MS), moment magnitude (MW)
Natural disasters:
The number of natural disasters in Bay County (13) is near the US average (15).Major Disasters (Presidential) Declared: 8
Emergencies Declared: 3
Causes of natural disasters: Storms: 8, Floods: 7, Tornadoes: 2, Blizzard: 1, Hurricane: 1, Snowstorm: 1, Wind: 1, Winter Storm: 1, Other: 1 (Note: some incidents may be assigned to more than one category).
Hospitals in Bay City:
- BAY OSTEOPATHIC HOSPITAL (provides emergency services, 3250 E MIDLAND ROAD)
- BAY SPECIAL CARE CENTER ("3250 E MIDLAND RD, SUITE 1")
- HEARTLAND HOME HEALTH CARE AND HOSPICE (333 N SUMMIT STREET)
- LONG TERM CARE HOSPITAL (LTCH) (3250 E MIDLAND RD, SUITE 1)
- MCLAREN BAY REGION (Voluntary non-profit - Other, provides emergency services, 1900 COLUMBUS AVE)
Nursing Homes in Bay City:
- BAY SHORES SENIOR CARE AND REHAB CENTER (3254 E MIDLAND RD)
- CARETEL INNS OF TRI-CITIES (6700 WESTSIDE SAGINAW ROAD)
- HEARTLAND HEALTH CARE CENTER-HAMPTON (800 MULHOLLAND RD)
- THE CARRIAGE HOUSE OF BAY CITY (2394 MIDLAND RD)
Dialysis Facilities in Bay City:
Home Health Centers in Bay City:
Airports and heliports located in Bay City:
- James Clements Municipal Airport (3CM) (Runways: 5, Itinerant Ops: 4,503, Local Ops: 4,503)
- Kenneth Hayward Airport (47MI) (Runways: 1)
- Harold Miller Heliport (03MI)
College/University in Bay City:
Colleges/universities with over 2000 students nearest to Bay City:
- Saginaw Valley State University (about 5 miles; University Center, MI; Full-time enrollment: 9,021)
- Delta College (about 6 miles; University Center, MI; FT enrollment: 7,480)
- Northwood University-Michigan (about 20 miles; Midland, MI; FT enrollment: 2,763)
- University of Michigan-Flint (about 41 miles; Flint, MI; FT enrollment: 6,284)
- Kettering University (about 41 miles; Flint, MI; FT enrollment: 2,044)
- Mott Community College (about 42 miles; Flint, MI; FT enrollment: 7,394)
- Baker College of Flint (about 44 miles; Flint, MI; FT enrollment: 3,877)
Public high schools in Bay City:
- JOHN GLENN HIGH SCHOOL (Location: 3201 KIESEL RD, Grades: 9-12)
- WENONA CENTER HOME OF WENONA HIGH/MIDDLE SCHOOL (Location: 201 WOODSIDE LN, Grades: 6-12)
- BAY CITY ADULT EDUCATION/CTP (Location: 4155 MONITOR RD, Grades: 9-12)
- BAY CITY CENTRAL HIGH SCHOOL (Location: 1624 COLUMBUS AVE, Grades: 9-12)
- ISD-LOCAL PROGRAMS (Location: 4228 2 MILE RD, Grades: PK-12)
Private high school in Bay City:
Biggest public elementary/middle schools in Bay City:
- BAY COUNTY PSA (Location: 1110 STATE ST, Grades: PK-7, Charter school)
- BAY CITY ACADEMY - MADISON ARTS CAMPUS (Location: 400 N. MADISON AVENUE, Grades: 5-8, Charter school)
- BAY CITY ACADEMY - FARRAGUT CAMPUS (Location: 301 N FARRAGUT ST, Grades: PK-4, Charter school)
- BANGOR CENTRAL SCHOOL (Location: 208 STATE PARK DR, Grades: PK-5)
- CHRISTA MCAULIFFE MIDDLE SCHOOL (Location: 3281 KIESEL RD, Grades: 6-8)
- BANGOR LINCOLN SCHOOL (Location: 2771 NORTH EUCLID AVE, Grades: KG-5)
- BANGOR WEST CENTRAL SCHOOL (Location: 3175 WILDER RD, Grades: KG-5)
- HAMPTON ELEMENTARY SCHOOL (Location: 1908 WEST YOUNGS DITCH RD, Grades: KG-5)
- LINSDAY ELEMENTARY SCHOOL (Location: 607 LASALLE ST, Grades: PK-5)
- MACKENSEN ELEMENTARY SCHOOL (Location: 5535 DENNIS DR, Grades: KG-5)
Biggest private elementary/middle schools in Bay City:
- FAITH LUTHERAN SCHOOL (Students: 208, Location: 3033 WILDER RD, Grades: PK-8)
- IMMANUEL LUTHERAN SCHOOL (Students: 157, Location: 247 N LINCOLN ST, Grades: PK-8)
- ST JAMES SCHOOL (Students: 143, Location: 715 14TH ST, Grades: PK-5)
- ZION LUTHERAN SCHOOL (Students: 125, Location: 1707 S KIESEL ST, Grades: PK-8)
- HOLY TRINITY SCHOOL (Students: 119, Location: 1004 S WENONA ST, Grades: PK-5)
- TRINITY EVANGELICAL LUTHERAN SCHOOL (Students: 109, Location: 2515 BROADWAY ST, Grades: PK-8)
- ST JOHN LUTHERAN SCHOOL (Students: 108, Location: 1664 AMELITH RD, Grades: PK-8)
- ST PAUL LUTHERAN SCHOOL (Students: 104, Location: 6094 WESTSIDE SAGINAW RD, Grades: PK-8)
- BETHEL LUTHERAN SCHOOL (Students: 76, Location: 749 N PINE RD, Grades: PK-8)
- TRINITY LUTHERAN SCHOOL (Students: 75, Location: 20 E SALZBURG RD, Grades: PK-8)
User-submitted facts and corrections:
- Birthplace of Madonna.
- WEEG - 97.3 is now WMJO...and WSAG 104.1 is owned by MacDonald Broadcasting - not Blue Moose.
- Birthplace of MLB player Keith Miller. Birthplace of MLB player Matt Mieske.
Points of interest:
Notable locations in Bay City: Bay County Fairground (A), Salzburg Station (B), Bay City Station (C), Bay City Fire Department Station 2 (D), Bay City Fire Department Station 4 (E), Bay City Fire Department Station 5 (F), Bay County Building (G), Law Enforcement Center (H), Bay City Hall (I), Bay County Historical Museum (J), Delta College Planetarium (K), Alice and Jack Wirt Public Library (L), Sage Branch Library (M), South Side Branch Library (N), Bay City Fire and Rescue Station 1 (O), Trombley House (P), Bay Regional Medical Center Emergency Medical Services Station 1 and 2 (Q). Display/hide their locations on the map
Churches in Bay City include: Unity of Bay City Church (A), Thoburn United Methodist Church (B), Westminster Presbyterian Church (C), Christian Assembly Church (D), First Spiritual Church (E), Calvary Worship Center (F), Messiah Lutheran Church (G), Macedonia Church of God (H), Trinity Lutheran Church (I). Display/hide their locations on the map
Cemeteries: Elm Lawn Cemetery (1), Green Ridge Cemetery (2), Hebrew Cemetery (3), Polish Cemetery (4), Corlis Cemetery (5), Pine Ridge Cemetery (6), Seamon Cemetery (7). Display/hide their locations on the map
Parks in Bay City include: Veterans Memorial Park (1), Bigelow Park (2), Wenonah Park (3), Bay City Historical Marker (4), Center Avenue Historical Marker (5), First Presbyterian Church Historical Marker (6), James Clements Memorial Airport Historical Marker (7), Midland Street Commercial District Historical Marker (8), Sage Public Library Historical Marker (9). Display/hide their locations on the map
Tourist attractions: Dobson Antique Toy & Firehouse Museum (3456 Patterson Road), Historical Museum of Bay County (Cultural Attractions- Events- & Facilities; 321 Washington Avenue), Michigan State - Natural Resources Department- Bay City State Park Visitor Ce (Nature Centers; 3582 State Park Drive), Harry's Amusement & Records (Amusement & Theme Parks; 1824 Broadway Street), American Amusements & Vending CO (Amusement & Theme Parks; 200 13th Street), Dutch Village Adventure Park (Amusement & Theme Parks; 2525 North Euclid Avenue), Bay Area Convention & Visitors Bureau (901 Saginaw Street).
Hotels: Americinn - Bay City- Mi (3915 3 Mile Rd), Flamingo Motel (291 River Road), Delta Motel (1000 South Euclid Avenue), Doubletree Hotel (1 Wenona Park Place), Empire House Motel (1305 Washington Avenue), Bay Valley Hotel & Resort (2470 Old Bridge Road), Bay Motel (910 S Euclid Avenue), Clements Inn Bed & Breakfast (1712 Center Avenue), Fairfield Inn Bay City (4105 Wilder Rd).
Courts: Federal Bureau of Investigation (115 1st Street), United States Government - Us District Court- Office Of The Clerk (1000 Washington Avenue).
Birthplace of: Eric Esch - Boxer, Madonna (entertainer) - Musician, John Garrels - Hurdler, Rick Steiner - Professional wrestler, Scott Steiner - Professional wrestler, Marian Spore Bush - Artist, James A. Barcia - Politician, Lloyd Brazil - Basketball player-coach, Lawrence E. Glendenin - Chemist, Earl T. O'Loughlin - General.
Drinking water stations with addresses in Bay City and their reported violations in the past:
BAY CITY, CITY OF (Population served: 36,817, Surface water):Past health violations:OUTDOOR ADVENTURES LAKESHORE RESORT (Population served: 500, Groundwater):
- MCL, Average - Between OCT-2009 and DEC-2009, Contaminant: TTHM. Follow-up actions: St Violation/Reminder Notice (JUN-05-2009), St Public Notif requested (DEC-18-2009), St Public Notif received (JAN-28-2010), St Compliance achieved (FEB-15-2010)
- MCL, Average - Between JUL-2009 and SEP-2009, Contaminant: TTHM. Follow-up actions: St Violation/Reminder Notice (JUN-05-2009), St Public Notif requested (OCT-01-2009), St Public Notif received (NOV-09-2009), St Compliance achieved (FEB-15-2010)
- MCL, Average - Between APR-2009 and JUN-2009, Contaminant: TTHM. Follow-up actions: St Violation/Reminder Notice (JUN-05-2009), St Public Notif requested (JUN-09-2009), St Public Notif received (JUL-01-2009), St Compliance achieved (FEB-15-2010)
Past health violations:OUTDOOR ADVENTURE (Population served: 400, Groundwater):Past monitoring violations:
- MCL, Monthly (TCR) - In SEP-2013, Contaminant: Coliform. Follow-up actions: St Violation/Reminder Notice (SEP-23-2013), St Compliance achieved (OCT-04-2013), St Violation/Reminder Notice (OCT-23-2013)
- MCL, Monthly (TCR) - In SEP-2008, Contaminant: Coliform. Follow-up actions: St Violation/Reminder Notice (OCT-02-2008), St Compliance achieved (OCT-09-2008)
- One regular monitoring violation
Past monitoring violations:OUTDOOR WILDERNESS (Population served: 210, Groundwater):
- 2 routine major monitoring violations
- 3 regular monitoring violations
Past health violations:LAPEER SKATING CENTER (Population served: 150, Groundwater):Past monitoring violations:
- MCL, Monthly (TCR) - In JUL-2005, Contaminant: Coliform. Follow-up actions: St Public Notif received (JUL-13-2005), St Violation/Reminder Notice (JUL-13-2005), St Tech Assistance Visit (JUL-13-2005), St Public Notif requested (JUL-13-2005), St Compliance achieved (JUL-16-2005)
- One routine major monitoring violation
- 2 minor monitoring violations
- 3 regular monitoring violations
Past health violations:RIFLE RIVER RESORT (Population served: 100, Groundwater):Past monitoring violations:
- MCL, Monthly (TCR) - In JUN-2005, Contaminant: Coliform. Follow-up actions: St Violation/Reminder Notice (JUN-27-2005), St Tech Assistance Visit (JUL-06-2005), St Compliance achieved (JUL-14-2005)
- One routine major monitoring violation
Past monitoring violations:LOGAN'S LANDING INTERNTL. MALL (Population served: 50, Groundwater):
- One routine major monitoring violation
- One regular monitoring violation
Past monitoring violations:
- 7 routine major monitoring violations
- 5 regular monitoring violations
Drinking water stations with addresses in Bay City that have no violations reported:
- BANGOR TOWNSHIP (Population served: 11,736, Primary Water Source Type: Purch surface water)
- BAY CO. DEPT OF WATER & SEWER (Population served: 8,273, Primary Water Source Type: Purch surface water)
- FRANKENLUST TOWNSHIP (Population served: 3,398, Primary Water Source Type: Purch surface water)
- BANGOR-MONITOR METRO DISTRICT (Population served: 2,971, Primary Water Source Type: Purch surface water)
- BEAVER TOWNSHIP (Population served: 1,183, Primary Water Source Type: Purch surface water)
- FRASER TOWNSHIP (Population served: 1,118, Primary Water Source Type: Purch surface water)
- BEAVER ROAD AREA WATER ASSOC. (Population served: 817, Primary Water Source Type: Purch surface water)
- COUNTRYSIDE MOBILE HOME PARK (Population served: 158, Primary Water Source Type: Groundwater)
- OUTDOOR ADVENTURE LK. OF NORTH (Population served: 99, Primary Water Source Type: Groundwater)
| This city: | 2.4 people |
| Michigan: | 2.5 people |
| This city: | 59.2% |
| Whole state: | 66.0% |
| This city: | 9.4% |
| Whole state: | 6.4% |
Likely homosexual households (counted as self-reported same-sex unmarried-partner households)
- Lesbian couples: 0.3% of all households
- Gay men: 0.4% of all households
People in group quarters in Bay City in 2010:
- 190 people in emergency and transitional shelters (with sleeping facilities) for people experiencing homelessness
- 177 people in local jails and other municipal confinement facilities
- 137 people in group homes intended for adults
- 8 people in other noninstitutional facilities
- 3 people in hospitals with patients who have no usual home elsewhere
People in group quarters in Bay City in 2000:
- 179 people in local jails and other confinement facilities (including police lockups)
- 136 people in other noninstitutional group quarters
- 105 people in other group homes
- 64 people in homes for the mentally retarded
- 56 people in agriculture workers' dormitories on farms
- 22 people in homes for the mentally ill
- 14 people in training schools for juvenile delinquents
- 5 people in homes or halfway houses for drug/alcohol abuse
- 4 people in nursing homes
Banks with branches in Bay City (2011 data):
- Chemical Bank: Bangor Branch, Columbus Avenue Branch, Hampton Township Branch, Bay City Branch, Washington Avenue Branch, Bay Area Branch. Info updated 2010/07/30: Bank assets: $5,331.9 mil, Deposits: $4,367.1 mil, headquarters in Midland, MI, positive income, Commercial Lending Specialization, 146 total offices, Holding Company: Chemical Financial Corporation
- PNC Bank, National Association: Bangor Branch, Lafayette Avenue Branch, Liberty Branch. Info updated 2012/03/20: Bank assets: $263,309.6 mil, Deposits: $197,343.0 mil, headquarters in Wilmington, DE, positive income, Commercial Lending Specialization, 3085 total offices, Holding Company: Pnc Financial Services Group, Inc., The
- Citizens Bank: Downtown Bay City Branch, Midland And Euclid Branch, Wilder - Henry Branch. Info updated 2011/08/01: Bank assets: $9,212.3 mil, Deposits: $7,452.0 mil, headquarters in Flint, MI, positive income, Commercial Lending Specialization, 220 total offices, Holding Company: Citizens Republic Bancorp, Inc.
- Independent Bank: Bay City Broadway Branch, Bay City Branch, Bay City Euclid Branch. Info updated 2010/10/20: Bank assets: $2,304.7 mil, Deposits: $2,092.2 mil, headquarters in Ionia, MI, negative income in the last year, Commercial Lending Specialization, 107 total offices, Holding Company: Independent Bank Corporation
- Thumb National Bank and Trust Company: Bay City-Wilder Road Branch at 2985 East Wilder Road, branch established on 2003/06/11; Bay City-Center Road Office Branch at 708 Center Ave, Suite 1, branch established on 2007/06/30. Info updated 2006/11/03: Bank assets: $215.4 mil, Deposits: $188.3 mil, headquarters in Pigeon, MI, positive income, Agricultural Specialization, 5 total offices, Holding Company: Thumb National Bank And Trust Company Employee Stock Ownership Plan And Trust
- Bank of America, National Association: Bay-Euclid Branch at 309 South Euclid Avenue, branch established on 1890/01/01; Bangor Branch at 3907 Wilder Road, branch established on 1999/02/16. Info updated 2009/11/18: Bank assets: $1,451,969.3 mil, Deposits: $1,077,176.8 mil, headquarters in Charlotte, NC, positive income, 5782 total offices, Holding Company: Bank Of America Corporation
- 1st State Bank: Bay City Branch at 601 North Madison Avenue, branch established on 2006/02/06. Info updated 2006/11/03: Bank assets: $173.8 mil, Deposits: $133.7 mil, headquarters in Saginaw, MI, positive income, Commercial Lending Specialization, 3 total offices, Holding Company: Valley Financial Group, Ltd.
- Fifth Third Bank: Bay City Banking Center Branch at 3870 State Street Road, branch established on 2005/12/19. Info updated 2009/10/05: Bank assets: $114,540.4 mil, Deposits: $89,689.1 mil, headquarters in Cincinnati, OH, positive income, Commercial Lending Specialization, 1378 total offices, Holding Company: Fifth Third Bancorp
For population 15 years and over in Bay City:
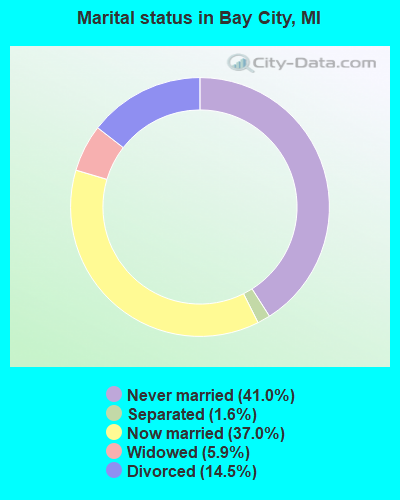
- Never married: 41.0%
- Now married: 37.0%
- Separated: 1.6%
- Widowed: 5.9%
- Divorced: 14.5%
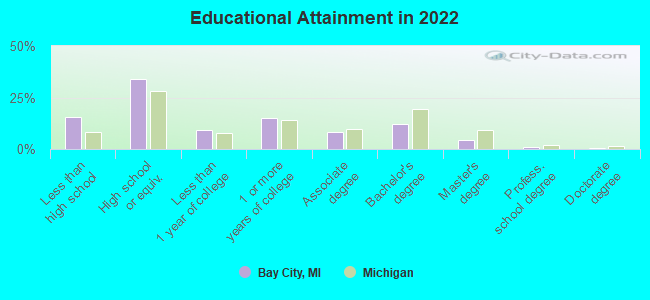
For population 25 years and over in Bay City:
- High school or higher: 86.8%
- Bachelor's degree or higher: 16.3%
- Graduate or professional degree: 4.8%
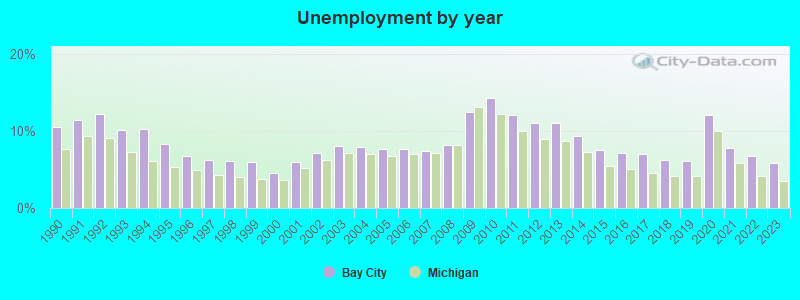
- Unemployed: 6.8%
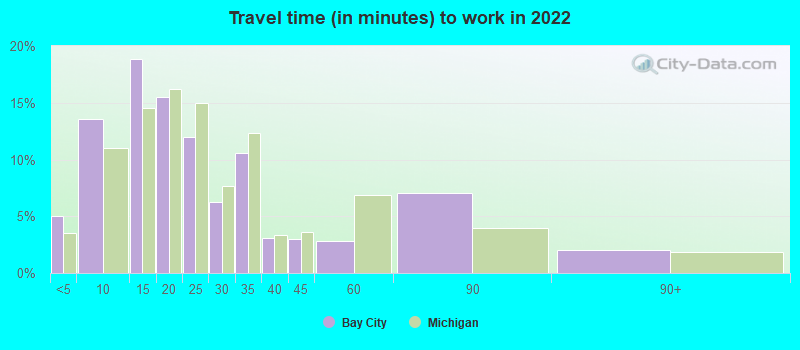
- Mean travel time to work (commute): 19.1 minutes
| Here: | 11.3 |
| Michigan average: | 11.0 |
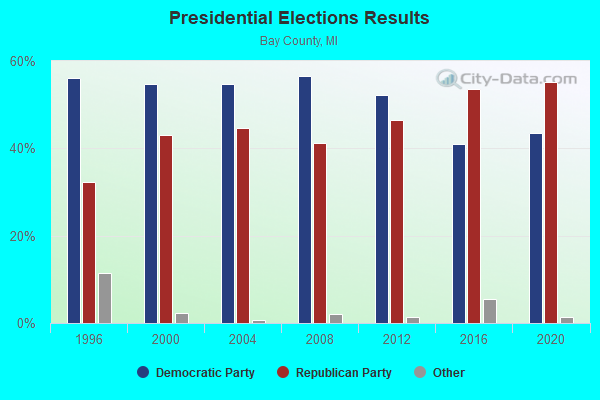
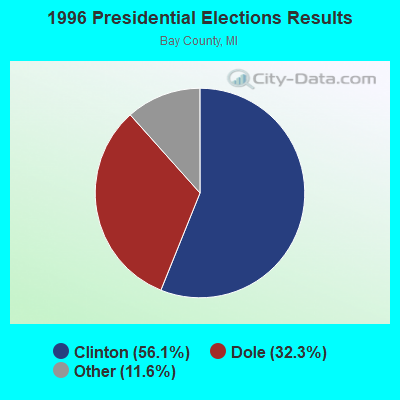
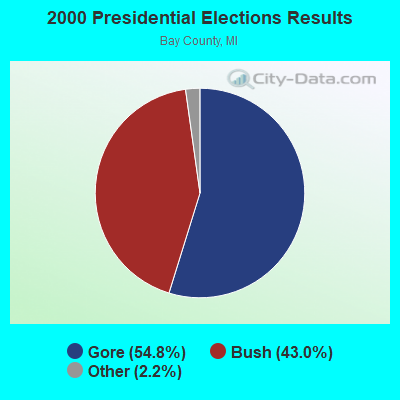
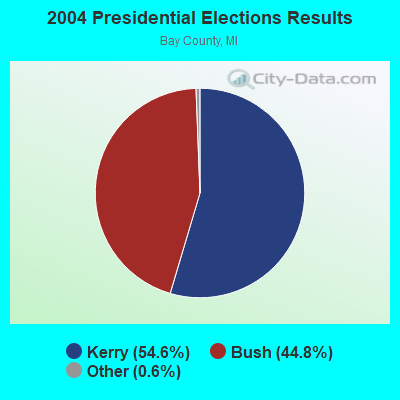

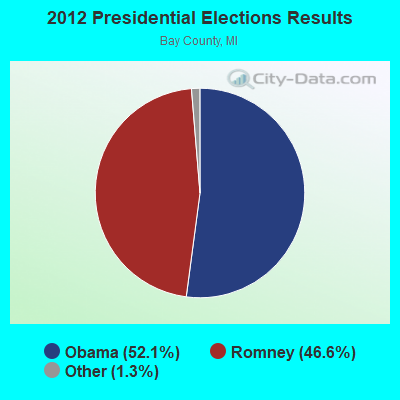
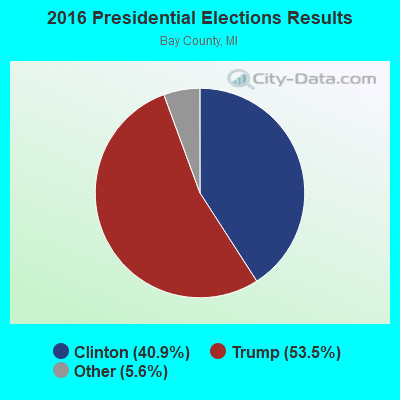
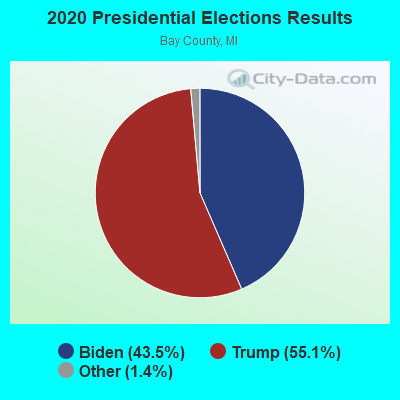
Graphs represent county-level data. Detailed 2008 Election Results
Religion statistics for Bay City, MI (based on Bay County data)
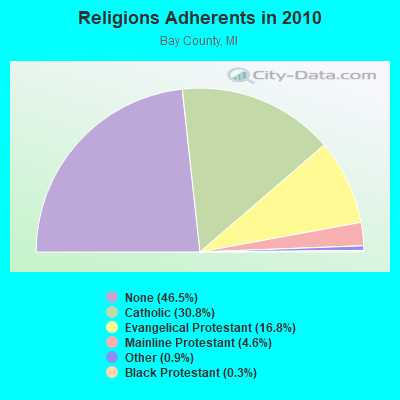
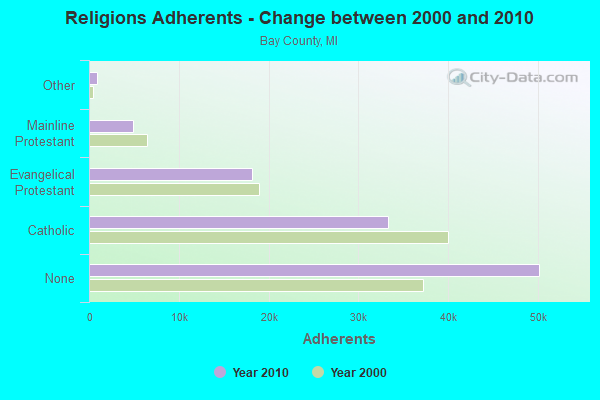
| Religion | Adherents | Congregations |
|---|---|---|
| Catholic | 33,237 | 22 |
| Evangelical Protestant | 18,158 | 55 |
| Mainline Protestant | 4,927 | 19 |
| Other | 940 | 7 |
| Black Protestant | 361 | 1 |
| None | 50,148 | - |
Food Environment Statistics:
| Bay County: | 2.42 / 10,000 pop. |
| Michigan: | 2.34 / 10,000 pop. |
| Here: | 0.19 / 10,000 pop. |
| Michigan: | 0.18 / 10,000 pop. |
| Here: | 2.70 / 10,000 pop. |
| Michigan: | 1.52 / 10,000 pop. |
| Bay County: | 2.89 / 10,000 pop. |
| Michigan: | 2.99 / 10,000 pop. |
| This county: | 6.89 / 10,000 pop. |
| Michigan: | 6.80 / 10,000 pop. |
| Bay County: | 10.5% |
| Michigan: | 9.7% |
| Bay County: | 31.0% |
| Michigan: | 29.7% |
| Bay County: | 13.5% |
| Michigan: | 13.4% |
Health and Nutrition:
| Here: | 48.7% |
| Michigan: | 50.3% |
| Here: | 45.1% |
| Michigan: | 47.9% |
| This city: | 28.8 |
| Michigan: | 28.7 |
| Bay City: | 20.9% |
| State: | 20.6% |
| This city: | 11.3% |
| State: | 10.4% |
| Bay City: | 6.8 |
| Michigan: | 6.8 |
| Here: | 34.4% |
| Michigan: | 34.1% |
| Bay City: | 55.5% |
| State: | 57.0% |
| Here: | 78.1% |
| Michigan: | 79.6% |
More about Health and Nutrition of Bay City, MI Residents
| Local government employment and payroll (March 2022) | |||||
| Function | Full-time employees | Monthly full-time payroll | Average yearly full-time wage | Part-time employees | Monthly part-time payroll |
|---|---|---|---|---|---|
| Police Protection - Officers | 53 | $335,951 | $76,064 | 0 | $0 |
| Electric Power | 39 | $275,118 | $84,652 | 0 | $0 |
| Sewerage | 33 | $168,589 | $61,305 | 0 | $0 |
| Financial Administration | 31 | $182,152 | $70,510 | 1 | $1,047 |
| Firefighters | 19 | $118,610 | $74,912 | 0 | $0 |
| Other and Unallocable | 19 | $91,696 | $57,913 | 0 | $0 |
| Water Supply | 17 | $78,140 | $55,158 | 0 | $0 |
| Streets and Highways | 16 | $90,757 | $68,068 | 0 | $0 |
| Solid Waste Management | 13 | $44,594 | $41,164 | 0 | $0 |
| Judicial and Legal | 10 | $65,700 | $78,840 | 12 | $8,394 |
| Housing and Community Development (Local) | 9 | $51,108 | $68,144 | 0 | $0 |
| Police - Other | 5 | $18,011 | $43,226 | 3 | $1,329 |
| Parks and Recreation | 5 | $21,348 | $51,235 | 0 | $0 |
| Fire - Other | 1 | $4,174 | $50,088 | 0 | $0 |
| Totals for Government | 270 | $1,545,948 | $68,709 | 16 | $10,770 |
Bay City government finances - Expenditure in 2021 (per resident):
- Construction - General - Other: $9,050,000 ($280.46)
Sewerage: $3,792,000 ($117.52)
Water Utilities: $2,795,000 ($86.62)
Electric Utilities: $2,121,000 ($65.73)
Regular Highways: $1,257,000 ($38.96)
- Current Operations - General - Other: $55,041,000 ($1705.75)
Sewerage: $13,238,000 ($410.25)
Regular Highways: $4,873,000 ($151.02)
Solid Waste Management: $3,083,000 ($95.54)
Central Staff Services: $1,716,000 ($53.18)
Financial Administration: $1,266,000 ($39.23)
Protective Inspection and Regulation - Other: $1,183,000 ($36.66)
Parks and Recreation: $1,078,000 ($33.41)
General Public Buildings: $300,000 ($9.30)
Air Transportation: $224,000 ($6.94)
Judicial and Legal Services: $173,000 ($5.36)
- Electric Utilities - Interest on Debt: $454,000 ($14.07)
- General - Interest on Debt: $1,297,000 ($40.19)
- Intergovernmental to Local - Other - General - Other: $3,781,000 ($117.17)
Other - Sewerage: $28,000 ($0.87)
Other - Housing and Community Development: $4,000 ($0.12)
Other - Transit Utilities: $3,000 ($0.09)
Other - Police Protection: $2,000 ($0.06)
Other - Local Fire Protection: $1,000 ($0.03)
- Intergovernmental to State - General - Other: $974,000 ($30.18)
Regular Highways: $444,000 ($13.76)
Housing and Community Development: $111,000 ($3.44)
Sewerage: $24,000 ($0.74)
Police Protection: $8,000 ($0.25)
- Other Capital Outlay - Air Transportation: $661,000 ($20.48)
Parks and Recreation: $575,000 ($17.82)
- Total Salaries and Wages: $15,311,000 ($474.49)
- Water Utilities - Interest on Debt: $138,000 ($4.28)
Bay City government finances - Revenue in 2021 (per resident):
- Charges - Sewerage: $12,988,000 ($402.50)
Other: $5,969,000 ($184.98)
Solid Waste Management: $3,051,000 ($94.55)
Air Transportation: $162,000 ($5.02)
Miscellaneous Commercial Activities: $72,000 ($2.23)
Parks and Recreation: $70,000 ($2.17)
- Federal Intergovernmental - Other: $2,164,000 ($67.06)
Housing and Community Development: $1,931,000 ($59.84)
- Local Intergovernmental - Other: $852,000 ($26.40)
Highways: $376,000 ($11.65)
- Miscellaneous - General Revenue - Other: $4,420,000 ($136.98)
Donations From Private Sources: $448,000 ($13.88)
Interest Earnings: $289,000 ($8.96)
Fines and Forfeits: $83,000 ($2.57)
Sale of Property: $26,000 ($0.81)
Special Assessments: $5,000 ($0.15)
- Revenue - Electric Utilities: $37,592,000 ($1164.99)
Water Utilities: $8,333,000 ($258.24)
- State Intergovernmental - Highways: $5,711,000 ($176.99)
General Local Government Support: $5,025,000 ($155.73)
Other: $2,976,000 ($92.23)
- Tax - Property: $15,168,000 ($470.06)
Other License: $998,000 ($30.93)
Occupation and Business License - Other: $354,000 ($10.97)
Bay City government finances - Debt in 2021 (per resident):
- Long Term Debt - Beginning Outstanding - Unspecified Public Purpose: $65,873,000 ($2041.43)
Outstanding Unspecified Public Purpose: $60,318,000 ($1869.28)
Retired Unspecified Public Purpose: $8,223,000 ($254.83)
Issue, Unspecified Public Purpose: $2,667,000 ($82.65)
Bay City government finances - Cash and Securities in 2021 (per resident):
- Other Funds - Cash and Securities: $101,109,000 ($3133.41)
| Businesses in Bay City, MI | ||||
| Name | Count | Name | Count | |
|---|---|---|---|---|
| 7-Eleven | 8 | Kroger | 1 | |
| ALDI | 1 | La-Z-Boy | 1 | |
| AT&T | 1 | Lane Furniture | 3 | |
| Ace Hardware | 1 | Little Caesars Pizza | 3 | |
| Advance Auto Parts | 2 | Long John Silver's | 2 | |
| Aeropostale | 1 | Marriott | 1 | |
| AmericInn | 1 | MasterBrand Cabinets | 3 | |
| American Eagle Outfitters | 1 | McDonald's | 8 | |
| Applebee's | 1 | Meijer | 2 | |
| Arby's | 1 | Men's Wearhouse | 1 | |
| Audi | 1 | Menards | 1 | |
| AutoZone | 1 | New Balance | 2 | |
| Baskin-Robbins | 1 | Nike | 1 | |
| Bath & Body Works | 1 | Old Navy | 1 | |
| Blockbuster | 1 | Papa John's Pizza | 1 | |
| Buffalo Wild Wings | 1 | Payless | 2 | |
| Burger King | 2 | Penske | 1 | |
| Carson Pirie Scott | 1 | Pizza Hut | 1 | |
| Chevrolet | 1 | Quiznos | 1 | |
| Cold Stone Creamery | 1 | RadioShack | 2 | |
| Cracker Barrel | 1 | Red Lobster | 1 | |
| Curves | 1 | Rite Aid | 3 | |
| Deb | 1 | Sears | 2 | |
| Discount Tire | 1 | Spencer Gifts | 1 | |
| Domino's Pizza | 1 | Sprint Nextel | 2 | |
| Fashion Bug | 1 | Staples | 1 | |
| FedEx | 7 | Subaru | 1 | |
| Ford | 1 | Subway | 7 | |
| GNC | 2 | T-Mobile | 3 | |
| GameStop | 1 | Taco Bell | 3 | |
| Goodwill | 3 | Target | 1 | |
| H&R Block | 5 | The Room Place | 1 | |
| Hilton | 1 | Tim Hortons | 1 | |
| Holiday Inn | 1 | Toyota | 1 | |
| Hollister Co. | 1 | U-Haul | 2 | |
| Home Depot | 1 | UPS | 16 | |
| Honda | 1 | Vans | 2 | |
| JCPenney | 1 | Verizon Wireless | 1 | |
| Jimmy John's | 1 | Volkswagen | 1 | |
| Jones New York | 2 | Walgreens | 1 | |
| Justice | 1 | Walmart | 1 | |
| KFC | 4 | Wendy's | 1 | |
| Kmart | 1 | YMCA | 1 | |
| Knights Inn | 1 | |||
Strongest AM radio stations in Bay City:
- WMAX (1440 AM; 5 kW; BAY CITY, MI; Owner: AM MEDIA SERVICES, L.L.C.)
- WSGW (790 AM; 5 kW; SAGINAW, MI; Owner: NM LICENSING LLC)
- WOAP (1080 AM; 50 kW; OWOSSO, MI)
- WWJ (950 AM; 50 kW; DETROIT, MI; Owner: INFINITY BROADCASTING OPERATIONS, INC.)
- WJR (760 AM; 50 kW; DETROIT, MI; Owner: ABC, INC.)
- WXYT (1270 AM; 50 kW; DETROIT, MI; Owner: INFINITY BROADCASTING CORP. OF DETROIT)
- WSAM (1400 AM; 1 kW; SAGINAW, MI; Owner: THE MACDONALD BROADCASTING COMPANY)
- WFDF (910 AM; 50 kW; FLINT, MI; Owner: ABC, INC.)
- WTCM (580 AM; 35 kW; TRAVERSE CITY, MI; Owner: WTCM RADIO, INC.)
- WCHB (1200 AM; 50 kW; TAYLOR, MI; Owner: RADIO ONE OF DETROIT, LLC)
- WDFN (1130 AM; 50 kW; DETROIT, MI; Owner: AMFM RADIO LICENSES, L.L.C.)
- WLDR (1210 AM; daytime; 50 kW; KINGSLEY, MI; Owner: FORT BEND BROADCASTING COMPANY)
- WKNX (1250 AM; 1 kW; BAY CITY, MI; Owner: FRANKENMUTH BROADCASTING, INC.)
Strongest FM radio stations in Bay City:
- WHNN (96.1 FM; BAY CITY, MI; Owner: CITADEL BROADCASTING COMPANY)
- WTRK (89.1 FM; BAY CITY, MI; Owner: BEYOND THE BAY MEDIA GROUP)
- WIOG (102.5 FM; BAY CITY, MI; Owner: CITADEL BROADCASTING COMPANY)
- WCHW-FM (91.3 FM; BAY CITY, MI; Owner: SCHOOL DISTRICT, BAY CITY)
- WTCF (100.5 FM; CARROLLTON, MI; Owner: NM LICENSING LLC)
- WGER (106.3 FM; SAGINAW, MI; Owner: NM LICENSING LLC)
- WUCX-FM (90.1 FM; BAY CITY, MI; Owner: CENTRAL MICHIGAN UNIVERSITY)
- WEEG (97.3 FM; ESSEXVILLE, MI; Owner: THE MACDONALD BROADCASTING COMPANY)
- WKCQ (98.1 FM; SAGINAW, MI; Owner: THE MACDONALD BROADCASTING COMPANY)
- WILZ (104.5 FM; SAGINAW, MI; Owner: CITADEL BROADCASTING COMPANY)
- WKQZ (93.3 FM; MIDLAND, MI; Owner: CITADEL BROADCASTING COMPANY)
- WUGN (99.7 FM; MIDLAND, MI; Owner: FAMILY LIFE BROADCASTING SYSTEM, INC)
- WYLZ (100.9 FM; PINCONNING, MI; Owner: CITADEL BROADCASTING COMPANY)
- WTLZ (107.1 FM; SAGINAW, MI; Owner: NM LICENSING LLC)
- WCEN-FM (94.5 FM; HEMLOCK, MI; Owner: NM LICENSING LLC)
- WRCL (93.7 FM; FRANKENMUTH, MI; Owner: REGENT BROADCASTING OF FLINT, INC.)
- W220BR (91.9 FM; PINCONNING, MI; Owner: PENSACOLA CHRISTIAN COLLEGE, INC.)
- WSAG (104.1 FM; PINCONNING, MI; Owner: BLUE MOOSE BROADCASTING, LLC)
- WWBN (101.5 FM; TUSCOLA, MI; Owner: REGENT BROADCASTING OF FLINT, INC.)
TV broadcast stations around Bay City:
- WNEM-TV (Channel 5; BAY CITY, MI; Owner: MEREDITH CORPORATION)
- WDCQ-TV (Channel 19; UNIVERSITY CENTER, MI; Owner: DELTA COLLEGE)
- W68DH (Channel 68; PETOSKEY, MI; Owner: MS COMMUNICATIONS, LLC)
- W22CC (Channel 22; PINCONNING, MI; Owner: P & P CABLE HOLDINGS, L.L.C.)
- W69DW (Channel 69; PINCONNING, MI; Owner: NTN/SAGINAW, INC.)
- W58CW (Channel 58; PINCONNING, MI; Owner: P & P CABLE HOLDINGS, L.L.C.)
- WEYI-TV (Channel 25; SAGINAW, MI; Owner: WEYI BROADCASTING, LLC)
- WJRT-TV (Channel 12; FLINT, MI; Owner: FLINT LICENSE SUBSIDIARY CORP.)
- WSMH (Channel 66; FLINT, MI; Owner: WSMH LICENSEE, LLC)
- WAQP (Channel 49; SAGINAW, MI; Owner: TCT OF MICHIGAN, INC.)
- W15BP (Channel 15; PINCONNING, MI; Owner: P & P CABLE HOLDINGS, L.L.C.)
- WUHO-LP (Channel 57; PINCONNING, MI; Owner: P & P CABLE HOLDINGS, L.L.C.)
- WCMU-TV (Channel 14; MOUNT PLEASANT, MI; Owner: CENTRAL MICHIGAN UNIVERSITY)
- W52CU (Channel 52; PINCONNING, MI; Owner: NTN/SAGINAW, INC.)
- National Bridge Inventory (NBI) Statistics
- 49Number of bridges
- 919ft / 280mTotal length
- $3,047,000Total costs
- 922,465Total average daily traffic
- 51,045Total average daily truck traffic
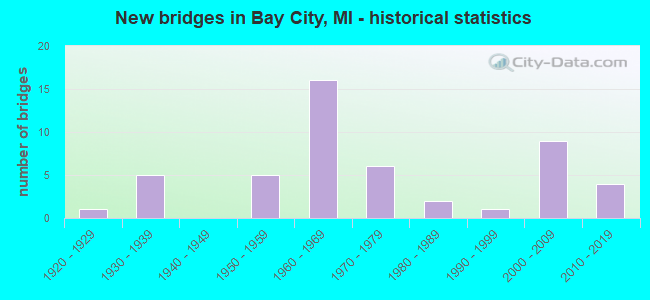
- New bridges - historical statistics
- 11920-1929
- 51930-1939
- 51950-1959
- 161960-1969
- 61970-1979
- 21980-1989
- 11990-1999
- 92000-2009
- 42010-2019
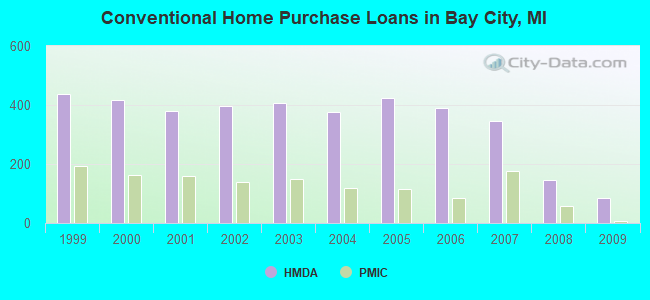
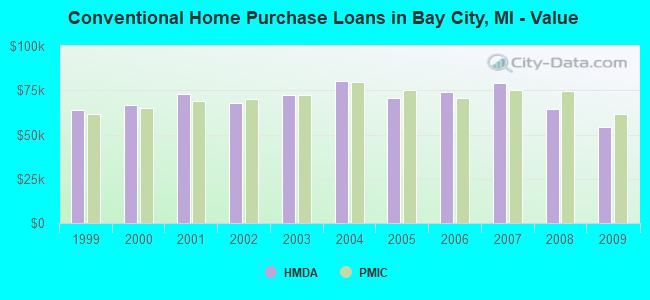
| Home Mortgage Disclosure Act Aggregated Statistics For Year 2009 (Based on 13 full tracts) | ||||||||||||||
| A) FHA, FSA/RHS & VA Home Purchase Loans | B) Conventional Home Purchase Loans | C) Refinancings | D) Home Improvement Loans | E) Loans on Dwellings For 5+ Families | F) Non-occupant Loans on < 5 Family Dwellings (A B C & D) | G) Loans On Manufactured Home Dwelling (A B C & D) | ||||||||
|---|---|---|---|---|---|---|---|---|---|---|---|---|---|---|
| Number | Average Value | Number | Average Value | Number | Average Value | Number | Average Value | Number | Average Value | Number | Average Value | Number | Average Value | |
| LOANS ORIGINATED | 130 | $62,531 | 84 | $54,476 | 310 | $79,245 | 72 | $20,056 | 2 | $49,500 | 43 | $85,860 | 2 | $12,500 |
| APPLICATIONS APPROVED, NOT ACCEPTED | 4 | $45,750 | 1 | $42,000 | 27 | $86,259 | 9 | $14,000 | 0 | $0 | 1 | $40,000 | 0 | $0 |
| APPLICATIONS DENIED | 49 | $66,327 | 18 | $50,167 | 156 | $84,731 | 51 | $20,176 | 1 | $138,000 | 13 | $82,000 | 0 | $0 |
| APPLICATIONS WITHDRAWN | 23 | $74,087 | 21 | $56,571 | 81 | $79,148 | 5 | $25,400 | 0 | $0 | 7 | $60,000 | 1 | $78,000 |
| FILES CLOSED FOR INCOMPLETENESS | 2 | $72,500 | 2 | $60,000 | 14 | $80,143 | 3 | $45,667 | 0 | $0 | 1 | $59,000 | 0 | $0 |
Detailed mortgage data for all 13 tracts in Bay City, MI
| Private Mortgage Insurance Companies Aggregated Statistics For Year 2009 (Based on 10 full tracts) | ||||
| A) Conventional Home Purchase Loans | B) Refinancings | |||
|---|---|---|---|---|
| Number | Average Value | Number | Average Value | |
| LOANS ORIGINATED | 8 | $61,500 | 5 | $65,200 |
| APPLICATIONS APPROVED, NOT ACCEPTED | 1 | $76,000 | 5 | $167,000 |
| APPLICATIONS DENIED | 2 | $45,000 | 5 | $72,600 |
| APPLICATIONS WITHDRAWN | 0 | $0 | 2 | $38,000 |
| FILES CLOSED FOR INCOMPLETENESS | 0 | $0 | 0 | $0 |
2002 - 2018 National Fire Incident Reporting System (NFIRS) incidents
- Fire incident types reported to NFIRS in Bay City, MI
- 1,55546.4%Structure Fires
- 1,06931.9%Outside Fires
- 55616.6%Mobile Property/Vehicle Fires
- 1745.2%Other
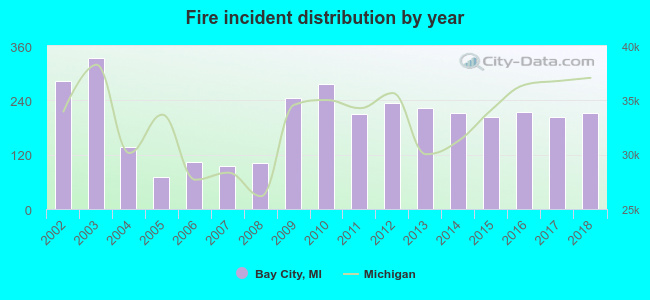 Based on the data from the years 2002 - 2018 the average number of fire incidents per year is 197. The highest number of fires - 333 took place in 2003, and the least - 70 in 2005. The data has a dropping trend.
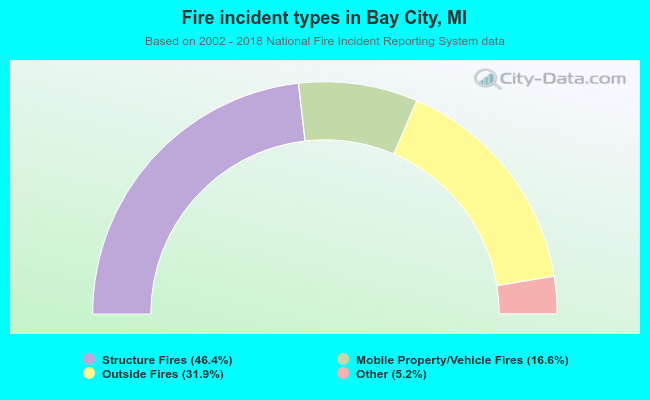 When looking into fire subcategories, the most reports belonged to: Structure Fires (46.4%), and Outside Fires (31.9%).
Fire-safe hotels and motels in Bay City, Michigan:
- Best Western Crookside Inn, 6285 Westside Saginaw Rd, Bay City, Michigan 48706 , Phone: (989) 686-0840, Fax: (989) 686-0840
- Fairfield Inn Bay City, 4105 E Wilder Rd, Bay City, Michigan 48706 , Phone: (989) 667-7050
- Doubletree Hotel Bay City Riverfront, One Wenonah Park Pl, Bay City, Michigan 48708 , Phone: (989) 891-6000, Fax: (989) 891-9680
- Holiday Inn Express & Suites Bay City East, 3959 Traxler Ct, Bay City, Michigan 48706 , Phone: (989) 667-3800, Fax: (989) 667-3900
- Courtyard By Marriott, 2 E Main St, Bay City, Michigan 48708 , Phone: (989) 634-1370
- Hampton Inn & Suites, 3901 Traxler Ct, Bay city, Michigan 48706 , Phone: (989) 778-2555, Fax: (989) 778-2550
- Budget Inn, 1305 N Washington Ave, Bay city, Michigan 48708 , Phone: (989) 894-2711
- Americinn Of Bay City, 3915 Three Mile Rd, Bay City, Michigan 48706 , Phone: (989) 671-0071, Fax: (989) 671-0311
- Bay Valley Hotel & Resort, 2470 Old Bridge Rd, Bay City, Michigan 48706 , Phone: (989) 686-3500, Fax: (989) 686-6931
| Most common first names in Bay City, MI among deceased individuals | ||
| Name | Count | Lived (average) |
|---|---|---|
| John | 613 | 74.6 years |
| Mary | 528 | 80.7 years |
| William | 524 | 74.5 years |
| Robert | 395 | 68.1 years |
| Joseph | 329 | 76.0 years |
| Edward | 329 | 76.2 years |
| George | 313 | 76.4 years |
| James | 311 | 69.9 years |
| Helen | 310 | 80.6 years |
| Frank | 288 | 76.8 years |
| Most common last names in Bay City, MI among deceased individuals | ||
| Last name | Count | Lived (average) |
|---|---|---|
| Smith | 166 | 77.8 years |
| Miller | 107 | 71.8 years |
| Johnson | 98 | 76.7 years |
| Anderson | 91 | 76.5 years |
| Davis | 80 | 74.7 years |
| Williams | 77 | 75.2 years |
| Schmidt | 77 | 75.8 years |
| Young | 72 | 79.2 years |
| Martin | 64 | 73.7 years |
| Jones | 62 | 75.1 years |
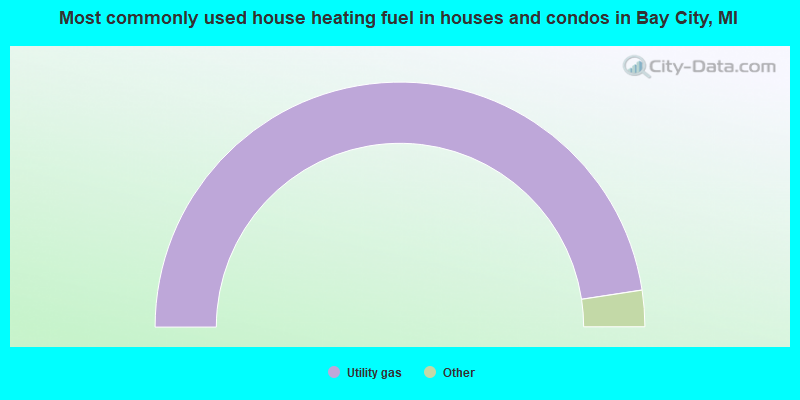
- 95.2%Utility gas
- 2.6%Electricity
- 1.2%Wood
- 0.4%Other fuel
- 0.4%Fuel oil, kerosene, etc.
- 0.2%Bottled, tank, or LP gas
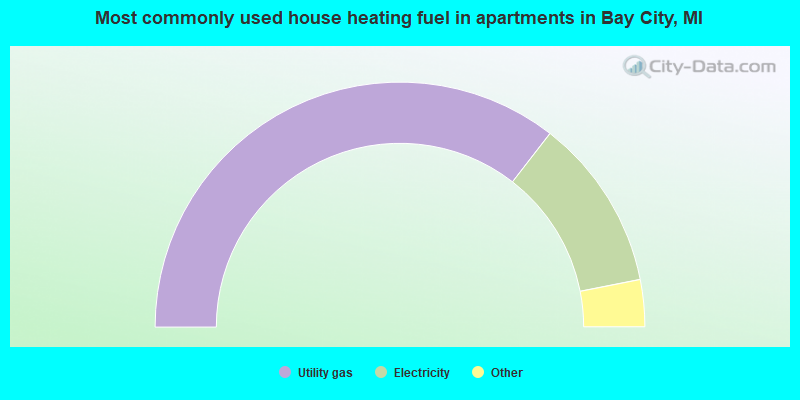
- 71.0%Utility gas
- 22.8%Electricity
- 3.5%Other fuel
- 1.4%Bottled, tank, or LP gas
- 1.1%No fuel used
- 0.2%Solar energy
Bay City compared to Michigan state average:
- Median household income below state average.
- Median house value significantly below state average.
- Unemployed percentage below state average.
- Black race population percentage significantly below state average.
- Median age below state average.
- Foreign-born population percentage significantly below state average.
- Length of stay since moving in significantly above state average.
- House age above state average.
Bay City on our top lists:
- #54 on the list of "Top 101 cities with the most people born in the same U.S. state as the city (population 5,000+)"
- #87 on the list of "Top 101 cities with largest percentage of males in occupations: healthcare support occupations (population 5,000+)"
- #94 on the list of "Top 101 cities with the highest number of rapes per 100,000 residents, excludes tourist destinations and others with a lot of outsiders visiting based on city industries data (population 5,000+)"
- #101 (48708) on the list of "Top 101 zip codes with the largest percentage of Polish first ancestries (pop 5,000+)"
- #74 on the list of "Top 101 counties with the largest number of people moving out compared to moving in (pop. 50,000+)"
- #85 on the list of "Top 101 counties with the lowest percentage of residents relocating to other counties in 2011 (pop. 50,000+)"
- #89 on the list of "Top 101 counties with the lowest percentage of residents relocating from other counties between 2010 and 2011"
- #95 on the list of "Top 101 counties with the lowest number of births per 1000 residents 2007-2013"

|
|
Total of 409 patent applications in 2008-2024.