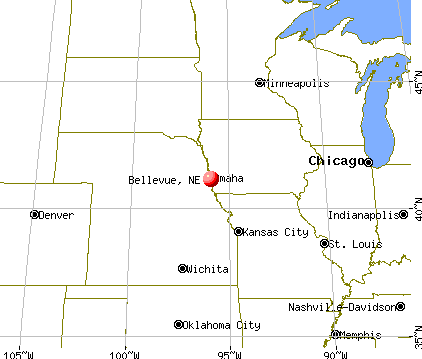
Bellevue, Nebraska
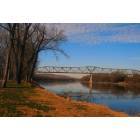
Bellevue: Toll Bridge over the Missouri River in Hayworth Park

Bellevue: Olde Town Bellevue Early Morning Snow

Bellevue: Veterans Day Parade, Bellevue Nebraska

Bellevue: A Bellevue Sun.Set
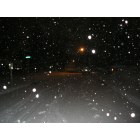
Bellevue: The night before a Snow-Day.
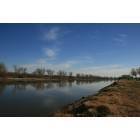
Bellevue: Missouri River in Hayworth Park
Bellevue: The Bellevue Bridge from Bellvue's Eagle Trail
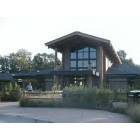
Bellevue: Fontenelle Forest Visitor's Center - Bellevue, NE
- add
your


Submit your own pictures of this city and show them to the world
- OSM Map
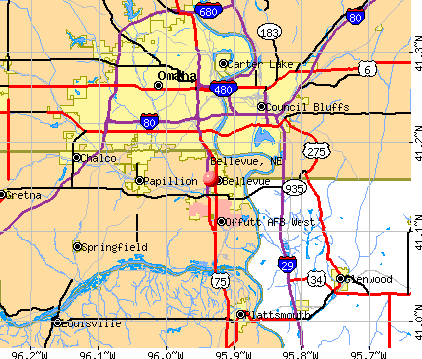
- General Map
- Google Map
- MSN Map
Population change since 2000: +42.0%
 |
| Males: 32,821 | |
| Females: 30,194 |
| Median resident age: | 36.2 years |
| Nebraska median age: | 37.4 years |
Zip codes: 68005, 68113, 68123, 68133, 68147, 68157.
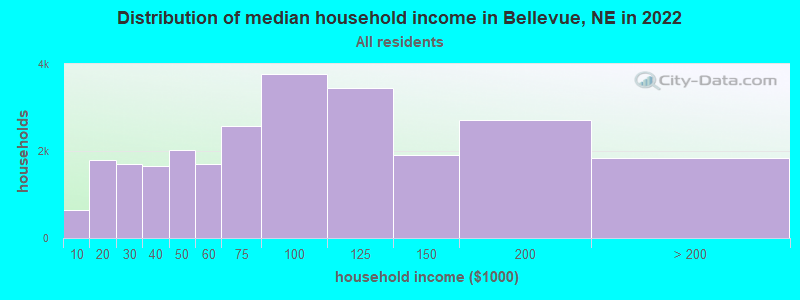
Bellevue Zip Code Map| Bellevue: | $82,080 |
| NE: | $69,597 |
Estimated per capita income in 2022: $38,664 (it was $20,903 in 2000)
Bellevue city income, earnings, and wages data
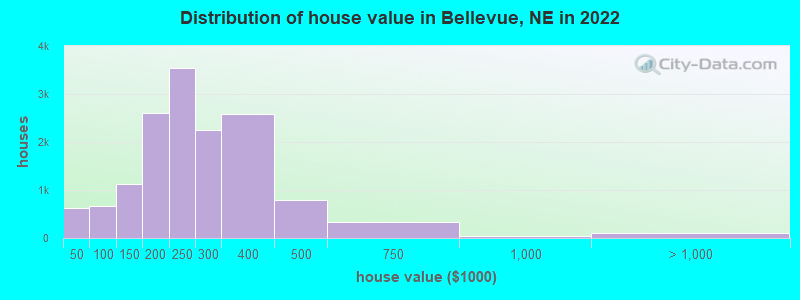
Estimated median house or condo value in 2022: $237,716 (it was $96,900 in 2000)
| Bellevue: | $237,716 |
| NE: | $232,400 |
Mean prices in 2022: all housing units: $235,590; detached houses: $239,126; townhouses or other attached units: $185,833; in 2-unit structures: $220,190; in 3-to-4-unit structures: $196,907; in 5-or-more-unit structures: $380,437; mobile homes: $105,474
Median gross rent in 2022: $1,170.
(6.6% for White Non-Hispanic residents, 9.6% for Black residents, 13.7% for Hispanic or Latino residents, 17.0% for American Indian residents, 21.4% for other race residents, 10.3% for two or more races residents)
Detailed information about poverty and poor residents in Bellevue, NE

Compare current foreclosures in Bellevue, NE:
| Photo | Address | Area | Beds / Baths | Price | Details |
|---|---|---|---|---|---|

|
#1
Gertrude St # 68147
Bellevue, NE 68147
|
1,429 sq. feet
|
2 baths 3 beds |
show details | |

|
#2
Chad St
Bellevue, NE 68123
|
2,243 sq. feet
|
2 baths 4 beds |
show details | |

|
#3
S 27th St
Bellevue, NE 68147
|
2,189 sq. feet
|
2 baths 4 beds |
show details | |

|
#4
Sheridan Rd
Bellevue, NE 68123
|
2,063 sq. feet
|
2 baths 3 beds |
show details | |

|
#5
Daniell Cir
Bellevue, NE 68123
|
2,211 sq. feet
|
2 baths 3 beds |
show details | |

|
#6
Lois Ln
Bellevue, NE 68005
|
1,212 sq. feet
|
1 baths 3 beds |
show details | |

|
#7
S 41st St
Bellevue, NE 68147
|
1,008 sq. feet
|
1 baths 3 beds |
show details | |

|
#8
S 32nd Ave
Bellevue, NE 68147
|
1,586 sq. feet
|
1 baths 3 beds |
show details | |

|
#9
Bellevue Blvd N
Bellevue, NE 68005
|
864 sq. feet
|
1 baths 3 beds |
show details | |

|
#10
Heartland Dr
Bellevue, NE 68123
|
2,179 sq. feet
|
2 baths 2 beds |
show details |
| Photo | Address | Area | Beds / Baths | Price | Details |
|---|---|---|---|---|---|

|
#11
Jackson St
Bellevue, NE 68005
|
2,286 sq. feet
|
1 baths 3 beds |
show details | |

|
#12
Jackson St
Bellevue, NE 68005
|
1,350 sq. feet
|
1 baths 2 beds |
show details | |

|
#13
Olive St
Bellevue, NE 68147
|
936 sq. feet
|
1 baths 3 beds |
show details | |

|
#14
Pointer Cir
Bellevue, NE 68123
|
2,236 sq. feet
|
2 baths 3 beds |
show details | |

|
#15
S 33rd St
Bellevue, NE 68147
|
1,464 sq. feet
|
1 baths 3 beds |
show details | |

|
#16
Calhoun St
Bellevue, NE 68005
|
1,590 sq. feet
|
1 baths 3 beds |
show details | |

|
#17
Kay Lynn Dr
Bellevue, NE 68005
|
1,524 sq. feet
|
1 baths 3 beds |
show details | |

|
#18
S 25th Ave
Bellevue, NE 68147
|
2,462 sq. feet
|
2 baths 4 beds |
show details | |

|
#19
Yorktown St
Bellevue, NE 68123
|
1,497 sq. feet
|
2 baths 3 beds |
show details | |

|
#20
Irene St
Bellevue, NE 68147
|
1,376 sq. feet
|
1 baths 3 beds |
show details |
| Photo | Address | Area | Beds / Baths | Price | Details |
|---|---|---|---|---|---|

|
#21
Willow St
Bellevue, NE 68147
|
1,656 sq. feet
|
2 baths 3 beds |
show details | |

|
#22
Lochmoor Cir
Bellevue, NE 68123
|
4,143 sq. feet
|
3 baths 4 beds |
show details | |

|
#23
Briarwood Ln
Bellevue, NE 68147
|
1,620 sq. feet
|
2 baths 3 beds |
show details | |

|
#24
S 9th Ave
Bellevue, NE 68123
|
1,433 sq. feet
|
1 baths 3 beds |
show details | |

|
#25
Hansen Cir
Bellevue, NE 68005
|
2,042 sq. feet
|
2 baths 3 beds |
show details | |

|
#26
S 38th Ave
Bellevue, NE 68147
|
1,968 sq. feet
|
2 baths 3 beds |
show details | |

|
#27
S 25th Ave
Bellevue, NE 68123
|
1,724 sq. feet
|
2 baths 2 beds |
show details | |

|
#28
Forestdale Dr
Bellevue, NE 68123
|
2,332 sq. feet
|
2 baths 4 beds |
show details | |

|
#29
S 42nd St
Bellevue, NE 68147
|
1,440 sq. feet
|
2 baths 3 beds |
show details | |

|
#30
Hillcrest Dr
Bellevue, NE 68005
|
1,972 sq. feet
|
1 baths 3 beds |
show details |
| Photo | Address | Area | Beds / Baths | Price | Details |
|---|---|---|---|---|---|

|
#31
Mclaughlin Cir
Bellevue, NE 68005
|
1,645 sq. feet
|
1 baths 2 beds |
show details | |

|
#32
Parkway Dr
Bellevue, NE 68005
|
1,584 sq. feet
|
1 baths 3 beds |
show details | |

|
#33
Hancock St
Bellevue, NE 68005
|
1,383 sq. feet
|
1 baths 3 beds |
show details | |

|
#34
Chandler Hills Dr
Bellevue, NE 68147
|
1,032 sq. feet
|
1 baths 2 beds |
show details | |

|
#35
Calhoun St
Bellevue, NE 68005
|
1,680 sq. feet
|
1 baths 3 beds |
show details | |

|
#36
Vicki Cir
Bellevue, NE 68005
|
1,612 sq. feet
|
2 baths 3 beds |
show details | |

|
#37
Sarpy Ave
Bellevue, NE 68147
|
1,438 sq. feet
|
1 baths 2 beds |
show details | |

|
#38
Greene Ave
Bellevue, NE 68147
|
1,623 sq. feet
|
2 baths 3 beds |
show details | |

|
#39
S 27th St
Bellevue, NE 68123
|
1,733 sq. feet
|
2 baths 4 beds |
show details | |

|
#40
Columbus Ave
Bellevue, NE 68005
|
1,554 sq. feet
|
2 baths 3 beds |
show details |
| Photo | Address | Area | Beds / Baths | Price | Details |
|---|---|---|---|---|---|

|
#41
S 29th Ave
Bellevue, NE 68123
|
2,233 sq. feet
|
2 baths 3 beds |
show details | |

|
#42
Englewood Dr
Bellevue, NE 68005
|
1,445 sq. feet
|
1 baths 3 beds |
show details | |

|
#43
Margo St
Bellevue, NE 68147
|
660 sq. feet
|
1 baths 2 beds |
show details | |

|
#44
Randall Dr
Bellevue, NE 68005
|
2,022 sq. feet
|
2 baths 3 beds |
show details | |

|
#45
Lynnwood Dr
Bellevue, NE 68123
|
2,355 sq. feet
|
2 baths 3 beds |
show details | |

|
#46
Hancock St
Bellevue, NE 68005
|
884 sq. feet
|
1 baths 2 beds |
show details | |

|
#47
Jefferson St
Bellevue, NE 68005
|
1,240 sq. feet
|
1 baths 2 beds |
show details | |

|
#48
Lucille Dr
Bellevue, NE 68147
|
2,160 sq. feet
|
1 baths 3 beds |
show details | |

|
#49
Golden Blvd
Bellevue, NE 68123
|
1,648 sq. feet
|
2 baths 3 beds |
show details | |

|
Check over 1 million property listings on Foreclosure.com!
|
browse all offers | |||


- 42,91465.9%White alone
- 12,52119.2%Hispanic
- 3,6405.6%Black alone
- 3,1024.8%Two or more races
- 2,2943.5%Asian alone
- 1,3162.0%Other race alone
- 1940.3%American Indian alone
- 360.06%Native Hawaiian and Other
Pacific Islander alone
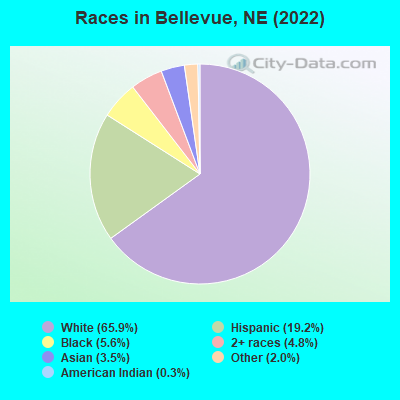
Races in Bellevue detailed stats: ancestries, foreign born residents, place of birth
According to our research of Nebraska and other state lists, there were 137 registered sex offenders living in Bellevue, Nebraska as of April 25, 2024.
The ratio of all residents to sex offenders in Bellevue is 402 to 1.
The ratio of registered sex offenders to all residents in this city is near the state average.
The City-Data.com crime index weighs serious crimes and violent crimes more heavily. Higher means more crime, U.S. average is 246.1. It adjusts for the number of visitors and daily workers commuting into cities.
- means the value is smaller than the state average.- means the value is about the same as the state average.
- means the value is bigger than the state average.
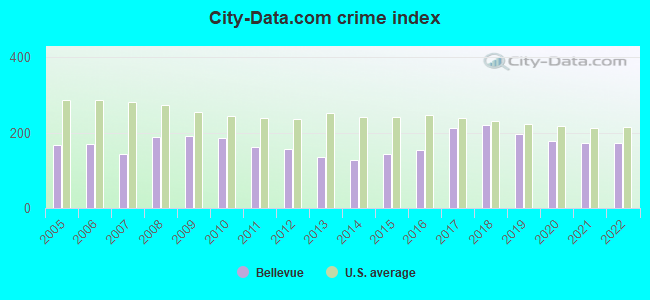
Crime rate in Bellevue detailed stats: murders, rapes, robberies, assaults, burglaries, thefts, arson
Full-time law enforcement employees in 2021, including police officers: 116 (104 officers - 91 male; 13 female).
| Officers per 1,000 residents here: | 1.95 |
| US average: | 2.38 |
 Recent articles from our blog. Our writers, many of them Ph.D. graduates or candidates, create easy-to-read articles on a wide variety of topics.


Latest news from Bellevue, NE collected exclusively by city-data.com from local newspapers, TV, and radio stations
Bellevue, NE City Guides:
Ancestries: German (15.9%), English (6.3%), American (5.8%), Irish (5.3%), Italian (3.5%), European (3.5%).
Current Local Time: CST time zone
Incorporated on 02/23/1855
Elevation: 1050 feet
Land area: 13.3 square miles.
Population density: 4,751 people per square mile (average).
5,786 residents are foreign born (4.4% Latin America, 2.4% Asia, 1.1% Africa).
| This city: | 8.9% |
| Nebraska: | 7.5% |
Median real estate property taxes paid for housing units with mortgages in 2022: $3,777 (1.5%)
Median real estate property taxes paid for housing units with no mortgage in 2022: $3,760 (1.7%)
Nearest city with pop. 50,000+: Council Bluffs, IA  (7.6 miles , pop. 58,268).
Nearest city with pop. 200,000+: Omaha, NE (8.2 miles , pop. 390,007).
Nearest city with pop. 1,000,000+: Chicago, IL (430.1 miles , pop. 2,896,016).
Nearest cities:
), Latitude: 41.16 N, Longitude: 95.93 W
Daytime population change due to commuting: -15,032 (-23.1%)
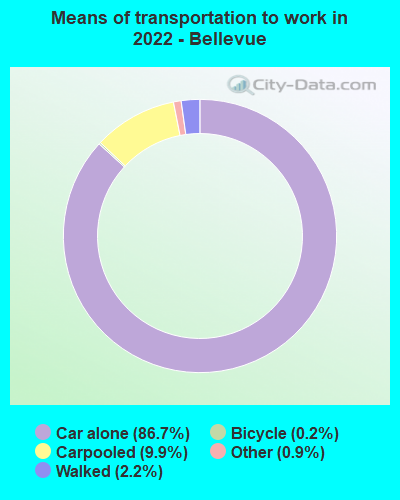
Workers who live and work in this city: 9,176 (27.3%)

Bellevue, Nebraska accommodation & food services, waste management - Economy and Business Data
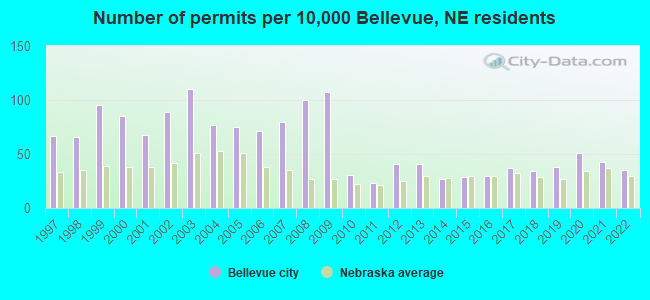
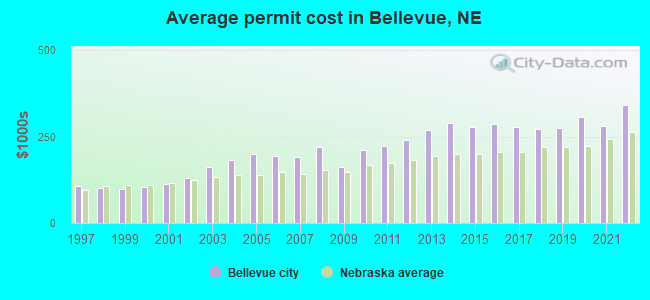
Single-family new house construction building permits:
- 2022: 154 buildings, average cost: $342,300
- 2021: 191 buildings, average cost: $281,500
- 2020: 227 buildings, average cost: $307,100
- 2019: 167 buildings, average cost: $276,000
- 2018: 151 buildings, average cost: $271,200
- 2017: 162 buildings, average cost: $278,200
- 2016: 133 buildings, average cost: $287,200
- 2015: 129 buildings, average cost: $276,700
- 2014: 121 buildings, average cost: $289,900
- 2013: 183 buildings, average cost: $268,600
- 2012: 180 buildings, average cost: $241,500
- 2011: 104 buildings, average cost: $222,000
- 2010: 137 buildings, average cost: $212,800
- 2009: 473 buildings, average cost: $161,100
- 2008: 443 buildings, average cost: $219,900
- 2007: 354 buildings, average cost: $191,100
- 2006: 317 buildings, average cost: $193,000
- 2005: 331 buildings, average cost: $200,400
- 2004: 342 buildings, average cost: $181,600
- 2003: 488 buildings, average cost: $162,000
- 2002: 397 buildings, average cost: $129,100
- 2001: 300 buildings, average cost: $113,800
- 2000: 378 buildings, average cost: $104,900
- 1999: 423 buildings, average cost: $99,100
- 1998: 291 buildings, average cost: $100,400
- 1997: 298 buildings, average cost: $107,300
| Here: | 2.6% |
| Nebraska: | 2.2% |

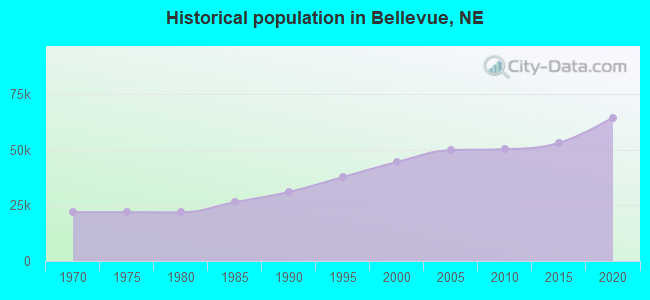
Population change in the 1990s: +5,102 (+13.0%).
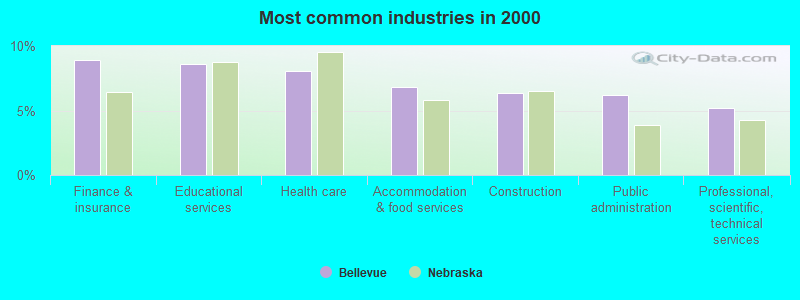
- Finance & insurance (8.9%)
- Educational services (8.6%)
- Health care (8.1%)
- Accommodation & food services (6.8%)
- Construction (6.4%)
- Public administration (6.2%)
- Professional, scientific, technical services (5.2%)
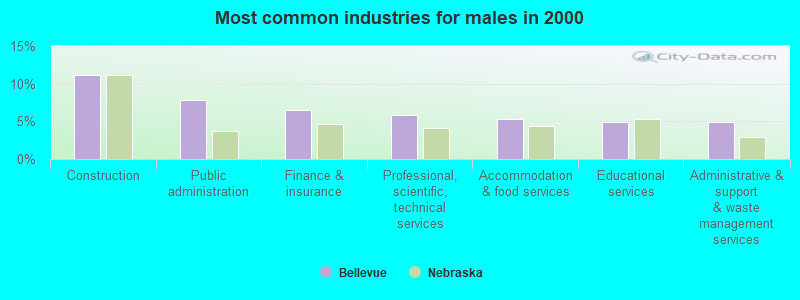
- Construction (11.1%)
- Public administration (7.9%)
- Finance & insurance (6.5%)
- Professional, scientific, technical services (5.9%)
- Accommodation & food services (5.4%)
- Educational services (4.9%)
- Administrative & support & waste management services (4.9%)
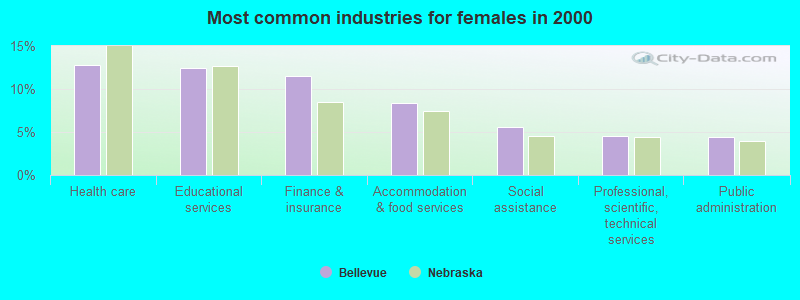
- Health care (12.8%)
- Educational services (12.5%)
- Finance & insurance (11.5%)
- Accommodation & food services (8.4%)
- Social assistance (5.6%)
- Professional, scientific, technical services (4.5%)
- Public administration (4.4%)
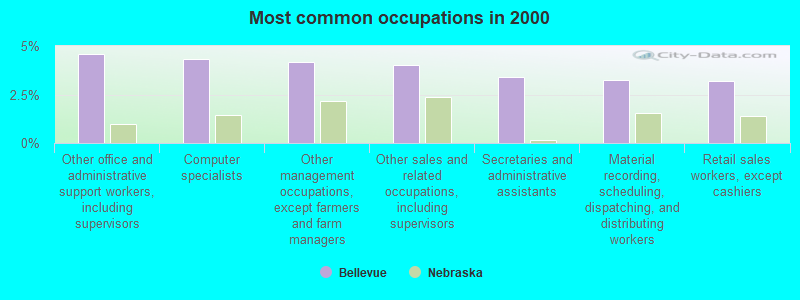
- Other office and administrative support workers, including supervisors (4.6%)
- Computer specialists (4.3%)
- Other management occupations, except farmers and farm managers (4.2%)
- Other sales and related occupations, including supervisors (4.0%)
- Secretaries and administrative assistants (3.4%)
- Material recording, scheduling, dispatching, and distributing workers (3.3%)
- Retail sales workers, except cashiers (3.2%)
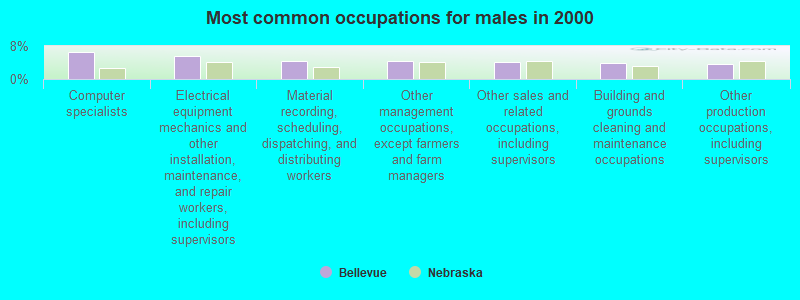
- Computer specialists (6.6%)
- Electrical equipment mechanics and other installation, maintenance, and repair workers, including supervisors (5.5%)
- Material recording, scheduling, dispatching, and distributing workers (4.4%)
- Other management occupations, except farmers and farm managers (4.2%)
- Other sales and related occupations, including supervisors (4.0%)
- Building and grounds cleaning and maintenance occupations (3.9%)
- Other production occupations, including supervisors (3.7%)

- Other office and administrative support workers, including supervisors (6.7%)
- Secretaries and administrative assistants (6.4%)
- Other management occupations, except farmers and farm managers (4.1%)
- Other sales and related occupations, including supervisors (4.1%)
- Preschool, kindergarten, elementary, and middle school teachers (4.0%)
- Child care workers (3.6%)
- Information and record clerks, except customer service representatives (3.4%)
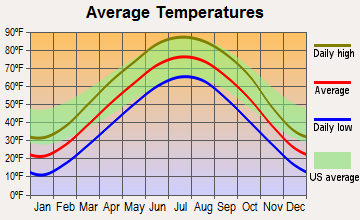
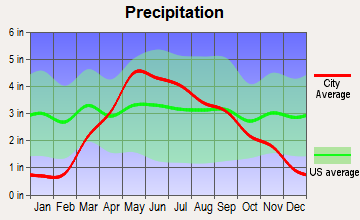
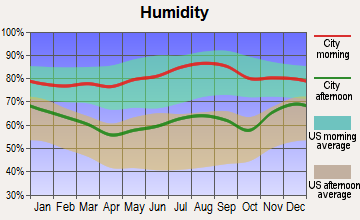
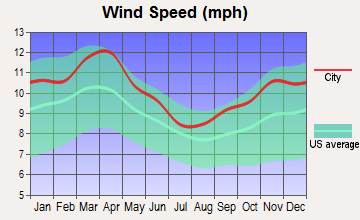
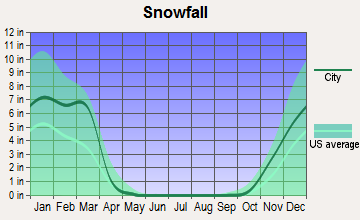
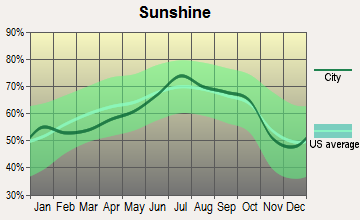
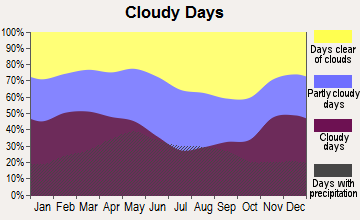
Average climate in Bellevue, Nebraska
Based on data reported by over 4,000 weather stations
|
|


(lower is better)

Air Quality Index (AQI) level in 2023 was 99.8. This is worse than average.
| City: | 99.8 |
| U.S.: | 72.6 |
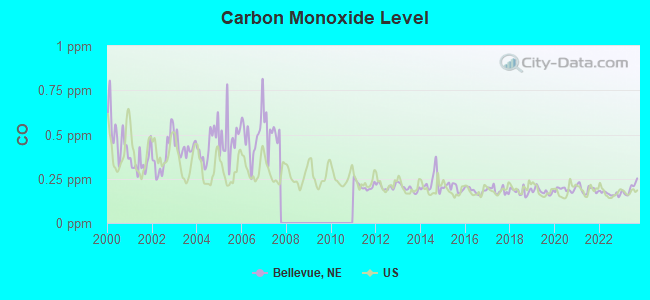
Carbon Monoxide (CO) [ppm] level in 2023 was 0.195. This is better than average. Closest monitor was 6.5 miles away from the city center.
| City: | 0.195 |
| U.S.: | 0.251 |
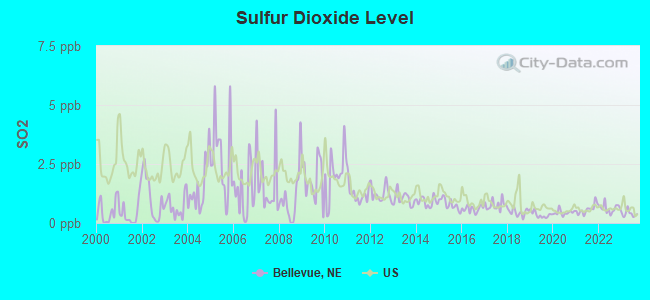
Sulfur Dioxide (SO2) [ppb] level in 2023 was 0.394. This is significantly better than average. Closest monitor was 2.5 miles away from the city center.
| City: | 0.394 |
| U.S.: | 1.515 |
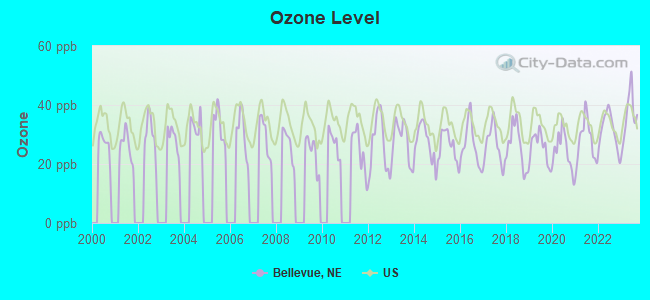
Ozone [ppb] level in 2023 was 36.5. This is about average. Closest monitor was 3.5 miles away from the city center.
| City: | 36.5 |
| U.S.: | 33.3 |
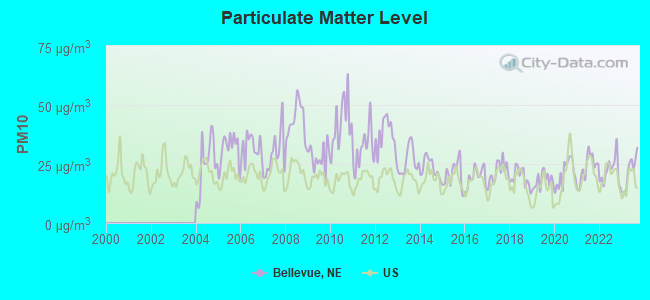
Particulate Matter (PM10) [µg/m3] level in 2023 was 21.8. This is about average. Closest monitor was 3.5 miles away from the city center.
| City: | 21.8 |
| U.S.: | 19.2 |
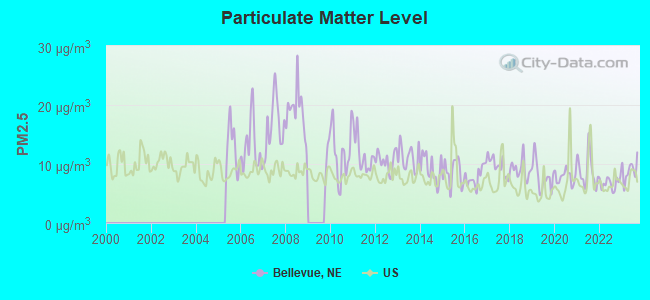
Particulate Matter (PM2.5) [µg/m3] level in 2023 was 8.92. This is about average. Closest monitor was 2.1 miles away from the city center.
| City: | 8.92 |
| U.S.: | 8.11 |
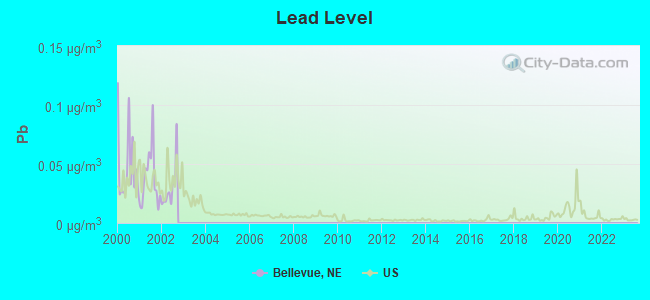
Lead (Pb) [µg/m3] level in 2002 was 0.0298. This is significantly worse than average. Closest monitor was 0.8 miles away from the city center.
| City: | 0.0298 |
| U.S.: | 0.0093 |
Tornado activity:
Bellevue-area historical tornado activity is slightly above Nebraska state average. It is 94% greater than the overall U.S. average.
On 4/25/1957, a category F4 (max. wind speeds 207-260 mph) tornado 5.2 miles away from the Bellevue city center killed one person and injured 8 people and caused between $500,000 and $5,000,000 in damages.
On 5/6/1975, a category F4 tornado 7.1 miles away from the city center killed 3 people and injured 133 people and caused between $50,000 and $500,000 in damages.
Earthquake activity:
Bellevue-area historical earthquake activity is significantly above Nebraska state average. It is 321% greater than the overall U.S. average.On 9/3/2016 at 12:02:44, a magnitude 5.8 (5.8 MW, Depth: 3.5 mi, Class: Moderate, Intensity: VI - VII) earthquake occurred 331.8 miles away from Bellevue center
On 11/6/2011 at 03:53:10, a magnitude 5.7 (5.7 MW, Depth: 3.2 mi) earthquake occurred 391.8 miles away from the city center
On 6/22/2019 at 08:50:24, a magnitude 4.6 (4.6 MW, Depth: 1.9 mi, Class: Light, Intensity: IV - V) earthquake occurred 228.2 miles away from Bellevue center
On 11/12/2014 at 21:40:00, a magnitude 4.9 (4.9 MW, Depth: 2.5 mi) earthquake occurred 283.6 miles away from the city center
On 11/3/2002 at 20:41:56, a magnitude 4.3 (4.3 MB, Depth: 3.1 mi) earthquake occurred 188.7 miles away from the city center
On 12/17/2009 at 02:53:42, a magnitude 3.6 (3.6 MB, Depth: 3.1 mi, Class: Light, Intensity: II - III) earthquake occurred 52.2 miles away from the city center
Magnitude types: body-wave magnitude (MB), moment magnitude (MW)
Natural disasters:
The number of natural disasters in Sarpy County (19) is greater than the US average (15).Major Disasters (Presidential) Declared: 14
Emergencies Declared: 2
Causes of natural disasters: Floods: 14, Storms: 10, Tornadoes: 6, Winds: 3, Snows: 2, Winter Storms: 2, Hurricane: 1, Snowstorm: 1, Other: 1 (Note: some incidents may be assigned to more than one category).

Hospitals and medical centers in Bellevue:
Colleges/Universities in Bellevue:
- Bellevue University (Full-time enrollment: 7,139; Location: 1000 Galvin Rd S; Private, not-for-profit; Website: bellevue.edu; Offers Doctor's degree)
- National American University-Bellevue (Full-time enrollment: 152; Location: 3604 Summit Plaza Drive; Private, for-profit; Website: www.national.edu/locations/bellevue-ne)
Other colleges/universities with over 2000 students near Bellevue:
- University of Nebraska Medical Center (about 8 miles; Omaha, NE; Full-time enrollment: 2,815)
- Creighton University (about 8 miles; Omaha, NE; FT enrollment: 5,370)
- University of Nebraska at Omaha (about 8 miles; Omaha, NE; FT enrollment: 12,073)
- Metropolitan Community College Area (about 11 miles; Omaha, NE; FT enrollment: 12,236)
- Iowa Western Community College (about 11 miles; Council Bluffs, IA; FT enrollment: 5,344)
- Nebraska Wesleyan University (about 44 miles; Lincoln, NE; FT enrollment: 2,072)
- Southeast Community College Area (about 44 miles; Lincoln, NE; FT enrollment: 8,838)
Public high schools in Bellevue:
- BELLEVUE WEST SR HIGH SCHOOL (Students: 520, Location: 1501 THURSTON AVE, Grades: 9-12)
- BELLEVUE EAST SR HIGH SCHOOL (Students: 487, Location: 1401 HIGH SCHOOL DR, Grades: 9-12)
- CHAP CENTER (Students: 104, Location: 1201 GREGG RD, Grades: PK-12)
Private high school in Bellevue:
Biggest public elementary/middle schools in Bellevue:
- LOGAN FONTENELLE MIDDLE SCHOOL (Students: 734, Location: 701 KAYLEEN DR SOUTH, Grades: 7-8)
- BELLEVUE MISSION MIDDLE SCHOOL (Students: 656, Location: 2202 WASHINGTON ST, Grades: 7-8)
- FAIRVIEW ELEMENTARY SCHOOL (Students: 453, Location: 14110 TREGARON DRIVE, Grades: PK-6)
- LEONARD LAWRENCE ELEM SCHOOL (Students: 451, Location: 13204 S 29TH ST, Grades: PK-6)
- LEMAY ELEMENTARY SCHOOL (Students: 431, Location: 2726 KENNEDY DR, Grades: PK-6)
- BIRCHCREST ELEMENTARY SCHOOL (Students: 372, Location: 1212 FAIRFAX DR, Grades: PK-6)
- BETZ ELEMENTARY SCHOOL (Students: 350, Location: 605 W 27TH AVE, Grades: PK-6)
- FORT CROOK ELEMENTARY SCHOOL (Students: 330, Location: 12501 S 25TH ST, Grades: PK-6)
- AVERY ELEMENTARY SCHOOL (Students: 326, Location: 2107 AVERY RD, Grades: PK-6)
- BELLEAIRE ELEMENTARY SCHOOL (Students: 297, Location: 1200 MISSION AVE WEST, Grades: PK-6)
Private elementary/middle schools in Bellevue:
Library in Bellevue:
- BELLEVUE PUBLIC LIBRARY (Operating income: $1,090,493; Location: 1003 LINCOLN ROAD; 121,653 books; 14,365 e-books; 7,017 audio materials; 6,385 video materials; 5 local licensed databases; 20 state licensed databases; 1 other licensed databases; 196 print serial subscriptions; 1 electronic serial subscriptions)
User-submitted facts and corrections:
- Tregearon Senior Residence 2309 Greenwald St Bellevue NE 68123 for active seniors 55+
Points of interest:
Notable locations in Bellevue: Avery (A), Bellevue (B), American Plaza (C), Bellevue Plaza (D), Haworth Park Campground (E), Fontenelle Hills Country Club (F), Richard D Winchell Student Center (G), Nelson Computer Center (H), R Joe Dennis Learning Center (I), Freeman-Lozier Library (J), Gordon Lozier Physical Health Center (K), Gilbert M and Martha H Hitchcock Humanities Center (L), Durham Administration Center (M), Bellevue Police Department - Southroads Substation (N), Bellevue Police Department (O), Bellevue Volunteer Fire Department District 1 (P), Midwest Medical Transport Company Bellvue Station (Q), Bellevue Volunteer Fire Department District 3 (R), Bellevue Volunteer Fire Department District 2 (S). Display/hide their locations on the map
Shopping Center: Southroads Mall (1). Display/hide its location on the map
Churches in Bellevue include: Pleasantview Berean Church (A), Immanuel Lutheran Church (B), New Life Baptist Church (C), Bible Truth Ministries Fellowship Church (D), Golden Hills Seventh Day Adventist Church (E), West Bellevue Baptist Church (F), Aldersgate United Methodist Church (G), First Baptist Church of Bellevue (H), The Church of Jesus Christ of Latter Day Saints (I). Display/hide their locations on the map
Cemeteries: Bellevue Cemetery (1), Saint Johns Cemetery (2). Display/hide their locations on the map
Creeks: Copper Creek (A), Old Home Creek (B). Display/hide their locations on the map
Parks in Bellevue include: Heber Park (1), Jewell Park (2), Haworth Park (3), Baldwin Field (4), Everett Park (5), Freeman Park (6), Don Roddy Field Sports Complex (7), Mason Park (8), McCann Park (9). Display/hide their locations on the map
Tourist attractions: Sarpy County Historical Museum (2402 Clay Street) (1), Station House at Sokol Park (Amusement & Theme Parks; Highway 75 & Allied) (2), Skateland Playdaze (Amusement & Theme Parks; 1220 Fort Crook Road South) (3), Skate City Bellevue (Amusement & Theme Parks; 1220 Fort Crook Road South) (4), All Seasons Motorsports (Tours & Charters; 702 Fort Crook Road North) (5), Sarpy County Visitor's Bureau (Tours & Charters; 111 West Mission Avenue) (6). Display/hide their approximate locations on the map
Hotels: Best Western White House Inn (305 North Fort Crook Road) (1), Super 8 Motel (303 Fort Crook Road South) (2), Hillside Motel (16408 Highway 75 South) (3), Emerson Ralph L (16408 Highway 75 South) (4), Super 8 Bellevue Omaha Area (302 S Fort Crook Road) (5), Settle Inn & Suites (2105 Pratt Avenue) (6), Bellevue Super 8 Inc (303 Fort Crook Road North) (7), American Family Inn (1110 Fort Crook Rd S) (8), Microtel Inn and Suites (3512 Samson Way) (9). Display/hide their approximate locations on the map
Birthplace of: Henry Clarke (baseball) - Baseball player and coach, Todd Pratt - 2005 Major League Baseball player (Philadelphia Phillies, born: Feb 9, 1967), Josh Dotzler - College basketball player (Creighton Bluejays), Sean Douglas (American football) - Football player.
Drinking water stations with addresses in Bellevue and their reported violations in the past:
SANDS MOBILE HOME PARK (Population served: 120, Groundwater):Past health violations:Past monitoring violations:
- MCL, Single Sample - Between JUL-2009 and SEP-2009, Contaminant: Nitrate-Nitrite. Follow-up actions: St AO (w/o penalty) issued (JUL-16-2008), St Compliance achieved (OCT-20-2009)
- MCL, Average - Between APR-2008 and JUN-2008, Contaminant: Nitrate-Nitrite. Follow-up actions: St Public Notif requested (JUL-15-2008), St Violation/Reminder Notice (JUL-15-2008), St AO (w/o penalty) issued (JUL-16-2008), St Public Notif received (OCT-15-2008), St Compliance achieved (OCT-20-2009)
- MCL, Average - Between JAN-2008 and MAR-2008, Contaminant: Nitrate-Nitrite. Follow-up actions: St Public Notif requested (JAN-15-2008), St Violation/Reminder Notice (JAN-15-2008), St Public Notif received (JAN-29-2008), St AO (w/o penalty) issued (JUL-16-2008), St Compliance achieved (OCT-20-2009)
- 2 routine major monitoring violations
| This city: | 2.6 people |
| Nebraska: | 2.5 people |
| This city: | 69.9% |
| Whole state: | 64.8% |
| This city: | 6.5% |
| Whole state: | 6.0% |
Likely homosexual households (counted as self-reported same-sex unmarried-partner households)
- Lesbian couples: 0.3% of all households
- Gay men: 0.3% of all households
People in group quarters in Bellevue in 2010:
- 43 people in group homes intended for adults
- 16 people in group homes for juveniles (non-correctional)
- 15 people in nursing facilities/skilled-nursing facilities
People in group quarters in Bellevue in 2000:
- 101 people in nursing homes
- 48 people in homes for the mentally retarded
- 34 people in other noninstitutional group quarters
- 29 people in college dormitories (includes college quarters off campus)
- 11 people in religious group quarters
Banks with branches in Bellevue (2011 data):
- Great Western Bank: American Plaza Branch, Twin Creek Branch, Wolf Creek Walmart Branch. Info updated 2010/06/08: Bank assets: $8,458.0 mil, Deposits: $6,362.5 mil, headquarters in Watertown, SD, positive income, Commercial Lending Specialization, 187 total offices, Holding Company: National Australia Bank Limited
- U.S. Bank National Association: Bellevue-Southroads Branch, Twin Creek Bakers Branch, Omaha American Plaza Branch. Info updated 2012/01/30: Bank assets: $330,470.8 mil, Deposits: $236,091.5 mil, headquarters in Cincinnati, OH, positive income, 3121 total offices, Holding Company: U.S. Bancorp
- Great Southern Bank: Bellevue Branch at 7001 South 36th Street, branch established on 1993/03/22; Bellevue Branch at 1902 Harlan Drive, branch established on 1985/12/16. Info updated 2012/02/03: Bank assets: $3,788.7 mil, Deposits: $2,986.3 mil, headquarters in Reeds Spring, MO, positive income, Commercial Lending Specialization, 109 total offices, Holding Company: Great Southern Bancorp, Inc.
- Wells Fargo Bank, National Association: Bellevue Main Branch at 1101 Galvin Road South, branch established on 1963/05/20; Bellevue West Branch at 3536 Comstock Avenue, branch established on 1985/10/14. Info updated 2011/04/05: Bank assets: $1,161,490.0 mil, Deposits: $905,653.0 mil, headquarters in Sioux Falls, SD, positive income, 6395 total offices, Holding Company: Wells Fargo & Company
- Bank of the West: Bellevue Branch at 505 Galvin Road North, branch established on 1887/01/01; Twin Creek Branch at 4009 Twin Creek Dr, branch established on 2003/12/08. Info updated 2009/11/16: Bank assets: $62,408.3 mil, Deposits: $43,995.2 mil, headquarters in San Francisco, CA, positive income, 647 total offices, Holding Company: Bnp Paribas
- Bank of Nebraska: Bank Of Nebraska - Bellevue at 923 Galvin Road South, branch established on 2006/10/09. Info updated 2006/11/03: Bank assets: $120.9 mil, Deposits: $104.1 mil, headquarters in La Vista, NE, positive income, Commercial Lending Specialization, 4 total offices, Holding Company: Financial Bancshares, Inc.
- American National Bank: Galvin Road Branch at 805 Galvin Road South, branch established on 1934/01/01. Info updated 2012/02/13: Bank assets: $1,928.1 mil, Deposits: $1,460.0 mil, headquarters in Omaha, NE, positive income, Commercial Lending Specialization, 34 total offices, Holding Company: American National Corporation
- First National Bank of Omaha: Bellevue Branch at 2008 Pratt, branch established on 1996/07/15. Info updated 2010/10/13: Bank assets: $13,433.1 mil, Deposits: $10,746.6 mil, headquarters in Omaha, NE, positive income, Commercial Lending Specialization, 102 total offices, Holding Company: Lauritzen Corporation
For population 15 years and over in Bellevue:
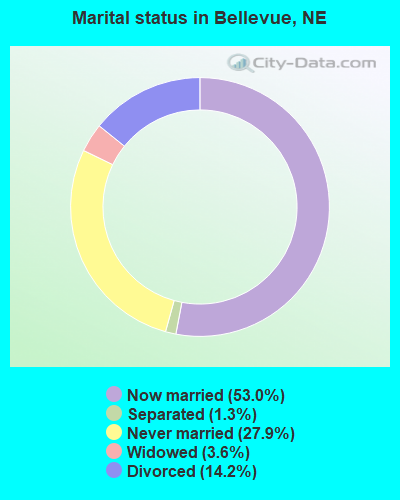
- Never married: 27.9%
- Now married: 53.0%
- Separated: 1.3%
- Widowed: 3.6%
- Divorced: 14.2%
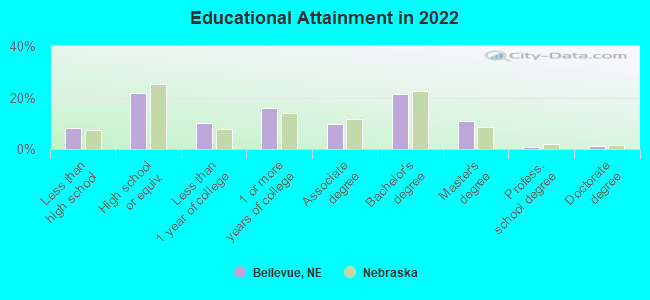
For population 25 years and over in Bellevue:
- High school or higher: 93.0%
- Bachelor's degree or higher: 32.8%
- Graduate or professional degree: 12.3%
- Unemployed: 3.6%
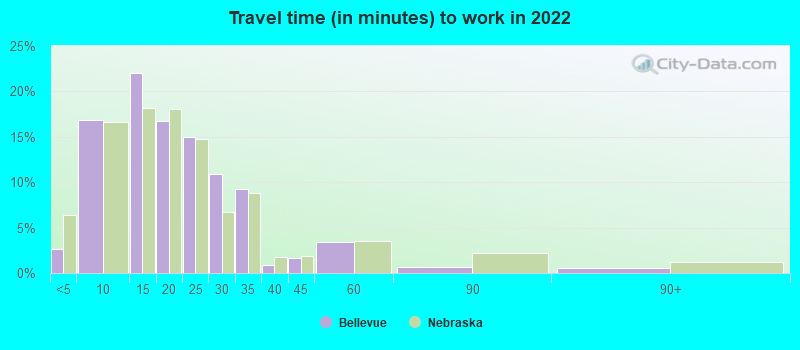
- Mean travel time to work (commute): 17.8 minutes
| Here: | 11.2 |
| Nebraska average: | 11.2 |
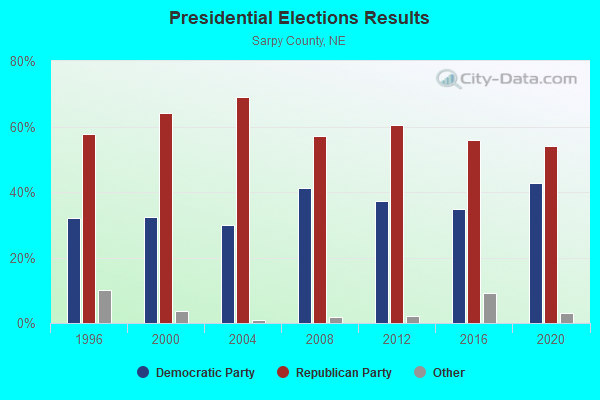
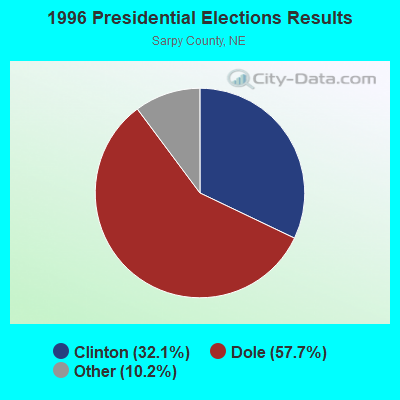
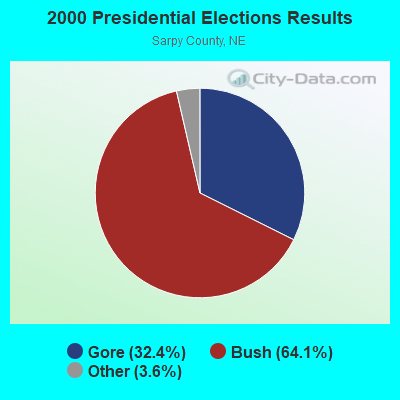
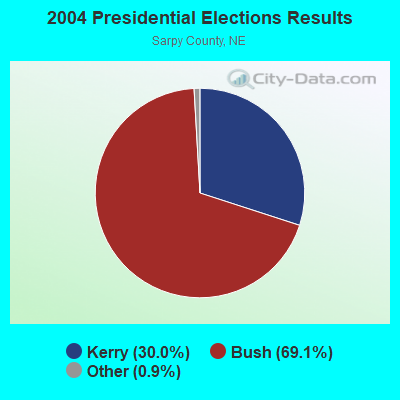
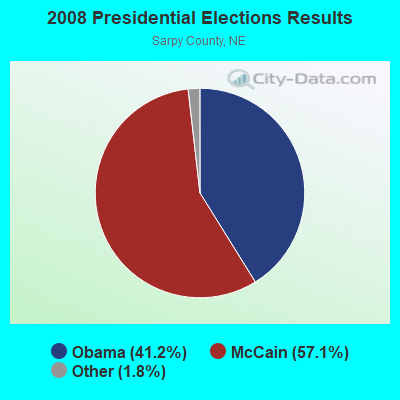
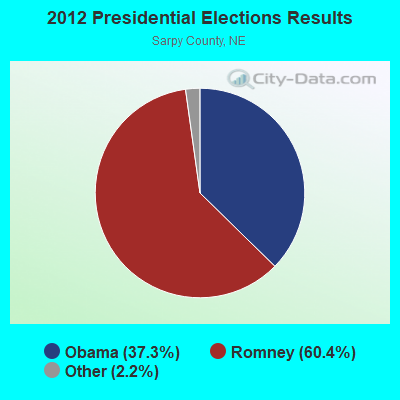
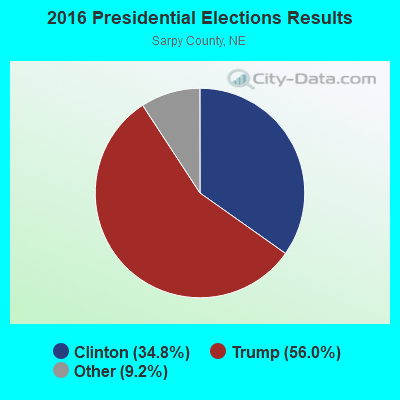
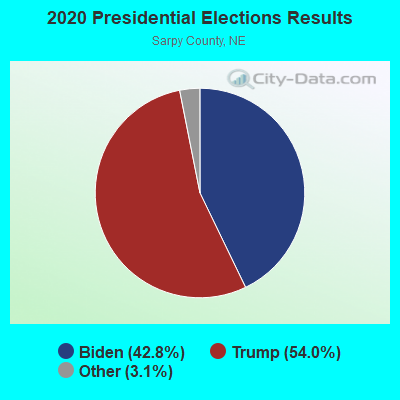
Graphs represent county-level data. Detailed 2008 Election Results
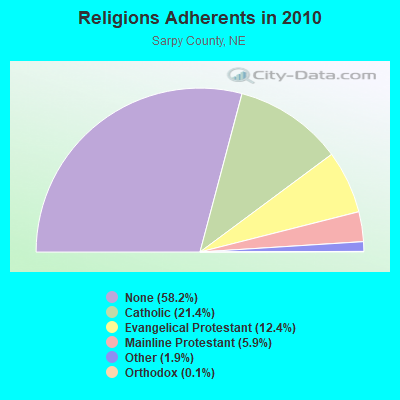
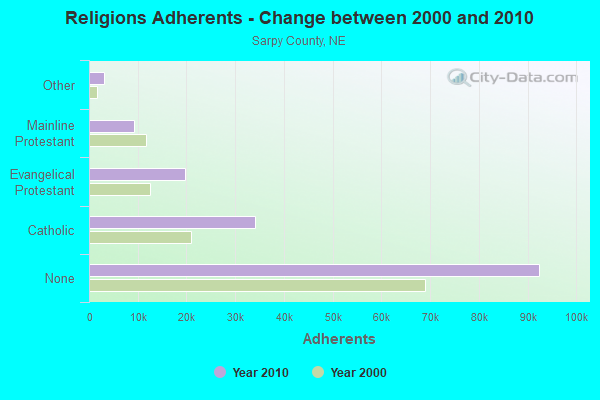
Religion statistics for Bellevue, NE (based on Sarpy County data)
| Religion | Adherents | Congregations |
|---|---|---|
| Catholic | 34,059 | 8 |
| Evangelical Protestant | 19,736 | 54 |
| Mainline Protestant | 9,299 | 17 |
| Other | 3,082 | 10 |
| Orthodox | 223 | 1 |
| None | 92,441 | - |
Food Environment Statistics:
| Sarpy County: | 1.03 / 10,000 pop. |
| State: | 2.60 / 10,000 pop. |
| Sarpy County: | 0.14 / 10,000 pop. |
| Nebraska: | 0.21 / 10,000 pop. |
| This county: | 0.27 / 10,000 pop. |
| State: | 0.44 / 10,000 pop. |
| Here: | 3.14 / 10,000 pop. |
| State: | 4.83 / 10,000 pop. |
| Sarpy County: | 4.92 / 10,000 pop. |
| Nebraska: | 7.76 / 10,000 pop. |
| Here: | 7.0% |
| Nebraska: | 7.9% |
| This county: | 28.5% |
| Nebraska: | 28.0% |
| This county: | 8.6% |
| State: | 12.9% |
Health and Nutrition:
| Here: | 49.5% |
| Nebraska: | 48.9% |
| This city: | 47.3% |
| Nebraska: | 45.5% |
| Bellevue: | 28.7 |
| State: | 28.6 |
| Bellevue: | 21.0% |
| State: | 21.4% |
| Bellevue: | 10.2% |
| Nebraska: | 10.5% |
| This city: | 6.8 |
| State: | 6.8 |
| This city: | 34.0% |
| Nebraska: | 33.5% |
| This city: | 57.2% |
| Nebraska: | 55.6% |
| Bellevue: | 79.8% |
| State: | 78.2% |
More about Health and Nutrition of Bellevue, NE Residents
| Local government employment and payroll (March 2022) | |||||
| Function | Full-time employees | Monthly full-time payroll | Average yearly full-time wage | Part-time employees | Monthly part-time payroll |
|---|---|---|---|---|---|
| Police Protection - Officers | 103 | $740,525 | $86,275 | 0 | $0 |
| Firefighters | 86 | $586,033 | $81,772 | 7 | $12,159 |
| Other and Unallocable | 34 | $172,756 | $60,973 | 0 | $0 |
| Streets and Highways | 30 | $139,082 | $55,633 | 0 | $0 |
| Other Government Administration | 25 | $143,342 | $68,804 | 7 | $10,684 |
| Parks and Recreation | 13 | $58,105 | $53,635 | 5 | $1,983 |
| Police - Other | 12 | $51,797 | $51,797 | 4 | $7,816 |
| Sewerage | 10 | $48,785 | $58,542 | 0 | $0 |
| Local Libraries | 8 | $37,734 | $56,601 | 14 | $19,548 |
| Financial Administration | 7 | $48,887 | $83,806 | 0 | $0 |
| Welfare | 5 | $19,944 | $47,866 | 3 | $4,269 |
| Housing and Community Development (Local) | 5 | $38,867 | $93,281 | 0 | $0 |
| Fire - Other | 4 | $25,422 | $76,266 | 1 | $1,953 |
| Judicial and Legal | 2 | $19,047 | $114,282 | 0 | $0 |
| Totals for Government | 344 | $2,130,326 | $74,314 | 41 | $58,411 |
Bellevue government finances - Expenditure in 2021 (per resident):
- Construction - Regular Highways: $5,833,000 ($92.57)
Parks and Recreation: $512,000 ($8.13)
Sewerage: $458,000 ($7.27)
Local Fire Protection: $358,000 ($5.68)
- Current Operations - Police Protection: $13,197,000 ($209.43)
Local Fire Protection: $8,652,000 ($137.30)
Sewerage: $7,987,000 ($126.75)
Regular Highways: $5,958,000 ($94.55)
Solid Waste Management: $3,649,000 ($57.91)
General - Other: $3,446,000 ($54.69)
Central Staff Services: $2,245,000 ($35.63)
Protective Inspection and Regulation - Other: $1,767,000 ($28.04)
Parks and Recreation: $1,762,000 ($27.96)
General Public Buildings: $1,089,000 ($17.28)
Libraries: $1,039,000 ($16.49)
Financial Administration: $677,000 ($10.74)
Housing and Community Development: $528,000 ($8.38)
Miscellaneous Commercial Activities - Other: $415,000 ($6.59)
Judicial and Legal Services: $380,000 ($6.03)
- General - Interest on Debt: $2,808,000 ($44.56)
- Intergovernmental to Local - Other - General - Other: $1,087,000 ($17.25)
Other - Water Utilities: $324,000 ($5.14)
- Intergovernmental to State - Transit Utilities: $32,000 ($0.51)
- Other Capital Outlay - Regular Highways: $1,969,000 ($31.25)
Police Protection: $584,000 ($9.27)
Sewerage: $284,000 ($4.51)
Local Fire Protection: $151,000 ($2.40)
Parks and Recreation: $63,000 ($1.00)
Miscellaneous Commercial Activities - Other: $35,000 ($0.56)
Central Staff Services: $29,000 ($0.46)
Protective Inspection and Regulation - Other: $28,000 ($0.44)
- Total Salaries and Wages: $22,558,000 ($357.98)
Bellevue government finances - Revenue in 2021 (per resident):
- Charges - Sewerage: $9,311,000 ($147.76)
Solid Waste Management: $3,454,000 ($54.81)
Other: $3,283,000 ($52.10)
Miscellaneous Commercial Activities: $98,000 ($1.56)
Parks and Recreation: $72,000 ($1.14)
- Federal Intergovernmental - Housing and Community Development: $665,000 ($10.55)
Other: $516,000 ($8.19)
Highways: $10,000 ($0.16)
- Miscellaneous - General Revenue - Other: $2,107,000 ($33.44)
Rents: $594,000 ($9.43)
Sale of Property: $231,000 ($3.67)
Fines and Forfeits: $101,000 ($1.60)
Interest Earnings: $24,000 ($0.38)
Donations From Private Sources: $15,000 ($0.24)
- Revenue - Transit Utilities: $16,000 ($0.25)
- State Intergovernmental - Highways: $6,992,000 ($110.96)
General Local Government Support: $1,649,000 ($26.17)
Transit Utilities: $142,000 ($2.25)
Other: $10,000 ($0.16)
- Tax - Property: $28,939,000 ($459.24)
General Sales and Gross Receipts: $12,545,000 ($199.08)
Occupation and Business License - Other: $2,226,000 ($35.32)
Motor Vehicle License: $1,263,000 ($20.04)
Public Utility License: $1,114,000 ($17.68)
Other: $970,000 ($15.39)
Public Utilities Sales: $820,000 ($13.01)
Alcoholic Beverage License: $62,000 ($0.98)
Other License: $23,000 ($0.36)
Amusements License: $8,000 ($0.13)
Bellevue government finances - Debt in 2021 (per resident):
- Long Term Debt - Beginning Outstanding - Unspecified Public Purpose: $36,700,000 ($582.40)
Outstanding Unspecified Public Purpose: $36,670,000 ($581.92)
Retired Unspecified Public Purpose: $30,000 ($0.48)
- Short Term Debt Outstanding - End of Fiscal Year: $13,047,000 ($207.05)
Beginning: $12,590,000 ($199.79)
Bellevue government finances - Cash and Securities in 2021 (per resident):
- Other Funds - Cash and Securities: $13,904,000 ($220.65)
- Sinking Funds - Cash and Securities: $4,904,000 ($77.82)
10.66% of this county's 2021 resident taxpayers lived in other counties in 2020 ($63,315 average adjusted gross income)
| Here: | 10.66% |
| Nebraska average: | 6.18% |
0.17% of residents moved from foreign countries ($1,061 average AGI)
Sarpy County: 0.17% Nebraska average: 0.02%
Top counties from which taxpayers relocated into this county between 2020 and 2021:
| from Douglas County, NE | |
| from Lancaster County, NE | |
| from Pottawattamie County, IA |
9.78% of this county's 2020 resident taxpayers moved to other counties in 2021 ($63,642 average adjusted gross income)
| Here: | 9.78% |
| Nebraska average: | 6.45% |
0.19% of residents moved to foreign countries ($1,206 average AGI)
Sarpy County: 0.19% Nebraska average: 0.02%
Top counties to which taxpayers relocated from this county between 2020 and 2021:
| to Douglas County, NE | |
| to Cass County, NE | |
| to Pottawattamie County, IA |
| Businesses in Bellevue, NE | ||||
| Name | Count | Name | Count | |
|---|---|---|---|---|
| ALDI | 1 | Microtel | 1 | |
| Ace Hardware | 1 | Motherhood Maternity | 1 | |
| Advance Auto Parts | 1 | New Balance | 1 | |
| Applebee's | 1 | Nike | 1 | |
| Arby's | 2 | Nissan | 1 | |
| AutoZone | 1 | Outback | 1 | |
| Best Western | 1 | Outback Steakhouse | 1 | |
| Blockbuster | 1 | Panera Bread | 1 | |
| Buffalo Wild Wings | 1 | Papa John's Pizza | 2 | |
| Burger King | 3 | Payless | 1 | |
| CVS | 1 | Penske | 1 | |
| Chevrolet | 1 | Pizza Hut | 2 | |
| Chipotle | 1 | Quiznos | 1 | |
| Cricket Wireless | 3 | RadioShack | 1 | |
| Curves | 1 | Rodeway Inn | 1 | |
| Dairy Queen | 1 | Ruby Tuesday | 1 | |
| Domino's Pizza | 1 | SONIC Drive-In | 1 | |
| FedEx | 4 | Sears | 1 | |
| Firestone Complete Auto Care | 1 | Sprint Nextel | 1 | |
| GNC | 1 | Starbucks | 3 | |
| GameStop | 2 | Subaru | 1 | |
| Goodwill | 1 | Subway | 4 | |
| H&R Block | 3 | Taco Bell | 2 | |
| Hilton | 1 | Target | 1 | |
| Holiday Inn | 2 | Toyota | 1 | |
| Honda | 1 | U-Haul | 4 | |
| IHOP | 1 | U.S. Cellular | 1 | |
| Jones New York | 1 | UPS | 6 | |
| KFC | 1 | Vans | 1 | |
| Kroger | 6 | Verizon Wireless | 2 | |
| Little Caesars Pizza | 1 | Village Inn | 2 | |
| Long John Silver's | 1 | Walgreens | 2 | |
| MasterBrand Cabinets | 1 | Walmart | 1 | |
| McDonald's | 2 | Wendy's | 1 | |
| Menards | 1 | |||
Strongest AM radio stations in Bellevue:
- KFAB (1110 AM; 50 kW; OMAHA, NE; Owner: CAPSTAR TX LIMITED PARTNERSHIP)
- KKAR (1290 AM; 50 kW; OMAHA, NE; Owner: WAITT RADIO, INC.)
- KOIL (1020 AM; 50 kW; PLATTSMOUTH, NE; Owner: WAITT RADIO, INC.)
- KLNG (1560 AM; daytime; 10 kW; COUNCIL BLUFFS, IA)
- KOZN (1620 AM; 10 kW; BELLEVUE, NE; Owner: WAITT RADIO, INC.)
- KYDZ (1180 AM; 25 kW; BELLEVUE, NE; Owner: WAITT RADIO, INC.)
- KHLP (1420 AM; 1 kW; OMAHA, NE; Owner: JOURNAL BROADCAST CORPORATION)
- KOMJ (590 AM; 5 kW; OMAHA, NE; Owner: JOURNAL BROADCAST CORPORATION)
- KOSR (1490 AM; 1 kW; OMAHA, NE; Owner: JOURNAL BROADCAST CORPORATION)
- KCRO (660 AM; 1 kW; OMAHA, NE; Owner: ETERNAL BROADCASTING, LLC)
- KMA (960 AM; 5 kW; SHENANDOAH, IA; Owner: KMA BROADCASTING L.P.)
- WHB (810 AM; 50 kW; KANSAS CITY, MO; Owner: UNION BROADCASTING, INC.)
- WHO (1040 AM; 50 kW; DES MOINES, IA; Owner: CITICASTERS LICENSES, L.P.)
Strongest FM radio stations in Bellevue:
- KMLV (88.1 FM; RALSTON, NE; Owner: EDUCATIONAL MEDIA FOUNDATION)
- KGOR (99.9 FM; OMAHA, NE; Owner: CAPSTAR TX LIMITED PARTNERSHIP)
- KQCH (94.1 FM; OMAHA, NE; Owner: JOURNAL BROADCAST CORPORATION)
- KQKQ-FM (98.5 FM; COUNCIL BLUFFS, IA; Owner: WAITT RADIO, INC.)
- KEZO-FM (92.3 FM; OMAHA, NE; Owner: JOURNAL BROADCAST CORPORATION)
- KSRZ (104.5 FM; OMAHA, NE; Owner: JOURNAL BROADCAST CORPORATION)
- KIWR (89.7 FM; COUNCIL BLUFFS, IA; Owner: IOWA WESTERN COMMUNITY COLLEGE)
- KEFM (96.1 FM; OMAHA, NE; Owner: WEBSTER COMMUNICATIONS CO.)
- K299AK (107.7 FM; OMAHA, NE; Owner: BAER COMMUNICATIONS, INC.)
- KLTQ (101.9 FM; LINCOLN, NE; Owner: WAITT RADIO, INC.)
- KGBI-FM (100.7 FM; OMAHA, NE; Owner: GRACE UNIVERSITY)
- KIOS-FM (91.5 FM; OMAHA, NE; Owner: DOUGLAS COUNTY SCHOOL DISTRICT 001)
- KVNO (90.7 FM; OMAHA, NE; Owner: THE BOARD OF REGENTS OF UNIV. OF NEBRASKA)
- KKCD (105.9 FM; OMAHA, NE; Owner: JOURNAL BROADCAST CORPORATION)
- KVSS (88.9 FM; OMAHA, NE; Owner: VSS CATHOLIC COMMUNICATIONS, INC.)
- KCTY-FM (106.9 FM; PLATTSMOUTH, NE; Owner: PLATTE BROADCASTING COMPANY, INC.)
- KBBX-FM (97.7 FM; NEBRASKA CITY, NE; Owner: JOURNAL BROADCAST CORPORATION)
- KXKT (103.7 FM; GLENWOOD, IA; Owner: CAPSTAR TX LIMITED PARTNERSHIP)
- KRQC (93.3 FM; BENNINGTON, NE; Owner: CAPSTAR TX LIMITED PARTNERSHIP)
- KFRX (102.7 FM; LINCOLN, NE; Owner: THREE EAGLES OF LINCOLN, INC.)
TV broadcast stations around Bellevue:
- KYNE-TV (Channel 26; OMAHA, NE; Owner: NEBRASKA EDUCATIONAL TELECOMMUNICATIONS COMM.)
- KMTV (Channel 3; OMAHA, NE; Owner: EMMIS TELEVISION LICENSE CORPORATION)
- KETV (Channel 7; OMAHA, NE; Owner: KETV HEARST-ARGYLE TELEVISION, INC.)
- WOWT-TV (Channel 6; OMAHA, NE; Owner: GRAY MIDAMERICA TV LICENSEE CORP.)
- KPTM (Channel 42; OMAHA, NE; Owner: PAPPAS TELECASTING OF THE MIDLANDS)
- KXVO (Channel 15; OMAHA, NE; Owner: MITTS TELECASTING COMPANY)
- KVSS-LP (Channel 67; OMAHA, NE; Owner: VSS CATHOLIC COMMUNICATIONS)
- K61GA (Channel 61; OMAHA, NE; Owner: THREE ANGELS BROADCASTING NETWORK)
- KUON-TV (Channel 12; LINCOLN, NE; Owner: THE UNIVERSITY OF NEBRASKA)
- KKAZ-CA (Channel 24; OMAHA, NE; Owner: PAPPAS TELECASTING OF THE MIDLANDS)
- K53EY (Channel 53; OMAHA, NE; Owner: TV-45, INC.)
- KHIN (Channel 36; RED OAK, IA; Owner: IOWA PUBLIC BROADCASTING BOARD)
- K21ES (Channel 21; COLUMBUS, ETC, NE; Owner: DAVID C. BRODAHL)
- K52GP (Channel 52; COUNCIL BLUFFS, IA; Owner: DOUGLAS SHELDAHL)
- K54GL (Channel 54; COUNCIL BLUFFS, IA; Owner: TV-45, INC.)
- KBIN-TV (Channel 32; COUNCIL BLUFFS, IA; Owner: IOWA PUBLIC BROADCASTING BOARD)
- KLKN (Channel 8; LINCOLN, NE; Owner: CITADEL COMMUNICATIONS, L.L.C.)
- K54EU (Channel 54; COLUMBUS-FREMONT, NE; Owner: GLENDA R. HARDERS)
- KOHA-LP (Channel 65; OMAHA, NE; Owner: K. SANDOVAL BURKE)
- National Bridge Inventory (NBI) Statistics
- 70Number of bridges
- 1,460ft / 445mTotal length
- 1,287,340Total average daily traffic
- 40,915Total average daily truck traffic
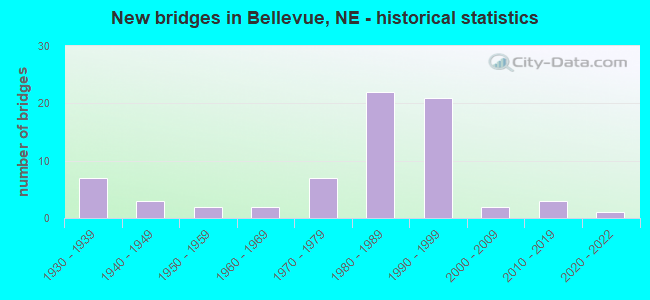
- New bridges - historical statistics
- 71930-1939
- 31940-1949
- 21950-1959
- 21960-1969
- 71970-1979
- 221980-1989
- 211990-1999
- 22000-2009
- 32010-2019
- 12020-2022
FCC Registered Antenna Towers: 213 (See the full list of FCC Registered Antenna Towers)
FCC Registered Private Land Mobile Towers: 3 (See the full list of FCC Registered Private Land Mobile Towers in Bellevue, NE)
FCC Registered Broadcast Land Mobile Towers: 25 (See the full list of FCC Registered Broadcast Land Mobile Towers)
FCC Registered Microwave Towers: 16 (See the full list of FCC Registered Microwave Towers in this town)
FCC Registered Paging Towers: 3 (See the full list of FCC Registered Paging Towers)
FCC Registered Maritime Coast & Aviation Ground Towers: 1 (See the full list of FCC Registered Maritime Coast & Aviation Ground Towers)
FCC Registered Amateur Radio Licenses: 382 (See the full list of FCC Registered Amateur Radio Licenses in Bellevue)
FAA Registered Aircraft Manufacturers and Dealers: 2 (See the full list of FAA Registered Manufacturers and Dealers in Bellevue)
FAA Registered Aircraft: 28 (See the full list of FAA Registered Aircraft)
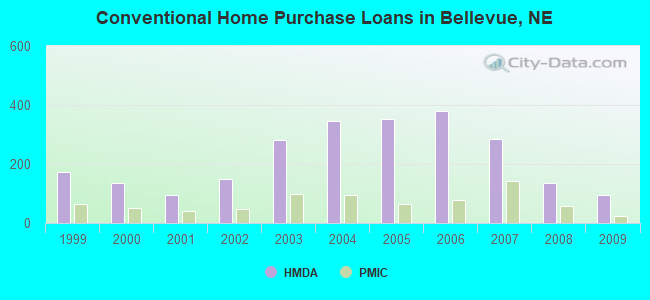
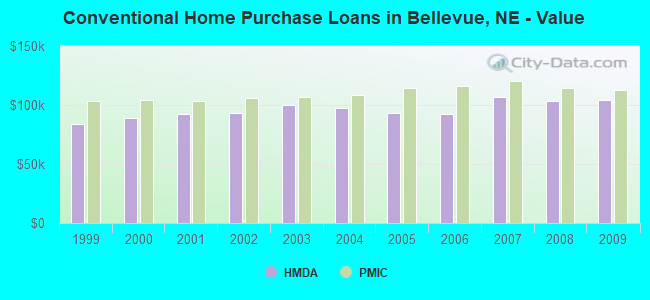
| Home Mortgage Disclosure Act Aggregated Statistics For Year 2009 (Based on 4 full and 10 partial tracts) | ||||||||||||||
| A) FHA, FSA/RHS & VA Home Purchase Loans | B) Conventional Home Purchase Loans | C) Refinancings | D) Home Improvement Loans | E) Loans on Dwellings For 5+ Families | F) Non-occupant Loans on < 5 Family Dwellings (A B C & D) | G) Loans On Manufactured Home Dwelling (A B C & D) | ||||||||
|---|---|---|---|---|---|---|---|---|---|---|---|---|---|---|
| Number | Average Value | Number | Average Value | Number | Average Value | Number | Average Value | Number | Average Value | Number | Average Value | Number | Average Value | |
| LOANS ORIGINATED | 300 | $127,201 | 94 | $104,545 | 592 | $118,938 | 97 | $28,718 | 4 | $673,065 | 43 | $93,639 | 1 | $25,230 |
| APPLICATIONS APPROVED, NOT ACCEPTED | 9 | $119,831 | 8 | $84,986 | 53 | $117,697 | 12 | $24,994 | 1 | $2,625,000 | 4 | $73,032 | 0 | $0 |
| APPLICATIONS DENIED | 16 | $120,621 | 20 | $81,034 | 177 | $120,432 | 61 | $17,548 | 1 | $178,000 | 8 | $66,642 | 3 | $80,540 |
| APPLICATIONS WITHDRAWN | 13 | $123,428 | 12 | $96,481 | 114 | $120,460 | 8 | $30,491 | 0 | $0 | 7 | $92,361 | 0 | $0 |
| FILES CLOSED FOR INCOMPLETENESS | 2 | $87,970 | 3 | $99,977 | 27 | $114,808 | 4 | $78,688 | 0 | $0 | 2 | $123,335 | 0 | $0 |
Detailed mortgage data for all 13 tracts in Bellevue, NE
| Private Mortgage Insurance Companies Aggregated Statistics For Year 2009 (Based on 4 full and 10 partial tracts) | ||||
| A) Conventional Home Purchase Loans | B) Refinancings | |||
|---|---|---|---|---|
| Number | Average Value | Number | Average Value | |
| LOANS ORIGINATED | 23 | $112,563 | 18 | $144,782 |
| APPLICATIONS APPROVED, NOT ACCEPTED | 3 | $82,337 | 4 | $138,845 |
| APPLICATIONS DENIED | 1 | $77,000 | 2 | $201,100 |
| APPLICATIONS WITHDRAWN | 0 | $0 | 2 | $175,000 |
| FILES CLOSED FOR INCOMPLETENESS | 0 | $0 | 0 | $0 |
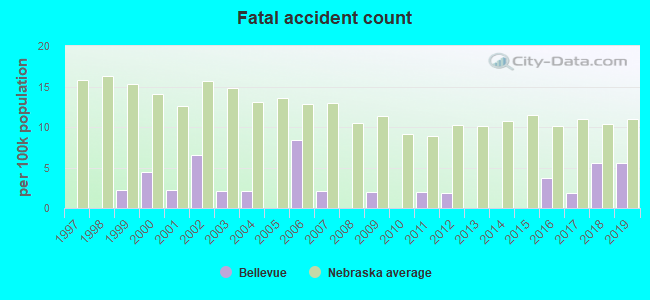
2002 - 2018 National Fire Incident Reporting System (NFIRS) incidents
- Fire incident types reported to NFIRS in Bellevue, NE
- 65645.3%Structure Fires
- 38826.8%Outside Fires
- 28019.3%Mobile Property/Vehicle Fires
- 1248.6%Other
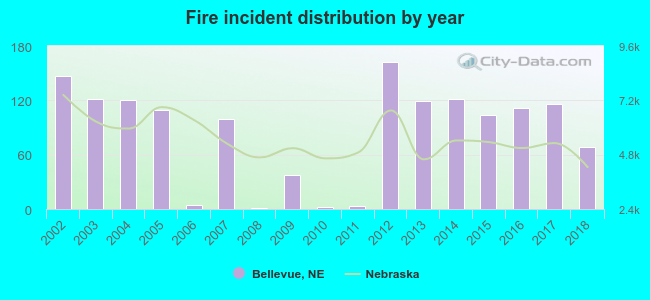 Based on the data from the years 2002 - 2018 the average number of fires per year is 85. The highest number of reported fire incidents - 162 took place in 2012, and the least - 1 in 2008. The data has a declining trend.
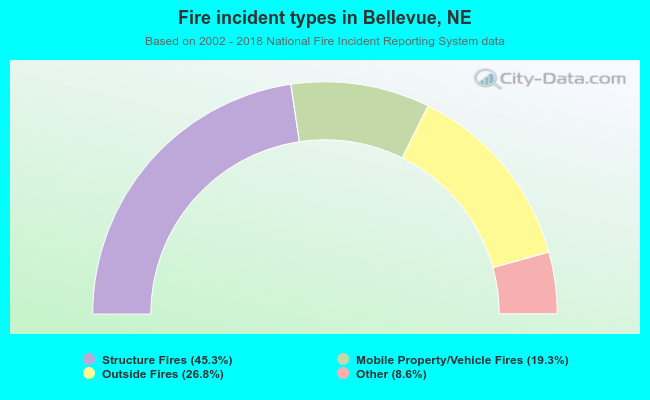 When looking into fire subcategories, the most incidents belonged to: Structure Fires (45.3%), and Outside Fires (26.8%).
Fire-safe hotels and motels in Bellevue, Nebraska:
- Rodeway Inn, 1110 Ft Crook Rd S, Bellevue, Nebraska 68005 , Phone: (402) 291-0804, Fax: (402) 291-2162
- SureStay PLUS Omaha South, 305 N Ft Crook Rd, Bellevue, Nebraska 68005 , Phone: (402) 293-1600
- Comfort Inn & Suites, 2105 Pratt Ave, Bellevue, Nebraska 68123 , Phone: (402) 292-1155, Fax: (402) 292-9498
- Microtel Inn & Suites, 3008 Samson Way, Bellevue, Nebraska 68123 , Phone: (402) 292-0191
- Holiday Inn Express Hotel & Suites, 10804 S 15th St, Bellevue, Nebraska 68123 , Phone: (402) 502-4500, Fax: (402) 933-0533
- Hampton Inn, 3404 Samson Way, Bellevue, Nebraska 68123 , Phone: (402) 292-1607, Fax: (402) 292-1608
- Candlewood Suites-Bellevue, 10902 S 15th St, Bellevue, Nebraska 68123 , Phone: (402) 932-8144, Fax: (402) 932-8146
- Value Place, 2703 Samson Way, Bellevue, Nebraska 68123 , Phone: (402) 991-5050
- Courtyard by Marriott, 3730 Raynor Pkwy, Bellevue, Nebraska 68123 , Phone: (402) 287-7300
| Most common first names in Bellevue, NE among deceased individuals | ||
| Name | Count | Lived (average) |
|---|---|---|
| John | 198 | 71.5 years |
| Mary | 181 | 77.8 years |
| Robert | 134 | 69.8 years |
| William | 132 | 73.3 years |
| James | 125 | 69.5 years |
| Charles | 105 | 73.8 years |
| Helen | 89 | 80.4 years |
| Joseph | 86 | 74.9 years |
| Frank | 80 | 75.3 years |
| George | 77 | 75.6 years |
| Most common last names in Bellevue, NE among deceased individuals | ||
| Last name | Count | Lived (average) |
|---|---|---|
| Smith | 55 | 75.4 years |
| Johnson | 46 | 73.5 years |
| Williams | 28 | 73.2 years |
| Miller | 27 | 78.3 years |
| Jones | 27 | 68.8 years |
| Davis | 26 | 65.9 years |
| Brown | 24 | 71.6 years |
| Hansen | 24 | 80.4 years |
| Anderson | 21 | 72.6 years |
| Taylor | 21 | 77.5 years |
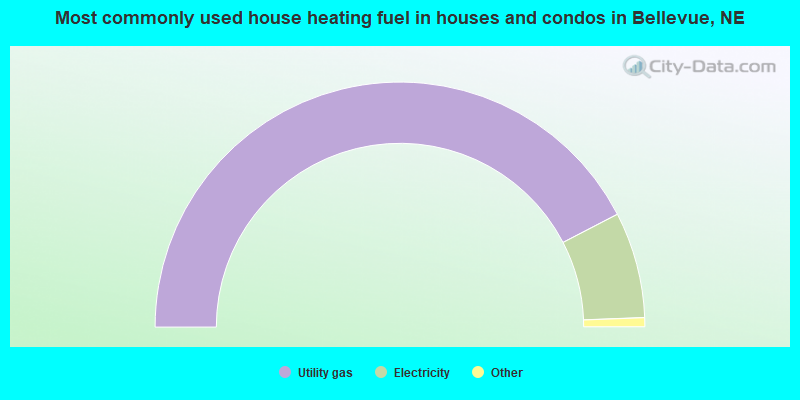
- 84.7%Utility gas
- 14.0%Electricity
- 0.7%Bottled, tank, or LP gas
- 0.4%Wood
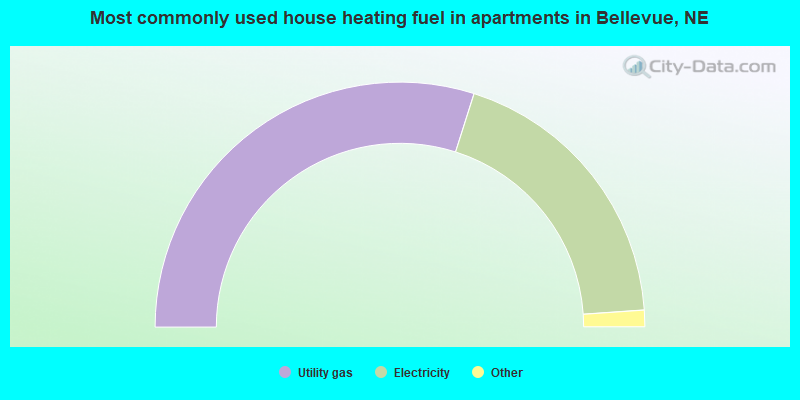
- 59.8%Utility gas
- 38.0%Electricity
- 1.5%Bottled, tank, or LP gas
- 0.6%No fuel used
- 0.1%Other fuel
Bellevue compared to Nebraska state average:
- Unemployed percentage significantly below state average.
- Black race population percentage above state average.
- Hispanic race population percentage above state average.
- Median age below state average.
- Foreign-born population percentage above state average.
- Length of stay since moving in significantly above state average.
- House age below state average.
Bellevue on our top lists:
- #13 on the list of "Top 101 cities with largest percentage of males in occupations: office and administrative support occupations (population 50,000+)"
- #17 on the list of "Top 100 high-educated but low-earning cities (pop. 50,000+)"
- #24 on the list of "Top 101 cities with largest percentage of males in industries: utilities (population 50,000+)"
- #29 on the list of "Top 101 cities with the highest ratio of rapes to murders between 2002 and 2012 (population 50,000+)"
- #35 on the list of "Top 101 cities with the lowest number of assaults per 100,000 residents (population 50,000+)"
- #39 on the list of "Top 101 cities with the largest temperature differences during a year (population 50,000+)"
- #42 on the list of "Top 101 cities with largest percentage of females in occupations: fire fighting and prevention workers including supervisors (population 50,000+)"
- #49 on the list of "Top 101 cities that people commute from (largest negative percentage daily daytime population change due to commuting) (population 50,000+)"
- #52 on the list of "Top 101 cities with the lowest daily low temperatures (population 50,000+)"
- #60 on the list of "Top 101 cities with largest percentage of workers with very short commute times (9 minutes or less) (population 50,000+)"
- #63 on the list of "Top 101 cities with the coldest winters (population 50,000+)"
- #64 on the list of "Top 101 cities with the smallest city-data.com crime index per police officer (population 50,000+)"
- #76 on the list of "Top 101 cities with the smallest household incomes disparities (population 50,000+)"
- #77 on the list of "Top 101 cities with the lowest number of robberies per 100,000 residents (population 50,000+)"
- #78 on the list of "Top 101 cities with the lowest number of burglaries per 100,000 residents (population 50,000+)"
- #80 on the list of "Top 101 cities with largest percentage of males in industries: public administration (population 50,000+)"
- #87 on the list of "Top 100 safest cities (lowest city-data.com crime index) (pop. 50,000+)"
- #89 on the list of "Top 101 cities with largest percentage of females in industries: finance and insurance (population 50,000+)"
- #95 on the list of "Top 100 cities with lowest ratio of median house value to median household income (pop. 50,000+)"
- #101 on the list of "Top 101 cities with largest percentage population increases in the 1990s) (population 50,000+)"
- #9 (68113) on the list of "Top 101 zip codes with the smallest percentage of taxpayers using paid preparers for 2012 taxes (pop 1,000+)"
- #25 (68157) on the list of "Top 101 zip codes with the largest percentage of Czech first ancestries (pop 5,000+)"
- #48 (68113) on the list of "Top 101 zip codes with the largest percentage of returns reporting salary or wage in 2012 (pop 1,000+)"
- #12 on the list of "Top 101 counties with the largest number of children under 18 without health insurance coverage in 2000 (pop. 50,000+)"
- #31 on the list of "Top 101 counties with the lowest number of deaths per 1000 residents 2007-2013 (pop. 50,000+)"
- #38 on the list of "Top 101 counties with the best general health status score of residents (1-5), 3 years of data"
- #42 on the list of "Top 101 counties with the highest number of births per 1000 residents 2007-2013"
- #44 on the list of "Top 101 counties with the highest percentage of residents that visited a dentist within the past year"

|
|
Total of 57 patent applications in 2008-2024.