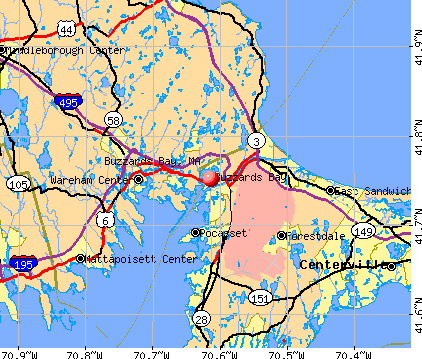
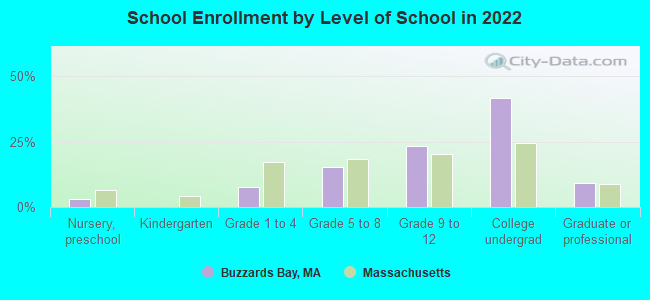
Buzzards Bay, Massachusetts
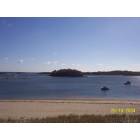
Buzzards Bay: second in a series of 3 showing the whole of the bay in the fall. When they are placed together, they form a really pretty vista.
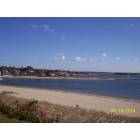
Buzzards Bay: first in a series of 3 showing the whole of the bay in the fall. When they are placed together, they form a really pretty vista.
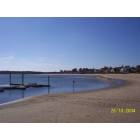
Buzzards Bay: third in a series of 3 showing the whole of the bay in the fall. When they are placed together, they form a really pretty vista.

Buzzards Bay: Railroad Bridge
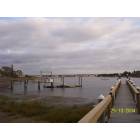
Buzzards Bay: A picture of Buzzards Bay taken early evening in October 2004, I was visiting from the UK.
- add
your


Submit your own pictures of this place and show them to the world
- OSM Map
- General Map
- Google Map
- MSN Map
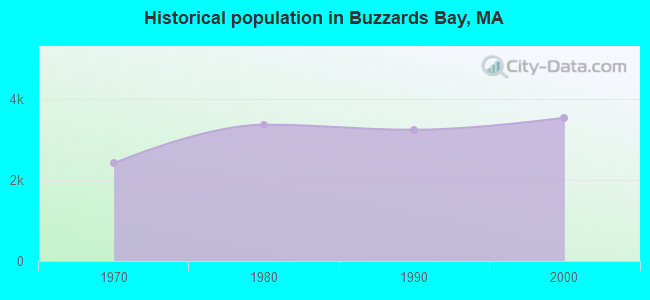
Population change since 2000: +8.7%
| Males: 1,960 | |
| Females: 1,899 |
| Median resident age: | 58.5 years |
| Massachusetts median age: | 40.3 years |
Zip codes: 02532.
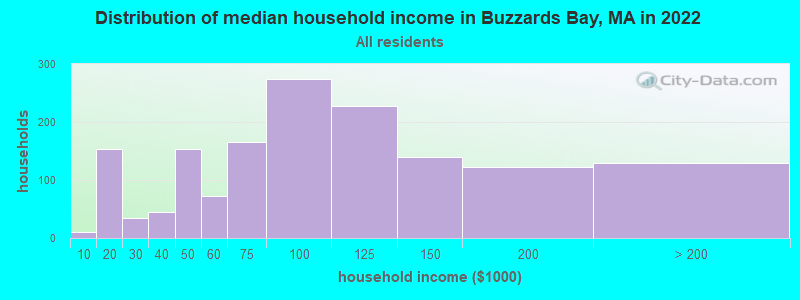
| Buzzards Bay: | $89,764 |
| MA: | $94,488 |
Estimated per capita income in 2022: $52,527 (it was $18,304 in 2000)
Buzzards Bay CDP income, earnings, and wages data
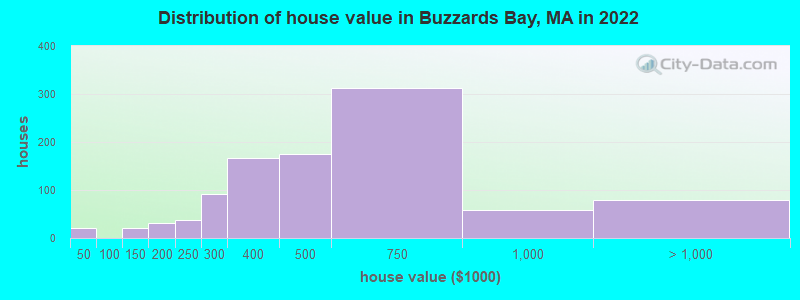
Estimated median house or condo value in 2022: $508,957 (it was $138,100 in 2000)
| Buzzards Bay: | $508,957 |
| MA: | $534,700 |
Mean prices in 2022: all housing units: $623,757; detached houses: $648,447; townhouses or other attached units: $490,502; in 2-unit structures: $577,155; in 3-to-4-unit structures: $445,551; in 5-or-more-unit structures: $351,307; mobile homes: $108,058
Median gross rent in 2022: $1,593.
(7.6% for White Non-Hispanic residents, 44.4% for Hispanic or Latino residents, 19.0% for two or more races residents)
Detailed information about poverty and poor residents in Buzzards Bay, MA


Compare current foreclosures near Buzzards Bay, MA:
| Photo | Address | Area | Beds / Baths | Price | Details |
|---|---|---|---|---|---|

|
#1
Cohasset Rd
Buzzards Bay, MA 02532
|
624 sq. feet
|
1 baths 2 beds |
show details | |

|
#2
Saltworks Ln
Buzzards Bay, MA 02532
|
954 sq. feet
|
2 baths 3 beds |
show details | |

|
#3
Cahoon Rd
Buzzards Bay, MA 02532
|
1,372 sq. feet
|
2 baths 2 beds |
show details | |

|
#4
Head Of The Bay Rd
Buzzards Bay, MA 02532
|
1,815 sq. feet
|
1 baths 3 beds |
show details | |

|
#5
Winston Ave
Buzzards Bay, MA 02532
|
1,512 sq. feet
|
2 baths 3 beds |
show details | |

|
#6
Center Ave
Buzzards Bay, MA 02532
|
1,348 sq. feet
|
2 baths 4 beds |
show details | |

|
#7
Ryder St
Buzzards Bay, MA 02532
|
2,160 sq. feet
|
2 baths 2 beds |
show details | |

|
#8
Ryder St
Buzzards Bay, MA 02532
|
2,160 sq. feet
|
2 baths 2 beds |
show details | |

|
#9
Cotuit Rd # G10
Buzzards Bay, MA 02532
|
- sq. feet
|
- baths - beds |
show details | |

|
#10
Herring Pond Rd
Buzzards Bay, MA 02532
|
- sq. feet
|
- baths - beds |
show details |
| Photo | Address | Area | Beds / Baths | Price | Details |
|---|---|---|---|---|---|

|
#11
W Falmouth Hwy
Falmouth, MA 02540
|
1,224 sq. feet
|
2 baths 4 beds |
$695,000
|
show details |

|
#12
Scraggy Neck Rd
Buzzards Bay, MA 02532
|
- sq. feet
|
- baths - beds |
show details | |

|
#13
-75 Fairhaven Road
Mattapoisett, MA 02739
|
1,200 sq. feet
|
1 baths 3 beds |
show details | |

|
#14
Tananger Rd
Plymouth, MA 02360
|
1,836 sq. feet
|
3 baths 3 beds |
show details | |

|
#15
Swifts Beach Road A/k/a 84 Swift S Beach Road
Wareham, MA 02571
|
- sq. feet
|
1 baths 3 beds |
show details | |

|
#16
State Rd
Plymouth, MA 02360
|
1,836 sq. feet
|
2 baths 2 beds |
show details | |

|
#17
Bridge St
Fairhaven, MA 02719
|
1,644 sq. feet
|
3 baths 3 beds |
show details | |

|
#18
Pheasant Ave
Wareham, MA 02571
|
882 sq. feet
|
1 baths 2 beds |
show details | |

|
#19
Chickadee Ln
Plymouth, MA 02360
|
1,008 sq. feet
|
1 baths 2 beds |
show details | |

|
#20
Mendell Rd
Rochester, MA 02770
|
1,152 sq. feet
|
1 baths 2 beds |
show details |
| Photo | Address | Area | Beds / Baths | Price | Details |
|---|---|---|---|---|---|

|
#21
Pine Ridge Ln
Mattapoisett, MA 02739
|
3,831 sq. feet
|
2 baths 4 beds |
show details | |

|
#22
Harvey Orchard Ln
Mattapoisett, MA 02739
|
1,460 sq. feet
|
1 baths 3 beds |
show details | |

|
#23
Nottingham Ln
Plymouth, MA 02360
|
1,820 sq. feet
|
2 baths 4 beds |
show details | |

|
#24
Pine St
Rochester, MA 02770
|
2,020 sq. feet
|
2 baths 3 beds |
show details | |

|
#25
Hartley Rd
Rochester, MA 02770
|
1,356 sq. feet
|
1 baths 4 beds |
show details | |

|
#26
Hartley Rd
Rochester, MA 02770
|
1,356 sq. feet
|
1 baths 4 beds |
show details | |

|
#27
Timothy Ln
Plymouth, MA 02360
|
2,100 sq. feet
|
2 baths 3 beds |
show details | |

|
#28
N Precinct Rd
Centerville, MA 02632
|
1,128 sq. feet
|
2 baths 3 beds |
show details | |

|
#29
Edgewater Dr
East Falmouth, MA 02536
|
884 sq. feet
|
1 baths 3 beds |
show details | |

|
#30
Peter Rd
Plymouth, MA 02360
|
1,700 sq. feet
|
2 baths 4 beds |
show details |
| Photo | Address | Area | Beds / Baths | Price | Details |
|---|---|---|---|---|---|

|
#31
Dunham Rd
Plymouth, MA 02360
|
2,520 sq. feet
|
2 baths 5 beds |
show details | |

|
#32
Brandt Island Rd
Mattapoisett, MA 02739
|
912 sq. feet
|
1 baths 1 beds |
show details | |

|
#33
Jacqueline Ln
Plymouth, MA 02360
|
1,470 sq. feet
|
1 baths 4 beds |
show details | |

|
#34
Kennedy Pkwy
Plymouth, MA 02360
|
2,042 sq. feet
|
2 baths 4 beds |
show details | |

|
#35
Purchase St
Carver, MA 02330
|
960 sq. feet
|
1 baths 3 beds |
show details | |

|
#36
Birch Ave
Plymouth, MA 02360
|
1,241 sq. feet
|
1 baths 3 beds |
show details | |

|
#37
Chapel Hill Dr # 8
Plymouth, MA 02360
|
895 sq. feet
|
1 baths 2 beds |
show details | |

|
#38
Rocky Gutter St
Middleboro, MA 02346
|
976 sq. feet
|
2 baths 4 beds |
show details | |

|
#39
Ba Dr
Carver, MA 02330
|
2,266 sq. feet
|
2 baths 3 beds |
show details | |

|
#40
Wareham St
Middleboro, MA 02346
|
1,114 sq. feet
|
1 baths 1 beds |
show details |
| Photo | Address | Area | Beds / Baths | Price | Details |
|---|---|---|---|---|---|

|
#41
Donegal Cir
Centerville, MA 02632
|
1,306 sq. feet
|
1 baths 2 beds |
show details | |

|
#42
Summer St
Plymouth, MA 02360
|
881 sq. feet
|
1 baths 3 beds |
show details | |

|
#43
Amos Hill Rd
Plymouth, MA 02360
|
2,075 sq. feet
|
2 baths 3 beds |
show details | |

|
#44
Davisville Rd
East Falmouth, MA 02536
|
962 sq. feet
|
1 baths 3 beds |
show details | |

|
#45
Sailfish Dr
East Falmouth, MA 02536
|
1,539 sq. feet
|
2 baths 4 beds |
show details | |

|
#46
Crystal Lake Dr
Carver, MA 02330
|
744 sq. feet
|
1 baths 2 beds |
show details | |

|
#47
Frazier Way
Marstons Mills, MA 02648
|
1,040 sq. feet
|
1 baths 3 beds |
show details | |

|
#48
Neck Rd
Rochester, MA 02770
|
1,803 sq. feet
|
1 baths 3 beds |
show details | |

|
#49
Sophie Ln
East Falmouth, MA 02536
|
1,344 sq. feet
|
2 baths 4 beds |
show details | |

|
Check over 1 million property listings on Foreclosure.com!
|
browse all offers | |||


- 2,73790.3%White alone
- 1585.2%Two or more races
- 792.6%Hispanic
- 531.7%Asian alone
- 100.3%Black alone
- 80.3%American Indian alone
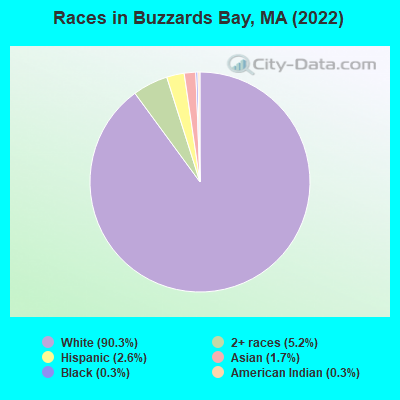
Races in Buzzards Bay detailed stats: ancestries, foreign born residents, place of birth
According to our research of Massachusetts and other state lists, there were 2 registered sex offenders living in Buzzards Bay, Massachusetts as of April 15, 2024.
The ratio of all residents to sex offenders in Buzzards Bay is 1,691 to 1.
The ratio of registered sex offenders to all residents in this city is near the state average.
 Recent articles from our blog. Our writers, many of them Ph.D. graduates or candidates, create easy-to-read articles on a wide variety of topics.


 | "Migrants" living in hotels in MA---What is the endgame or is there one at all? (966 replies) |
| 2023 Real Estate Observations (5278 replies) |
| What is the great appeal of Nantucket? (99 replies) |
| Best coastal town in Mass for young retirees (106 replies) |
| Coronavirus in Massachusetts (18041 replies) |
| Us Native Massachusetts Folk Aren’t Meant for 97 Degree Weather (152 replies) |
Latest news from Buzzards Bay, MA collected exclusively by city-data.com from local newspapers, TV, and radio stations
Buzzards Bay, MA City Guides:
Ancestries: Irish (21.3%), American (10.8%), Italian (10.1%), English (9.6%), Portuguese (5.6%), Cape Verdean (4.5%).
Current Local Time: EST time zone
Elevation: 10 feet
Land area: 1.98 square miles.
Population density: 1,950 people per square mile (low).
152 residents are foreign born (2.1% Asia, 1.7% Europe, 0.8% North America).
| This place: | 5.0% |
| Massachusetts: | 17.6% |
Median real estate property taxes paid for housing units with mortgages in 2022: $3,285 (0.6%)
Median real estate property taxes paid for housing units with no mortgage in 2022: $4,095 (0.9%)
Nearest city with pop. 50,000+: New Bedford, MA  (17.9 miles , pop. 93,768).
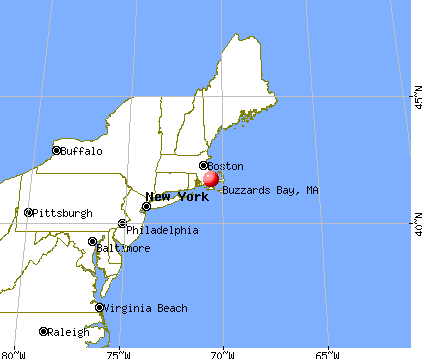
Nearest city with pop. 200,000+: Boston, MA (46.4 miles , pop. 589,141).
Nearest city with pop. 1,000,000+: Bronx, NY (180.6 miles , pop. 1,332,650).
Nearest cities:
), ), )Latitude: 41.75 N, Longitude: 70.61 W
Area codes: 774, 508

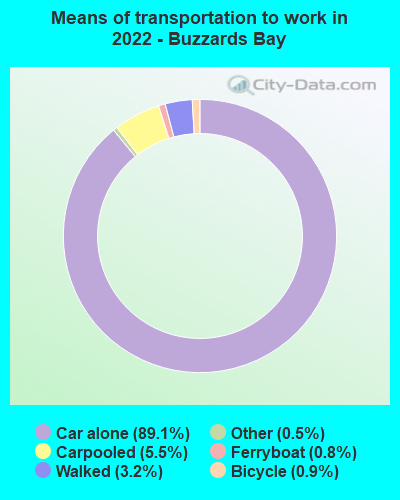
| Here: | 4.9% |
| Massachusetts: | 3.5% |
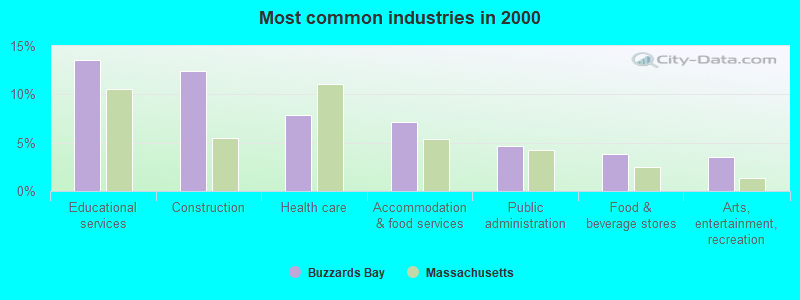
- Educational services (13.5%)
- Construction (12.4%)
- Health care (7.9%)
- Accommodation & food services (7.1%)
- Public administration (4.7%)
- Food & beverage stores (3.9%)
- Arts, entertainment, recreation (3.5%)

- Construction (19.3%)
- Educational services (12.6%)
- Accommodation & food services (6.7%)
- Repair & maintenance (6.4%)
- Food & beverage stores (6.3%)
- Health care (3.6%)
- Public administration (3.2%)
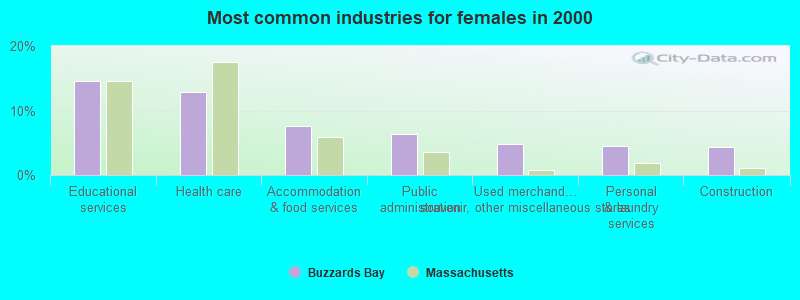
- Educational services (14.5%)
- Health care (12.9%)
- Accommodation & food services (7.6%)
- Public administration (6.4%)
- Used merchandise, gift, novelty, souvenir, other miscellaneous stores (4.8%)
- Personal & laundry services (4.5%)
- Construction (4.4%)
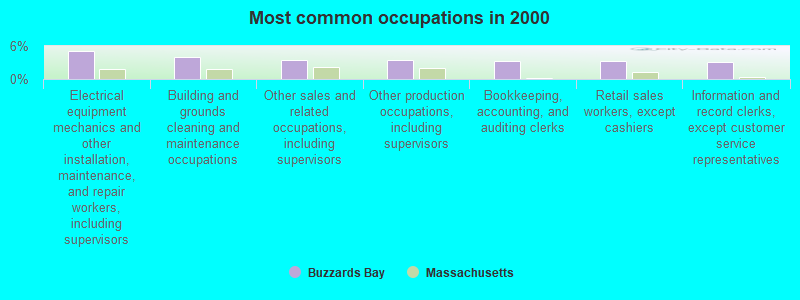
- Electrical equipment mechanics and other installation, maintenance, and repair workers, including supervisors (5.1%)
- Building and grounds cleaning and maintenance occupations (3.9%)
- Other sales and related occupations, including supervisors (3.5%)
- Other production occupations, including supervisors (3.5%)
- Bookkeeping, accounting, and auditing clerks (3.3%)
- Retail sales workers, except cashiers (3.2%)
- Information and record clerks, except customer service representatives (3.1%)
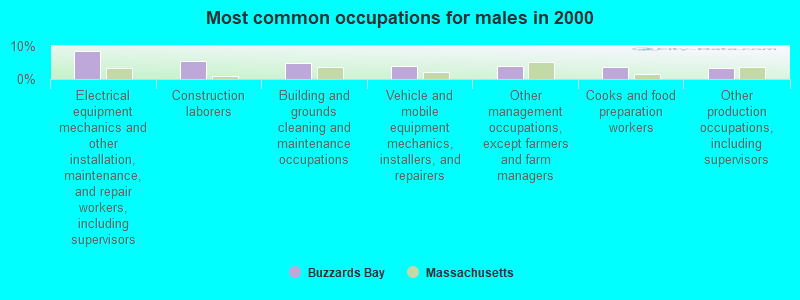
- Electrical equipment mechanics and other installation, maintenance, and repair workers, including supervisors (8.5%)
- Construction laborers (5.5%)
- Building and grounds cleaning and maintenance occupations (4.9%)
- Vehicle and mobile equipment mechanics, installers, and repairers (3.8%)
- Other management occupations, except farmers and farm managers (3.8%)
- Cooks and food preparation workers (3.7%)
- Other production occupations, including supervisors (3.4%)

- Bookkeeping, accounting, and auditing clerks (6.0%)
- Other office and administrative support workers, including supervisors (5.5%)
- Other sales and related occupations, including supervisors (5.2%)
- Preschool, kindergarten, elementary, and middle school teachers (4.8%)
- Information and record clerks, except customer service representatives (4.5%)
- Registered nurses (4.4%)
- Secretaries and administrative assistants (3.9%)
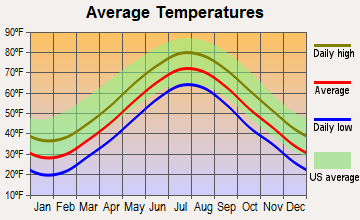
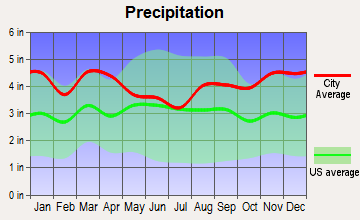
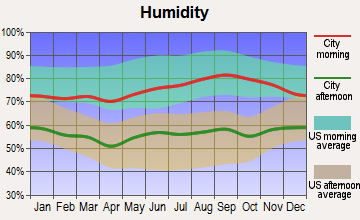
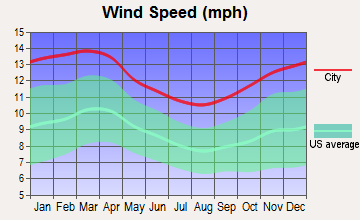
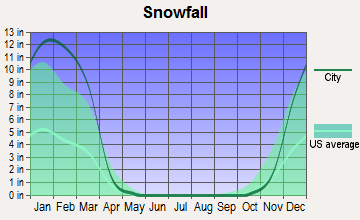
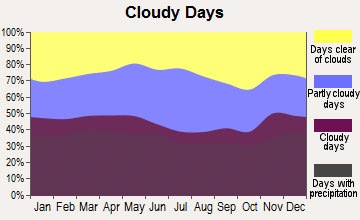
Average climate in Buzzards Bay, Massachusetts
Based on data reported by over 4,000 weather stations
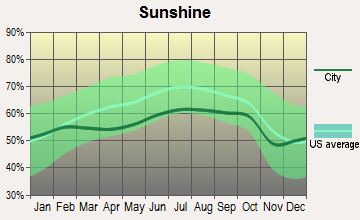
(lower is better)
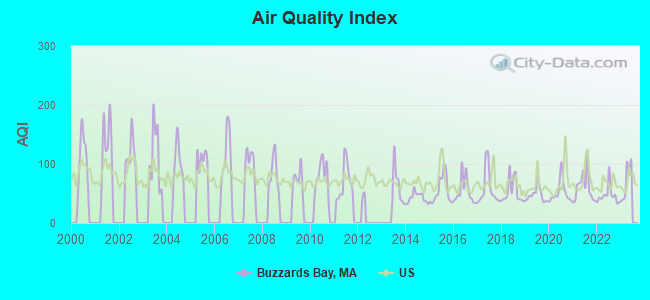
Air Quality Index (AQI) level in 2022 was 46.8. This is significantly better than average.
| City: | 46.8 |
| U.S.: | 72.6 |
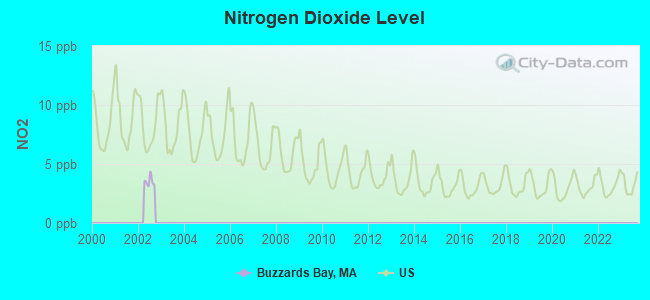
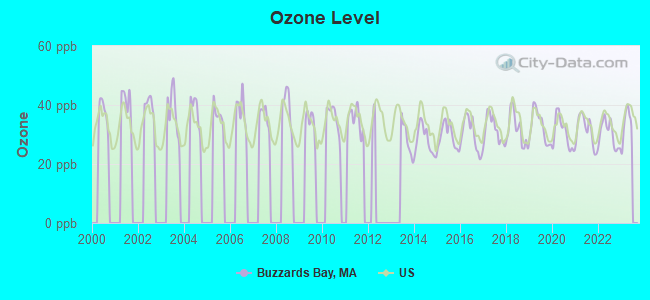
Ozone [ppb] level in 2022 was 30.2. This is about average. Closest monitor was 16.0 miles away from the city center.
| City: | 30.2 |
| U.S.: | 33.3 |
Tornado activity:
Buzzards Bay-area historical tornado activity is significantly below Massachusetts state average. It is 78% smaller than the overall U.S. average.
On 6/9/1953, a category F3 (max. wind speeds 158-206 mph) tornado 36.6 miles away from the Buzzards Bay place center injured 17 people and caused between $500,000 and $5,000,000 in damages.
On 8/28/1970, a category F2 (max. wind speeds 113-157 mph) tornado 18.1 miles away from the place center caused between $5000 and $50,000 in damages.
Earthquake activity:
Buzzards Bay-area historical earthquake activity is significantly above Massachusetts state average. It is 76% smaller than the overall U.S. average.On 10/7/1983 at 10:18:46, a magnitude 5.3 (5.1 MB, 5.3 LG, 5.1 ML, Class: Moderate, Intensity: VI - VII) earthquake occurred 242.7 miles away from Buzzards Bay center
On 4/20/2002 at 10:50:47, a magnitude 5.3 (5.3 ML, Depth: 3.0 mi) earthquake occurred 246.3 miles away from the city center
On 10/16/2012 at 23:12:25, a magnitude 4.7 (4.7 ML, Depth: 10.0 mi, Class: Light, Intensity: IV - V) earthquake occurred 127.7 miles away from the city center
On 1/19/1982 at 00:14:42, a magnitude 4.7 (4.5 MB, 4.7 MD, 4.5 LG) earthquake occurred 131.0 miles away from the city center
On 4/20/2002 at 10:50:47, a magnitude 5.2 (5.2 MB, 4.2 MS, 5.2 MW, 5.0 MW) earthquake occurred 245.7 miles away from Buzzards Bay center
On 8/22/1992 at 12:20:32, a magnitude 4.8 (4.8 MB, 3.8 MS, 4.7 LG, Depth: 6.2 mi) earthquake occurred 183.6 miles away from the city center
Magnitude types: regional Lg-wave magnitude (LG), body-wave magnitude (MB), duration magnitude (MD), local magnitude (ML), surface-wave magnitude (MS), moment magnitude (MW)
Natural disasters:
The number of natural disasters in Barnstable County (21) is greater than the US average (15).Major Disasters (Presidential) Declared: 11
Emergencies Declared: 8
Causes of natural disasters: Hurricanes: 7, Floods: 5, Storms: 4, Snows: 3, Snowstorms: 3, Winter Storms: 3, Blizzards: 2, Snowfall: 1, Tropical Storm: 1, Wind: 1, Other: 1 (Note: some incidents may be assigned to more than one category).
Hospitals and medical centers in Buzzards Bay:
Other hospitals and medical centers near Buzzards Bay:
- BOURNE MANOR EXTENDED CARE FACILITY (Nursing Home, about 2 miles away; BOURNE, MA)
- KINDRED TRANSITIONAL CARE AND REHABILITA-FORESTVIEW (Nursing Home, about 5 miles away; WAREHAM, MA)
- CAPE HERITAGE NURSING HOME (Nursing Home, about 6 miles away; SANDWICH, MA)
- CAPE HERITAGE, A RADIUS HEALTHCARE CENTER (Nursing Home, about 6 miles away; SANDWICH, MA)
- LIGHTHOUSE HOSPICE ASSOCIATION, INC (Hospital, about 6 miles away; WAREHAM, MA)
- TCU-TOBEY HOSPITAL (Nursing Home, about 6 miles away; WAREHAM, MA)
- HOSPICE SERVICES OF MASSACHUSETTS (Hospital, about 7 miles away; WAREHAM, MA)
Operable nuclear power plant near Buzzards Bay:
- 15 miles: Pilgrim in Plymouth, MA.
College/University in Buzzards Bay:
Colleges/universities with over 2000 students nearest to Buzzards Bay:
- Cape Cod Community College (about 15 miles; West Barnstable, MA; Full-time enrollment: 2,491)
- University of Massachusetts-Dartmouth (about 22 miles; North Dartmouth, MA; FT enrollment: 7,545)
- Bridgewater State University (about 25 miles; Bridgewater, MA; FT enrollment: 9,802)
- Bristol Community College (about 27 miles; Fall River, MA; FT enrollment: 5,707)
- Massasoit Community College (about 30 miles; Brockton, MA; FT enrollment: 5,442)
- Stonehill College (about 33 miles; Easton, MA; FT enrollment: 2,563)
- Roger Williams University (about 35 miles; Bristol, RI; FT enrollment: 4,375)
Public high school in Buzzards Bay:
- BOSTON ADULT ACADEMY (Students: 18, Location: 20 CHURCH ST, Grades: 11-12)
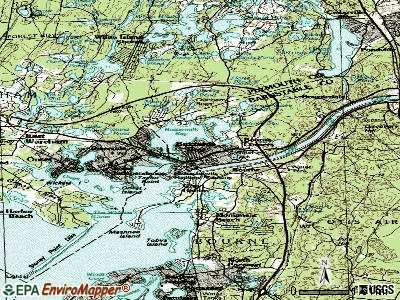
Points of interest:
Notable location: Bourne Fire Department Station 1 Headquarters (A). Display/hide its location on the map
Lakes, reservoirs, and swamps: Bourne Pond (A), Bennett Pond (B), Queen Sewell Pond (C), Nye Bog Reservoir (D), Nye Bog (E). Display/hide their locations on the map
Tourist attractions: Bourne Society for Historic Pretnbrggs McDrmtt HSE (Museums; 22 Sandwich Road), Aptucxet Trading Post Museum (24 Aptucxet Road), Bourne Historical Center & Archives (Museums; 30 Keene Street), Adventure Isle (343 Macarthur Boulevard).
Hotels: Bournedale Village Inn (854 Scenic Highway), Herring Run Motel (825 Scenic Highway), Bay Motor Inn (223 Main Street), Best Western Bridge Bourne (100 Trowbridge Road), Jasper's Too (101 Maple Street), Holly House by the Canal (20 Keene Street), Scenic View Motel (871 Scenic Hwy).
Drinking water stations with addresses in Buzzards Bay and their reported violations in the past:
BUZZARDS BAY WATER DISTRICT (Population served: 7,700, Groundwater):Past health violations:OTIS AIR NATIONAL GUARD BASE (Population served: 6,000, Groundwater):Past monitoring violations:
- MCL, Monthly (TCR) - In AUG-2013, Contaminant: Coliform. Follow-up actions: St AO (w/o penalty) issued (NOV-29-2013), St Compliance achieved (NOV-29-2013)
- MCL, Monthly (TCR) - In OCT-2012, Contaminant: Coliform. Follow-up actions: St AO (w/o penalty) issued (FEB-21-2013), St Compliance achieved (FEB-21-2013)
- MCL, Monthly (TCR) - In SEP-2011, Contaminant: Coliform. Follow-up actions: St AO (w/o penalty) issued (NOV-29-2011), St Compliance achieved (NOV-29-2011)
- MCL, Monthly (TCR) - In DEC-2010, Contaminant: Coliform. Follow-up actions: St AO (w/o penalty) issued (FEB-18-2011), St Compliance achieved (FEB-18-2011)
- MCL, Monthly (TCR) - In AUG-2010, Contaminant: Coliform. Follow-up actions: St Compliance achieved (NOV-15-2010), St AO (w/o penalty) issued (NOV-15-2010)
- MCL, Monthly (TCR) - In DEC-2009, Contaminant: Coliform. Follow-up actions: St AO (w/o penalty) issued (FEB-25-2010), St Compliance achieved (FEB-25-2010)
- Follow-up Or Routine LCR Tap M/R - In OCT-01-2007, Contaminant: Lead and Copper Rule. Follow-up actions: St AO (w/o penalty) issued (NOV-14-2007), St Compliance achieved (JAN-07-2008)
- One regular monitoring violation
Past health violations:
- MCL, Monthly (TCR) - In SEP-2013, Contaminant: Coliform. Follow-up actions: St AO (w/o penalty) issued (NOV-29-2013), St Compliance achieved (NOV-29-2013)
- MCL, Monthly (TCR) - In AUG-2007, Contaminant: Coliform. Follow-up actions: St AO (w/o penalty) issued (FEB-04-2008), St Compliance achieved (FEB-04-2008)
- MCL, Monthly (TCR) - In OCT-2005, Contaminant: Coliform. Follow-up actions: St AO (w/o penalty) issued (MAY-18-2006), St Compliance achieved (MAY-18-2006)
| This place: | 2.2 people |
| Massachusetts: | 2.5 people |
| This place: | 58.1% |
| Whole state: | 63.0% |
| This place: | 7.9% |
| Whole state: | 7.0% |
Likely homosexual households (counted as self-reported same-sex unmarried-partner households)
- Lesbian couples: 0.2% of all households
- Gay men: 0.2% of all households
People in group quarters in Buzzards Bay in 2010:
- 1,049 people in college/university student housing
- 97 people in nursing facilities/skilled-nursing facilities
- 2 people in other noninstitutional facilities
People in group quarters in Buzzards Bay in 2000:
- 670 people in college dormitories (includes college quarters off campus)
- 74 people in nursing homes
- 12 people in homes or halfway houses for drug/alcohol abuse
- 6 people in other noninstitutional group quarters
Banks with branches in Buzzards Bay (2011 data):
- Sovereign Bank, National Association: Buzzards Bay Branch at 50 Cohasset Avenue, branch established on 1964/02/01. Info updated 2012/01/31: Bank assets: $78,146.9 mil, Deposits: $48,042.9 mil, headquarters in Wilmington, DE, positive income, Commercial Lending Specialization, 718 total offices, Holding Company: Banco Santander, S.A.
- TD Bank, National Association: Buzzards Bay Branch at 121 Main Street, branch established on 1928/07/16. Info updated 2010/10/04: Bank assets: $188,912.6 mil, Deposits: $153,149.8 mil, headquarters in Wilmington, DE, positive income, 1314 total offices, Holding Company: Toronto-Dominion Bank, The
For population 15 years and over in Buzzards Bay:
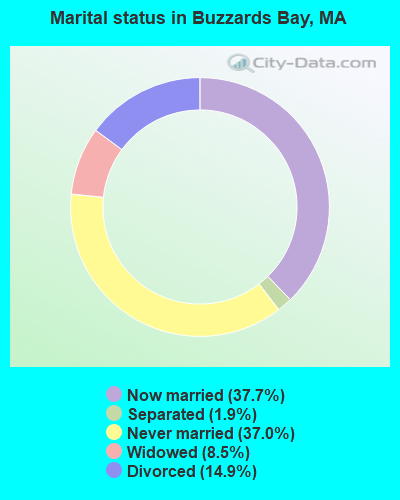
- Never married: 37.0%
- Now married: 37.7%
- Separated: 1.9%
- Widowed: 8.5%
- Divorced: 14.9%
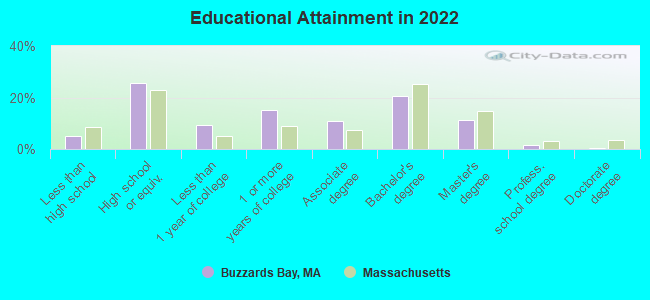
For population 25 years and over in Buzzards Bay:
- High school or higher: 95.3%
- Bachelor's degree or higher: 30.3%
- Graduate or professional degree: 11.6%
- Unemployed: 18.1%
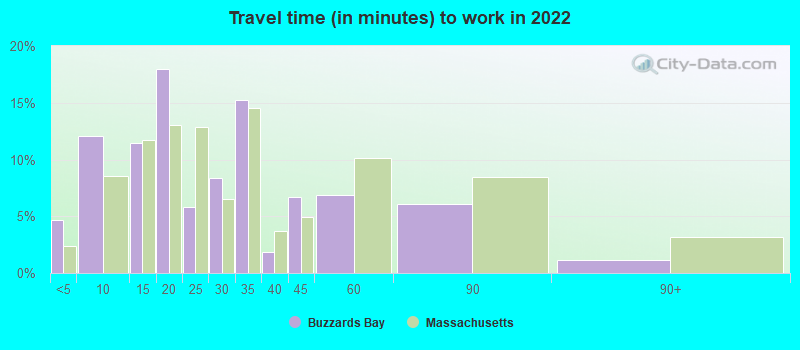
- Mean travel time to work (commute): 28.1 minutes
| Here: | 10.2 |
| Massachusetts average: | 13.0 |
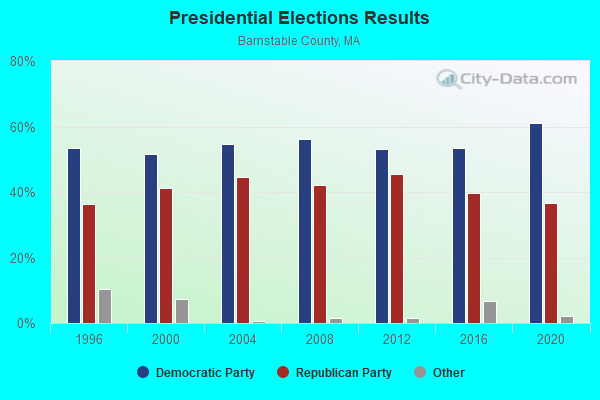
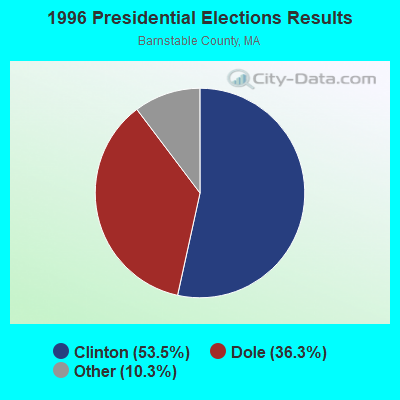
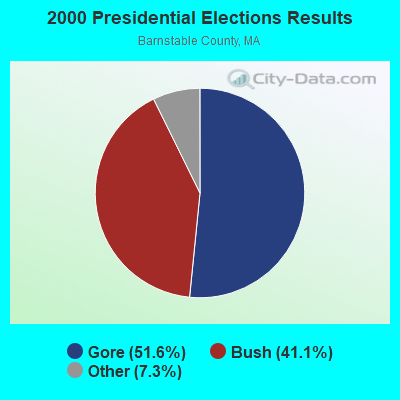

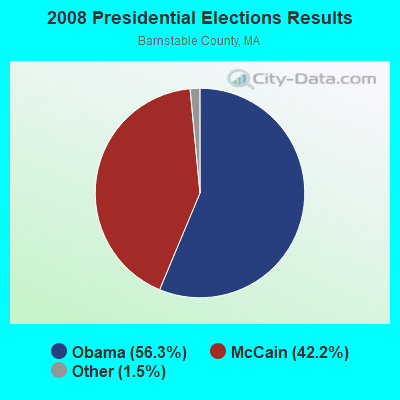

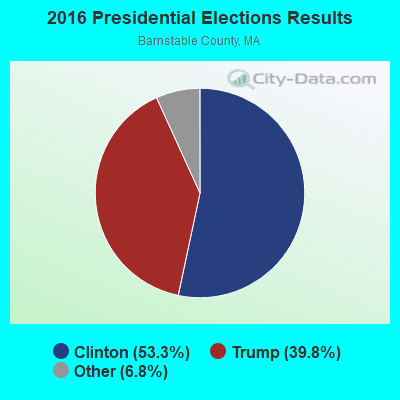
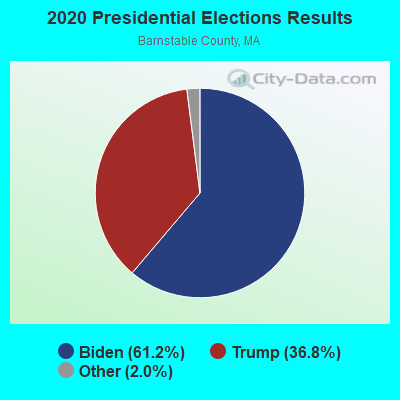
Graphs represent county-level data. Detailed 2008 Election Results
Religion statistics for Buzzards Bay, MA (based on Barnstable County data)
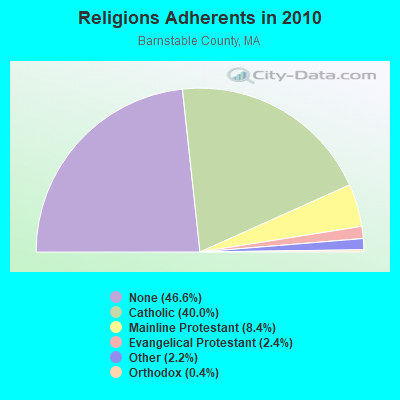
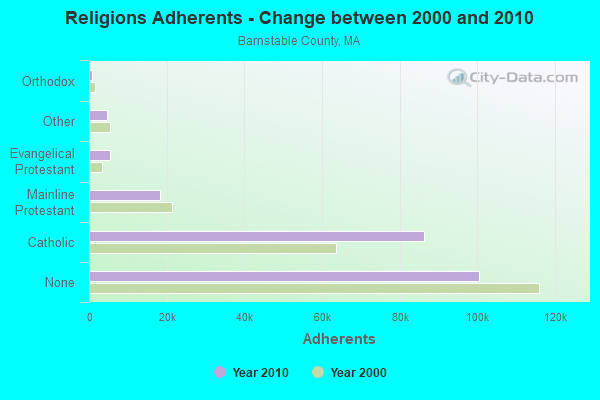
| Religion | Adherents | Congregations |
|---|---|---|
| Catholic | 86,370 | 18 |
| Mainline Protestant | 18,165 | 68 |
| Evangelical Protestant | 5,281 | 46 |
| Other | 4,734 | 32 |
| Orthodox | 810 | 3 |
| None | 100,528 | - |
Food Environment Statistics:
| Barnstable County: | 3.06 / 10,000 pop. |
| State: | 1.98 / 10,000 pop. |
| This county: | 0.05 / 10,000 pop. |
| State: | 0.05 / 10,000 pop. |
| This county: | 3.38 / 10,000 pop. |
| Massachusetts: | 2.22 / 10,000 pop. |
| This county: | 2.57 / 10,000 pop. |
| Massachusetts: | 1.77 / 10,000 pop. |
| Barnstable County: | 18.60 / 10,000 pop. |
| State: | 8.76 / 10,000 pop. |
| Here: | 7.9% |
| Massachusetts: | 8.1% |
| Barnstable County: | 19.6% |
| Massachusetts: | 22.5% |
| Barnstable County: | 13.8% |
| Massachusetts: | 16.5% |
Health and Nutrition:
| This city: | 62.4% |
| Massachusetts: | 50.5% |
| This city: | 67.4% |
| Massachusetts: | 48.0% |
| This city: | 26.7 |
| State: | 28.4 |
| This city: | 14.8% |
| Massachusetts: | 20.7% |
| Here: | 4.8% |
| State: | 10.4% |
| Here: | 7.1 |
| Massachusetts: | 6.8 |
| Here: | 29.7% |
| Massachusetts: | 33.4% |
| Buzzards Bay: | 70.3% |
| Massachusetts: | 57.1% |
| Buzzards Bay: | 83.2% |
| Massachusetts: | 79.2% |
More about Health and Nutrition of Buzzards Bay, MA Residents
| Businesses in Buzzards Bay, MA | ||||
| Name | Count | Name | Count | |
|---|---|---|---|---|
| Dunkin Donuts | 3 | McDonald's | 1 | |
| FedEx | 1 | UPS | 3 | |
| H&R Block | 1 | |||
Strongest AM radio stations in Buzzards Bay:
- WBZ (1030 AM; 50 kW; BOSTON, MA; Owner: INFINITY BROADCASTING OPERATIONS, INC.)
- WEEI (850 AM; 50 kW; BOSTON, MA; Owner: ENTERCOM BOSTON LICENSE, LLC)
- WRKO (680 AM; 50 kW; BOSTON, MA; Owner: ENTERCOM BOSTON LICENSE, LLC)
- WALE (990 AM; 50 kW; GREENVILLE, RI; Owner: NORTH AMERICAN BROADCASTING CO., INC.)
- WPLM (1390 AM; 5 kW; PLYMOUTH, MA; Owner: PLYMOUTH ROCK BROADCASTING CO., INC.)
- WKOX (1200 AM; 50 kW; FRAMINGHAM, MA; Owner: CAPSTAR TX LIMITED PARTNERSHIP)
- WBSM (1420 AM; 5 kW; NEW BEDFORD, MA; Owner: CITADEL BROADCASTING COMPANY)
- WBIX (1060 AM; 40 kW; NATICK, MA; Owner: LANGER BROADCASTING CORPORATION)
- WWZN (1510 AM; 50 kW; BOSTON, MA; Owner: ROSE CITY RADIO CORPORATION)
- WCRN (830 AM; 50 kW; WORCESTER, MA; Owner: CARTER BROADCASTING CORPORATION)
- WAMG (890 AM; 25 kW; DEDHAM, MA; Owner: MEGA COMMUNICATIONS OF DEDHAM LICENSEE, LLC)
- WRCA (1330 AM; 25 kW; WALTHAM, MA; Owner: WRCA LICENSE, LLC)
- WNNZ (640 AM; 50 kW; WESTFIELD, MA; Owner: CLEAR CHANNEL BROADCASTING LICENSES, INC.)
Strongest FM radio stations in Buzzards Bay:
- WCIB (101.9 FM; FALMOUTH, MA; Owner: QANTUM OF CAPE COD LICENSE COMPANY, LLC)
- WTWV (101.1 FM; MASHPEE, MA; Owner: BOCH BROADCASTING, L.P.)
- WPXC (102.9 FM; HYANNIS, MA; Owner: QANTUM OF CAPE COD LICENSE COMPANY, LLC)
- WJFD-FM (97.3 FM; NEW BEDFORD, MA; Owner: EDMUND DINIS, TRUSTEE)
- WFPB-FM (91.9 FM; FALMOUTH, MA; Owner: UNIVERSITY OF MASSACHUSETTS)
- WPLM-FM (99.1 FM; PLYMOUTH, MA; Owner: PLYMOUTH ROCK BROADCASTING CO., INC.)
- WQRC (99.9 FM; BARNSTABLE, MA; Owner: SANDAB COMMUNICATION LTD. PNR/SHP II)
- WCTK (98.1 FM; NEW BEDFORD, MA; Owner: HALL COMMUNICATIONS, INC.)
- WSDH (91.5 FM; SANDWICH, MA; Owner: SANDWICH MASS. PUBLIC SCHOOLS)
- WWBB (101.5 FM; PROVIDENCE, RI; Owner: CLEAR CHANNEL BROADCASTING LICENSES, INC.)
- WFHN (107.1 FM; FAIRHAVEN, MA; Owner: CITADEL BROADCASTING COMPANY)
- WXKS-FM (107.9 FM; MEDFORD, MA; Owner: AMFM RADIO LICENSES, L.L.C.)
- WXTK (95.1 FM; WEST YARMOUTH, MA; Owner: BOCH BROADCASTING LTD. PARTNERSHIP)
- WMJX (106.7 FM; BOSTON, MA; Owner: GREATER BOSTON RADIO, INC.)
- WCOD-FM (106.1 FM; HYANNIS, MA; Owner: BOCH BROADCASTING, L.P.)
- WATD-FM (95.9 FM; MARSHFIELD, MA; Owner: MARSHFIELD BROADCASTING CO., INC.)
- WMVY (92.7 FM; TISBURY, MA; Owner: ARITAUR COMMUNICATIONS, INC.)
- WBOT (97.7 FM; BROCKTON, MA; Owner: RADIO ONE LICENSES, LLC)
- WSMU-FM (91.1 FM; NORTH DARTMOUTH, MA; Owner: UNIVERSITY OF MASSACHUSETTS)
- WOCN-FM (103.9 FM; SOUTH YARMOUTH, MA; Owner: SANDAB COMMUNICATIONS LTD. PARTNERSHIP II)
TV broadcast stations around Buzzards Bay:
- WLWC (Channel 28; NEW BEDFORD, MA; Owner: C-28 FCC LICENSEE SUBSIDIARY, LLC)
- WDPX (Channel 58; VINEYARD HAVEN, MA; Owner: PAXSON BOSTON-68 LICENSE, INC.)
- WWDP (Channel 46; NORWELL, MA; Owner: NORWELL TELEVISION, LLC)
- WMPX-LP (Channel 67; DENNIS, MA; Owner: PAXSON BOSTON-68 LICENSE, INC.)
- WLNE-TV (Channel 6; NEW BEDFORD, MA; Owner: FREEDOM BROADCASTING OF SOUTHERN NEW ENGLAND, INC.)
- WCVB-TV (Channel 5; BOSTON, MA; Owner: WCVB HEARST-ARGYLE TV, INC.)
- WPRI-TV (Channel 12; PROVIDENCE, RI; Owner: TVL BROADCASTING OF RHODE ISLAND, LLC)
- WNAC-TV (Channel 64; PROVIDENCE, RI; Owner: WNAC, LLC)
- WJAR (Channel 10; PROVIDENCE, RI; Owner: OUTLET BROADCASTING, INC.)
- WMFP (Channel 62; LAWRENCE, MA; Owner: WSAH LICENSE, INC.)
- WSBK-TV (Channel 38; BOSTON, MA; Owner: VIACOM INC.)
- WLVI-TV (Channel 56; CAMBRIDGE, MA; Owner: WLVI, INC.)
- WBZ-TV (Channel 4; BOSTON, MA; Owner: VIACOM INC.)
- WGBX-TV (Channel 44; BOSTON, MA; Owner: WGBH EDUCATIONAL FOUNDATION)
- WSBE-TV (Channel 36; PROVIDENCE, RI; Owner: RHODE ISLAND PUBLIC TELECOM. AUTHORITY)
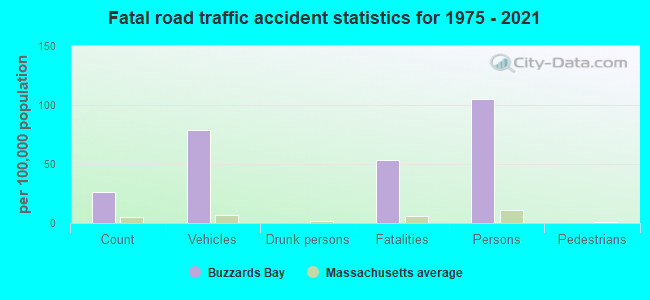
Buzzards Bay fatal accident list:
- National Bridge Inventory (NBI) Statistics
- 6Number of bridges
- 118ft / 35.9mTotal length
- $13,637,000Total costs
- 131,557Total average daily traffic
- 5,432Total average daily truck traffic
- 217,786Total future (year 2032) average daily traffic
FCC Registered Broadcast Land Mobile Towers:
3- 15 Wallace Ave (Lat: 41.751500 Lon: -70.615306), Call Sign: KSM898, Licensee ID: L00033835,
Assigned Frequencies: 46.5200 MHz, Grant Date: 11/13/2002, Expiration Date: 12/11/2012, Cancellation Date: 02/16/2013, Registrant: Buzzards Bay Water District, 15 Wallace Ave, Buzzards Bay, MA 02532
- 101 Academy Drive (Lat: 41.738778 Lon: -70.625111), Call Sign: WQFL534,
Assigned Frequencies: 451.612 MHz, 451.737 MHz, 451.762 MHz, 452.087 MHz, Grant Date: 08/10/2006, Expiration Date: 08/10/2016, Cancellation Date: 10/15/2016, Certifier: Malcom Mac Gregor, Registrant: National License Corp., 9050 Briarclift Rd., Indianapolis, IN 46256, Phone: (317) 849-5866, Fax: (317) 841-3328, Email:
- INFLUENT P.S., Influent Pumping Station Off U.S.6 Main Street (Lat: 41.749722 Lon: -70.604444), Type: Pipe, Structure height: 2 m, Overall height: 4 m, Call Sign: WRJX534,
Assigned Frequencies: 219.350 MHz, Grant Date: 11/14/2020, Expiration Date: 11/14/2030, Certifier: Matthew Quinn, Registrant: Tcs Communications Corp, Salisbury, MA 01952, Phone: (978) 465-7932, Fax: (978) 462-8980, Email:
FCC Registered Microwave Towers:
1- 65 Bourndale, 65 Bourndale Road (Lat: 41.773861 Lon: -70.570306), Type: Ltower, Structure height: 54.9 m, Call Sign: WQXP864, Licensee ID: L00034332,
Assigned Frequencies: 17765.0 MHz, Grant Date: 05/04/2016, Expiration Date: 05/04/2026, Certifier: Ryan Ruggiero, Registrant: Town Of Plymouth, 20 Long Pond Road, Plymouth, MA 02360, Phone: (508) 830-4213, Email:
FCC Registered Maritime Coast & Aviation Ground Towers:
2- Academy Dr (Lat: 41.740667 Lon: -70.594194), Type: Building, Overall height: 18 m, Call Sign: KIL883,
Assigned Frequencies: 2.09790 MHz, 156.500 MHz, 2.18340 MHz, 156.800 MHz, 4.12640 MHz, 6.22540 MHz, 8.29540 MHz, 156.450 MHz, Grant Date: 07/14/1993, Expiration Date: 06/24/1998, Cancellation Date: 05/06/2001, Registrant: Massachusetts Maritime Academy, Buzzards Bay, MA 02532-1803
- 3239 Cranberry Hwy (Lat: 41.747333 Lon: -70.624472), Type: Building, Overall height: 7 m, Call Sign: WHW282,
Assigned Frequencies: 156.450 MHz, 156.500 MHz, 156.800 MHz, Grant Date: 01/25/1994, Expiration Date: 01/25/1999, Cancellation Date: 05/06/2001, Registrant: Aquarius Diving Center Inc, 3239 Cranberry Hwy, Buzzards Bay, MA 02532
FCC Registered Amateur Radio Licenses:
47 (See the full list of FCC Registered Amateur Radio Licenses in Buzzards Bay)FAA Registered Aircraft:
2- Aircraft: ROCKWELL INTERNATIONAL 112A (Category: Land, Seats: 4, Weight: Up to 12,499 Pounds, Speed: 128 mph), Engine: LYCOMING I0360 SER A&C (200 HP) (Reciprocating)
N-Number: 1239J, N1239J, N-1239J, Serial Number: 239, Year manufactured: 1975, Airworthiness Date: 01/23/1981, Certificate Issue Date: 05/18/2006
Registrant (Co-Owned): Radu P Rotaru, 50 Cahoon Rd, Buzzards Bay, MA 02532, Other Owners: Gabriela A Rotaru - Aircraft: ROGERS DAVID D RV-8 (Category: Land, Seats: 2, Weight: Up to 12,499 Pounds), Engine: SUPERIOR IO-360 SER (180 HP) (Reciprocating)
N-Number: 173DR, N173DR, N-173DR, Serial Number: 81890, Year manufactured: 2010, Airworthiness Date: 09/25/2010, Certificate Issue Date: 02/13/2014
Registrant (Individual): David D Rogers, 121 Onset Ave, Buzzards Bay, MA 02532
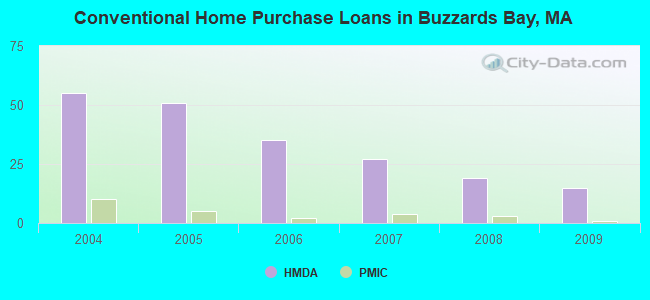
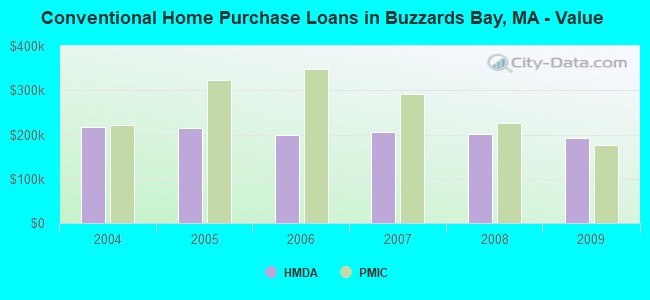
| Home Mortgage Disclosure Act Aggregated Statistics For Year 2009 (Based on 1 partial tract) | ||||||||||
| A) FHA, FSA/RHS & VA Home Purchase Loans | B) Conventional Home Purchase Loans | C) Refinancings | D) Home Improvement Loans | F) Non-occupant Loans on < 5 Family Dwellings (A B C & D) | ||||||
|---|---|---|---|---|---|---|---|---|---|---|
| Number | Average Value | Number | Average Value | Number | Average Value | Number | Average Value | Number | Average Value | |
| LOANS ORIGINATED | 7 | $262,529 | 15 | $192,103 | 61 | $234,833 | 3 | $134,400 | 13 | $218,314 |
| APPLICATIONS APPROVED, NOT ACCEPTED | 0 | $0 | 1 | $176,960 | 3 | $155,457 | 1 | $187,710 | 1 | $190,400 |
| APPLICATIONS DENIED | 1 | $264,770 | 1 | $123,200 | 19 | $216,667 | 2 | $48,610 | 4 | $147,280 |
| APPLICATIONS WITHDRAWN | 1 | $259,840 | 1 | $327,040 | 13 | $187,885 | 0 | $0 | 2 | $215,490 |
| FILES CLOSED FOR INCOMPLETENESS | 0 | $0 | 0 | $0 | 2 | $174,495 | 0 | $0 | 0 | $0 |
Detailed HMDA statistics for the following Tracts: 0137.00
| Private Mortgage Insurance Companies Aggregated Statistics For Year 2009 (Based on 1 partial tract) | ||||||
| A) Conventional Home Purchase Loans | B) Refinancings | C) Non-occupant Loans on < 5 Family Dwellings (A & B) | ||||
|---|---|---|---|---|---|---|
| Number | Average Value | Number | Average Value | Number | Average Value | |
| LOANS ORIGINATED | 1 | $176,060 | 1 | $297,920 | 1 | $176,060 |
| APPLICATIONS APPROVED, NOT ACCEPTED | 0 | $0 | 0 | $0 | 0 | $0 |
| APPLICATIONS DENIED | 0 | $0 | 0 | $0 | 0 | $0 |
| APPLICATIONS WITHDRAWN | 0 | $0 | 0 | $0 | 0 | $0 |
| FILES CLOSED FOR INCOMPLETENESS | 0 | $0 | 0 | $0 | 0 | $0 |
Detailed PMIC statistics for the following Tracts: 0137.00
2002 - 2018 National Fire Incident Reporting System (NFIRS) incidents
- Fire incident types reported to NFIRS in Buzzards Bay, MA
- 14938.8%Outside Fires
- 12332.0%Structure Fires
- 8722.7%Mobile Property/Vehicle Fires
- 256.5%Other
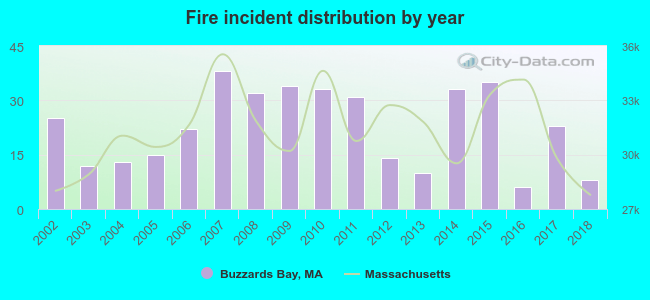 Based on the data from the years 2002 - 2018 the average number of fire incidents per year is 23. The highest number of reported fire incidents - 38 took place in 2007, and the least - 6 in 2016. The data has a declining trend.
 When looking into fire subcategories, the most incidents belonged to: Outside Fires (38.8%), and Structure Fires (32.0%).
| Most common first names in Buzzards Bay, MA among deceased individuals | ||
| Name | Count | Lived (average) |
|---|---|---|
| Mary | 124 | 81.5 years |
| John | 122 | 73.8 years |
| William | 91 | 75.2 years |
| Robert | 79 | 69.5 years |
| James | 67 | 73.6 years |
| Charles | 67 | 73.6 years |
| Helen | 59 | 81.3 years |
| George | 57 | 77.0 years |
| Joseph | 53 | 77.2 years |
| Dorothy | 52 | 76.8 years |
| Most common last names in Buzzards Bay, MA among deceased individuals | ||
| Last name | Count | Lived (average) |
|---|---|---|
| Smith | 34 | 69.4 years |
| Johnson | 21 | 83.2 years |
| Baker | 20 | 81.3 years |
| White | 19 | 79.7 years |
| Murphy | 15 | 75.1 years |
| Bassett | 13 | 77.6 years |
| Harris | 13 | 74.6 years |
| Perry | 13 | 77.2 years |
| Young | 13 | 84.8 years |
| Robbins | 12 | 75.8 years |
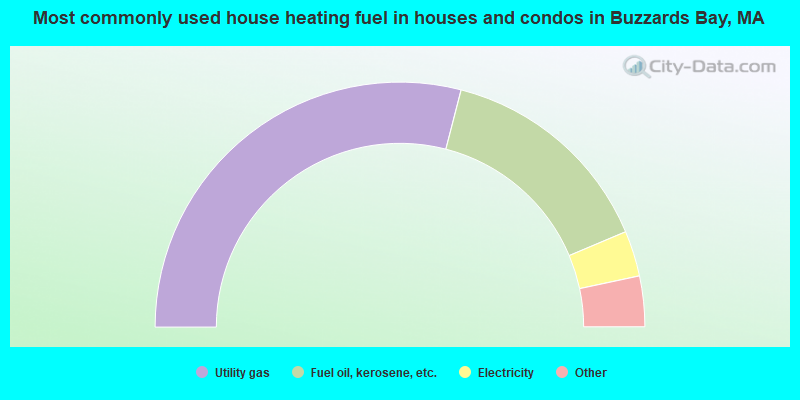
- 58.1%Utility gas
- 29.3%Fuel oil, kerosene, etc.
- 6.0%Electricity
- 3.5%Bottled, tank, or LP gas
- 2.1%Coal or coke
- 1.0%Other fuel
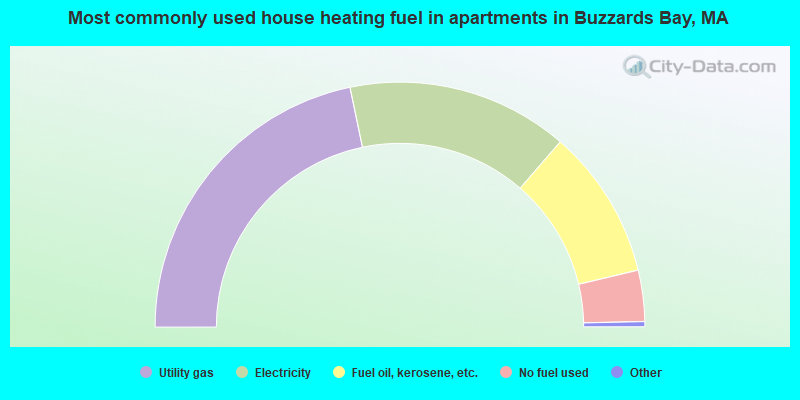
- 43.8%Utility gas
- 29.5%Electricity
- 20.0%Fuel oil, kerosene, etc.
- 6.8%No fuel used
Buzzards Bay compared to Massachusetts state average:
- Black race population percentage significantly below state average.
- Hispanic race population percentage significantly below state average.
- Median age significantly below state average.
- Foreign-born population percentage significantly below state average.
- Institutionalized population percentage above state average.

|
|
Total of 8 patent applications in 2008-2024.