Caldwell, Idaho Submit your own pictures of this city and show them to the world
OSM Map
General Map
Google Map
MSN Map
OSM Map
General Map
Google Map
MSN Map
OSM Map
General Map
Google Map
MSN Map
OSM Map
General Map
Google Map
MSN Map
Please wait while loading the map...
Population in 2022: 65,920 (100% urban, 0% rural). Population change since 2000: +153.9%Males: 32,454 Females: 33,466
March 2022 cost of living index in Caldwell: 93.8 (less than average, U.S. average is 100) Percentage of residents living in poverty in 2022: 16.4%for White Non-Hispanic residents , 27.3% for Black residents , 23.9% for Hispanic or Latino residents , 17.7% for American Indian residents , 15.4% for other race residents , 18.3% for two or more races residents )
Profiles of local businesses
Business Search - 14 Million verified businesses
Data:
Median household income ($)
Median household income (% change since 2000)
Household income diversity
Ratio of average income to average house value (%)
Ratio of average income to average rent
Median household income ($) - White
Median household income ($) - Black or African American
Median household income ($) - Asian
Median household income ($) - Hispanic or Latino
Median household income ($) - American Indian and Alaska Native
Median household income ($) - Multirace
Median household income ($) - Other Race
Median household income for houses/condos with a mortgage ($)
Median household income for apartments without a mortgage ($)
Races - White alone (%)
Races - White alone (% change since 2000)
Races - Black alone (%)
Races - Black alone (% change since 2000)
Races - American Indian alone (%)
Races - American Indian alone (% change since 2000)
Races - Asian alone (%)
Races - Asian alone (% change since 2000)
Races - Hispanic (%)
Races - Hispanic (% change since 2000)
Races - Native Hawaiian and Other Pacific Islander alone (%)
Races - Native Hawaiian and Other Pacific Islander alone (% change since 2000)
Races - Two or more races (%)
Races - Two or more races (% change since 2000)
Races - Other race alone (%)
Races - Other race alone (% change since 2000)
Racial diversity
Unemployment (%)
Unemployment (% change since 2000)
Unemployment (%) - White
Unemployment (%) - Black or African American
Unemployment (%) - Asian
Unemployment (%) - Hispanic or Latino
Unemployment (%) - American Indian and Alaska Native
Unemployment (%) - Multirace
Unemployment (%) - Other Race
Population density (people per square mile)
Population - Males (%)
Population - Females (%)
Population - Males (%) - White
Population - Males (%) - Black or African American
Population - Males (%) - Asian
Population - Males (%) - Hispanic or Latino
Population - Males (%) - American Indian and Alaska Native
Population - Males (%) - Multirace
Population - Males (%) - Other Race
Population - Females (%) - White
Population - Females (%) - Black or African American
Population - Females (%) - Asian
Population - Females (%) - Hispanic or Latino
Population - Females (%) - American Indian and Alaska Native
Population - Females (%) - Multirace
Population - Females (%) - Other Race
Coronavirus confirmed cases (Apr 24, 2024)
Deaths caused by coronavirus (Apr 24, 2024)
Coronavirus confirmed cases (per 100k population) (Apr 24, 2024)
Deaths caused by coronavirus (per 100k population) (Apr 24, 2024)
Daily increase in number of cases (Apr 24, 2024)
Weekly increase in number of cases (Apr 24, 2024)
Cases doubled (in days) (Apr 24, 2024)
Hospitalized patients (Apr 18, 2022)
Negative test results (Apr 18, 2022)
Total test results (Apr 18, 2022)
COVID Vaccine doses distributed (per 100k population) (Sep 19, 2023)
COVID Vaccine doses administered (per 100k population) (Sep 19, 2023)
COVID Vaccine doses distributed (Sep 19, 2023)
COVID Vaccine doses administered (Sep 19, 2023)
Likely homosexual households (%)
Likely homosexual households (% change since 2000)
Likely homosexual households - Lesbian couples (%)
Likely homosexual households - Lesbian couples (% change since 2000)
Likely homosexual households - Gay men (%)
Likely homosexual households - Gay men (% change since 2000)
Cost of living index
Median gross rent ($)
Median contract rent ($)
Median monthly housing costs ($)
Median house or condo value ($)
Median house or condo value ($ change since 2000)
Mean house or condo value by units in structure - 1, detached ($)
Mean house or condo value by units in structure - 1, attached ($)
Mean house or condo value by units in structure - 2 ($)
Mean house or condo value by units in structure by units in structure - 3 or 4 ($)
Mean house or condo value by units in structure - 5 or more ($)
Mean house or condo value by units in structure - Boat, RV, van, etc. ($)
Mean house or condo value by units in structure - Mobile home ($)
Median house or condo value ($) - White
Median house or condo value ($) - Black or African American
Median house or condo value ($) - Asian
Median house or condo value ($) - Hispanic or Latino
Median house or condo value ($) - American Indian and Alaska Native
Median house or condo value ($) - Multirace
Median house or condo value ($) - Other Race
Median resident age
Resident age diversity
Median resident age - Males
Median resident age - Females
Median resident age - White
Median resident age - Black or African American
Median resident age - Asian
Median resident age - Hispanic or Latino
Median resident age - American Indian and Alaska Native
Median resident age - Multirace
Median resident age - Other Race
Median resident age - Males - White
Median resident age - Males - Black or African American
Median resident age - Males - Asian
Median resident age - Males - Hispanic or Latino
Median resident age - Males - American Indian and Alaska Native
Median resident age - Males - Multirace
Median resident age - Males - Other Race
Median resident age - Females - White
Median resident age - Females - Black or African American
Median resident age - Females - Asian
Median resident age - Females - Hispanic or Latino
Median resident age - Females - American Indian and Alaska Native
Median resident age - Females - Multirace
Median resident age - Females - Other Race
Commute - mean travel time to work (minutes)
Travel time to work - Less than 5 minutes (%)
Travel time to work - Less than 5 minutes (% change since 2000)
Travel time to work - 5 to 9 minutes (%)
Travel time to work - 5 to 9 minutes (% change since 2000)
Travel time to work - 10 to 19 minutes (%)
Travel time to work - 10 to 19 minutes (% change since 2000)
Travel time to work - 20 to 29 minutes (%)
Travel time to work - 20 to 29 minutes (% change since 2000)
Travel time to work - 30 to 39 minutes (%)
Travel time to work - 30 to 39 minutes (% change since 2000)
Travel time to work - 40 to 59 minutes (%)
Travel time to work - 40 to 59 minutes (% change since 2000)
Travel time to work - 60 to 89 minutes (%)
Travel time to work - 60 to 89 minutes (% change since 2000)
Travel time to work - 90 or more minutes (%)
Travel time to work - 90 or more minutes (% change since 2000)
Marital status - Never married (%)
Marital status - Now married (%)
Marital status - Separated (%)
Marital status - Widowed (%)
Marital status - Divorced (%)
Median family income ($)
Median family income (% change since 2000)
Median non-family income ($)
Median non-family income (% change since 2000)
Median per capita income ($)
Median per capita income (% change since 2000)
Median family income ($) - White
Median family income ($) - Black or African American
Median family income ($) - Asian
Median family income ($) - Hispanic or Latino
Median family income ($) - American Indian and Alaska Native
Median family income ($) - Multirace
Median family income ($) - Other Race
Median year house/condo built
Median year apartment built
Year house built - Built 2005 or later (%)
Year house built - Built 2000 to 2004 (%)
Year house built - Built 1990 to 1999 (%)
Year house built - Built 1980 to 1989 (%)
Year house built - Built 1970 to 1979 (%)
Year house built - Built 1960 to 1969 (%)
Year house built - Built 1950 to 1959 (%)
Year house built - Built 1940 to 1949 (%)
Year house built - Built 1939 or earlier (%)
Average household size
Household density (households per square mile)
Average household size - White
Average household size - Black or African American
Average household size - Asian
Average household size - Hispanic or Latino
Average household size - American Indian and Alaska Native
Average household size - Multirace
Average household size - Other Race
Occupied housing units (%)
Vacant housing units (%)
Owner occupied housing units (%)
Renter occupied housing units (%)
Vacancy status - For rent (%)
Vacancy status - For sale only (%)
Vacancy status - Rented or sold, not occupied (%)
Vacancy status - For seasonal, recreational, or occasional use (%)
Vacancy status - For migrant workers (%)
Vacancy status - Other vacant (%)
Residents with income below the poverty level (%)
Residents with income below 50% of the poverty level (%)
Children below poverty level (%)
Poor families by family type - Married-couple family (%)
Poor families by family type - Male, no wife present (%)
Poor families by family type - Female, no husband present (%)
Poverty status for native-born residents (%)
Poverty status for foreign-born residents (%)
Poverty among high school graduates not in families (%)
Poverty among people who did not graduate high school not in families (%)
Residents with income below the poverty level (%) - White
Residents with income below the poverty level (%) - Black or African American
Residents with income below the poverty level (%) - Asian
Residents with income below the poverty level (%) - Hispanic or Latino
Residents with income below the poverty level (%) - American Indian and Alaska Native
Residents with income below the poverty level (%) - Multirace
Residents with income below the poverty level (%) - Other Race
Air pollution - Air Quality Index (AQI)
Air pollution - CO
Air pollution - NO2
Air pollution - SO2
Air pollution - Ozone
Air pollution - PM10
Air pollution - PM25
Air pollution - Pb
Crime - Murders per 100,000 population
Crime - Rapes per 100,000 population
Crime - Robberies per 100,000 population
Crime - Assaults per 100,000 population
Crime - Burglaries per 100,000 population
Crime - Thefts per 100,000 population
Crime - Auto thefts per 100,000 population
Crime - Arson per 100,000 population
Crime - City-data.com crime index
Crime - Violent crime index
Crime - Property crime index
Crime - Murders per 100,000 population (5 year average)
Crime - Rapes per 100,000 population (5 year average)
Crime - Robberies per 100,000 population (5 year average)
Crime - Assaults per 100,000 population (5 year average)
Crime - Burglaries per 100,000 population (5 year average)
Crime - Thefts per 100,000 population (5 year average)
Crime - Auto thefts per 100,000 population (5 year average)
Crime - Arson per 100,000 population (5 year average)
Crime - City-data.com crime index (5 year average)
Crime - Violent crime index (5 year average)
Crime - Property crime index (5 year average)
1996 Presidential Elections Results (%) - Democratic Party (Clinton)
1996 Presidential Elections Results (%) - Republican Party (Dole)
1996 Presidential Elections Results (%) - Other
2000 Presidential Elections Results (%) - Democratic Party (Gore)
2000 Presidential Elections Results (%) - Republican Party (Bush)
2000 Presidential Elections Results (%) - Other
2004 Presidential Elections Results (%) - Democratic Party (Kerry)
2004 Presidential Elections Results (%) - Republican Party (Bush)
2004 Presidential Elections Results (%) - Other
2008 Presidential Elections Results (%) - Democratic Party (Obama)
2008 Presidential Elections Results (%) - Republican Party (McCain)
2008 Presidential Elections Results (%) - Other
2012 Presidential Elections Results (%) - Democratic Party (Obama)
2012 Presidential Elections Results (%) - Republican Party (Romney)
2012 Presidential Elections Results (%) - Other
2016 Presidential Elections Results (%) - Democratic Party (Clinton)
2016 Presidential Elections Results (%) - Republican Party (Trump)
2016 Presidential Elections Results (%) - Other
2020 Presidential Elections Results (%) - Democratic Party (Biden)
2020 Presidential Elections Results (%) - Republican Party (Trump)
2020 Presidential Elections Results (%) - Other
Ancestries Reported - Arab (%)
Ancestries Reported - Czech (%)
Ancestries Reported - Danish (%)
Ancestries Reported - Dutch (%)
Ancestries Reported - English (%)
Ancestries Reported - French (%)
Ancestries Reported - French Canadian (%)
Ancestries Reported - German (%)
Ancestries Reported - Greek (%)
Ancestries Reported - Hungarian (%)
Ancestries Reported - Irish (%)
Ancestries Reported - Italian (%)
Ancestries Reported - Lithuanian (%)
Ancestries Reported - Norwegian (%)
Ancestries Reported - Polish (%)
Ancestries Reported - Portuguese (%)
Ancestries Reported - Russian (%)
Ancestries Reported - Scotch-Irish (%)
Ancestries Reported - Scottish (%)
Ancestries Reported - Slovak (%)
Ancestries Reported - Subsaharan African (%)
Ancestries Reported - Swedish (%)
Ancestries Reported - Swiss (%)
Ancestries Reported - Ukrainian (%)
Ancestries Reported - United States (%)
Ancestries Reported - Welsh (%)
Ancestries Reported - West Indian (%)
Ancestries Reported - Other (%)
Educational Attainment - No schooling completed (%)
Educational Attainment - Less than high school (%)
Educational Attainment - High school or equivalent (%)
Educational Attainment - Less than 1 year of college (%)
Educational Attainment - 1 or more years of college (%)
Educational Attainment - Associate degree (%)
Educational Attainment - Bachelor's degree (%)
Educational Attainment - Master's degree (%)
Educational Attainment - Professional school degree (%)
Educational Attainment - Doctorate degree (%)
School Enrollment - Nursery, preschool (%)
School Enrollment - Kindergarten (%)
School Enrollment - Grade 1 to 4 (%)
School Enrollment - Grade 5 to 8 (%)
School Enrollment - Grade 9 to 12 (%)
School Enrollment - College undergrad (%)
School Enrollment - Graduate or professional (%)
School Enrollment - Not enrolled in school (%)
School enrollment - Public schools (%)
School enrollment - Private schools (%)
School enrollment - Not enrolled (%)
Median number of rooms in houses and condos
Median number of rooms in apartments
Housing units lacking complete plumbing facilities (%)
Housing units lacking complete kitchen facilities (%)
Density of houses
Urban houses (%)
Rural houses (%)
Households with people 60 years and over (%)
Households with people 65 years and over (%)
Households with people 75 years and over (%)
Households with one or more nonrelatives (%)
Households with no nonrelatives (%)
Population in households (%)
Family households (%)
Nonfamily households (%)
Population in families (%)
Family households with own children (%)
Median number of bedrooms in owner occupied houses
Mean number of bedrooms in owner occupied houses
Median number of bedrooms in renter occupied houses
Mean number of bedrooms in renter occupied houses
Median number of vehichles in owner occupied houses
Mean number of vehichles in owner occupied houses
Median number of vehichles in renter occupied houses
Mean number of vehichles in renter occupied houses
Mortgage status - with mortgage (%)
Mortgage status - with second mortgage (%)
Mortgage status - with home equity loan (%)
Mortgage status - with both second mortgage and home equity loan (%)
Mortgage status - without a mortgage (%)
Average family size
Average family size - White
Average family size - Black or African American
Average family size - Asian
Average family size - Hispanic or Latino
Average family size - American Indian and Alaska Native
Average family size - Multirace
Average family size - Other Race
Geographical mobility - Same house 1 year ago (%)
Geographical mobility - Moved within same county (%)
Geographical mobility - Moved from different county within same state (%)
Geographical mobility - Moved from different state (%)
Geographical mobility - Moved from abroad (%)
Place of birth - Born in state of residence (%)
Place of birth - Born in other state (%)
Place of birth - Native, outside of US (%)
Place of birth - Foreign born (%)
Housing units in structures - 1, detached (%)
Housing units in structures - 1, attached (%)
Housing units in structures - 2 (%)
Housing units in structures - 3 or 4 (%)
Housing units in structures - 5 to 9 (%)
Housing units in structures - 10 to 19 (%)
Housing units in structures - 20 to 49 (%)
Housing units in structures - 50 or more (%)
Housing units in structures - Mobile home (%)
Housing units in structures - Boat, RV, van, etc. (%)
House/condo owner moved in on average (years ago)
Renter moved in on average (years ago)
Year householder moved into unit - Moved in 1999 to March 2000 (%)
Year householder moved into unit - Moved in 1995 to 1998 (%)
Year householder moved into unit - Moved in 1990 to 1994 (%)
Year householder moved into unit - Moved in 1980 to 1989 (%)
Year householder moved into unit - Moved in 1970 to 1979 (%)
Year householder moved into unit - Moved in 1969 or earlier (%)
Means of transportation to work - Drove car alone (%)
Means of transportation to work - Carpooled (%)
Means of transportation to work - Public transportation (%)
Means of transportation to work - Bus or trolley bus (%)
Means of transportation to work - Streetcar or trolley car (%)
Means of transportation to work - Subway or elevated (%)
Means of transportation to work - Railroad (%)
Means of transportation to work - Ferryboat (%)
Means of transportation to work - Taxicab (%)
Means of transportation to work - Motorcycle (%)
Means of transportation to work - Bicycle (%)
Means of transportation to work - Walked (%)
Means of transportation to work - Other means (%)
Working at home (%)
Industry diversity
Most Common Industries - Agriculture, forestry, fishing and hunting, and mining (%)
Most Common Industries - Agriculture, forestry, fishing and hunting (%)
Most Common Industries - Mining, quarrying, and oil and gas extraction (%)
Most Common Industries - Construction (%)
Most Common Industries - Manufacturing (%)
Most Common Industries - Wholesale trade (%)
Most Common Industries - Retail trade (%)
Most Common Industries - Transportation and warehousing, and utilities (%)
Most Common Industries - Transportation and warehousing (%)
Most Common Industries - Utilities (%)
Most Common Industries - Information (%)
Most Common Industries - Finance and insurance, and real estate and rental and leasing (%)
Most Common Industries - Finance and insurance (%)
Most Common Industries - Real estate and rental and leasing (%)
Most Common Industries - Professional, scientific, and management, and administrative and waste management services (%)
Most Common Industries - Professional, scientific, and technical services (%)
Most Common Industries - Management of companies and enterprises (%)
Most Common Industries - Administrative and support and waste management services (%)
Most Common Industries - Educational services, and health care and social assistance (%)
Most Common Industries - Educational services (%)
Most Common Industries - Health care and social assistance (%)
Most Common Industries - Arts, entertainment, and recreation, and accommodation and food services (%)
Most Common Industries - Arts, entertainment, and recreation (%)
Most Common Industries - Accommodation and food services (%)
Most Common Industries - Other services, except public administration (%)
Most Common Industries - Public administration (%)
Occupation diversity
Most Common Occupations - Management, business, science, and arts occupations (%)
Most Common Occupations - Management, business, and financial occupations (%)
Most Common Occupations - Management occupations (%)
Most Common Occupations - Business and financial operations occupations (%)
Most Common Occupations - Computer, engineering, and science occupations (%)
Most Common Occupations - Computer and mathematical occupations (%)
Most Common Occupations - Architecture and engineering occupations (%)
Most Common Occupations - Life, physical, and social science occupations (%)
Most Common Occupations - Education, legal, community service, arts, and media occupations (%)
Most Common Occupations - Community and social service occupations (%)
Most Common Occupations - Legal occupations (%)
Most Common Occupations - Education, training, and library occupations (%)
Most Common Occupations - Arts, design, entertainment, sports, and media occupations (%)
Most Common Occupations - Healthcare practitioners and technical occupations (%)
Most Common Occupations - Health diagnosing and treating practitioners and other technical occupations (%)
Most Common Occupations - Health technologists and technicians (%)
Most Common Occupations - Service occupations (%)
Most Common Occupations - Healthcare support occupations (%)
Most Common Occupations - Protective service occupations (%)
Most Common Occupations - Fire fighting and prevention, and other protective service workers including supervisors (%)
Most Common Occupations - Law enforcement workers including supervisors (%)
Most Common Occupations - Food preparation and serving related occupations (%)
Most Common Occupations - Building and grounds cleaning and maintenance occupations (%)
Most Common Occupations - Personal care and service occupations (%)
Most Common Occupations - Sales and office occupations (%)
Most Common Occupations - Sales and related occupations (%)
Most Common Occupations - Office and administrative support occupations (%)
Most Common Occupations - Natural resources, construction, and maintenance occupations (%)
Most Common Occupations - Farming, fishing, and forestry occupations (%)
Most Common Occupations - Construction and extraction occupations (%)
Most Common Occupations - Installation, maintenance, and repair occupations (%)
Most Common Occupations - Production, transportation, and material moving occupations (%)
Most Common Occupations - Production occupations (%)
Most Common Occupations - Transportation occupations (%)
Most Common Occupations - Material moving occupations (%)
People in Group quarters - Institutionalized population (%)
People in Group quarters - Correctional institutions (%)
People in Group quarters - Federal prisons and detention centers (%)
People in Group quarters - Halfway houses (%)
People in Group quarters - Local jails and other confinement facilities (including police lockups) (%)
People in Group quarters - Military disciplinary barracks (%)
People in Group quarters - State prisons (%)
People in Group quarters - Other types of correctional institutions (%)
People in Group quarters - Nursing homes (%)
People in Group quarters - Hospitals/wards, hospices, and schools for the handicapped (%)
People in Group quarters - Hospitals/wards and hospices for chronically ill (%)
People in Group quarters - Hospices or homes for chronically ill (%)
People in Group quarters - Military hospitals or wards for chronically ill (%)
People in Group quarters - Other hospitals or wards for chronically ill (%)
People in Group quarters - Hospitals or wards for drug/alcohol abuse (%)
People in Group quarters - Mental (Psychiatric) hospitals or wards (%)
People in Group quarters - Schools, hospitals, or wards for the mentally retarded (%)
People in Group quarters - Schools, hospitals, or wards for the physically handicapped (%)
People in Group quarters - Institutions for the deaf (%)
People in Group quarters - Institutions for the blind (%)
People in Group quarters - Orthopedic wards and institutions for the physically handicapped (%)
People in Group quarters - Wards in general hospitals for patients who have no usual home elsewhere (%)
People in Group quarters - Wards in military hospitals for patients who have no usual home elsewhere (%)
People in Group quarters - Juvenile institutions (%)
People in Group quarters - Long-term care (%)
People in Group quarters - Homes for abused, dependent, and neglected children (%)
People in Group quarters - Residential treatment centers for emotionally disturbed children (%)
People in Group quarters - Training schools for juvenile delinquents (%)
People in Group quarters - Short-term care, detention or diagnostic centers for delinquent children (%)
People in Group quarters - Type of juvenile institution unknown (%)
People in Group quarters - Noninstitutionalized population (%)
People in Group quarters - College dormitories (includes college quarters off campus) (%)
People in Group quarters - Military quarters (%)
People in Group quarters - On base (%)
People in Group quarters - Barracks, unaccompanied personnel housing (UPH), (Enlisted/Officer), ;and similar group living quarters for military personnel (%)
People in Group quarters - Transient quarters for temporary residents (%)
People in Group quarters - Military ships (%)
People in Group quarters - Group homes (%)
People in Group quarters - Homes or halfway houses for drug/alcohol abuse (%)
People in Group quarters - Homes for the mentally ill (%)
People in Group quarters - Homes for the mentally retarded (%)
People in Group quarters - Homes for the physically handicapped (%)
People in Group quarters - Other group homes (%)
People in Group quarters - Religious group quarters (%)
People in Group quarters - Dormitories (%)
People in Group quarters - Agriculture workers' dormitories on farms (%)
People in Group quarters - Job Corps and vocational training facilities (%)
People in Group quarters - Other workers' dormitories (%)
People in Group quarters - Crews of maritime vessels (%)
People in Group quarters - Other nonhousehold living situations (%)
People in Group quarters - Other noninstitutional group quarters (%)
Residents speaking English at home (%)
Residents speaking English at home - Born in the United States (%)
Residents speaking English at home - Native, born elsewhere (%)
Residents speaking English at home - Foreign born (%)
Residents speaking Spanish at home (%)
Residents speaking Spanish at home - Born in the United States (%)
Residents speaking Spanish at home - Native, born elsewhere (%)
Residents speaking Spanish at home - Foreign born (%)
Residents speaking other language at home (%)
Residents speaking other language at home - Born in the United States (%)
Residents speaking other language at home - Native, born elsewhere (%)
Residents speaking other language at home - Foreign born (%)
Class of Workers - Employee of private company (%)
Class of Workers - Self-employed in own incorporated business (%)
Class of Workers - Private not-for-profit wage and salary workers (%)
Class of Workers - Local government workers (%)
Class of Workers - State government workers (%)
Class of Workers - Federal government workers (%)
Class of Workers - Self-employed workers in own not incorporated business and Unpaid family workers (%)
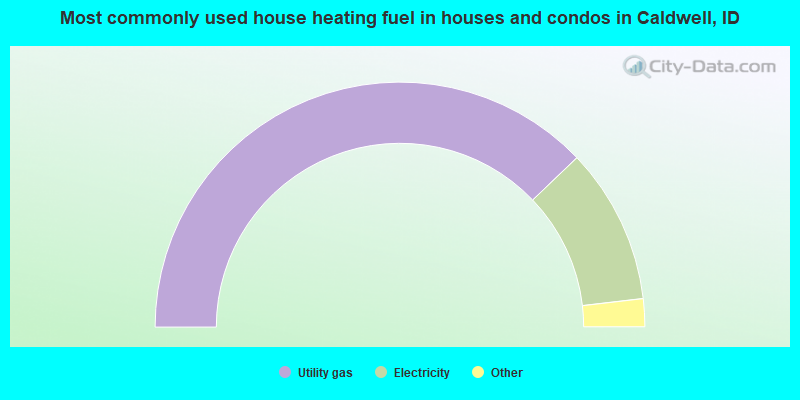
House heating fuel used in houses and condos - Utility gas (%)
House heating fuel used in houses and condos - Bottled, tank, or LP gas (%)
House heating fuel used in houses and condos - Electricity (%)
House heating fuel used in houses and condos - Fuel oil, kerosene, etc. (%)
House heating fuel used in houses and condos - Coal or coke (%)
House heating fuel used in houses and condos - Wood (%)
House heating fuel used in houses and condos - Solar energy (%)
House heating fuel used in houses and condos - Other fuel (%)
House heating fuel used in houses and condos - No fuel used (%)
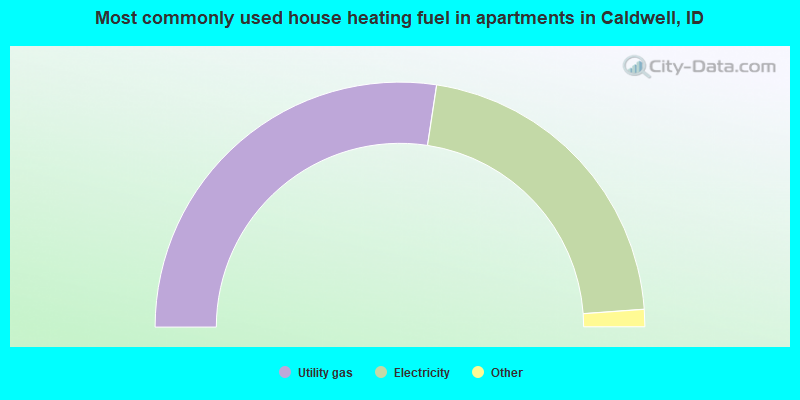
House heating fuel used in apartments - Utility gas (%)
House heating fuel used in apartments - Bottled, tank, or LP gas (%)
House heating fuel used in apartments - Electricity (%)
House heating fuel used in apartments - Fuel oil, kerosene, etc. (%)
House heating fuel used in apartments - Coal or coke (%)
House heating fuel used in apartments - Wood (%)
House heating fuel used in apartments - Solar energy (%)
House heating fuel used in apartments - Other fuel (%)
House heating fuel used in apartments - No fuel used (%)
Armed forces status - In Armed Forces (%)
Armed forces status - Civilian (%)
Armed forces status - Civilian - Veteran (%)
Armed forces status - Civilian - Nonveteran (%)
Fatal accidents locations in years 2005-2021
Fatal accidents locations in 2005
Fatal accidents locations in 2006
Fatal accidents locations in 2007
Fatal accidents locations in 2008
Fatal accidents locations in 2009
Fatal accidents locations in 2010
Fatal accidents locations in 2011
Fatal accidents locations in 2012
Fatal accidents locations in 2013
Fatal accidents locations in 2014
Fatal accidents locations in 2015
Fatal accidents locations in 2016
Fatal accidents locations in 2017
Fatal accidents locations in 2018
Fatal accidents locations in 2019
Fatal accidents locations in 2020
Fatal accidents locations in 2021
Alcohol use - People drinking some alcohol every month (%)
Alcohol use - People not drinking at all (%)
Alcohol use - Average days/month drinking alcohol
Alcohol use - Average drinks/week
Alcohol use - Average days/year people drink much
Audiometry - Average condition of hearing (%)
Audiometry - People that can hear a whisper from across a quiet room (%)
Audiometry - People that can hear normal voice from across a quiet room (%)
Audiometry - Ears ringing, roaring, buzzing (%)
Audiometry - Had a job exposure to loud noise (%)
Audiometry - Had off-work exposure to loud noise (%)
Blood Pressure & Cholesterol - Has high blood pressure (%)
Blood Pressure & Cholesterol - Checking blood pressure at home (%)
Blood Pressure & Cholesterol - Frequently checking blood cholesterol (%)
Blood Pressure & Cholesterol - Has high cholesterol level (%)
Consumer Behavior - Money monthly spent on food at supermarket/grocery store
Consumer Behavior - Money monthly spent on food at other stores
Consumer Behavior - Money monthly spent on eating out
Consumer Behavior - Money monthly spent on carryout/delivered foods
Consumer Behavior - Income spent on food at supermarket/grocery store (%)
Consumer Behavior - Income spent on food at other stores (%)
Consumer Behavior - Income spent on eating out (%)
Consumer Behavior - Income spent on carryout/delivered foods (%)
Current Health Status - General health condition (%)
Current Health Status - Blood donors (%)
Current Health Status - Has blood ever tested for HIV virus (%)
Current Health Status - Left-handed people (%)
Dermatology - People using sunscreen (%)
Diabetes - Diabetics (%)
Diabetes - Had a blood test for high blood sugar (%)
Diabetes - People taking insulin (%)
Diet Behavior & Nutrition - Diet health (%)
Diet Behavior & Nutrition - Milk product consumption (# of products/month)
Diet Behavior & Nutrition - Meals not home prepared (#/week)
Diet Behavior & Nutrition - Meals from fast food or pizza place (#/week)
Diet Behavior & Nutrition - Ready-to-eat foods (#/month)
Diet Behavior & Nutrition - Frozen meals/pizza (#/month)
Drug Use - People that ever used marijuana or hashish (%)
Drug Use - Ever used hard drugs (%)
Drug Use - Ever used any form of cocaine (%)
Drug Use - Ever used heroin (%)
Drug Use - Ever used methamphetamine (%)
Health Insurance - People covered by health insurance (%)
Kidney Conditions-Urology - Avg. # of times urinating at night
Medical Conditions - People with asthma (%)
Medical Conditions - People with anemia (%)
Medical Conditions - People with psoriasis (%)
Medical Conditions - People with overweight (%)
Medical Conditions - Elderly people having difficulties in thinking or remembering (%)
Medical Conditions - People who ever received blood transfusion (%)
Medical Conditions - People having trouble seeing even with glass/contacts (%)
Medical Conditions - People with arthritis (%)
Medical Conditions - People with gout (%)
Medical Conditions - People with congestive heart failure (%)
Medical Conditions - People with coronary heart disease (%)
Medical Conditions - People with angina pectoris (%)
Medical Conditions - People who ever had heart attack (%)
Medical Conditions - People who ever had stroke (%)
Medical Conditions - People with emphysema (%)
Medical Conditions - People with thyroid problem (%)
Medical Conditions - People with chronic bronchitis (%)
Medical Conditions - People with any liver condition (%)
Medical Conditions - People who ever had cancer or malignancy (%)
Mental Health - People who have little interest in doing things (%)
Mental Health - People feeling down, depressed, or hopeless (%)
Mental Health - People who have trouble sleeping or sleeping too much (%)
Mental Health - People feeling tired or having little energy (%)
Mental Health - People with poor appetite or overeating (%)
Mental Health - People feeling bad about themself (%)
Mental Health - People who have trouble concentrating on things (%)
Mental Health - People moving or speaking slowly or too fast (%)
Mental Health - People having thoughts they would be better off dead (%)
Oral Health - Average years since last visit a dentist
Oral Health - People embarrassed because of mouth (%)
Oral Health - People with gum disease (%)
Oral Health - General health of teeth and gums (%)
Oral Health - Average days a week using dental floss/device
Oral Health - Average days a week using mouthwash for dental problem
Oral Health - Average number of teeth
Pesticide Use - Households using pesticides to control insects (%)
Pesticide Use - Households using pesticides to kill weeds (%)
Physical Activity - People doing vigorous-intensity work activities (%)
Physical Activity - People doing moderate-intensity work activities (%)
Physical Activity - People walking or bicycling (%)
Physical Activity - People doing vigorous-intensity recreational activities (%)
Physical Activity - People doing moderate-intensity recreational activities (%)
Physical Activity - Average hours a day doing sedentary activities
Physical Activity - Average hours a day watching TV or videos
Physical Activity - Average hours a day using computer
Physical Functioning - People having limitations keeping them from working (%)
Physical Functioning - People limited in amount of work they can do (%)
Physical Functioning - People that need special equipment to walk (%)
Physical Functioning - People experiencing confusion/memory problems (%)
Physical Functioning - People requiring special healthcare equipment (%)
Prescription Medications - Average number of prescription medicines taking
Preventive Aspirin Use - Adults 40+ taking low-dose aspirin (%)
Reproductive Health - Vaginal deliveries (%)
Reproductive Health - Cesarean deliveries (%)
Reproductive Health - Deliveries resulted in a live birth (%)
Reproductive Health - Pregnancies resulted in a delivery (%)
Reproductive Health - Women breastfeeding newborns (%)
Reproductive Health - Women that had a hysterectomy (%)
Reproductive Health - Women that had both ovaries removed (%)
Reproductive Health - Women that have ever taken birth control pills (%)
Reproductive Health - Women taking birth control pills (%)
Reproductive Health - Women that have ever used Depo-Provera or injectables (%)
Reproductive Health - Women that have ever used female hormones (%)
Sexual Behavior - People 18+ that ever had sex (vaginal, anal, or oral) (%)
Sexual Behavior - Males 18+ that ever had vaginal sex with a woman (%)
Sexual Behavior - Males 18+ that ever performed oral sex on a woman (%)
Sexual Behavior - Males 18+ that ever had anal sex with a woman (%)
Sexual Behavior - Males 18+ that ever had any sex with a man (%)
Sexual Behavior - Females 18+ that ever had vaginal sex with a man (%)
Sexual Behavior - Females 18+ that ever performed oral sex on a man (%)
Sexual Behavior - Females 18+ that ever had anal sex with a man (%)
Sexual Behavior - Females 18+ that ever had any kind of sex with a woman (%)
Sexual Behavior - Average age people first had sex
Sexual Behavior - Average number of female sex partners in lifetime (males 18+)
Sexual Behavior - Average number of female vaginal sex partners in lifetime (males 18+)
Sexual Behavior - Average age people first performed oral sex on a woman (18+)
Sexual Behavior - Average number of woman performed oral sex on in lifetime (18+)
Sexual Behavior - Average number of male sex partners in lifetime (males 18+)
Sexual Behavior - Average number of male anal sex partners in lifetime (males 18+)
Sexual Behavior - Average age people first performed oral sex on a man (18+)
Sexual Behavior - Average number of male oral sex partners in lifetime (18+)
Sexual Behavior - People using protection when performing oral sex (%)
Sexual Behavior - Average number of times people have vaginal or anal sex a year
Sexual Behavior - People having sex without condom (%)
Sexual Behavior - Average number of male sex partners in lifetime (females 18+)
Sexual Behavior - Average number of male vaginal sex partners in lifetime (females 18+)
Sexual Behavior - Average number of female sex partners in lifetime (females 18+)
Sexual Behavior - Circumcised males 18+ (%)
Sleep Disorders - Average hours sleeping at night
Sleep Disorders - People that has trouble sleeping (%)
Smoking-Cigarette Use - People smoking cigarettes (%)
Taste & Smell - People 40+ having problems with smell (%)
Taste & Smell - People 40+ having problems with taste (%)
Taste & Smell - People 40+ that ever had wisdom teeth removed (%)
Taste & Smell - People 40+ that ever had tonsils teeth removed (%)
Taste & Smell - People 40+ that ever had a loss of consciousness because of a head injury (%)
Taste & Smell - People 40+ that ever had a broken nose or other serious injury to face or skull (%)
Taste & Smell - People 40+ that ever had two or more sinus infections (%)
Weight - Average height (inches)
Weight - Average weight (pounds)
Weight - Average BMI
Weight - People that are obese (%)
Weight - People that ever were obese (%)
Weight - People trying to lose weight (%)
The City-Data.com crime index weighs serious crimes and violent crimes more heavily. Higher means more crime, U.S. average is 246.1. It adjusts for the number of visitors and daily workers commuting into cities.
- means the value is smaller than the state average.
- means the value is about the same as the state average.
- means the value is bigger than the state average.
Crime rate in Caldwell detailed stats: murders, rapes, robberies, assaults, burglaries, thefts, arson Officers per 1,000 residents here:
1.17Idaho average:
1.59
Latest news from Caldwell, ID collected exclusively by city-data.com from local newspapers, TV, and radio stations
Ancestries: English (6.7%), American (5.9%), German (5.8%), European (4.1%), Russian (2.7%), Irish (2.3%).
Current Local Time:
Land area: 11.3 square miles.
Population density: 5,812 people per square mile (average).
7,637 residents are foreign born (10.5% Latin America ).
This city:
11.7%Idaho:
5.7%
Median real estate property taxes paid for housing units with mortgages in 2022: $1,876 (0.5%)Median real estate property taxes paid for housing units with no mortgage in 2022: $1,692 (0.5%)
Nearest city with pop. 50,000+: Nampa, ID
Nearest city with pop. 200,000+: Northwest Clackamas, OR (316.5 miles
Nearest city with pop. 1,000,000+: Los Angeles, CA
Nearest cities:
Latitude: 43.66 N, Longitude: 116.68 W
Daytime population change due to commuting: -8,396 (-12.7%)Workers who live and work in this city: 10,660 (34.8%)
Caldwell tourist attractions:
Single-family new house construction building permits:
2022: 670 buildings , average cost: $221,5002021: 828 buildings , average cost: $134,9002020: 905 buildings , average cost: $144,0002019: 739 buildings , average cost: $137,6002018: 572 buildings , average cost: $135,3002017: 478 buildings , average cost: $148,8002016: 537 buildings , average cost: $135,3002015: 444 buildings , average cost: $130,5002014: 411 buildings , average cost: $134,4002013: 320 buildings , average cost: $131,6002012: 197 buildings , average cost: $125,7002011: 37 buildings , average cost: $128,7002010: 131 buildings , average cost: $119,1002009: 225 buildings , average cost: $114,6002008: 337 buildings , average cost: $122,9002007: 620 buildings , average cost: $143,3002006: 1166 buildings , average cost: $122,3002005: 955 buildings , average cost: $127,1002004: 635 buildings , average cost: $105,5002003: 650 buildings , average cost: $98,4002002: 599 buildings , average cost: $90,6002001: 501 buildings , average cost: $91,8002000: 391 buildings , average cost: $86,6001999: 265 buildings , average cost: $89,3001998: 306 buildings , average cost: $85,5001997: 231 buildings , average cost: $82,200Unemployment in December 2023: Population change in the 1990s: +6,919 (+36.3%).
Most common occupations in Caldwell, ID (%)
Both Males Females
Other production occupations, including supervisors (6.4%)
Building and grounds cleaning and maintenance occupations (4.6%)
Driver/sales workers and truck drivers (3.6%)
Laborers and material movers, hand (3.4%)
Other sales and related occupations, including supervisors (3.1%)
Other office and administrative support workers, including supervisors (3.0%)
Other management occupations, except farmers and farm managers (2.7%)
Other production occupations, including supervisors (8.5%)
Driver/sales workers and truck drivers (6.3%)
Building and grounds cleaning and maintenance occupations (4.8%)
Laborers and material movers, hand (4.3%)
Electrical equipment mechanics and other installation, maintenance, and repair workers, including supervisors (4.0%)
Agricultural workers, including supervisors (4.0%)
Metal workers and plastic workers (3.5%)
Other office and administrative support workers, including supervisors (5.0%)
Secretaries and administrative assistants (4.5%)
Building and grounds cleaning and maintenance occupations (4.3%)
Other production occupations, including supervisors (4.1%)
Cashiers (4.0%)
Child care workers (4.0%)
Customer service representatives (3.8%)
Earthquake activity:
Caldwell-area historical earthquake activity is significantly above Idaho state average. It is 2261% greater than the overall U.S. average. On 10/28/1983 at 14:06:06, a magnitude 7.3 (6.2 MB, 7.3 MS, 7.0 MW, Class: Major, Intensity: VIII - XII) earthquake occurred 146.4 miles away from Caldwell center, causing 2 deaths ( 2 shaking deaths) and 3 injuries, causing $15,000,000 total damage On 10/3/1915 at 06:52:48, a magnitude 7.6 (7.6 UK) earthquake occurred 222.5 miles away from the city center On 8/18/1959 at 06:37:13, a magnitude 7.7 (7.7 UK) earthquake occurred 305.7 miles away from the city center, causing $26,000,000 total damage On 3/31/2020 at 23:52:30, a magnitude 6.5 (6.5 MW, Depth: 7.5 mi, Class: Strong, Intensity: VII - IX) earthquake occurred 95.6 miles away from the city center On 12/16/1954 at 11:07:12, a magnitude 7.0 (7.0 UK) earthquake occurred 315.9 miles away from the city center On 12/21/1932 at 06:10:09, a magnitude 7.2 (7.2 UK) earthquake occurred 363.5 miles away from the city center Magnitude types: body-wave magnitude (MB), surface-wave magnitude (MS), moment magnitude (MW) Natural disasters: The number of natural disasters in Canyon County (3) is a lot smaller than the US average (15).Emergencies Declared: 1Flood: 1, Hurricane: 1, Other: 1 (Note: some incidents may be assigned to more than one category). Hospitals and medical centers in Caldwell: WEST VALLEY MEDICAL CENTER (Proprietary, 1717 ARLINGTON STREET) KINDRED NURSING AND REHAB - CALDWELL (210 CLEVELAND BOULEVARD)
KINDRED NURSING AND REHAB - CANYON WEST (2814 SOUTH INDIANA AVENUE)
CALDWELL DIALYSIS CENTER (821 S SMEED PKWY)
LIBERTY DIALYSIS - CALDWELL (4620 ENTERPRISE WAY STE 101)
Amtrak station near Caldwell: 9 miles: NAMPA (1424 2ND ST. S.) - Bus Station Services: public payphones, free short-term parking.
College/University in Caldwell: The College of Idaho Full-time enrollment: 1,051; Location: 2112 Cleveland Blvd; Private, not-for-profit; Website: www.collegeofidaho.edu; Offers Master's degree )
Colleges/universities with over 2000 students nearest to Caldwell:
Northwest Nazarene University (about 9 miles; Nampa, ID ; Full-time enrollment: 2,290)
College of Western Idaho (about 10 miles; Nampa, ID ; FT enrollment: 6,300)
Boise State University (about 25 miles; Boise, ID ; FT enrollment: 16,774)
Treasure Valley Community College (about 29 miles; Ontario, OR ; FT enrollment: 2,055)
College of Southern Idaho (about 134 miles; Twin Falls, ID ; FT enrollment: 5,051)
Eastern Oregon University (about 135 miles; La Grande, OR ; FT enrollment: 3,127)
Walla Walla Community College (about 186 miles; Walla Walla, WA ; FT enrollment: 4,263)
Public high schools in Caldwell: CALDWELL SENIOR HIGH SCHOOL Students: 1,688, Location: 3401 S INDIANA, Grades: 9-12)VALLIVUE HIGH SCHOOL Students: 1,491, Location: 1407 HOMEDALE RD, Grades: 9-12)THOMAS JEFFERSON CHARTER Students: 322, Location: 1209 ADAM SMITH AVE, Grades: PK-12, Charter school )CANYON SPRINGS ALT HIGH SCHOOL Students: 98, Location: 516 N 11TH ST, Grades: 9-12)VISION CHARTER SCHOOL Location: 19291 WARD ROAD, Grades: KG-12, Charter school )
SOUTHWEST IDAHO JUVENILE DET Location: 222 12TH AVE N, Grades: 1-12)VALLIVUE ACADEMY (ALT) Location: 6123 TIMBRE DR, Grades: 9-12)
VALLIVUE VIRTUAL ACADEMY Location: 5207 S MONTANA AVE, Grades: PK-12)
RIVERVUE ACADEMY ALTERNATIVE Location: 21985 DIXIE RIVER RD, Grades: 7-9)
Private high school in Caldwell: CENITINNIEL BAPTIST SCHOOL Students: 178, Location: 3610 E USTICK RD, Grades: PK-12)
Biggest public elementary/middle schools in Caldwell: CENTRAL CANYON ELEMENTARY SCHOOL Students: 787, Location: 16437 FLORIDA AVE, Grades: PK-5)JEFFERSON MIDDLE SCHOOL Students: 746, Location: 3311 S 10TH AVENUE, Grades: 6-8)SYRINGA MIDDLE SCHOOL Students: 696, Location: 1100 WILLOW STREET, Grades: 6-8)WEST CANYON ELEMENTARY SCHOOL Students: 692, Location: 19548 USTICK ROAD, Grades: PK-5)VALLIVUE MIDDLE SCHOOL Students: 648, Location: 16412 S 10TH AVE, Grades: 6-8)WILSON ELEMENTARY SCHOOL Students: 618, Location: 400 E LINDEN, Grades: PK-5)SACAJAWEA ELEMENTARY SCHOOL Students: 541, Location: 1710 N ILLINOIS, Grades: PK-5)LEWIS AND CLARK ELEMENTARY Students: 538, Location: 1102 LASTER STREET, Grades: PK-5)VAN BUREN ELEMENTARY SCHOOL Students: 515, Location: 3115 MARBLE FRONT RD, Grades: KG-5)PURPLE SAGE ELEMENTARY Students: 394, Location: 25709 EL PASO ROAD, Grades: PK-5)Private elementary/middle school in Caldwell: CALDWELL ADVENTIST ELEMENTARY Students: 83, Location: 2317 WISCONSIN AVE, Grades: PK-8)
See full list of schools located in Caldwell Library in Caldwell: CALDWELL PUBLIC Operating income: $644,651; Location: 1010 DEARBORN ST; 94,518 books ; 1,897 audio materials ; 1,760 video materials ; 3 local licensed databases ; 51 state licensed databases ; 152 print serial subscriptions )
Notable locations in Caldwell: (A) , Canyon County Ambulance District 2 (B) , Canyon County Ambulance District 4 (C) , Caldwell Fire and Rescue Station 2 (D) , Caldwell Fire and Rescue Station 1 Region 3 Hazmat Team (E) . Display/hide their locations on the map
Cemetery: (1) . Display/hide its location on the map
Tourist attraction:
Hotels:
Birthplace of: Butch Otter - Politician, A.J. Feeley - 2005 NFL player (Miami Dolphins, born : May 16, 1977), Chris Horn - 2005 NFL player (Kansas City Chiefs, born : Jul 13, 1977), Cody Pickett - 2005 NFL player (San Francisco 49ers, born : Jun 30, 1980), Edward Lodge - Federal judge, Frank Reberger - Baseball player and coach, Gary L. Stevens - Jockey, Mark Weivoda - Football player, Melinda Smyser - Congresswoman in Idaho, Mike Garman - Baseball player.
Canyon County has a predicted average indoor radon screening level between 2 and 4 pCi/L (pico curies per liter) - Moderate Potential Drinking water stations with addresses in Caldwell and their reported violations in the past:
CALDWELL CITY OF (Population served: 46,237, Groundwater):
Past monitoring violations:
Monitoring and Reporting (DBP) - Between JAN-2012 and DEC-2012, Contaminant: Total Haloacetic Acids (HAA5)
Monitoring and Reporting (DBP) - Between JAN-2012 and DEC-2012, Contaminant: TTHM
Monitoring and Reporting (DBP) - Between APR-2005 and JUN-2005, Contaminant: Total Haloacetic Acids (HAA5). Follow-up actions: St Compliance achieved (AUG-24-2005)
Monitoring and Reporting (DBP) - Between APR-2005 and JUN-2005, Contaminant: TTHM. Follow-up actions: St Compliance achieved (AUG-24-2005)
One minor monitoring violation
248 regular monitoring violations
Population served: 1,100, Groundwater):
Past health violations:
MCL, Monthly (TCR) - In JUN-2010, Contaminant: Coliform
MCL, Monthly (TCR) - In JAN-2007, Contaminant: Coliform
MCL, Monthly (TCR) - In DEC-2006, Contaminant: Coliform
MCL, Monthly (TCR) - In AUG-2006, Contaminant: Coliform
MCL, Monthly (TCR) - In JUL-2006, Contaminant: Coliform
MCL, Monthly (TCR) - In AUG-2005, Contaminant: Coliform
MCL, Monthly (TCR) - In FEB-2005, Contaminant: Coliform
Past monitoring violations:
One routine major monitoring violation
3 minor monitoring violations
2 regular monitoring violations
Population served: 300, Groundwater):
Past health violations:
MCL, Average - Between OCT-2010 and DEC-2010, Contaminant: Arsenic. Follow-up actions: St BCA signed (AUG-31-2007), St Violation/Reminder Notice (JAN-04-2011), St Public Notif requested (JAN-07-2011)
MCL, Average - Between JUL-2010 and SEP-2010, Contaminant: Arsenic. Follow-up actions: St BCA signed (AUG-31-2007), St Violation/Reminder Notice (OCT-01-2010), St Public Notif requested (OCT-04-2010)
MCL, Average - Between APR-2010 and JUN-2010, Contaminant: Arsenic. Follow-up actions: St BCA signed (AUG-31-2007)
MCL, Average - Between APR-2010 and JUN-2010, Contaminant: Arsenic. Follow-up actions: St BCA signed (AUG-31-2007), St Violation/Reminder Notice (FEB-01-2011), St Public Notif requested (FEB-04-2011)
MCL, Average - Between JAN-2010 and MAR-2010, Contaminant: Arsenic. Follow-up actions: St BCA signed (AUG-31-2007)
MCL, Average - Between JAN-2010 and MAR-2010, Contaminant: Arsenic. Follow-up actions: St BCA signed (AUG-31-2007)
20 other older health violations
Past monitoring violations:
One regular monitoring violation
Population served: 250, Groundwater):
Past monitoring violations:
One routine major monitoring violation
Population served: 213, Groundwater):
Past health violations:
MCL, Monthly (TCR) - In JUL-2013, Contaminant: Coliform. Follow-up actions: St Violation/Reminder Notice (SEP-04-2013), St Public Notif requested (SEP-07-2013)
MCL, Acute (TCR) - In JUN-2013, Contaminant: Coliform. Follow-up actions: St Public Notif received (JUL-05-2013), St Public Notif requested (AUG-05-2013), St Violation/Reminder Notice (AUG-05-2013), St Boil Water Order (AUG-05-2013)
MCL, Monthly (TCR) - In JUN-2011, Contaminant: Coliform. Follow-up actions: St Violation/Reminder Notice (AUG-01-2011), St Public Notif requested (AUG-04-2011)
MCL, Monthly (TCR) - In MAR-2007, Contaminant: Coliform
Past monitoring violations:
Failure To Address Deficiency - In MAR-22-2012, Contaminant: GROUNDWATER RULE. Follow-up actions: St Violation/Reminder Notice (APR-02-2012), St Public Notif requested (APR-05-2012), St Compliance achieved (JUL-26-2012)
Failure To Address Deficiency - In MAR-22-2012, Contaminant: GROUNDWATER RULE. Follow-up actions: St Violation/Reminder Notice (3 times from APR-02-2012 to APR-02-2012), St Public Notif requested (3 times from APR-05-2012 to APR-05-2012), St Compliance achieved (JUL-26-2012)
One minor monitoring violation
Population served: 200, Groundwater):
Past health violations:
MCL, Monthly (TCR) - In OCT-2005, Contaminant: Coliform
Past monitoring violations:
Failure To Address Deficiency - In DEC-16-2013, Contaminant: GROUNDWATER RULE. Follow-up actions: St Violation/Reminder Notice (2 times from JAN-06-2014 to JAN-06-2014), St Public Notif requested (2 times from JAN-09-2014 to JAN-09-2014), St Compliance achieved (2 times from MAY-01-2014 to JUN-01-2014)
Failure To Address Deficiency - In DEC-16-2013, Contaminant: GROUNDWATER RULE. Follow-up actions: St Violation/Reminder Notice (JAN-06-2014), St Public Notif requested (JAN-09-2014), St Compliance achieved (MAY-01-2014)
Failure To Address Deficiency - In DEC-16-2013, Contaminant: GROUNDWATER RULE. Follow-up actions: St Violation/Reminder Notice (2 times from JAN-06-2014 to JAN-06-2014), St Public Notif requested (2 times from JAN-09-2014 to JAN-09-2014), St Compliance achieved (2 times from MAY-01-2014 to JUN-01-2014)
Population served: 200, Groundwater):
Past health violations:
MCL, Monthly (TCR) - Between APR-2010 and JUN-2010, Contaminant: Coliform. Follow-up actions: St Violation/Reminder Notice (AUG-02-2010), St Public Notif requested (AUG-05-2010), St Public Notif received (AUG-23-2010)
MCL, Single Sample - Between OCT-2009 and DEC-2009, Contaminant: Nitrate. Follow-up actions: St Public Notif received (JAN-11-2010), St Public Notif requested (FEB-01-2010), St Violation/Reminder Notice (FEB-01-2010), St Compliance achieved (NOV-30-2010)
MCL, Monthly (TCR) - In AUG-2006, Contaminant: Coliform
Past monitoring violations:
One routine major monitoring violation
3 minor monitoring violations
3 regular monitoring violations
Serves AK, Population served: 192, Surface water):
Past health violations:
MCL, Monthly (TCR) - In SEP-2013, Contaminant: Coliform
MCL, Single Sample - Between OCT-2012 and DEC-2012, Contaminant: Arsenic. Follow-up actions: St Compliance achieved (FEB-08-2013)
MCL, Monthly (TCR) - In AUG-2012, Contaminant: Coliform. Follow-up actions: St Compliance achieved (2 times from DEC-28-2012 to FEB-08-2013)
MCL, Single Sample - Between JUL-2012 and SEP-2012, Contaminant: Arsenic. Follow-up actions: St Compliance achieved (FEB-08-2013)
MCL, Single Sample - Between APR-2011 and JUN-2011, Contaminant: Arsenic. Follow-up actions: St Compliance achieved (FEB-08-2013)
MCL, Single Sample - Between JAN-2011 and MAR-2011, Contaminant: Arsenic. Follow-up actions: St Compliance achieved (FEB-08-2013)
6 other older health violations
Past monitoring violations:
Monitoring, Turbidity (Enhanced SWTR) - In APR-2014, Contaminant: IESWTR
Monitoring of Treatment (SWTR-Filter) - In APR-2014
Monitoring of Treatment (SWTR-Filter) - In FEB-2014
Monitoring, Turbidity (Enhanced SWTR) - In FEB-2014, Contaminant: IESWTR
Initial Tap Sampling for Pb and Cu - In JUL-01-2006, Contaminant: Lead and Copper Rule. Follow-up actions: St Compliance achieved (2 times from NOV-12-2006 to JUL-25-2007)
4 routine major monitoring violations
One minor monitoring violation
107 regular monitoring violations
Drinking water stations with addresses in Caldwell that have no violations reported:
SUNNYSLOPE MARKET (Population served: 50, Primary Water Source Type: Groundwater)
Average household size: This city:
3.0 peopleIdaho:
2.7 people
Percentage of family households: This city:
72.3%Whole state:
69.6%
Percentage of households with unmarried partners: This city:
8.4%Whole state:
6.3%
Likely homosexual households (counted as self-reported same-sex unmarried-partner households)
Lesbian couples: 0.4% of all households Gay men: 0.2% of all households
People in group quarters in Caldwell in 2010:
719 people in local jails and other municipal confinement facilities
515 people in college/university student housing
149 people in nursing facilities/skilled-nursing facilities
88 people in other noninstitutional facilities
45 people in correctional facilities intended for juveniles
8 people in residential treatment centers for adults
6 people in group homes intended for adults
2 people in workers' group living quarters and job corps centers
People in group quarters in Caldwell in 2000:
370 people in college dormitories (includes college quarters off campus)
321 people in local jails and other confinement facilities (including police lockups)
178 people in nursing homes
47 people in other noninstitutional group quarters
10 people in short-term care, detention or diagnostic centers for delinquent children
5 people in hospitals/wards and hospices for chronically ill
5 people in other hospitals or wards for chronically ill
Banks with most branches in Caldwell (2011 data):
Wells Fargo Bank, National Association: Caldwell Cleveland Branch at 823 Cleveland Boulevard, branch established on 1963/01/24; Caldwell Clearwater Branch at 5218 Cleveland Blvd, branch established on 1957/05/01. Info updated 2011/04/05: Bank assets: $1,161,490.0 mil, Deposits: $905,653.0 mil, headquarters in Sioux Falls, SD, positive income , 6395 total offices , Holding Company: Wells Fargo & Company
Bank of the Cascades: Caldwell Branch at 1110 Blaine, branch established on 1998/09/08. Info updated 2007/01/18: Bank assets: $1,334.8 mil, Deposits: $1,087.3 mil, headquarters in Bend, OR, negative income in the last year , Commercial Lending Specialization, 35 total offices , Holding Company: Cascade Bancorp
JPMorgan Chase Bank, National Association: Caldwell at 1018 Blaine St, branch established on 1998/06/29. Info updated 2011/11/10: Bank assets: $1,811,678.0 mil, Deposits: $1,190,738.0 mil, headquarters in Columbus, OH, positive income , International Specialization, 5577 total offices , Holding Company: Jpmorgan Chase & Co.
U.S. Bank National Association: Caldwell Branch at 607 Cleveland Boulevard, branch established on 1867/03/10. Info updated 2012/01/30: Bank assets: $330,470.8 mil, Deposits: $236,091.5 mil, headquarters in Cincinnati, OH, positive income , 3121 total offices , Holding Company: U.S. Bancorp
Panhandle State Bank: Caldwell Branch at 506 S 10th Avenue, branch established on 2002/02/04. Info updated 2009/07/09: Bank assets: $936.3 mil, Deposits: $731.7 mil, headquarters in Sandpoint, ID, positive income , Commercial Lending Specialization, 22 total offices , Holding Company: Intermountain Community Bancorp
Home Federal Bank: 923 Dearborn Branch at 923 Dearborn Street, branch established on 2007/06/20. Info updated 2011/06/16: Bank assets: $1,098.5 mil, Deposits: $928.9 mil, headquarters in Nampa, ID, negative income in the last year , Commercial Lending Specialization, 28 total offices , Holding Company: Home Federal Bancorp, Inc.
KeyBank National Association: Caldwell Branch at 309 S 9th Street, branch established on 1970/06/05. Info updated 2008/03/03: Bank assets: $86,198.8 mil, Deposits: $64,214.8 mil, headquarters in Cleveland, OH, positive income , Commercial Lending Specialization, 1067 total offices , Holding Company: Keycorp
Zions First National Bank: Caldwell Branch at 509 South Kimball Ave., branch established on 2004/11/22. Info updated 2006/11/03: Bank assets: $17,531.3 mil, Deposits: $14,905.3 mil, headquarters in Salt Lake City, UT, positive income , Commercial Lending Specialization, 151 total offices , Holding Company: Zions Bancorporation
Idaho Independent Bank: Caldwell Branch at 620 S Kimball Ave, branch established on 2001/05/23. Info updated 2010/02/16: Bank assets: $441.1 mil, Deposits: $357.5 mil, headquarters in Coeur D Alene, ID, negative income in the last year , Commercial Lending Specialization, 12 total offices
For population 15 years and over in Caldwell:
Never married: 38.2%Now married: 49.4%Separated: 0.8%Widowed: 2.7%Divorced: 8.8% For population 25 years and over in Caldwell:
High school or higher: 82.6%Bachelor's degree or higher: 18.7%Graduate or professional degree: 4.3%Unemployed: 6.1%Mean travel time to work (commute): 24.7 minutes
Education Gini index (Inequality in education) Here:
14.0Idaho average:
11.0
Religion statistics for Caldwell, ID (based on Canyon County data)
Religion Adherents Congregations Other 29,810 68 Evangelical Protestant 25,615 114 Catholic 17,838 3 Mainline Protestant 3,881 19 None 111,779 -
Source: Clifford Grammich, Kirk Hadaway, Richard Houseal, Dale E.Jones, Alexei Krindatch, Richie Stanley and Richard H.Taylor. 2012. 2010 U.S.Religion Census: Religious Congregations & Membership Study. Association of Statisticians of American Religious Bodies. Jones, Dale E., et al. 2002. Congregations and Membership in the United States 2000. Nashville, TN: Glenmary Research Center. Graphs represent county-level data
Food Environment Statistics: Number of grocery stores : 21Canyon County :
1.18 / 10,000 pop.State :
1.88 / 10,000 pop.
Number of supercenters and club stores : 5Here :
0.28 / 10,000 pop.Idaho :
0.28 / 10,000 pop.
Number of convenience stores (no gas) : 5Canyon County :
0.28 / 10,000 pop.Idaho :
0.53 / 10,000 pop.
Number of convenience stores (with gas) : 42Canyon County :
2.35 / 10,000 pop.Idaho :
3.87 / 10,000 pop.
Number of full-service restaurants : 78Canyon County :
4.37 / 10,000 pop.Idaho :
7.75 / 10,000 pop.
Adult diabetes rate : Canyon County :
7.7%Idaho :
7.7%
Adult obesity rate : This county :
28.7%State :
25.7%
Low-income preschool obesity rate : Health and Nutrition:
Average overall health of teeth and gums : People feeling badly about themselves : Caldwell:
23.1%State:
21.8%
People not drinking alcohol at all : This city:
11.2%Idaho:
10.0%
Average hours sleeping at night : General health condition : Caldwell:
54.0%Idaho:
56.0%
Average condition of hearing : This city:
79.1%Idaho:
78.5%
More about Health and Nutrition of Caldwell, ID Residents
Local government employment and payroll (March 2022)
Function
Full-time employees
Monthly full-time payroll
Average yearly full-time wage
Part-time employees
Monthly part-time payroll
Police Protection - Officers
76 $451,048 $71,218 0 $0 Firefighters
46 $329,900 $86,061 2 $1,143 Streets and Highways
31 $140,180 $54,263 0 $0 Parks and Recreation
23 $81,685 $42,618 4 $2,325 Other Government Administration
18 $80,773 $53,849 7 $6,563 Water Supply
17 $63,705 $44,968 0 $0 Financial Administration
15 $59,611 $47,689 0 $0 Sewerage
15 $59,965 $47,972 1 $1,260 Other and Unallocable
14 $60,926 $52,222 0 $0 Police - Other
13 $46,006 $42,467 0 $0 Local Libraries
11 $42,590 $46,462 6 $6,895 Solid Waste Management
3 $9,216 $36,864 0 $0 Airports
2 $8,877 $53,262 0 $0 Fire - Other
1 $3,020 $36,240 0 $0
Totals for Government
285 $1,437,501 $60,526 20 $18,186
Caldwell government finances - Expenditure in 2021 (per resident):
Construction - Local Fire Protection: $3,330,000 ($50.52)
Regular Highways: $2,449,000 ($37.15)Sewerage: $1,953,000 ($29.63)General Public Buildings: $1,461,000 ($22.16)Parks and Recreation: $1,153,000 ($17.49)Natural Resources - Other: $679,000 ($10.30)Water Utilities: $605,000 ($9.18)Air Transportation: $353,000 ($5.35)Police Protection: $35,000 ($0.53)Current Operations - Police Protection: $10,790,000 ($163.68)
Sewerage: $8,108,000 ($123.00)Local Fire Protection: $6,888,000 ($104.49)Solid Waste Management: $5,119,000 ($77.65)Regular Highways: $4,755,000 ($72.13)Water Utilities: $4,533,000 ($68.77)Parks and Recreation: $3,263,000 ($49.50)General Public Buildings: $1,763,000 ($26.74)General - Other: $1,504,000 ($22.82)Natural Resources - Other: $1,490,000 ($22.60)Central Staff Services: $1,401,000 ($21.25)Protective Inspection and Regulation - Other: $1,156,000 ($17.54)Libraries: $1,119,000 ($16.98)Air Transportation: $868,000 ($13.17)Housing and Community Development: $695,000 ($10.54)Financial Administration: $317,000 ($4.81)Miscellaneous Commercial Activities - Other: $278,000 ($4.22)Judicial and Legal Services: $209,000 ($3.17)General - Interest on Debt: $106,000 ($1.61)
Intergovernmental to Local - Other - Judicial and Legal Services: $311,000 ($4.72)
Other - General - Other: $300,000 ($4.55)Other Capital Outlay - Air Transportation: $1,962,000 ($29.76)
Regular Highways: $1,161,000 ($17.61)Parks and Recreation: $876,000 ($13.29)Police Protection: $333,000 ($5.05)Solid Waste Management: $282,000 ($4.28)Water Utilities: $267,000 ($4.05)Local Fire Protection: $101,000 ($1.53)Sewerage: $95,000 ($1.44)General - Other: $28,000 ($0.42)Total Salaries and Wages: $25,061,000 ($380.17)
Caldwell government finances - Revenue in 2021 (per resident):
Charges - Sewerage: $12,778,000 ($193.84)
Solid Waste Management: $4,826,000 ($73.21)Natural Resources - Other: $1,582,000 ($24.00)Parks and Recreation: $1,431,000 ($21.71)Regular Highways: $659,000 ($10.00)Air Transportation: $239,000 ($3.63)Miscellaneous Commercial Activities: $164,000 ($2.49)Federal Intergovernmental - General Local Government Support: $738,000 ($11.20)
Housing and Community Development: $657,000 ($9.97)Air Transportation: $397,000 ($6.02)Highways: $2,000 ($0.03)Local Intergovernmental - Other: $4,275,000 ($64.85)
General Local Government Support: $2,696,000 ($40.90)Highways: $450,000 ($6.83)Miscellaneous - Interest Earnings: $1,042,000 ($15.81)
Special Assessments: $335,000 ($5.08)Rents: $200,000 ($3.03)Fines and Forfeits: $191,000 ($2.90)Sale of Property: $152,000 ($2.31)Donations From Private Sources: $96,000 ($1.46)Revenue - Water Utilities: $5,984,000 ($90.78)
State Intergovernmental - General Local Government Support: $4,126,000 ($62.59)
Highways: $3,736,000 ($56.67)Other: $57,000 ($0.86)Tax - Property: $18,642,000 ($282.80)
Other License: $2,810,000 ($42.63)Alcoholic Beverage License: $37,000 ($0.56)Occupation and Business License - Other: $3,000 ($0.05)
Caldwell government finances - Debt in 2021 (per resident):
Long Term Debt - Beginning Outstanding - Public Debt for Private Purpose: $1,681,000 ($25.50)
Outstanding Nonguaranteed - Industrial Revenue: $1,069,000 ($16.22)Retired Unspecified Public Purpose: $1,050,000 ($15.93)Beginning Outstanding - Unspecified Public Purpose: $1,050,000 ($15.93)Retired Nonguaranteed - Public Debt for Private Purpose: $611,000 ($9.27)
Caldwell government finances - Cash and Securities in 2021 (per resident):
Other Funds - Cash and Securities: $71,805,000 ($1089.27)
Sinking Funds - Cash and Securities: $1,069,000 ($16.22)
Businesses in Caldwell, ID
Name Count Name Count
AT&T 3 McDonald's 2 Albertsons 2 Papa John's Pizza 1 AutoZone 1 Payless 1 Best Western 1 Penske 1 Carl\s Jr. 1 Pizza Hut 1 Cricket Wireless 1 Quiznos 1 Curves 1 RadioShack 1 Dairy Queen 1 Rite Aid 1 Dennys 1 SONIC Drive-In 1 Domino's Pizza 1 Sprint Nextel 1 FedEx 6 Subaru 1 GNC 1 Subway 3 GameStop 1 T-Mobile 2 H&R Block 3 Taco Bell 1 Jack In The Box 1 True Value 1 KFC 2 U-Haul 6 La Quinta 1 UPS 6 Lane Furniture 2 Walgreens 2 Little Caesars Pizza 1 Walmart 1 MasterBrand Cabinets 2 Wendy's 1 Mazda 1 YMCA 1
Strongest AM radio stations in Caldwell:
KCID (1490 AM; 1 kW; CALDWELL, ID; Owner: JOURNAL BROADCAST CORPORATION)
KBGN (1060 AM; daytime; 10 kW; CALDWELL, ID; Owner: NELSON M. AND KAREN E. WILSON)
KBOI (670 AM; 50 kW; BOISE, ID; Owner: CITADEL BROADCASTING COMPANY)
KBSU (730 AM; 15 kW; BOISE, ID; Owner: IDAHO STATE BOARD OF EDUCATION)
KKIC (950 AM; 4 kW; BOISE, ID; Owner: WESTERN PACIFIC, INC)
KIDO (580 AM; 5 kW; NAMPA, ID; Owner: CITICASTERS LICENSES, L.P.)
KWEI (1260 AM; 50 kW; WEISER, ID; Owner: TREASURE VALLEY BROADCASTING CO.)
KGEM (1140 AM; 10 kW; BOISE, ID; Owner: JOURNAL BROADCAST CORPORATION)
KFXD (630 AM; 5 kW; BOISE, ID; Owner: CITICASTERS LICENSES, L.P.)
KTIK (1350 AM; 5 kW; NAMPA, ID; Owner: CITADEL BROADCASTING COMPANY)
KSRV (1380 AM; 5 kW; ONTARIO, OR; Owner: HBG-RADIO ONTARIO LLC)
KSPD (790 AM; 1 kW; BOISE, ID; Owner: KSPD, INC.)
KIOV (1450 AM; 1 kW; PAYETTE, ID; Owner: ASSOCIATES COMMUNICATIONS OF IDAHO,)
Strongest FM radio stations in Caldwell:
KJHY (101.9 FM; EMMETT, ID; Owner: CAPITAL WEST INC)
KWEI-FM (99.5 FM; FRUITLAND, ID; Owner: TREASURE VALLEY BROADCASTING CO.)
KIZN (92.3 FM; BOISE, ID; Owner: CITADEL BROADCASTING COMPANY)
KKGL (96.9 FM; NAMPA, ID; Owner: CITADEL BROADCASTING COMPANY)
KQFC (97.9 FM; BOISE, ID; Owner: CITADEL BROADCASTING COMPANY)
KZMG (93.1 FM; NEW PLYMOUTH, ID; Owner: CITADEL BROADCASTING COMPANY)
KBSU-FM (90.3 FM; BOISE, ID; Owner: IDAHO STATE BOARD OF EDUCATION)
KBSX (91.5 FM; BOISE, ID; Owner: IDAHO STATE BOARD OF EDUCATION)
KCIX (105.9 FM; GARDEN CITY, ID; Owner: CITICASTERS LICENSES, L.P.)
KRVB (94.9 FM; NAMPA, ID; Owner: JOURNAL BROADCAST CORPORATION)
KXLT-FM (107.9 FM; EAGLE, ID; Owner: CITICASTERS LICENSES, L.P.)
KJOT (105.1 FM; BOISE, ID; Owner: JOURNAL BROADCAST CORPORATION)
KTHI (107.1 FM; CALDWELL, ID; Owner: JOURNAL BROADCAST CORPORATION)
KBXL (94.1 FM; CALDWELL, ID; Owner: KSPD, INC.)
KTSY (89.5 FM; CALDWELL, ID; Owner: GEM STATE ADVENTIST ACADEMY)
KSAS-FM (103.3 FM; CALDWELL, ID; Owner: CITICASTERS LICENSES, L.P.)
KLTB (104.3 FM; BOISE, ID; Owner: CITICASTERS LICENSES, L.P.)
KQXR (100.3 FM; PAYETTE, ID; Owner: JOURNAL BROADCAST CORPORATION)
KSRV-FM (96.1 FM; ONTARIO, OR; Owner: HBG-RADIO ONTARIO LLC)
KARO (98.7 FM; NYSSA, OR; Owner: EDUCATIONAL MEDIA FOUNDATION)
TV broadcast stations around Caldwell:
KTRV (Channel 12; NAMPA, ID; Owner: IDAHO INDEPENDENT TELEVISION, INC.)
K30GS (Channel 30; BOISE, ID; Owner: MS COMMUNICATIONS, LLC)
National Bridge Inventory (NBI) Statistics 84 Number of bridges614ft / 187m Total length $38,598,000 Total costs866,223 Total average daily traffic92,333 Total average daily truck traffic
New bridges - historical statistics
1 1920-1929 7 1930-1939 3 1940-1949 2 1950-1959 22 1960-1969 10 1970-1979 14 1980-1989 6 1990-1999 14 2000-2009 4 2010-2019 1 2020-2022
See full National Bridge Inventory statistics for Caldwell, ID
Home Mortgage Disclosure Act Aggregated Statistics For Year 2009(Based on 3 full and 3 partial tracts) A) FHA, FSA/RHS & VA B) Conventional C) Refinancings D) Home Improvement Loans E) Loans on Dwellings For 5+ Families F) Non-occupant Loans on G) Loans On Manufactured Number Average Value Number Average Value Number Average Value Number Average Value Number Average Value Number Average Value Number Average Value
LOANS ORIGINATED 121 $98,054 58 $69,603 201 $118,582 11 $89,276 1 $158,000 33 $79,051 2 $108,450 APPLICATIONS APPROVED, NOT ACCEPTED 7 $107,397 1 $94,710 49 $121,630 4 $48,268 0 $0 4 $84,732 2 $98,010 APPLICATIONS DENIED 22 $94,865 16 $87,144 200 $110,248 14 $49,896 0 $0 19 $119,528 12 $80,683 APPLICATIONS WITHDRAWN 17 $105,151 10 $73,029 91 $117,714 5 $59,470 0 $0 13 $82,338 5 $93,346 FILES CLOSED FOR INCOMPLETENESS 2 $84,475 2 $63,205 28 $103,845 4 $60,038 0 $0 5 $119,376 1 $35,890
Aggregated Statistics For Year 2008(Based on 3 full and 3 partial tracts) A) FHA, FSA/RHS & VA B) Conventional C) Refinancings D) Home Improvement Loans E) Loans on Dwellings For 5+ Families F) Non-occupant Loans on G) Loans On Manufactured Number Average Value Number Average Value Number Average Value Number Average Value Number Average Value Number Average Value Number Average Value
LOANS ORIGINATED 97 $126,548 96 $121,769 273 $120,539 20 $75,434 3 $520,700 70 $115,305 7 $96,241 APPLICATIONS APPROVED, NOT ACCEPTED 11 $84,738 21 $134,978 72 $117,650 8 $82,019 0 $0 15 $129,705 1 $136,650 APPLICATIONS DENIED 28 $144,890 30 $98,227 315 $129,307 69 $73,011 2 $236,500 33 $101,341 18 $46,919 APPLICATIONS WITHDRAWN 8 $117,564 17 $131,956 100 $130,592 13 $93,528 0 $0 17 $127,138 2 $113,930 FILES CLOSED FOR INCOMPLETENESS 3 $90,317 2 $192,365 28 $113,558 5 $54,304 0 $0 5 $142,686 1 $22,400
Aggregated Statistics For Year 2007(Based on 3 full and 3 partial tracts) A) FHA, FSA/RHS & VA B) Conventional C) Refinancings D) Home Improvement Loans F) Non-occupant Loans on G) Loans On Manufactured Number Average Value Number Average Value Number Average Value Number Average Value Number Average Value Number Average Value
LOANS ORIGINATED 46 $142,191 375 $128,028 447 $118,726 50 $56,065 181 $122,467 12 $84,770 APPLICATIONS APPROVED, NOT ACCEPTED 4 $122,902 56 $135,704 82 $119,861 15 $61,004 26 $119,039 1 $59,500 APPLICATIONS DENIED 16 $129,990 113 $137,134 325 $120,533 98 $74,686 79 $130,243 12 $72,754 APPLICATIONS WITHDRAWN 11 $153,409 55 $121,935 122 $118,430 23 $80,998 27 $106,970 7 $68,100 FILES CLOSED FOR INCOMPLETENESS 0 $0 14 $137,138 32 $131,672 4 $64,915 9 $135,510 0 $0
Aggregated Statistics For Year 2006(Based on 3 full and 3 partial tracts) A) FHA, FSA/RHS & VA B) Conventional C) Refinancings D) Home Improvement Loans E) Loans on Dwellings For 5+ Families F) Non-occupant Loans on G) Loans On Manufactured Number Average Value Number Average Value Number Average Value Number Average Value Number Average Value Number Average Value Number Average Value
LOANS ORIGINATED 90 $128,407 773 $94,388 498 $103,335 50 $58,501 2 $1,393,700 330 $87,236 21 $75,166 APPLICATIONS APPROVED, NOT ACCEPTED 14 $117,219 118 $98,077 79 $108,253 12 $86,449 0 $0 44 $104,887 9 $45,627 APPLICATIONS DENIED 15 $129,751 202 $89,560 300 $99,085 77 $63,484 0 $0 83 $80,964 26 $68,880 APPLICATIONS WITHDRAWN 13 $125,418 121 $102,130 195 $101,739 16 $63,434 0 $0 52 $104,586 2 $86,555 FILES CLOSED FOR INCOMPLETENESS 0 $0 19 $107,256 34 $106,591 2 $44,770 0 $0 3 $143,337 1 $54,720
Aggregated Statistics For Year 2005(Based on 3 full and 3 partial tracts) A) FHA, FSA/RHS & VA B) Conventional C) Refinancings D) Home Improvement Loans E) Loans on Dwellings For 5+ Families F) Non-occupant Loans on G) Loans On Manufactured Number Average Value Number Average Value Number Average Value Number Average Value Number Average Value Number Average Value Number Average Value
LOANS ORIGINATED 89 $99,568 781 $76,561 306 $89,523 41 $34,465 3 $483,613 284 $76,871 14 $67,090 APPLICATIONS APPROVED, NOT ACCEPTED 9 $81,933 100 $75,876 71 $86,587 3 $18,417 0 $0 29 $76,595 8 $78,756 APPLICATIONS DENIED 18 $87,502 204 $72,609 315 $86,078 59 $35,557 3 $683,150 82 $77,330 31 $61,405 APPLICATIONS WITHDRAWN 9 $93,768 127 $88,985 202 $94,047 22 $102,703 0 $0 44 $87,049 6 $91,552 FILES CLOSED FOR INCOMPLETENESS 2 $83,785 21 $66,111 41 $104,391 3 $40,080 0 $0 6 $101,083 0 $0
Aggregated Statistics For Year 2004(Based on 3 full and 3 partial tracts) A) FHA, FSA/RHS & VA B) Conventional C) Refinancings D) Home Improvement Loans E) Loans on Dwellings For 5+ Families F) Non-occupant Loans on G) Loans On Manufactured Number Average Value Number Average Value Number Average Value Number Average Value Number Average Value Number Average Value Number Average Value
LOANS ORIGINATED 110 $90,884 423 $69,773 366 $82,512 35 $35,371 1 $453,190 178 $71,375 16 $49,007 APPLICATIONS APPROVED, NOT ACCEPTED 12 $91,005 70 $71,875 93 $82,572 5 $45,476 0 $0 23 $72,194 7 $40,644 APPLICATIONS DENIED 17 $85,723 124 $73,109 299 $80,366 40 $28,234 0 $0 39 $77,043 38 $63,222 APPLICATIONS WITHDRAWN 8 $83,740 41 $64,010 149 $86,902 8 $38,514 0 $0 26 $58,912 4 $86,920 FILES CLOSED FOR INCOMPLETENESS 6 $100,622 6 $73,303 33 $93,752 5 $26,750 0 $0 4 $94,790 0 $0
Aggregated Statistics For Year 2003(Based on 3 full and 3 partial tracts) A) FHA, FSA/RHS & VA B) Conventional C) Refinancings D) Home Improvement Loans E) Loans on Dwellings For 5+ Families F) Non-occupant Loans on Number Average Value Number Average Value Number Average Value Number Average Value Number Average Value Number Average Value
LOANS ORIGINATED 141 $92,032 293 $77,575 608 $84,444 23 $27,220 2 $138,860 163 $68,453 APPLICATIONS APPROVED, NOT ACCEPTED 11 $79,925 54 $82,572 102 $78,552 17 $19,023 0 $0 33 $61,630 APPLICATIONS DENIED 18 $79,272 114 $75,663 284 $76,752 30 $16,953 0 $0 39 $58,508 APPLICATIONS WITHDRAWN 17 $92,116 31 $78,584 129 $84,505 5 $14,752 0 $0 14 $81,783 FILES CLOSED FOR INCOMPLETENESS 2 $88,735 6 $104,430 24 $80,918 1 $28,380 0 $0 4 $80,768
Aggregated Statistics For Year 2002(Based on 3 full and 3 partial tracts) A) FHA, FSA/RHS & VA B) Conventional C) Refinancings D) Home Improvement Loans E) Loans on Dwellings For 5+ Families F) Non-occupant Loans on Number Average Value Number Average Value Number Average Value Number Average Value Number Average Value Number Average Value
LOANS ORIGINATED 136 $86,034 298 $68,788 387 $83,967 19 $15,170 1 $2,005,240 148 $65,155 APPLICATIONS APPROVED, NOT ACCEPTED 5 $66,622 63 $74,089 102 $82,080 11 $17,718 0 $0 23 $65,818 APPLICATIONS DENIED 14 $83,236 106 $66,592 171 $72,709 33 $10,767 0 $0 29 $60,716 APPLICATIONS WITHDRAWN 12 $82,839 15 $66,544 123 $80,977 1 $17,180 0 $0 12 $71,132 FILES CLOSED FOR INCOMPLETENESS 2 $86,020 16 $55,758 28 $86,546 0 $0 0 $0 3 $87,367
Aggregated Statistics For Year 2001(Based on 3 full and 3 partial tracts) A) FHA, FSA/RHS & VA B) Conventional C) Refinancings D) Home Improvement Loans E) Loans on Dwellings For 5+ Families F) Non-occupant Loans on Number Average Value Number Average Value Number Average Value Number Average Value Number Average Value Number Average Value
LOANS ORIGINATED 161 $83,466 197 $71,123 317 $76,824 31 $13,703 1 $2,000,000 85 $65,304 APPLICATIONS APPROVED, NOT ACCEPTED 5 $82,088 51 $59,602 48 $80,847 5 $30,176 0 $0 4 $55,135 APPLICATIONS DENIED 12 $80,630 133 $58,029 176 $62,038 47 $17,763 0 $0 13 $67,942 APPLICATIONS WITHDRAWN 5 $78,210 42 $59,523 115 $76,186 9 $20,913 0 $0 10 $61,590 FILES CLOSED FOR INCOMPLETENESS 0 $0 10 $71,971 27 $75,673 0 $0 0 $0 2 $53,140
Aggregated Statistics For Year 2000(Based on 3 full and 3 partial tracts) A) FHA, FSA/RHS & VA B) Conventional C) Refinancings D) Home Improvement Loans E) Loans on Dwellings For 5+ Families F) Non-occupant Loans on Number Average Value Number Average Value Number Average Value Number Average Value Number Average Value Number Average Value
LOANS ORIGINATED 114 $77,842 204 $71,127 123 $67,520 43 $14,836 2 $186,905 37 $57,440 APPLICATIONS APPROVED, NOT ACCEPTED 18 $50,242 70 $57,414 44 $65,975 19 $15,165 0 $0 14 $64,311 APPLICATIONS DENIED 31 $58,821 222 $52,935 169 $58,919 48 $25,291 0 $0 26 $57,631 APPLICATIONS WITHDRAWN 17 $69,398 22 $61,053 63 $65,683 9 $57,220 0 $0 10 $56,292 FILES CLOSED FOR INCOMPLETENESS 1 $96,790 6 $63,428 27 $58,576 2 $20,710 0 $0 2 $67,735
Aggregated Statistics For Year 1999(Based on 4 full and 3 partial tracts) A) FHA, FSA/RHS & VA B) Conventional C) Refinancings D) Home Improvement Loans E) Loans on Dwellings For 5+ Families F) Non-occupant Loans on Number Average Value Number Average Value Number Average Value Number Average Value Number Average Value Number Average Value
LOANS ORIGINATED 108 $77,618 201 $69,509 259 $66,376 62 $18,315 1 $81,760 64 $64,765 APPLICATIONS APPROVED, NOT ACCEPTED 7 $70,391 60 $60,438 86 $60,525 16 $13,913 0 $0 16 $59,042 APPLICATIONS DENIED 14 $79,019 310 $51,326 183 $61,294 43 $19,065 0 $0 34 $68,602 APPLICATIONS WITHDRAWN 4 $74,630 32 $72,256 117 $66,528 12 $49,489 1 $866,600 9 $53,948 FILES CLOSED FOR INCOMPLETENESS 0 $0 15 $85,318 28 $68,606 2 $13,420 0 $0 7 $65,473
Detailed HMDA statistics for the following Tracts:
0212.00
, 0213.00 , 0215.00 , 0216.00 , 0217.00 , 0218.00
Private Mortgage Insurance Companies Aggregated Statistics For Year 2009(Based on 3 full and 3 partial tracts) A) Conventional B) Refinancings Number Average Value Number Average Value
LOANS ORIGINATED 9 $98,931 4 $168,045 APPLICATIONS APPROVED, NOT ACCEPTED 3 $97,797 0 $0 APPLICATIONS DENIED 1 $161,790 1 $85,850 APPLICATIONS WITHDRAWN 1 $69,100 0 $0 FILES CLOSED FOR INCOMPLETENESS 0 $0 0 $0
Aggregated Statistics For Year 2008(Based on 3 full and 3 partial tracts) A) Conventional B) Refinancings C) Non-occupant Loans on D) Loans On Manufactured Number Average Value Number Average Value Number Average Value Number Average Value
LOANS ORIGINATED 79 $138,687 27 $142,531 9 $107,559 1 $195,970 APPLICATIONS APPROVED, NOT ACCEPTED 38 $132,925 13 $139,112 6 $129,995 0 $0 APPLICATIONS DENIED 5 $123,306 4 $163,168 3 $143,300 0 $0 APPLICATIONS WITHDRAWN 2 $129,095 1 $176,490 0 $0 0 $0 FILES CLOSED FOR INCOMPLETENESS 2 $157,280 1 $99,280 2 $117,715 0 $0
Aggregated Statistics For Year 2007(Based on 3 full and 3 partial tracts) A) Conventional B) Refinancings C) Non-occupant Loans on D) Loans On Manufactured Number Average Value Number Average Value Number Average Value Number Average Value
LOANS ORIGINATED 196 $140,202 46 $149,374 18 $129,299 1 $155,280 APPLICATIONS APPROVED, NOT ACCEPTED 26 $143,981 9 $170,174 1 $154,990 0 $0 APPLICATIONS DENIED 3 $154,377 0 $0 0 $0 0 $0 APPLICATIONS WITHDRAWN 8 $152,748 1 $163,230 0 $0 0 $0 FILES CLOSED FOR INCOMPLETENESS 0 $0 0 $0 0 $0 0 $0
Aggregated Statistics For Year 2006(Based on 3 full and 3 partial tracts) A) Conventional B) Refinancings C) Non-occupant Loans on Number Average Value Number Average Value Number Average Value
LOANS ORIGINATED 100 $119,053 19 $150,147 21 $101,713 APPLICATIONS APPROVED, NOT ACCEPTED 6 $116,722 5 $130,868 0 $0 APPLICATIONS DENIED 0 $0 0 $0 0 $0 APPLICATIONS WITHDRAWN 5 $140,248 3 $102,767 2 $167,045 FILES CLOSED FOR INCOMPLETENESS 0 $0 0 $0 0 $0
Aggregated Statistics For Year 2005(Based on 3 full and 3 partial tracts) A) Conventional B) Refinancings C) Non-occupant Loans on Number Average Value Number Average Value Number Average Value
LOANS ORIGINATED 83 $103,233 34 $114,442 33 $88,845 APPLICATIONS APPROVED, NOT ACCEPTED 12 $95,843 7 $116,934 4 $70,962 APPLICATIONS DENIED 0 $0 0 $0 0 $0 APPLICATIONS WITHDRAWN 0 $0 0 $0 0 $0 FILES CLOSED FOR INCOMPLETENESS 0 $0 2 $78,840 1 $89,000
Aggregated Statistics For Year 2004(Based on 3 full and 3 partial tracts) A) Conventional B) Refinancings C) Non-occupant Loans on D) Loans On Manufactured Number Average Value Number Average Value Number Average Value Number Average Value
LOANS ORIGINATED 74 $77,215 48 $103,598 33 $66,188 2 $61,960 APPLICATIONS APPROVED, NOT ACCEPTED 10 $71,042 7 $95,989 5 $65,706 0 $0 APPLICATIONS DENIED 3 $71,790 0 $0 0 $0 0 $0 APPLICATIONS WITHDRAWN 3 $90,330 3 $83,390 1 $102,530 0 $0 FILES CLOSED FOR INCOMPLETENESS 0 $0 0 $0 0 $0 0 $0
Aggregated Statistics For Year 2003(Based on 3 full and 3 partial tracts) A) Conventional B) Refinancings C) Non-occupant Loans on Number Average Value Number Average Value Number Average Value
LOANS ORIGINATED 81 $88,720 91 $95,275 42 $75,413 APPLICATIONS APPROVED, NOT ACCEPTED 9 $62,913 14 $90,826 9 $56,617 APPLICATIONS DENIED 2 $80,320 1 $66,440 0 $0 APPLICATIONS WITHDRAWN 4 $132,618 4 $79,955 1 $60,000 FILES CLOSED FOR INCOMPLETENESS 0 $0 0 $0 0 $0
Aggregated Statistics For Year 2002(Based on 3 full and 3 partial tracts) A) Conventional B) Refinancings C) Non-occupant Loans on Number Average Value Number Average Value Number Average Value
LOANS ORIGINATED 72 $81,932 72 $96,265 25 $79,537 APPLICATIONS APPROVED, NOT ACCEPTED 7 $78,061 7 $87,673 1 $40,810 APPLICATIONS DENIED 0 $0 2 $84,125 0 $0 APPLICATIONS WITHDRAWN 1 $44,090 1 $230,060 1 $44,090 FILES CLOSED FOR INCOMPLETENESS 0 $0 1 $146,380 0 $0
Aggregated Statistics For Year 2001(Based on 3 full and 3 partial tracts) A) Conventional B) Refinancings C) Non-occupant Loans on Number Average Value Number Average Value Number Average Value
LOANS ORIGINATED 59 $80,915 49 $101,573 14 $62,364 APPLICATIONS APPROVED, NOT ACCEPTED 5 $84,036 7 $108,591 0 $0 APPLICATIONS DENIED 0 $0 1 $128,230 1 $58,000 APPLICATIONS WITHDRAWN 1 $87,830 1 $101,410 0 $0 FILES CLOSED FOR INCOMPLETENESS 0 $0 0 $0 0 $0
Aggregated Statistics For Year 2000(Based on 3 full and 3 partial tracts) A) Conventional B) Refinancings C) Non-occupant Loans on Number Average Value Number Average Value Number Average Value
LOANS ORIGINATED 57 $92,167 16 $72,601 12 $78,067 APPLICATIONS APPROVED, NOT ACCEPTED 3 $91,130 1 $108,740 0 $0 APPLICATIONS DENIED 0 $0 2 $68,360 0 $0 APPLICATIONS WITHDRAWN 2 $82,910 3 $70,033 0 $0 FILES CLOSED FOR INCOMPLETENESS 0 $0 0 $0 0 $0
Aggregated Statistics For Year 1999(Based on 4 full and 3 partial tracts) A) Conventional B) Refinancings C) Non-occupant Loans on Number Average Value Number Average Value Number Average Value
LOANS ORIGINATED 53 $81,238 30 $93,140 12 $65,718 APPLICATIONS APPROVED, NOT ACCEPTED 3 $68,323 1 $85,630 1 $60,000 APPLICATIONS DENIED 1 $122,720 3 $87,060 1 $101,650 APPLICATIONS WITHDRAWN 0 $0 2 $83,240 0 $0 FILES CLOSED FOR INCOMPLETENESS 0 $0 2 $65,870 1 $51,210
Detailed PMIC statistics for the following Tracts:
0212.00
, 0213.00 , 0215.00 , 0216.00 , 0217.00 , 0218.00
Most common first names in Caldwell, ID among deceased individuals Name Count Lived (average)
John 183 75.8 years William 167 75.2 years Robert 154 72.7 years James 149 74.1 years Mary 141 81.4 years Charles 126 77.0 years George 109 78.6 years Helen 82 79.8 years Ruth 71 81.7 years Dorothy 64 78.2 years
Most common last names in Caldwell, ID among deceased individuals Last name Count Lived (average)
Smith 109 76.2 years Anderson 55 78.7 years Miller 49 77.6 years Davis 45 73.3 years Williams 39 79.7 years Wilson 37 78.3 years Brown 35 79.3 years Allen 34 77.9 years Johnson 33 76.2 years Taylor 33 76.2 years
Caldwell compared to Idaho state average:
Unemployed percentage below state average. Hispanic race population percentage significantly above state average. Median age significantly below state average. Foreign-born population percentage significantly above state average. House age below state average. Number of college students above state average.
#47 on the list of "Top 100 fastest growing cities from 2000 to 2014 (pop. 50,000+)"
#70 on the list of "Top 100 cities with youngest residents (pop. 50,000+)"
#77 on the list of "Top 100 highest located cities (pop. 50,000+)"
#93 on the list of "Top 101 cities with the most residents born in Other Southern Africa (population 500+)"
#9 on the list of "Top 101 counties with the highest percentage of residents that keep firearms around their homes"
#16 on the list of "Top 101 counties with the highest average weight of females"
#25 on the list of "Top 101 counties with the highest number of births per 1000 residents 2007-2013"
#26 on the list of "Top 101 counties with the lowest percentage of residents that drank alcohol in the past 30 days"
#44 on the list of "Top 101 counties with the lowest percentage of residents that visited a dentist within the past year"
Top Patent Applicants
Roger P. Reid (10)
J. Michael Brooks (9)
Christopher J. Gambee (9)
Jerry M. Brooks (8)
Mark Nelson (4)
William C Stewart (4)
Timothy Otter (4)
Michael Mcmillan (3)
Freddie W. Smith (3)
Carl M. Brooks (3)
Total of 104 patent applications in 2008-2024.


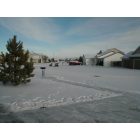
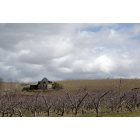
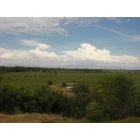
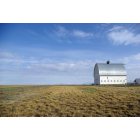


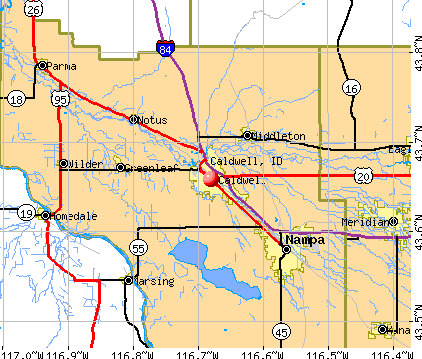


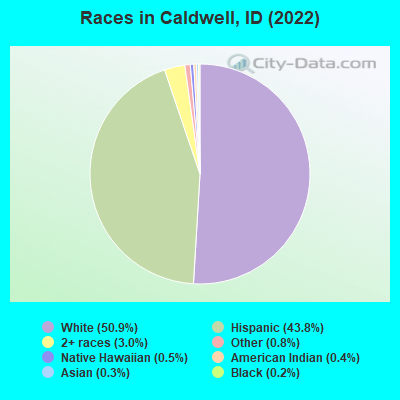
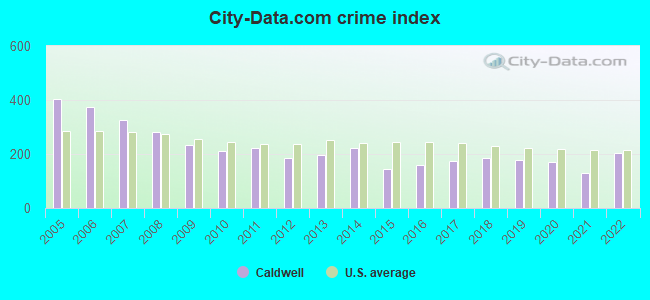
 Recent articles from our blog. Our writers, many of them Ph.D. graduates or candidates, create easy-to-read articles on a wide variety of topics.


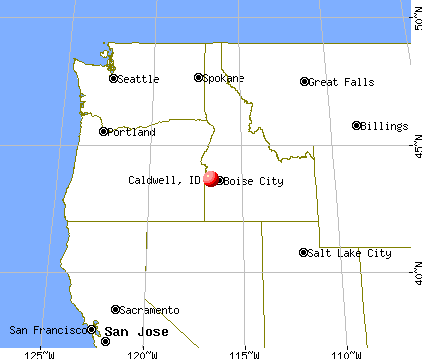
 (8.2 miles
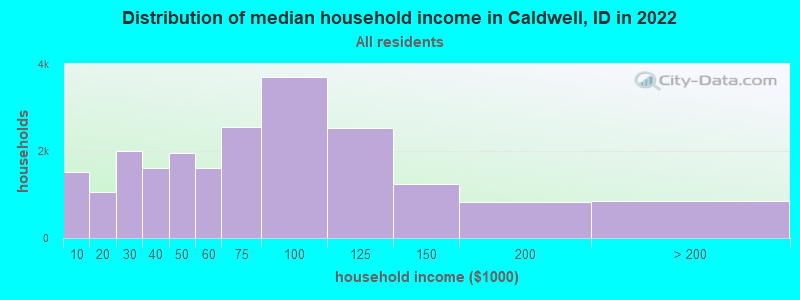
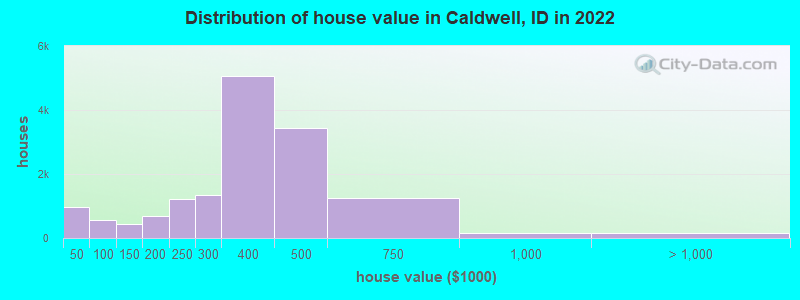
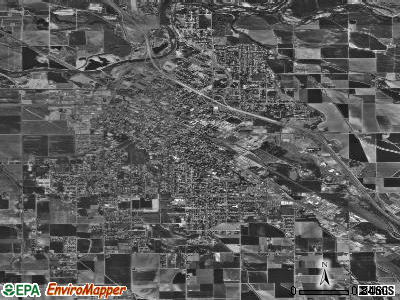
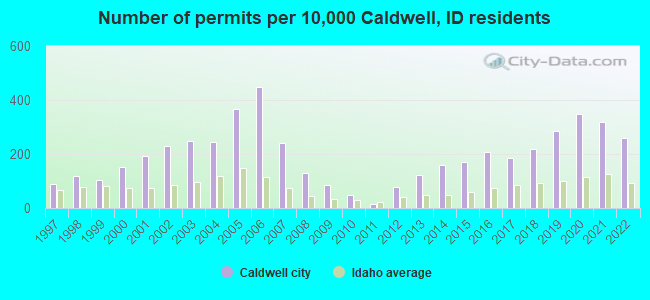
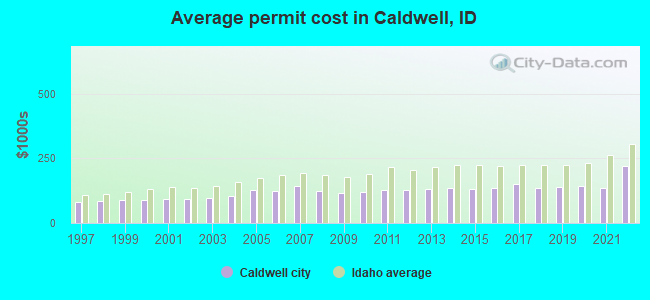
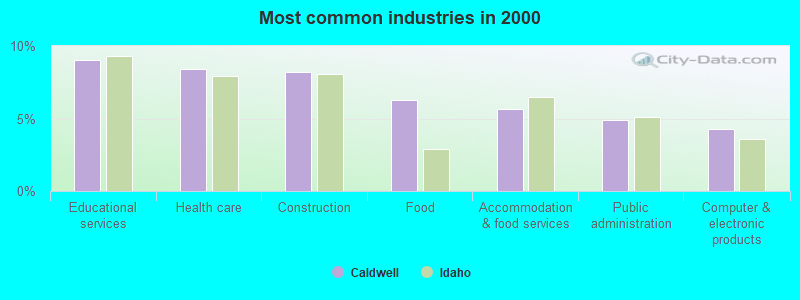
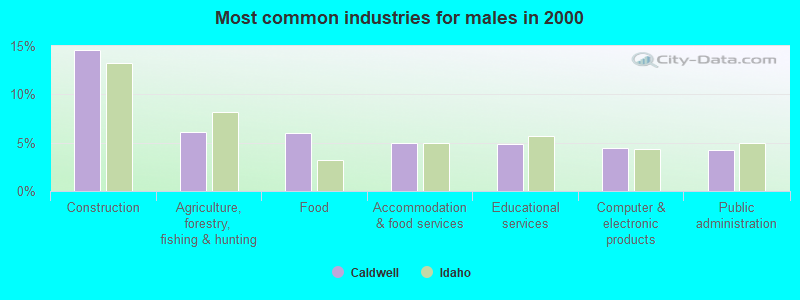
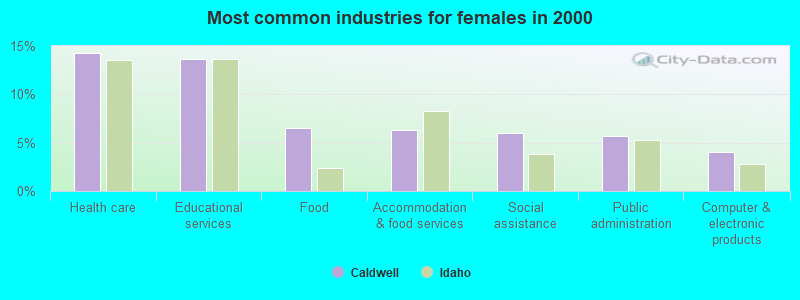
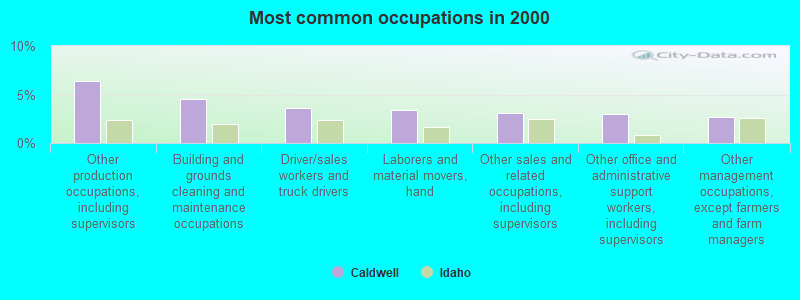
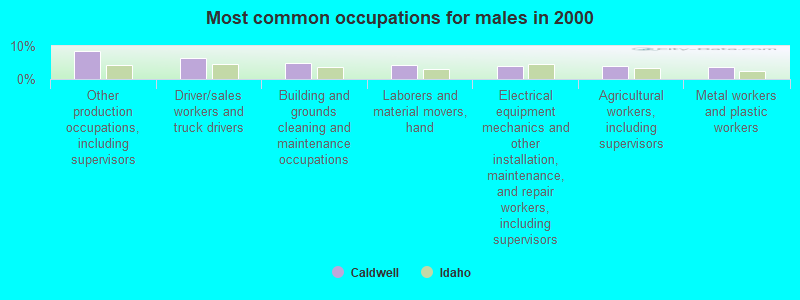
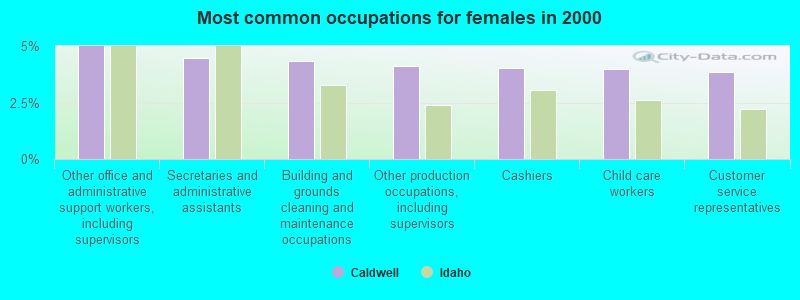
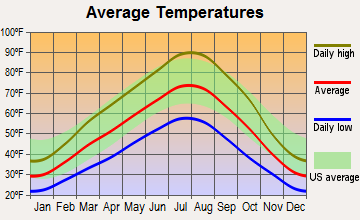
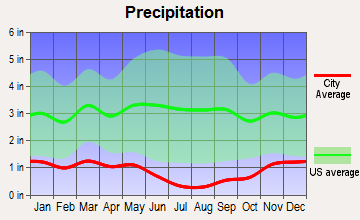
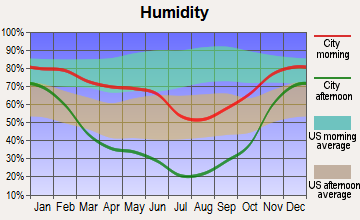
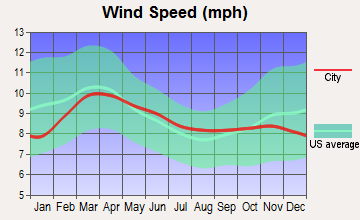
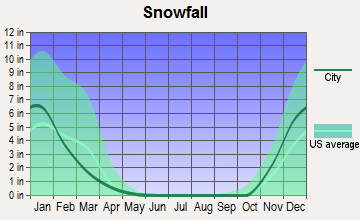
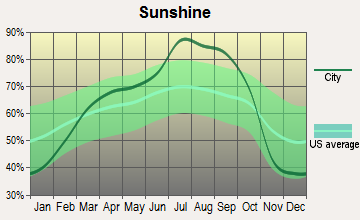
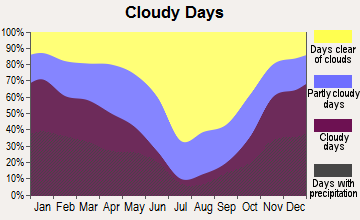


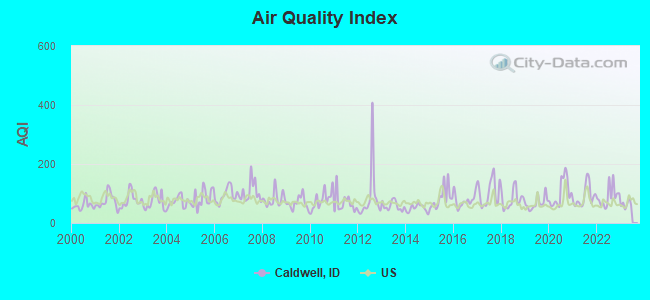
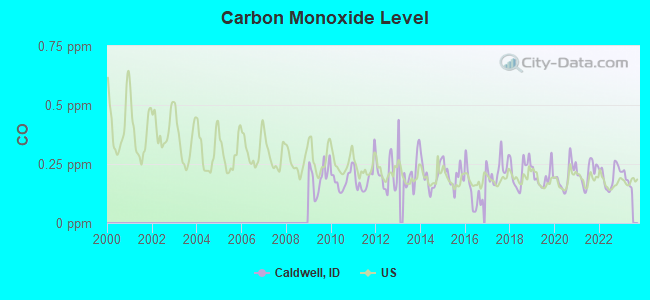
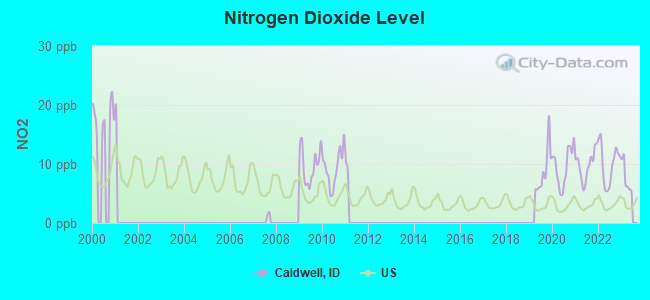
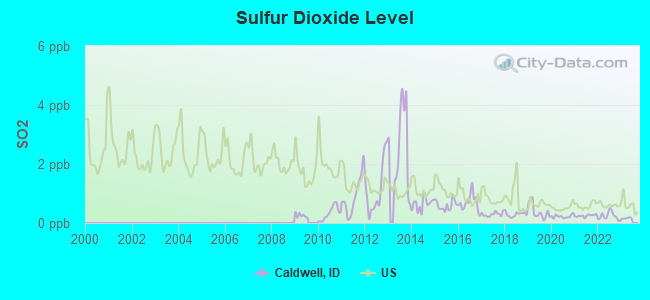
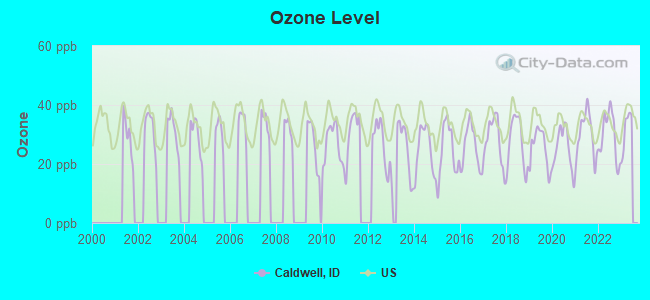
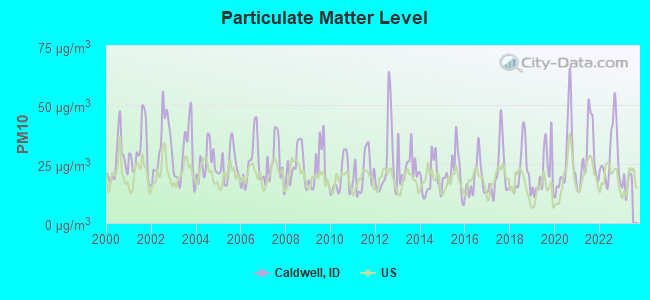
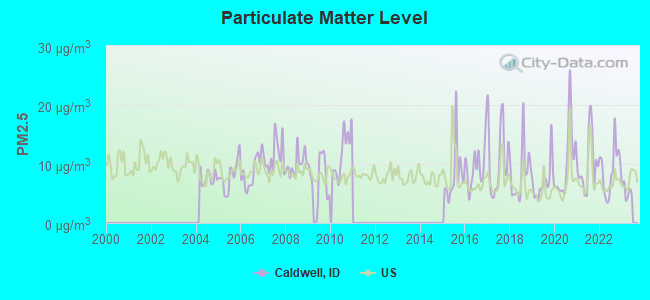
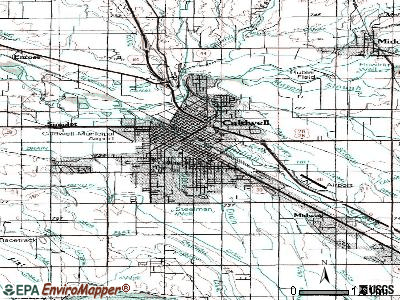
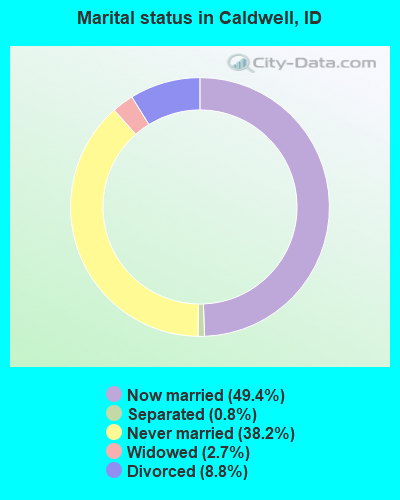
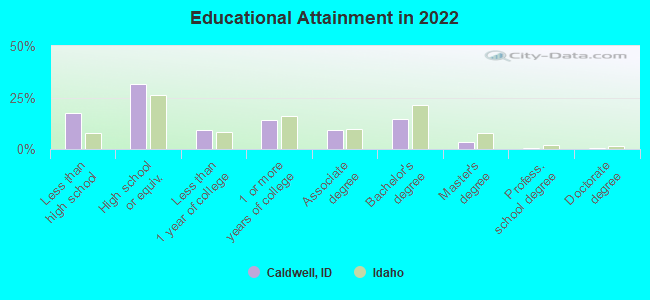
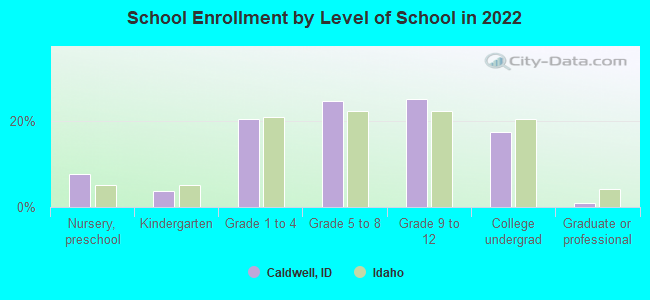
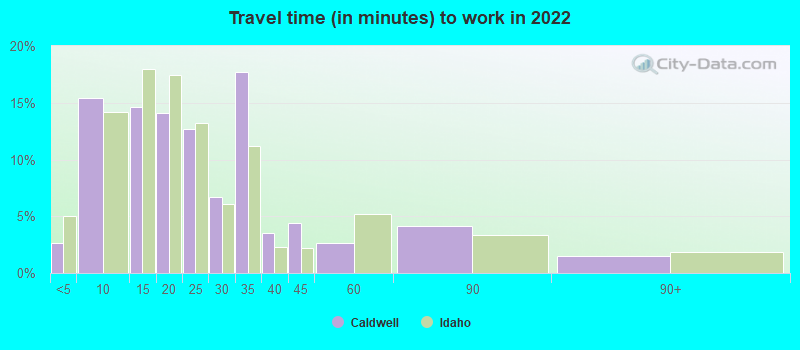
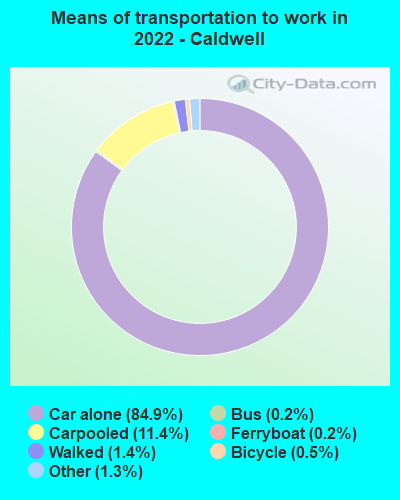
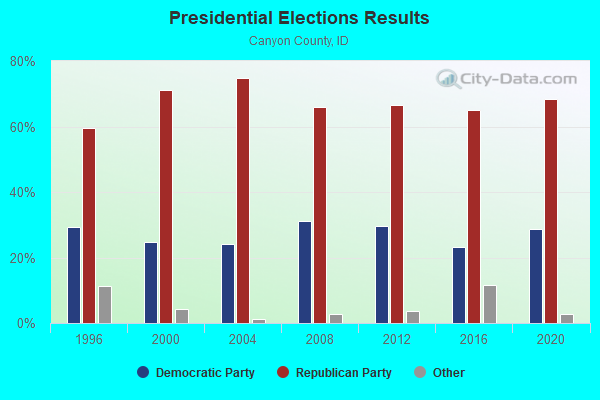
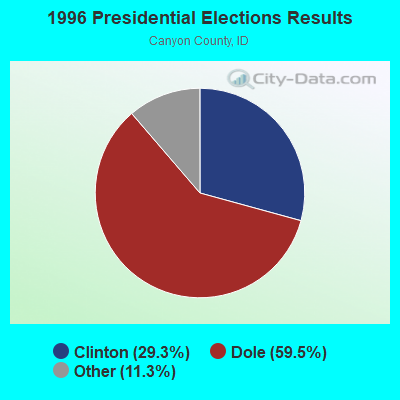
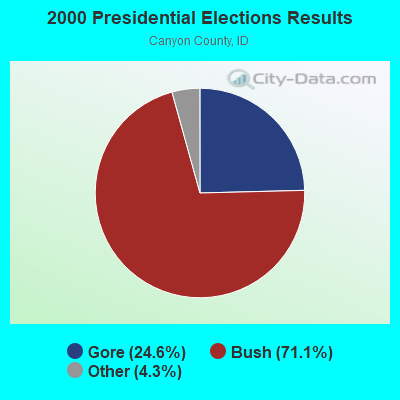
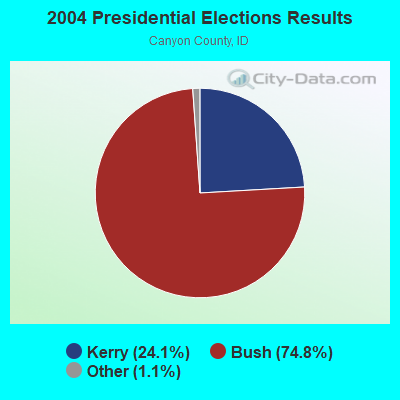
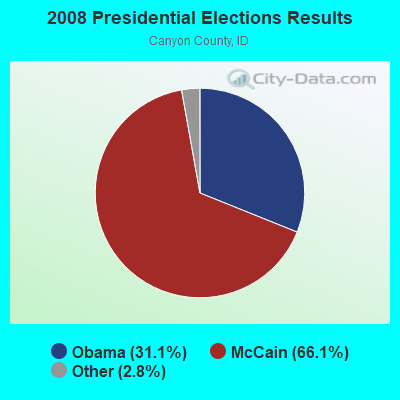
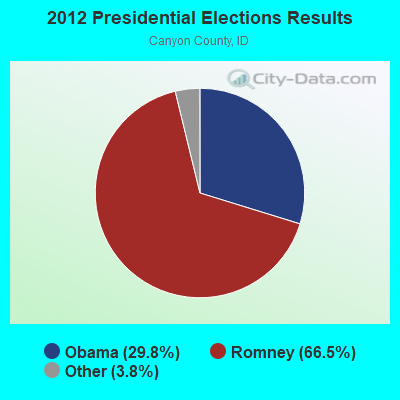
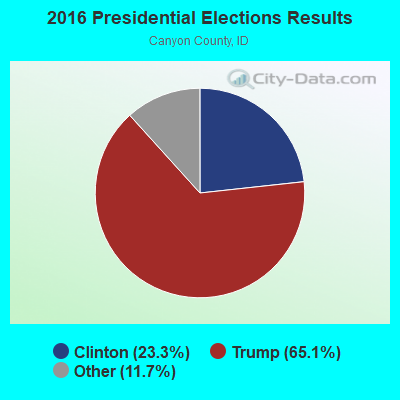
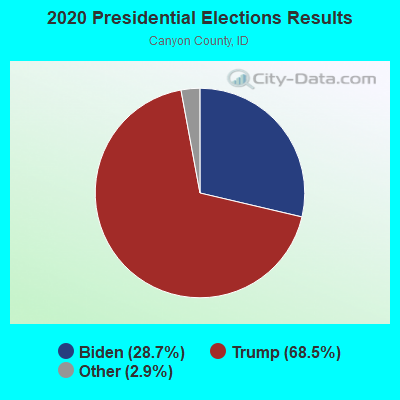
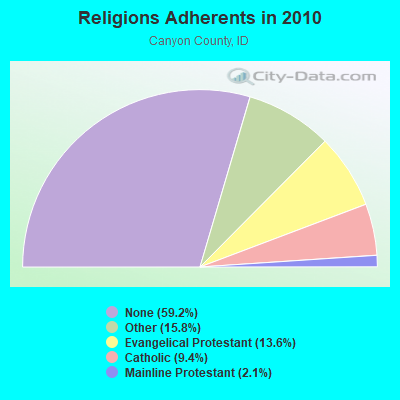
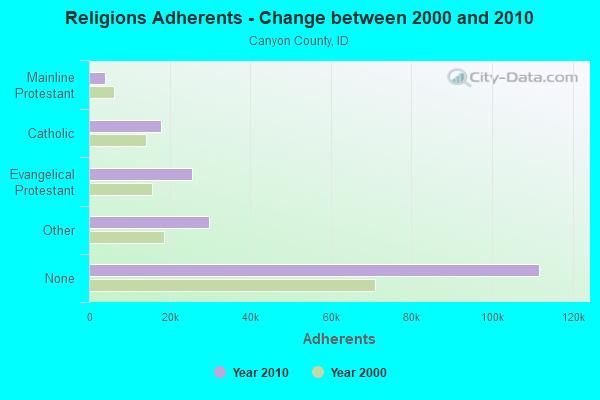
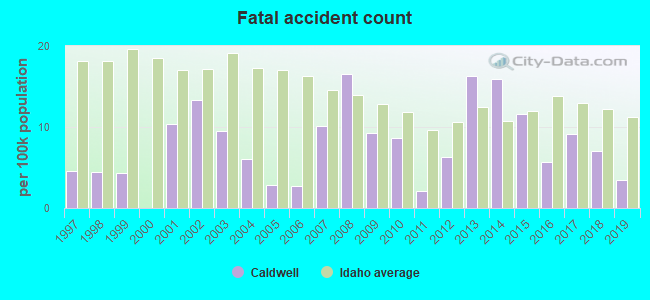
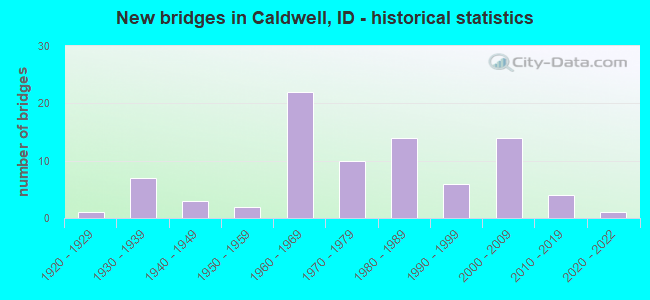
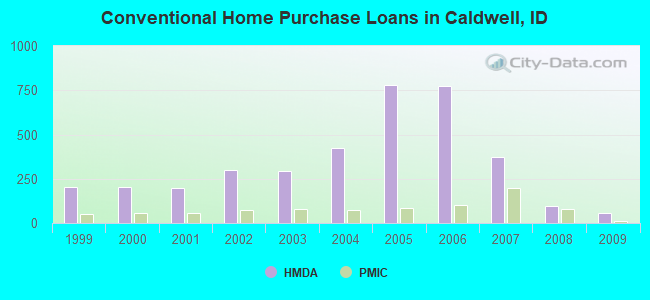
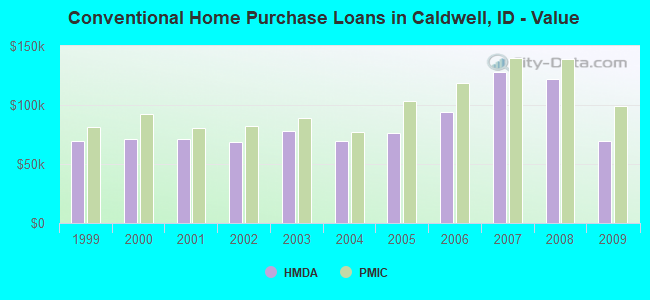
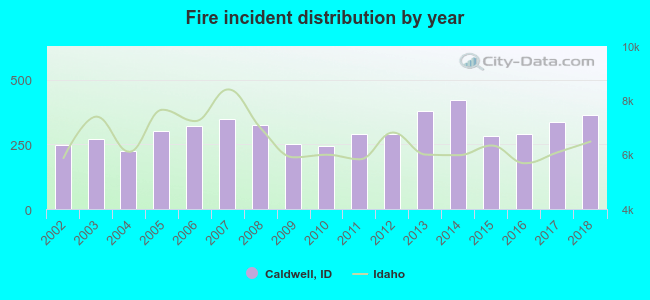 Based on the data from the years 2002 - 2018 the average number of fire incidents per year is 305. The highest number of reported fires - 420 took place in 2014, and the least - 224 in 2004. The data has a growing trend.
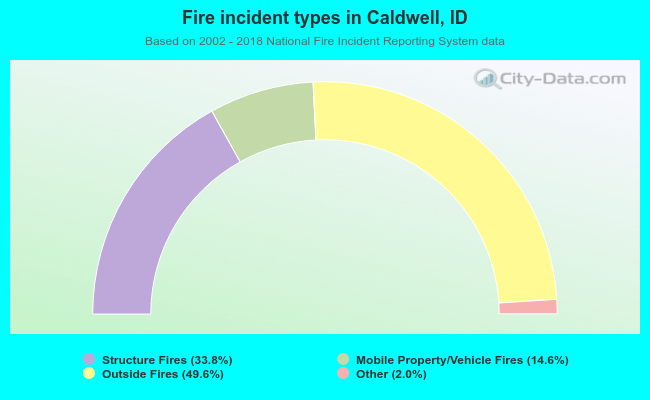 When looking into fire subcategories, the most reports belonged to: Outside Fires (49.6%), and Structure Fires (33.8%).