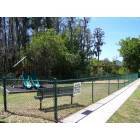
Citrus Park, Florida Submit your own pictures of this place and show them to the world
OSM Map
General Map
Google Map
MSN Map
OSM Map
General Map
Google Map
MSN Map
OSM Map
General Map
Google Map
MSN Map
OSM Map
General Map
Google Map
MSN Map
Please wait while loading the map...
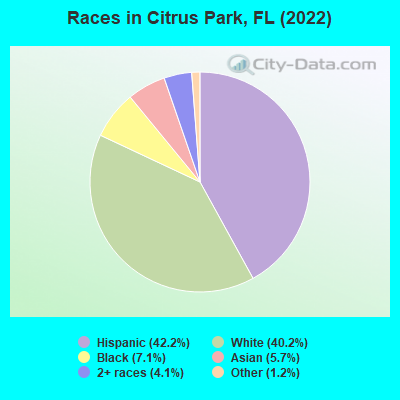
Population in 2010: 24,252. Population change since 2000: +19.9%Males: 11,099 Females: 13,153
March 2022 cost of living index in Citrus Park: 99.6 (near average, U.S. average is 100) Percentage of residents living in poverty in 2022: 12.2%for White Non-Hispanic residents , 17.8% for Black residents , 16.8% for Hispanic or Latino residents , 22.5% for other race residents , 5.5% for two or more races residents )
Profiles of local businesses
Business Search - 14 Million verified businesses
Data:
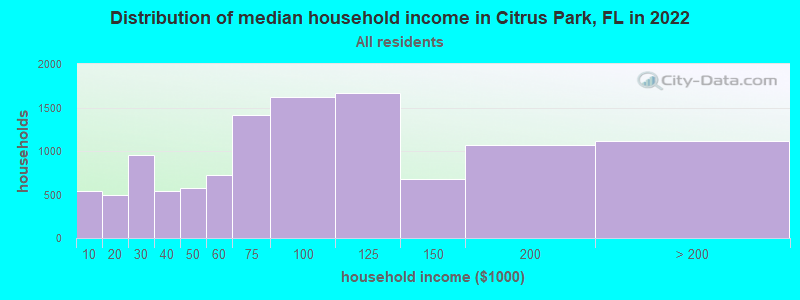
Median household income ($)
Median household income (% change since 2000)
Household income diversity
Ratio of average income to average house value (%)
Ratio of average income to average rent
Median household income ($) - White
Median household income ($) - Black or African American
Median household income ($) - Asian
Median household income ($) - Hispanic or Latino
Median household income ($) - American Indian and Alaska Native
Median household income ($) - Multirace
Median household income ($) - Other Race
Median household income for houses/condos with a mortgage ($)
Median household income for apartments without a mortgage ($)
Races - White alone (%)
Races - White alone (% change since 2000)
Races - Black alone (%)
Races - Black alone (% change since 2000)
Races - American Indian alone (%)
Races - American Indian alone (% change since 2000)
Races - Asian alone (%)
Races - Asian alone (% change since 2000)
Races - Hispanic (%)
Races - Hispanic (% change since 2000)
Races - Native Hawaiian and Other Pacific Islander alone (%)
Races - Native Hawaiian and Other Pacific Islander alone (% change since 2000)
Races - Two or more races (%)
Races - Two or more races (% change since 2000)
Races - Other race alone (%)
Races - Other race alone (% change since 2000)
Racial diversity
Unemployment (%)
Unemployment (% change since 2000)
Unemployment (%) - White
Unemployment (%) - Black or African American
Unemployment (%) - Asian
Unemployment (%) - Hispanic or Latino
Unemployment (%) - American Indian and Alaska Native
Unemployment (%) - Multirace
Unemployment (%) - Other Race
Population density (people per square mile)
Population - Males (%)
Population - Females (%)
Population - Males (%) - White
Population - Males (%) - Black or African American
Population - Males (%) - Asian
Population - Males (%) - Hispanic or Latino
Population - Males (%) - American Indian and Alaska Native
Population - Males (%) - Multirace
Population - Males (%) - Other Race
Population - Females (%) - White
Population - Females (%) - Black or African American
Population - Females (%) - Asian
Population - Females (%) - Hispanic or Latino
Population - Females (%) - American Indian and Alaska Native
Population - Females (%) - Multirace
Population - Females (%) - Other Race
Coronavirus confirmed cases (Apr 24, 2024)
Deaths caused by coronavirus (Apr 24, 2024)
Coronavirus confirmed cases (per 100k population) (Apr 24, 2024)
Deaths caused by coronavirus (per 100k population) (Apr 24, 2024)
Daily increase in number of cases (Apr 24, 2024)
Weekly increase in number of cases (Apr 24, 2024)
Cases doubled (in days) (Apr 24, 2024)
Hospitalized patients (Apr 18, 2022)
Negative test results (Apr 18, 2022)
Total test results (Apr 18, 2022)
COVID Vaccine doses distributed (per 100k population) (Sep 19, 2023)
COVID Vaccine doses administered (per 100k population) (Sep 19, 2023)
COVID Vaccine doses distributed (Sep 19, 2023)
COVID Vaccine doses administered (Sep 19, 2023)
Likely homosexual households (%)
Likely homosexual households (% change since 2000)
Likely homosexual households - Lesbian couples (%)
Likely homosexual households - Lesbian couples (% change since 2000)
Likely homosexual households - Gay men (%)
Likely homosexual households - Gay men (% change since 2000)
Cost of living index
Median gross rent ($)
Median contract rent ($)
Median monthly housing costs ($)
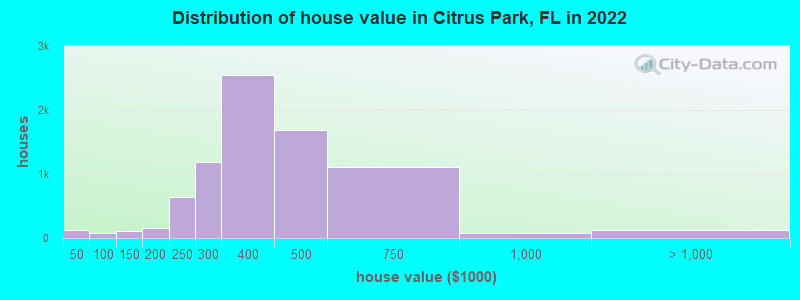
Median house or condo value ($)
Median house or condo value ($ change since 2000)
Mean house or condo value by units in structure - 1, detached ($)
Mean house or condo value by units in structure - 1, attached ($)
Mean house or condo value by units in structure - 2 ($)
Mean house or condo value by units in structure by units in structure - 3 or 4 ($)
Mean house or condo value by units in structure - 5 or more ($)
Mean house or condo value by units in structure - Boat, RV, van, etc. ($)
Mean house or condo value by units in structure - Mobile home ($)
Median house or condo value ($) - White
Median house or condo value ($) - Black or African American
Median house or condo value ($) - Asian
Median house or condo value ($) - Hispanic or Latino
Median house or condo value ($) - American Indian and Alaska Native
Median house or condo value ($) - Multirace
Median house or condo value ($) - Other Race
Median resident age
Resident age diversity
Median resident age - Males
Median resident age - Females
Median resident age - White
Median resident age - Black or African American
Median resident age - Asian
Median resident age - Hispanic or Latino
Median resident age - American Indian and Alaska Native
Median resident age - Multirace
Median resident age - Other Race
Median resident age - Males - White
Median resident age - Males - Black or African American
Median resident age - Males - Asian
Median resident age - Males - Hispanic or Latino
Median resident age - Males - American Indian and Alaska Native
Median resident age - Males - Multirace
Median resident age - Males - Other Race
Median resident age - Females - White
Median resident age - Females - Black or African American
Median resident age - Females - Asian
Median resident age - Females - Hispanic or Latino
Median resident age - Females - American Indian and Alaska Native
Median resident age - Females - Multirace
Median resident age - Females - Other Race
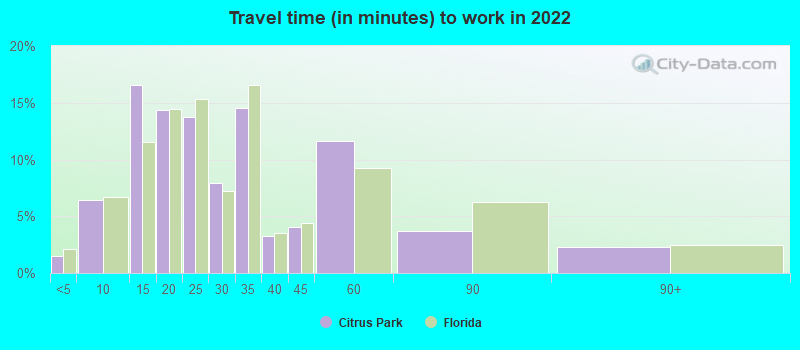
Commute - mean travel time to work (minutes)
Travel time to work - Less than 5 minutes (%)
Travel time to work - Less than 5 minutes (% change since 2000)
Travel time to work - 5 to 9 minutes (%)
Travel time to work - 5 to 9 minutes (% change since 2000)
Travel time to work - 10 to 19 minutes (%)
Travel time to work - 10 to 19 minutes (% change since 2000)
Travel time to work - 20 to 29 minutes (%)
Travel time to work - 20 to 29 minutes (% change since 2000)
Travel time to work - 30 to 39 minutes (%)
Travel time to work - 30 to 39 minutes (% change since 2000)
Travel time to work - 40 to 59 minutes (%)
Travel time to work - 40 to 59 minutes (% change since 2000)
Travel time to work - 60 to 89 minutes (%)
Travel time to work - 60 to 89 minutes (% change since 2000)
Travel time to work - 90 or more minutes (%)
Travel time to work - 90 or more minutes (% change since 2000)
Marital status - Never married (%)
Marital status - Now married (%)
Marital status - Separated (%)
Marital status - Widowed (%)
Marital status - Divorced (%)
Median family income ($)
Median family income (% change since 2000)
Median non-family income ($)
Median non-family income (% change since 2000)
Median per capita income ($)
Median per capita income (% change since 2000)
Median family income ($) - White
Median family income ($) - Black or African American
Median family income ($) - Asian
Median family income ($) - Hispanic or Latino
Median family income ($) - American Indian and Alaska Native
Median family income ($) - Multirace
Median family income ($) - Other Race
Median year house/condo built
Median year apartment built
Year house built - Built 2005 or later (%)
Year house built - Built 2000 to 2004 (%)
Year house built - Built 1990 to 1999 (%)
Year house built - Built 1980 to 1989 (%)
Year house built - Built 1970 to 1979 (%)
Year house built - Built 1960 to 1969 (%)
Year house built - Built 1950 to 1959 (%)
Year house built - Built 1940 to 1949 (%)
Year house built - Built 1939 or earlier (%)
Average household size
Household density (households per square mile)
Average household size - White
Average household size - Black or African American
Average household size - Asian
Average household size - Hispanic or Latino
Average household size - American Indian and Alaska Native
Average household size - Multirace
Average household size - Other Race
Occupied housing units (%)
Vacant housing units (%)
Owner occupied housing units (%)
Renter occupied housing units (%)
Vacancy status - For rent (%)
Vacancy status - For sale only (%)
Vacancy status - Rented or sold, not occupied (%)
Vacancy status - For seasonal, recreational, or occasional use (%)
Vacancy status - For migrant workers (%)
Vacancy status - Other vacant (%)
Residents with income below the poverty level (%)
Residents with income below 50% of the poverty level (%)
Children below poverty level (%)
Poor families by family type - Married-couple family (%)
Poor families by family type - Male, no wife present (%)
Poor families by family type - Female, no husband present (%)
Poverty status for native-born residents (%)
Poverty status for foreign-born residents (%)
Poverty among high school graduates not in families (%)
Poverty among people who did not graduate high school not in families (%)
Residents with income below the poverty level (%) - White
Residents with income below the poverty level (%) - Black or African American
Residents with income below the poverty level (%) - Asian
Residents with income below the poverty level (%) - Hispanic or Latino
Residents with income below the poverty level (%) - American Indian and Alaska Native
Residents with income below the poverty level (%) - Multirace
Residents with income below the poverty level (%) - Other Race
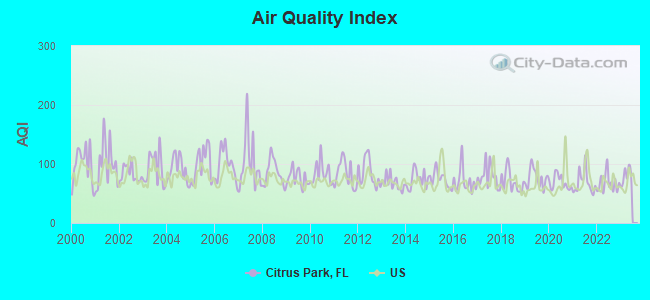
Air pollution - Air Quality Index (AQI)
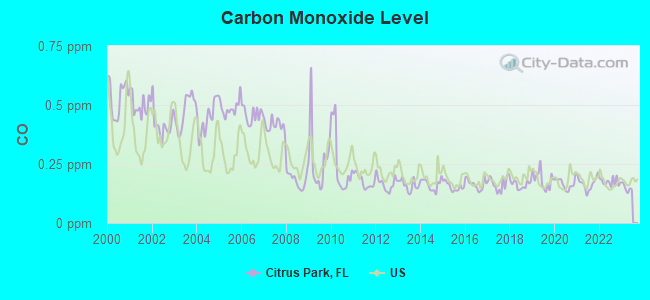
Air pollution - CO
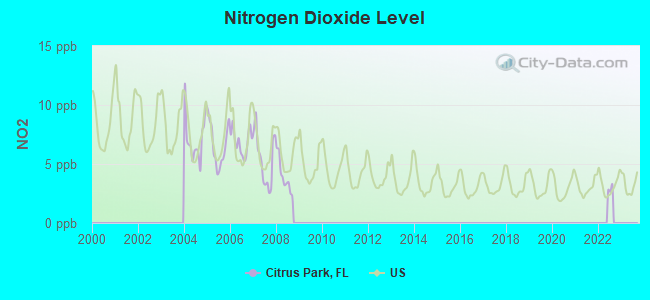
Air pollution - NO2
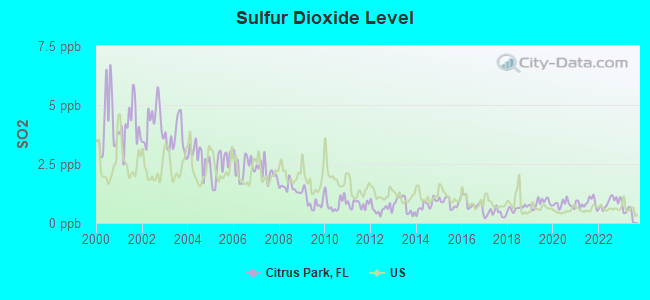
Air pollution - SO2
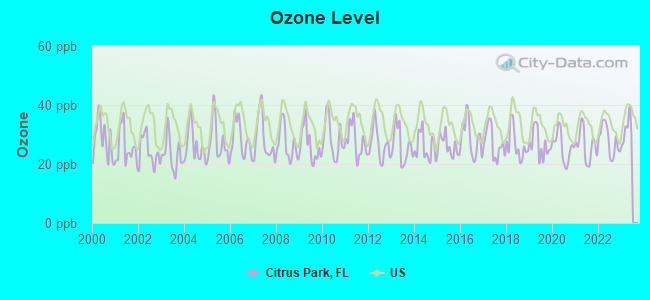
Air pollution - Ozone
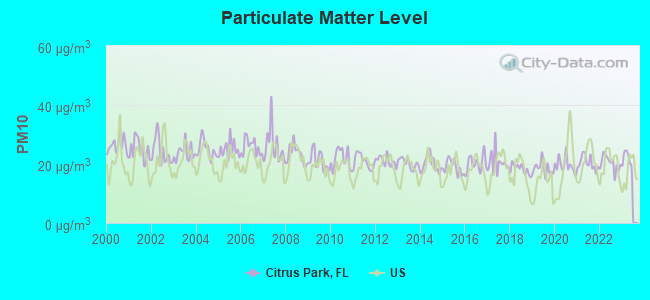
Air pollution - PM10
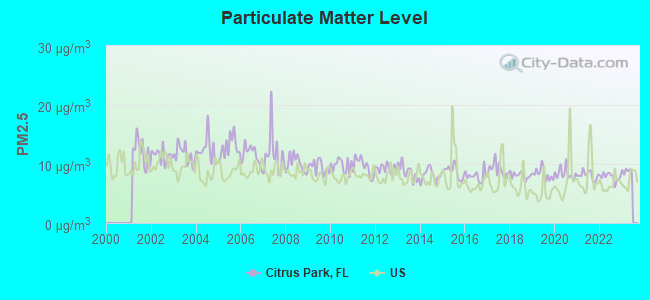
Air pollution - PM25
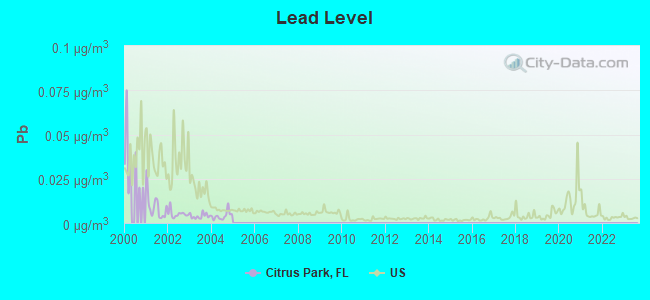
Air pollution - Pb
Crime - Murders per 100,000 population
Crime - Rapes per 100,000 population
Crime - Robberies per 100,000 population
Crime - Assaults per 100,000 population
Crime - Burglaries per 100,000 population
Crime - Thefts per 100,000 population
Crime - Auto thefts per 100,000 population
Crime - Arson per 100,000 population
Crime - City-data.com crime index
Crime - Violent crime index
Crime - Property crime index
Crime - Murders per 100,000 population (5 year average)
Crime - Rapes per 100,000 population (5 year average)
Crime - Robberies per 100,000 population (5 year average)
Crime - Assaults per 100,000 population (5 year average)
Crime - Burglaries per 100,000 population (5 year average)
Crime - Thefts per 100,000 population (5 year average)
Crime - Auto thefts per 100,000 population (5 year average)
Crime - Arson per 100,000 population (5 year average)
Crime - City-data.com crime index (5 year average)
Crime - Violent crime index (5 year average)
Crime - Property crime index (5 year average)
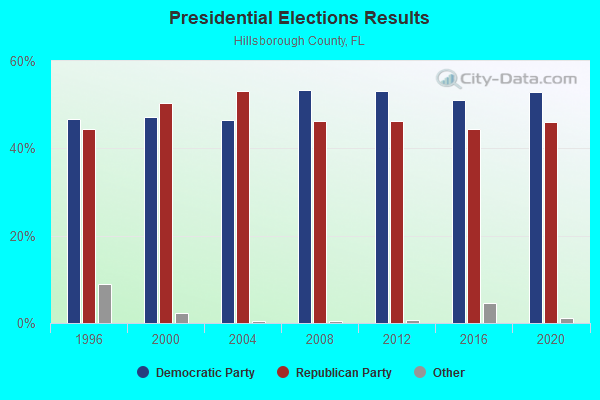
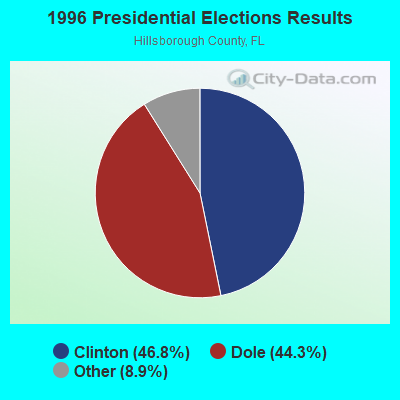
1996 Presidential Elections Results (%) - Democratic Party (Clinton)
1996 Presidential Elections Results (%) - Republican Party (Dole)
1996 Presidential Elections Results (%) - Other
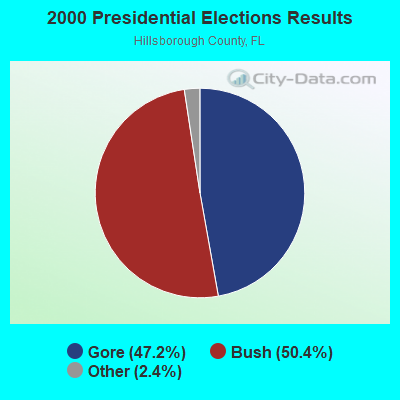
2000 Presidential Elections Results (%) - Democratic Party (Gore)
2000 Presidential Elections Results (%) - Republican Party (Bush)
2000 Presidential Elections Results (%) - Other
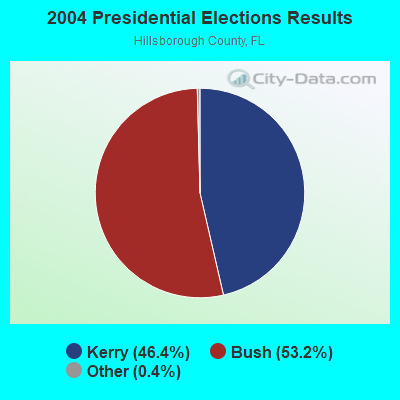
2004 Presidential Elections Results (%) - Democratic Party (Kerry)
2004 Presidential Elections Results (%) - Republican Party (Bush)
2004 Presidential Elections Results (%) - Other
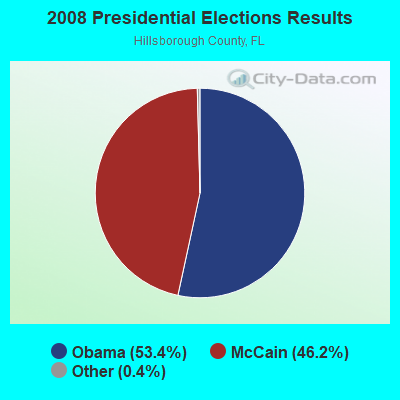
2008 Presidential Elections Results (%) - Democratic Party (Obama)
2008 Presidential Elections Results (%) - Republican Party (McCain)
2008 Presidential Elections Results (%) - Other
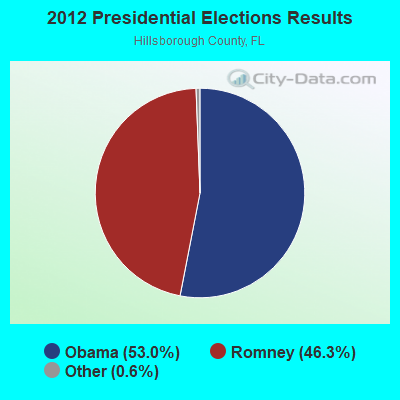
2012 Presidential Elections Results (%) - Democratic Party (Obama)
2012 Presidential Elections Results (%) - Republican Party (Romney)
2012 Presidential Elections Results (%) - Other
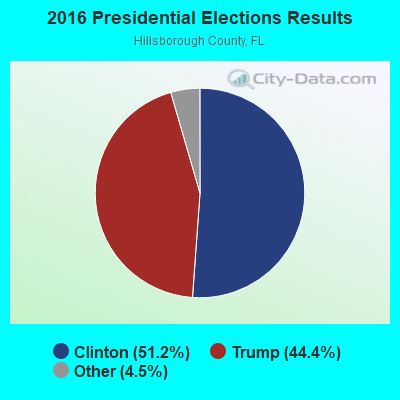
2016 Presidential Elections Results (%) - Democratic Party (Clinton)
2016 Presidential Elections Results (%) - Republican Party (Trump)
2016 Presidential Elections Results (%) - Other
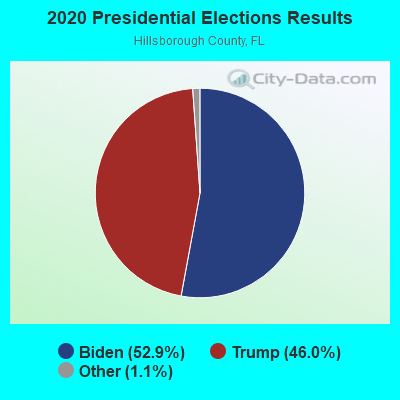
2020 Presidential Elections Results (%) - Democratic Party (Biden)
2020 Presidential Elections Results (%) - Republican Party (Trump)
2020 Presidential Elections Results (%) - Other
Ancestries Reported - Arab (%)
Ancestries Reported - Czech (%)
Ancestries Reported - Danish (%)
Ancestries Reported - Dutch (%)
Ancestries Reported - English (%)
Ancestries Reported - French (%)
Ancestries Reported - French Canadian (%)
Ancestries Reported - German (%)
Ancestries Reported - Greek (%)
Ancestries Reported - Hungarian (%)
Ancestries Reported - Irish (%)
Ancestries Reported - Italian (%)
Ancestries Reported - Lithuanian (%)
Ancestries Reported - Norwegian (%)
Ancestries Reported - Polish (%)
Ancestries Reported - Portuguese (%)
Ancestries Reported - Russian (%)
Ancestries Reported - Scotch-Irish (%)
Ancestries Reported - Scottish (%)
Ancestries Reported - Slovak (%)
Ancestries Reported - Subsaharan African (%)
Ancestries Reported - Swedish (%)
Ancestries Reported - Swiss (%)
Ancestries Reported - Ukrainian (%)
Ancestries Reported - United States (%)
Ancestries Reported - Welsh (%)
Ancestries Reported - West Indian (%)
Ancestries Reported - Other (%)
Educational Attainment - No schooling completed (%)
Educational Attainment - Less than high school (%)
Educational Attainment - High school or equivalent (%)
Educational Attainment - Less than 1 year of college (%)
Educational Attainment - 1 or more years of college (%)
Educational Attainment - Associate degree (%)
Educational Attainment - Bachelor's degree (%)
Educational Attainment - Master's degree (%)
Educational Attainment - Professional school degree (%)
Educational Attainment - Doctorate degree (%)
School Enrollment - Nursery, preschool (%)
School Enrollment - Kindergarten (%)
School Enrollment - Grade 1 to 4 (%)
School Enrollment - Grade 5 to 8 (%)
School Enrollment - Grade 9 to 12 (%)
School Enrollment - College undergrad (%)
School Enrollment - Graduate or professional (%)
School Enrollment - Not enrolled in school (%)
School enrollment - Public schools (%)
School enrollment - Private schools (%)
School enrollment - Not enrolled (%)
Median number of rooms in houses and condos
Median number of rooms in apartments
Housing units lacking complete plumbing facilities (%)
Housing units lacking complete kitchen facilities (%)
Density of houses
Urban houses (%)
Rural houses (%)
Households with people 60 years and over (%)
Households with people 65 years and over (%)
Households with people 75 years and over (%)
Households with one or more nonrelatives (%)
Households with no nonrelatives (%)
Population in households (%)
Family households (%)
Nonfamily households (%)
Population in families (%)
Family households with own children (%)
Median number of bedrooms in owner occupied houses
Mean number of bedrooms in owner occupied houses
Median number of bedrooms in renter occupied houses
Mean number of bedrooms in renter occupied houses
Median number of vehichles in owner occupied houses
Mean number of vehichles in owner occupied houses
Median number of vehichles in renter occupied houses
Mean number of vehichles in renter occupied houses
Mortgage status - with mortgage (%)
Mortgage status - with second mortgage (%)
Mortgage status - with home equity loan (%)
Mortgage status - with both second mortgage and home equity loan (%)
Mortgage status - without a mortgage (%)
Average family size
Average family size - White
Average family size - Black or African American
Average family size - Asian
Average family size - Hispanic or Latino
Average family size - American Indian and Alaska Native
Average family size - Multirace
Average family size - Other Race
Geographical mobility - Same house 1 year ago (%)
Geographical mobility - Moved within same county (%)
Geographical mobility - Moved from different county within same state (%)
Geographical mobility - Moved from different state (%)
Geographical mobility - Moved from abroad (%)
Place of birth - Born in state of residence (%)
Place of birth - Born in other state (%)
Place of birth - Native, outside of US (%)
Place of birth - Foreign born (%)
Housing units in structures - 1, detached (%)
Housing units in structures - 1, attached (%)
Housing units in structures - 2 (%)
Housing units in structures - 3 or 4 (%)
Housing units in structures - 5 to 9 (%)
Housing units in structures - 10 to 19 (%)
Housing units in structures - 20 to 49 (%)
Housing units in structures - 50 or more (%)
Housing units in structures - Mobile home (%)
Housing units in structures - Boat, RV, van, etc. (%)
House/condo owner moved in on average (years ago)
Renter moved in on average (years ago)
Year householder moved into unit - Moved in 1999 to March 2000 (%)
Year householder moved into unit - Moved in 1995 to 1998 (%)
Year householder moved into unit - Moved in 1990 to 1994 (%)
Year householder moved into unit - Moved in 1980 to 1989 (%)
Year householder moved into unit - Moved in 1970 to 1979 (%)
Year householder moved into unit - Moved in 1969 or earlier (%)
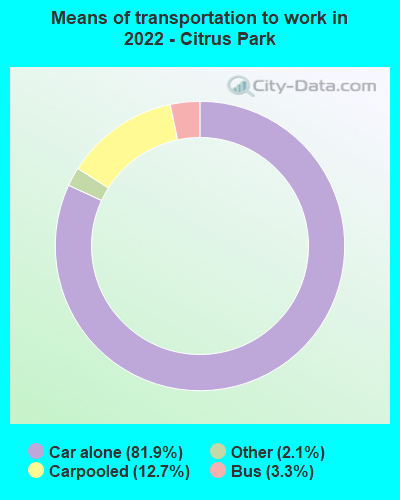
Means of transportation to work - Drove car alone (%)
Means of transportation to work - Carpooled (%)
Means of transportation to work - Public transportation (%)
Means of transportation to work - Bus or trolley bus (%)
Means of transportation to work - Streetcar or trolley car (%)
Means of transportation to work - Subway or elevated (%)
Means of transportation to work - Railroad (%)
Means of transportation to work - Ferryboat (%)
Means of transportation to work - Taxicab (%)
Means of transportation to work - Motorcycle (%)
Means of transportation to work - Bicycle (%)
Means of transportation to work - Walked (%)
Means of transportation to work - Other means (%)
Working at home (%)
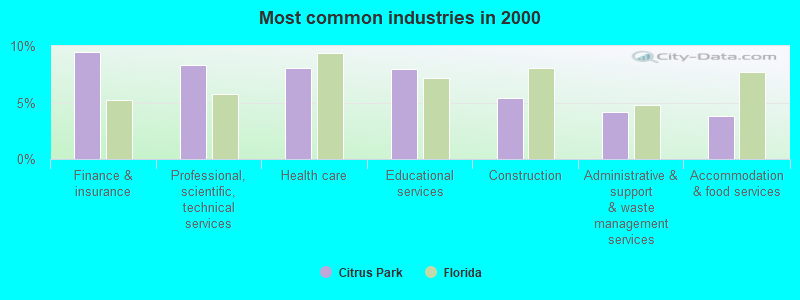
Industry diversity
Most Common Industries - Agriculture, forestry, fishing and hunting, and mining (%)
Most Common Industries - Agriculture, forestry, fishing and hunting (%)
Most Common Industries - Mining, quarrying, and oil and gas extraction (%)
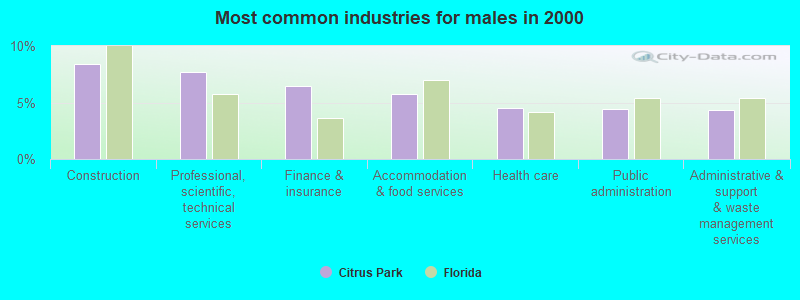
Most Common Industries - Construction (%)
Most Common Industries - Manufacturing (%)
Most Common Industries - Wholesale trade (%)
Most Common Industries - Retail trade (%)
Most Common Industries - Transportation and warehousing, and utilities (%)
Most Common Industries - Transportation and warehousing (%)
Most Common Industries - Utilities (%)
Most Common Industries - Information (%)
Most Common Industries - Finance and insurance, and real estate and rental and leasing (%)
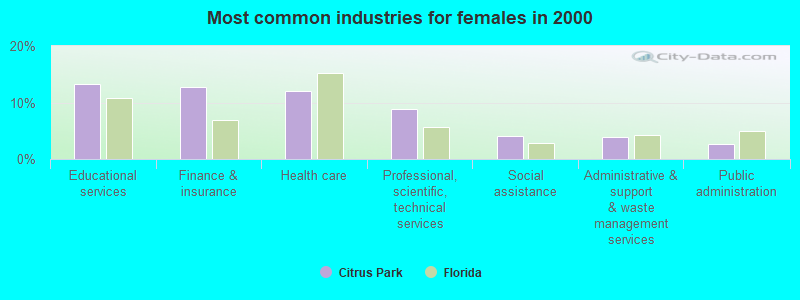
Most Common Industries - Finance and insurance (%)
Most Common Industries - Real estate and rental and leasing (%)
Most Common Industries - Professional, scientific, and management, and administrative and waste management services (%)
Most Common Industries - Professional, scientific, and technical services (%)
Most Common Industries - Management of companies and enterprises (%)
Most Common Industries - Administrative and support and waste management services (%)
Most Common Industries - Educational services, and health care and social assistance (%)
Most Common Industries - Educational services (%)
Most Common Industries - Health care and social assistance (%)
Most Common Industries - Arts, entertainment, and recreation, and accommodation and food services (%)
Most Common Industries - Arts, entertainment, and recreation (%)
Most Common Industries - Accommodation and food services (%)
Most Common Industries - Other services, except public administration (%)
Most Common Industries - Public administration (%)
Occupation diversity
Most Common Occupations - Management, business, science, and arts occupations (%)
Most Common Occupations - Management, business, and financial occupations (%)
Most Common Occupations - Management occupations (%)
Most Common Occupations - Business and financial operations occupations (%)
Most Common Occupations - Computer, engineering, and science occupations (%)
Most Common Occupations - Computer and mathematical occupations (%)
Most Common Occupations - Architecture and engineering occupations (%)
Most Common Occupations - Life, physical, and social science occupations (%)
Most Common Occupations - Education, legal, community service, arts, and media occupations (%)
Most Common Occupations - Community and social service occupations (%)
Most Common Occupations - Legal occupations (%)
Most Common Occupations - Education, training, and library occupations (%)
Most Common Occupations - Arts, design, entertainment, sports, and media occupations (%)
Most Common Occupations - Healthcare practitioners and technical occupations (%)
Most Common Occupations - Health diagnosing and treating practitioners and other technical occupations (%)
Most Common Occupations - Health technologists and technicians (%)
Most Common Occupations - Service occupations (%)
Most Common Occupations - Healthcare support occupations (%)
Most Common Occupations - Protective service occupations (%)
Most Common Occupations - Fire fighting and prevention, and other protective service workers including supervisors (%)
Most Common Occupations - Law enforcement workers including supervisors (%)
Most Common Occupations - Food preparation and serving related occupations (%)
Most Common Occupations - Building and grounds cleaning and maintenance occupations (%)
Most Common Occupations - Personal care and service occupations (%)
Most Common Occupations - Sales and office occupations (%)
Most Common Occupations - Sales and related occupations (%)
Most Common Occupations - Office and administrative support occupations (%)
Most Common Occupations - Natural resources, construction, and maintenance occupations (%)
Most Common Occupations - Farming, fishing, and forestry occupations (%)
Most Common Occupations - Construction and extraction occupations (%)
Most Common Occupations - Installation, maintenance, and repair occupations (%)
Most Common Occupations - Production, transportation, and material moving occupations (%)
Most Common Occupations - Production occupations (%)
Most Common Occupations - Transportation occupations (%)
Most Common Occupations - Material moving occupations (%)
People in Group quarters - Institutionalized population (%)
People in Group quarters - Correctional institutions (%)
People in Group quarters - Federal prisons and detention centers (%)
People in Group quarters - Halfway houses (%)
People in Group quarters - Local jails and other confinement facilities (including police lockups) (%)
People in Group quarters - Military disciplinary barracks (%)
People in Group quarters - State prisons (%)
People in Group quarters - Other types of correctional institutions (%)
People in Group quarters - Nursing homes (%)
People in Group quarters - Hospitals/wards, hospices, and schools for the handicapped (%)
People in Group quarters - Hospitals/wards and hospices for chronically ill (%)
People in Group quarters - Hospices or homes for chronically ill (%)
People in Group quarters - Military hospitals or wards for chronically ill (%)
People in Group quarters - Other hospitals or wards for chronically ill (%)
People in Group quarters - Hospitals or wards for drug/alcohol abuse (%)
People in Group quarters - Mental (Psychiatric) hospitals or wards (%)
People in Group quarters - Schools, hospitals, or wards for the mentally retarded (%)
People in Group quarters - Schools, hospitals, or wards for the physically handicapped (%)
People in Group quarters - Institutions for the deaf (%)
People in Group quarters - Institutions for the blind (%)
People in Group quarters - Orthopedic wards and institutions for the physically handicapped (%)
People in Group quarters - Wards in general hospitals for patients who have no usual home elsewhere (%)
People in Group quarters - Wards in military hospitals for patients who have no usual home elsewhere (%)
People in Group quarters - Juvenile institutions (%)
People in Group quarters - Long-term care (%)
People in Group quarters - Homes for abused, dependent, and neglected children (%)
People in Group quarters - Residential treatment centers for emotionally disturbed children (%)
People in Group quarters - Training schools for juvenile delinquents (%)
People in Group quarters - Short-term care, detention or diagnostic centers for delinquent children (%)
People in Group quarters - Type of juvenile institution unknown (%)
People in Group quarters - Noninstitutionalized population (%)
People in Group quarters - College dormitories (includes college quarters off campus) (%)
People in Group quarters - Military quarters (%)
People in Group quarters - On base (%)
People in Group quarters - Barracks, unaccompanied personnel housing (UPH), (Enlisted/Officer), ;and similar group living quarters for military personnel (%)
People in Group quarters - Transient quarters for temporary residents (%)
People in Group quarters - Military ships (%)
People in Group quarters - Group homes (%)
People in Group quarters - Homes or halfway houses for drug/alcohol abuse (%)
People in Group quarters - Homes for the mentally ill (%)
People in Group quarters - Homes for the mentally retarded (%)
People in Group quarters - Homes for the physically handicapped (%)
People in Group quarters - Other group homes (%)
People in Group quarters - Religious group quarters (%)
People in Group quarters - Dormitories (%)
People in Group quarters - Agriculture workers' dormitories on farms (%)
People in Group quarters - Job Corps and vocational training facilities (%)
People in Group quarters - Other workers' dormitories (%)
People in Group quarters - Crews of maritime vessels (%)
People in Group quarters - Other nonhousehold living situations (%)
People in Group quarters - Other noninstitutional group quarters (%)
Residents speaking English at home (%)
Residents speaking English at home - Born in the United States (%)
Residents speaking English at home - Native, born elsewhere (%)
Residents speaking English at home - Foreign born (%)
Residents speaking Spanish at home (%)
Residents speaking Spanish at home - Born in the United States (%)
Residents speaking Spanish at home - Native, born elsewhere (%)
Residents speaking Spanish at home - Foreign born (%)
Residents speaking other language at home (%)
Residents speaking other language at home - Born in the United States (%)
Residents speaking other language at home - Native, born elsewhere (%)
Residents speaking other language at home - Foreign born (%)
Class of Workers - Employee of private company (%)
Class of Workers - Self-employed in own incorporated business (%)
Class of Workers - Private not-for-profit wage and salary workers (%)
Class of Workers - Local government workers (%)
Class of Workers - State government workers (%)
Class of Workers - Federal government workers (%)
Class of Workers - Self-employed workers in own not incorporated business and Unpaid family workers (%)
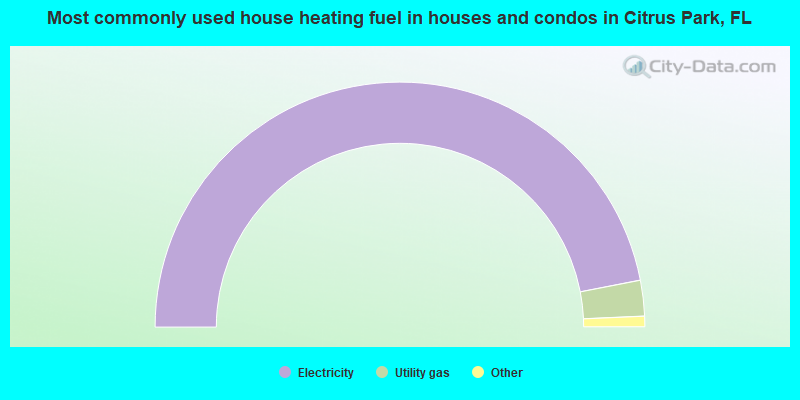
House heating fuel used in houses and condos - Utility gas (%)
House heating fuel used in houses and condos - Bottled, tank, or LP gas (%)
House heating fuel used in houses and condos - Electricity (%)
House heating fuel used in houses and condos - Fuel oil, kerosene, etc. (%)
House heating fuel used in houses and condos - Coal or coke (%)
House heating fuel used in houses and condos - Wood (%)
House heating fuel used in houses and condos - Solar energy (%)
House heating fuel used in houses and condos - Other fuel (%)
House heating fuel used in houses and condos - No fuel used (%)
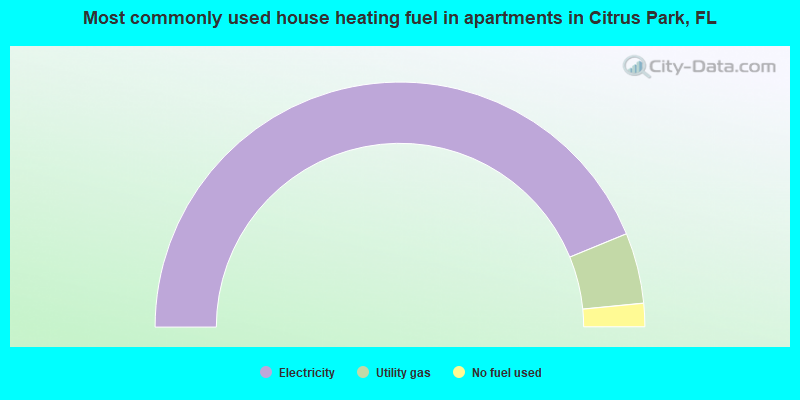
House heating fuel used in apartments - Utility gas (%)
House heating fuel used in apartments - Bottled, tank, or LP gas (%)
House heating fuel used in apartments - Electricity (%)
House heating fuel used in apartments - Fuel oil, kerosene, etc. (%)
House heating fuel used in apartments - Coal or coke (%)
House heating fuel used in apartments - Wood (%)
House heating fuel used in apartments - Solar energy (%)
House heating fuel used in apartments - Other fuel (%)
House heating fuel used in apartments - No fuel used (%)
Armed forces status - In Armed Forces (%)
Armed forces status - Civilian (%)
Armed forces status - Civilian - Veteran (%)
Armed forces status - Civilian - Nonveteran (%)
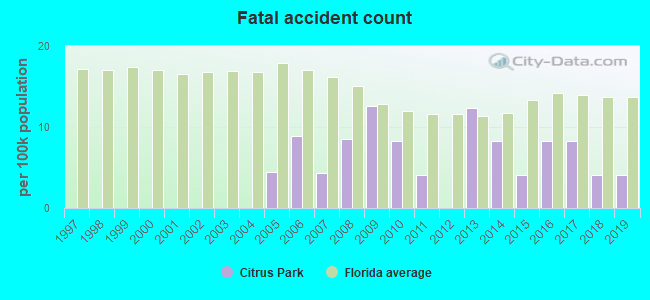
Fatal accidents locations in years 2005-2021
Fatal accidents locations in 2005
Fatal accidents locations in 2006
Fatal accidents locations in 2007
Fatal accidents locations in 2008
Fatal accidents locations in 2009
Fatal accidents locations in 2010
Fatal accidents locations in 2011
Fatal accidents locations in 2012
Fatal accidents locations in 2013
Fatal accidents locations in 2014
Fatal accidents locations in 2015
Fatal accidents locations in 2016
Fatal accidents locations in 2017
Fatal accidents locations in 2018
Fatal accidents locations in 2019
Fatal accidents locations in 2020
Fatal accidents locations in 2021
Alcohol use - People drinking some alcohol every month (%)
Alcohol use - People not drinking at all (%)
Alcohol use - Average days/month drinking alcohol
Alcohol use - Average drinks/week
Alcohol use - Average days/year people drink much
Audiometry - Average condition of hearing (%)
Audiometry - People that can hear a whisper from across a quiet room (%)
Audiometry - People that can hear normal voice from across a quiet room (%)
Audiometry - Ears ringing, roaring, buzzing (%)
Audiometry - Had a job exposure to loud noise (%)
Audiometry - Had off-work exposure to loud noise (%)
Blood Pressure & Cholesterol - Has high blood pressure (%)
Blood Pressure & Cholesterol - Checking blood pressure at home (%)
Blood Pressure & Cholesterol - Frequently checking blood cholesterol (%)
Blood Pressure & Cholesterol - Has high cholesterol level (%)
Consumer Behavior - Money monthly spent on food at supermarket/grocery store
Consumer Behavior - Money monthly spent on food at other stores
Consumer Behavior - Money monthly spent on eating out
Consumer Behavior - Money monthly spent on carryout/delivered foods
Consumer Behavior - Income spent on food at supermarket/grocery store (%)
Consumer Behavior - Income spent on food at other stores (%)
Consumer Behavior - Income spent on eating out (%)
Consumer Behavior - Income spent on carryout/delivered foods (%)
Current Health Status - General health condition (%)
Current Health Status - Blood donors (%)
Current Health Status - Has blood ever tested for HIV virus (%)
Current Health Status - Left-handed people (%)
Dermatology - People using sunscreen (%)
Diabetes - Diabetics (%)
Diabetes - Had a blood test for high blood sugar (%)
Diabetes - People taking insulin (%)
Diet Behavior & Nutrition - Diet health (%)
Diet Behavior & Nutrition - Milk product consumption (# of products/month)
Diet Behavior & Nutrition - Meals not home prepared (#/week)
Diet Behavior & Nutrition - Meals from fast food or pizza place (#/week)
Diet Behavior & Nutrition - Ready-to-eat foods (#/month)
Diet Behavior & Nutrition - Frozen meals/pizza (#/month)
Drug Use - People that ever used marijuana or hashish (%)
Drug Use - Ever used hard drugs (%)
Drug Use - Ever used any form of cocaine (%)
Drug Use - Ever used heroin (%)
Drug Use - Ever used methamphetamine (%)
Health Insurance - People covered by health insurance (%)
Kidney Conditions-Urology - Avg. # of times urinating at night
Medical Conditions - People with asthma (%)
Medical Conditions - People with anemia (%)
Medical Conditions - People with psoriasis (%)
Medical Conditions - People with overweight (%)
Medical Conditions - Elderly people having difficulties in thinking or remembering (%)
Medical Conditions - People who ever received blood transfusion (%)
Medical Conditions - People having trouble seeing even with glass/contacts (%)
Medical Conditions - People with arthritis (%)
Medical Conditions - People with gout (%)
Medical Conditions - People with congestive heart failure (%)
Medical Conditions - People with coronary heart disease (%)
Medical Conditions - People with angina pectoris (%)
Medical Conditions - People who ever had heart attack (%)
Medical Conditions - People who ever had stroke (%)
Medical Conditions - People with emphysema (%)
Medical Conditions - People with thyroid problem (%)
Medical Conditions - People with chronic bronchitis (%)
Medical Conditions - People with any liver condition (%)
Medical Conditions - People who ever had cancer or malignancy (%)
Mental Health - People who have little interest in doing things (%)
Mental Health - People feeling down, depressed, or hopeless (%)
Mental Health - People who have trouble sleeping or sleeping too much (%)
Mental Health - People feeling tired or having little energy (%)
Mental Health - People with poor appetite or overeating (%)
Mental Health - People feeling bad about themself (%)
Mental Health - People who have trouble concentrating on things (%)
Mental Health - People moving or speaking slowly or too fast (%)
Mental Health - People having thoughts they would be better off dead (%)
Oral Health - Average years since last visit a dentist
Oral Health - People embarrassed because of mouth (%)
Oral Health - People with gum disease (%)
Oral Health - General health of teeth and gums (%)
Oral Health - Average days a week using dental floss/device
Oral Health - Average days a week using mouthwash for dental problem
Oral Health - Average number of teeth
Pesticide Use - Households using pesticides to control insects (%)
Pesticide Use - Households using pesticides to kill weeds (%)
Physical Activity - People doing vigorous-intensity work activities (%)
Physical Activity - People doing moderate-intensity work activities (%)
Physical Activity - People walking or bicycling (%)
Physical Activity - People doing vigorous-intensity recreational activities (%)
Physical Activity - People doing moderate-intensity recreational activities (%)
Physical Activity - Average hours a day doing sedentary activities
Physical Activity - Average hours a day watching TV or videos
Physical Activity - Average hours a day using computer
Physical Functioning - People having limitations keeping them from working (%)
Physical Functioning - People limited in amount of work they can do (%)
Physical Functioning - People that need special equipment to walk (%)
Physical Functioning - People experiencing confusion/memory problems (%)
Physical Functioning - People requiring special healthcare equipment (%)
Prescription Medications - Average number of prescription medicines taking
Preventive Aspirin Use - Adults 40+ taking low-dose aspirin (%)
Reproductive Health - Vaginal deliveries (%)
Reproductive Health - Cesarean deliveries (%)
Reproductive Health - Deliveries resulted in a live birth (%)
Reproductive Health - Pregnancies resulted in a delivery (%)
Reproductive Health - Women breastfeeding newborns (%)
Reproductive Health - Women that had a hysterectomy (%)
Reproductive Health - Women that had both ovaries removed (%)
Reproductive Health - Women that have ever taken birth control pills (%)
Reproductive Health - Women taking birth control pills (%)
Reproductive Health - Women that have ever used Depo-Provera or injectables (%)
Reproductive Health - Women that have ever used female hormones (%)
Sexual Behavior - People 18+ that ever had sex (vaginal, anal, or oral) (%)
Sexual Behavior - Males 18+ that ever had vaginal sex with a woman (%)
Sexual Behavior - Males 18+ that ever performed oral sex on a woman (%)
Sexual Behavior - Males 18+ that ever had anal sex with a woman (%)
Sexual Behavior - Males 18+ that ever had any sex with a man (%)
Sexual Behavior - Females 18+ that ever had vaginal sex with a man (%)
Sexual Behavior - Females 18+ that ever performed oral sex on a man (%)
Sexual Behavior - Females 18+ that ever had anal sex with a man (%)
Sexual Behavior - Females 18+ that ever had any kind of sex with a woman (%)
Sexual Behavior - Average age people first had sex
Sexual Behavior - Average number of female sex partners in lifetime (males 18+)
Sexual Behavior - Average number of female vaginal sex partners in lifetime (males 18+)
Sexual Behavior - Average age people first performed oral sex on a woman (18+)
Sexual Behavior - Average number of woman performed oral sex on in lifetime (18+)
Sexual Behavior - Average number of male sex partners in lifetime (males 18+)
Sexual Behavior - Average number of male anal sex partners in lifetime (males 18+)
Sexual Behavior - Average age people first performed oral sex on a man (18+)
Sexual Behavior - Average number of male oral sex partners in lifetime (18+)
Sexual Behavior - People using protection when performing oral sex (%)
Sexual Behavior - Average number of times people have vaginal or anal sex a year
Sexual Behavior - People having sex without condom (%)
Sexual Behavior - Average number of male sex partners in lifetime (females 18+)
Sexual Behavior - Average number of male vaginal sex partners in lifetime (females 18+)
Sexual Behavior - Average number of female sex partners in lifetime (females 18+)
Sexual Behavior - Circumcised males 18+ (%)
Sleep Disorders - Average hours sleeping at night
Sleep Disorders - People that has trouble sleeping (%)
Smoking-Cigarette Use - People smoking cigarettes (%)
Taste & Smell - People 40+ having problems with smell (%)
Taste & Smell - People 40+ having problems with taste (%)
Taste & Smell - People 40+ that ever had wisdom teeth removed (%)
Taste & Smell - People 40+ that ever had tonsils teeth removed (%)
Taste & Smell - People 40+ that ever had a loss of consciousness because of a head injury (%)
Taste & Smell - People 40+ that ever had a broken nose or other serious injury to face or skull (%)
Taste & Smell - People 40+ that ever had two or more sinus infections (%)
Weight - Average height (inches)
Weight - Average weight (pounds)
Weight - Average BMI
Weight - People that are obese (%)
Weight - People that ever were obese (%)
Weight - People trying to lose weight (%)
Latest news from Citrus Park, FL collected exclusively by city-data.com from local newspapers, TV, and radio stations
Ancestries: Italian (6.6%), American (4.6%), German (3.6%), Irish (3.3%), British West Indian (2.8%), English (2.7%).
Current Local Time:
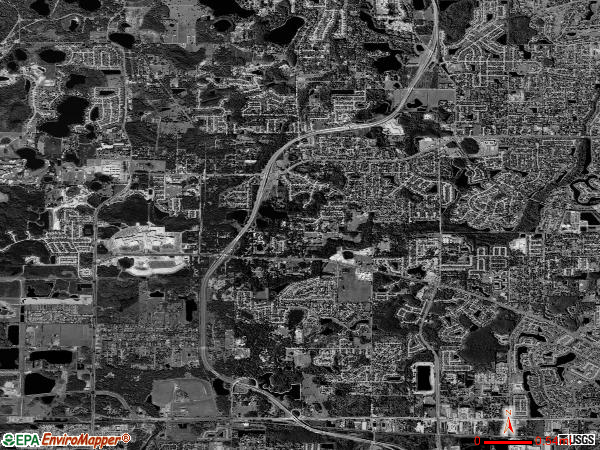
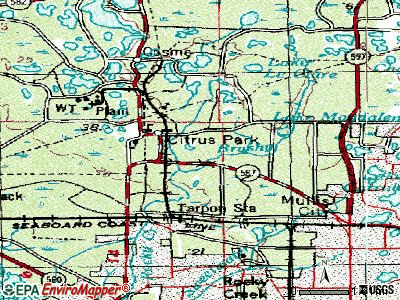
Land area: 10.6 square miles.
Population density: 2,294 people per square mile (low).
6,471 residents are foreign born (17.0% Latin America , 3.9% Asia ).
This place:
23.0%Florida:
21.1%
Median real estate property taxes paid for housing units with mortgages in 2022: $2,882 (0.7%)Median real estate property taxes paid for housing units with no mortgage in 2022: $2,189 (0.6%)
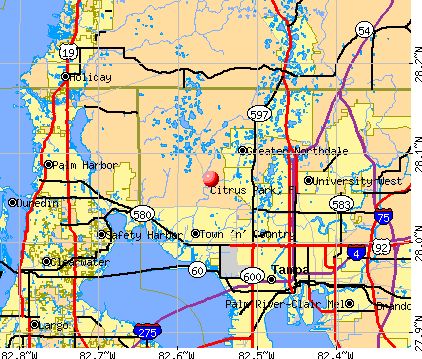
Nearest city with pop. 50,000+: Citrus Park-Fern Lake, FL (1.3 miles
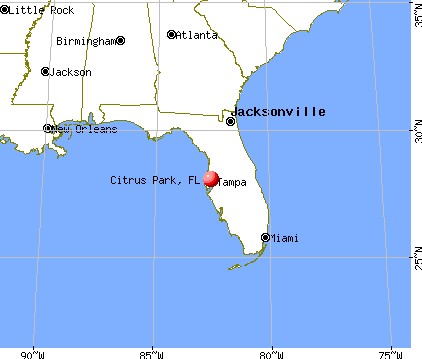
Nearest city with pop. 200,000+: Tampa, FL
Nearest city with pop. 1,000,000+: Houston, TX
Nearest cities:
Latitude: 28.07 N, Longitude: 82.56 W
Daytime population change due to commuting: -4,940 (-17.6%)Workers who live and work in this place: 4,033 (26.2%)
Property values in Citrus Park, FL
Unemployment in December 2023:
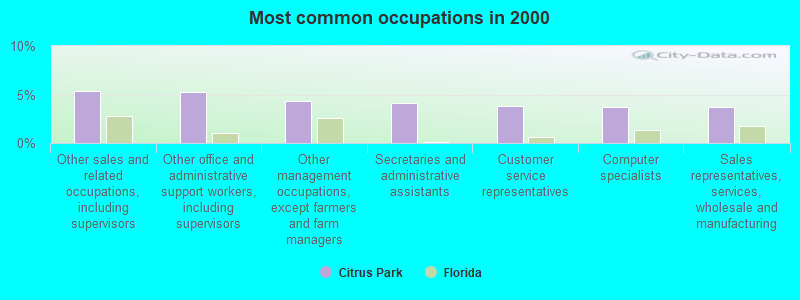
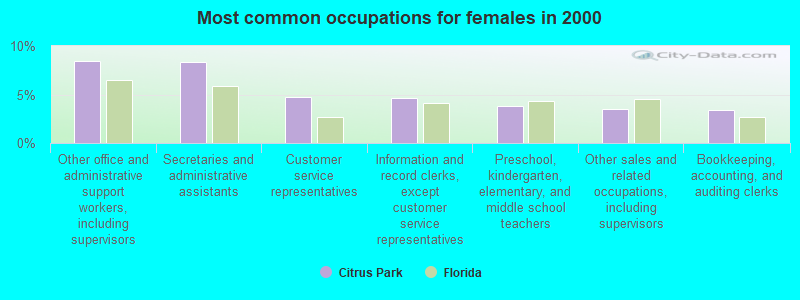
Most common occupations in Citrus Park, FL (%)
Both Males Females
Other sales and related occupations, including supervisors (5.4%)
Other office and administrative support workers, including supervisors (5.3%)
Other management occupations, except farmers and farm managers (4.3%)
Secretaries and administrative assistants (4.1%)
Customer service representatives (3.8%)
Computer specialists (3.8%)
Sales representatives, services, wholesale and manufacturing (3.7%)
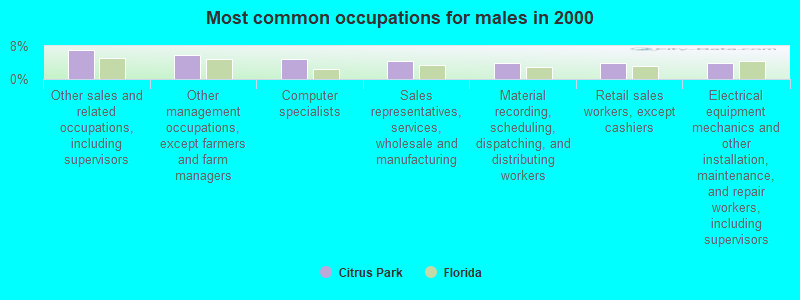
Other sales and related occupations, including supervisors (7.1%)
Other management occupations, except farmers and farm managers (5.9%)
Computer specialists (4.8%)
Sales representatives, services, wholesale and manufacturing (4.4%)
Material recording, scheduling, dispatching, and distributing workers (4.0%)
Retail sales workers, except cashiers (3.9%)
Electrical equipment mechanics and other installation, maintenance, and repair workers, including supervisors (3.9%)
Other office and administrative support workers, including supervisors (8.4%)
Secretaries and administrative assistants (8.4%)
Customer service representatives (4.7%)
Information and record clerks, except customer service representatives (4.7%)
Preschool, kindergarten, elementary, and middle school teachers (3.8%)
Other sales and related occupations, including supervisors (3.5%)
Bookkeeping, accounting, and auditing clerks (3.4%)
Tornado activity:
Citrus Park-area historical tornado activity is slightly above Florida state average. It is 45% greater than the overall U.S. average.
On 4/4/1966, a category F4 (max. wind speeds 207-260 mph) tornado 18.1 miles away from the Citrus Park place center killed 11 people and injured 530 people and caused between $5,000,000 and $50,000,000 in damages.
On 5/4/1978, a category F3 (max. wind speeds 158-206 mph) tornado 13.6 miles away from the place center killed 3 people and injured 94 people and caused between $500,000 and $5,000,000 in damages.
Earthquake activity:
Citrus Park-area historical earthquake activity is significantly above Florida state average. It is 88% smaller than the overall U.S. average. On 9/10/2006 at 14:56:08, a magnitude 5.9 (5.9 MB, 5.5 MS, 5.8 MW, Class: Moderate, Intensity: VI - VII) earthquake occurred 280.4 miles away from Citrus Park center On 10/24/1997 at 08:35:17, a magnitude 4.9 (4.8 MB, 4.2 MS, 4.9 LG, Depth: 6.2 mi, Class: Light, Intensity: IV - V) earthquake occurred 353.4 miles away from the city center On 11/22/1974 at 05:25:55, a magnitude 4.7 (4.7 MB) earthquake occurred 363.6 miles away from the city center On 8/2/1974 at 08:52:09, a magnitude 4.9 (4.3 MB, 4.9 LG) earthquake occurred 401.3 miles away from Citrus Park center On 9/4/2016 at 18:29:29, a magnitude 3.8 (3.8 ML, Class: Light, Intensity: II - III) earthquake occurred 229.9 miles away from the city center On 6/23/2016 at 17:20:29, a magnitude 3.8 (3.8 ML) earthquake occurred 230.3 miles away from the city center Magnitude types: regional Lg-wave magnitude (LG), body-wave magnitude (MB), local magnitude (ML), surface-wave magnitude (MS), moment magnitude (MW) Natural disasters: The number of natural disasters in Hillsborough County (25) is a lot greater than the US average (15).Major Disasters (Presidential) Declared: 15Emergencies Declared: 5Hurricanes: 10, Fires: 5, Floods: 5, Storms: 4, Tornadoes: 4, Tropical Storms: 4, Freeze: 1, Wind: 1, Other: 1 (Note: some incidents may be assigned to more than one category). Hospitals and medical centers near Citrus Park: TAMPA BAY HOME HEALTH CARE INC (Home Health Center, about 3 miles away; TAMPA, FL)
CARROLLWOOD ARTIFICIAL KIDNEY CENTER (Dialysis Facility, about 3 miles away; TAMPA, FL)
ACCURATE HEALTH SERVICES CORP (Home Health Center, about 4 miles away; TAMPA, FL)
CARROLLWOOD DIALYSIS (Dialysis Facility, about 4 miles away; TAMPA, FL)
ADVANTAGE HOME CARE INC (Home Health Center, about 4 miles away; TAMPA, FL)
EXCELLENCE IN HOME CARE INC (Home Health Center, about 4 miles away; TAMPA, FL)
REHAB MATTERS HOME HEALTH INC (Home Health Center, about 4 miles away; TAMPA, FL)
Amtrak stations near Citrus Park: 11 miles: TAMPA (601 NEBRASKA AVE.) Services: ticket office, fully wheelchair accessible, enclosed waiting area, public restrooms, public payphones, vending machines, free short-term parking, paid long-term parking, call for car rental service, call for taxi service, public transit connection.
12 miles: TARPON SPRINGS (2337 U.S. 19) - Bus Station 13 miles: CLEARWATER (20967 U.S. 19) - Bus Station Colleges/universities with over 2000 students nearest to Citrus Park:
Strayer University-Florida (about 6 miles; Tampa, FL ; Full-time enrollment: 2,723)
Ultimate Medical Academy-Tampa (about 7 miles; Tampa, FL ; FT enrollment: 16,672)
University of South Florida-Main Campus (about 9 miles; Tampa, FL ; FT enrollment: 35,920)
The University of Tampa (about 11 miles; Tampa, FL ; FT enrollment: 7,216)
Hillsborough Community College (about 12 miles; Tampa, FL ; FT enrollment: 19,838)
Everest University-Brandon (about 15 miles; Tampa, FL ; FT enrollment: 7,702)
Pasco-Hernando Community College (about 16 miles; New Port Richey, FL ; FT enrollment: 7,030)
Notable locations in Citrus Park: (A) , Citrus Park Town Center (B) , Hillsborough County Fire Rescue Station 13 Gunn Highway (C) , Hillsborough County Fire Rescue Station 6 Henderson (D) , Hillsborough County Sheriff's Office District 3 Office (E) , Hillsborough County Sheriff's Office Community Substation Citrus Park (F) . Display/hide their locations on the map
Shopping Center: (1) . Display/hide its location on the map
Churches in Citrus Park include: (A) , First Baptist Church of Citrus Park (B) . Display/hide their locations on the map
Lakes and reservoirs: (A) , Halfmoon Lake (B) , Horse Lake (C) , Pretty Lake (D) , Little Halfmoon Lake (E) , Paradise Lake (F) . Display/hide their locations on the map
Creek: (A) . Display/hide its location on the map
Hillsborough County has a predicted average indoor radon screening level between 2 and 4 pCi/L (pico curies per liter) - Moderate Potential Average household size: This place:
2.7 peopleFlorida:
2.5 people
Percentage of family households: This place:
72.0%Whole state:
65.2%
Percentage of households with unmarried partners: This place:
8.2%Whole state:
7.3%
Likely homosexual households (counted as self-reported same-sex unmarried-partner households)
Lesbian couples: 0.5% of all households Gay men: 0.5% of all households
6 people in group homes for juveniles (non-correctional) in 2010people in college/university student housing in 2010people in other noninstitutional group quarters in 2000people in other group homes in 2000
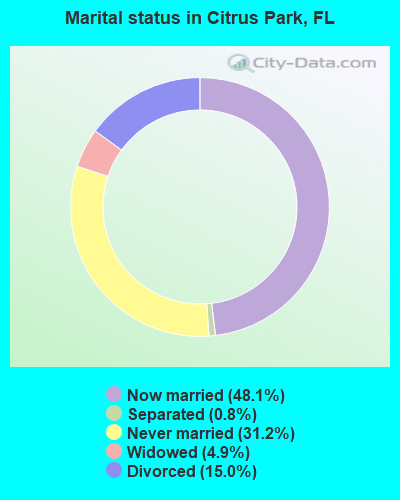
For population 15 years and over in Citrus Park:
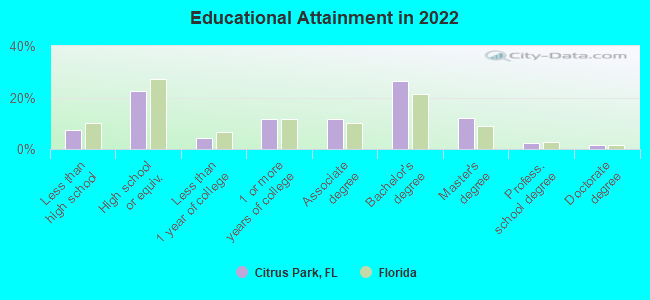
Never married: 31.2%Now married: 48.1%Separated: 0.8%Widowed: 4.9%Divorced: 15.0% For population 25 years and over in Citrus Park:
High school or higher: 92.7%Bachelor's degree or higher: 40.9%Graduate or professional degree: 15.3%Unemployed: 4.8%Mean travel time to work (commute): 23.0 minutes
Education Gini index (Inequality in education) Here:
10.2Florida average:
12.2
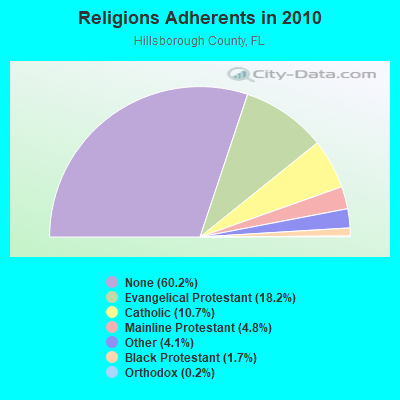
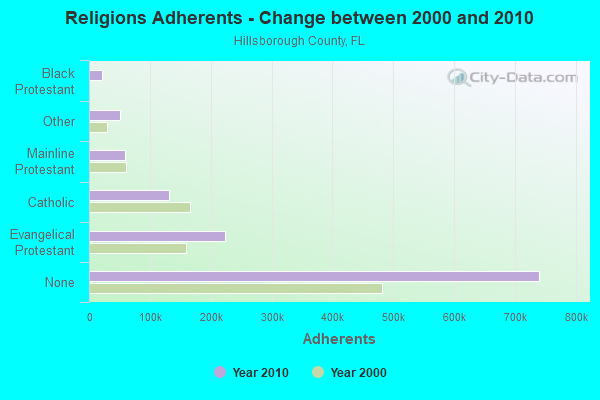
Religion statistics for Citrus Park, FL (based on Hillsborough County data)
Religion Adherents Congregations Evangelical Protestant 224,054 695 Catholic 130,973 28 Mainline Protestant 59,348 106 Other 50,901 105 Black Protestant 21,160 62 Orthodox 2,463 9 None 740,327 -
Source: Clifford Grammich, Kirk Hadaway, Richard Houseal, Dale E.Jones, Alexei Krindatch, Richie Stanley and Richard H.Taylor. 2012. 2010 U.S.Religion Census: Religious Congregations & Membership Study. Association of Statisticians of American Religious Bodies. Jones, Dale E., et al. 2002. Congregations and Membership in the United States 2000. Nashville, TN: Glenmary Research Center. Graphs represent county-level data
Food Environment Statistics: Number of grocery stores : 263Hillsborough County :
2.25 / 10,000 pop.Florida :
2.04 / 10,000 pop.
Number of supercenters and club stores : 14Here :
0.12 / 10,000 pop.Florida :
0.11 / 10,000 pop.
Number of convenience stores (no gas) : 130Here :
1.11 / 10,000 pop.Florida :
1.28 / 10,000 pop.
Number of convenience stores (with gas) : 373This county :
3.19 / 10,000 pop.State :
3.04 / 10,000 pop.
Number of full-service restaurants : 761This county :
6.50 / 10,000 pop.Florida :
7.45 / 10,000 pop.
Adult diabetes rate : Hillsborough County :
8.7%State :
9.2%
Adult obesity rate : Hillsborough County :
25.2%Florida :
23.7%
Low-income preschool obesity rate : Hillsborough County :
13.6%Florida :
14.0%
Health and Nutrition:
Average overall health of teeth and gums : Average BMI : This city:
28.7Florida:
28.6
People feeling badly about themselves : This city:
20.5%Florida:
19.5%
People not drinking alcohol at all : Average hours sleeping at night : Overweight people : Citrus Park:
34.5%Florida:
34.7%
General health condition : Average condition of hearing : This city:
81.6%Florida:
79.2%
More about Health and Nutrition of Citrus Park, FL Residents
8.46% of this county's 2021 resident taxpayers lived in other counties in 2020 ($70,594 average adjusted gross income )
Here:
8.46%Florida average:
8.80%
0.08% of residents moved from foreign countries ($553 average AGI )Hillsborough County:
0.08%Florida average:
0.05%
Top counties from which taxpayers relocated into this county between 2020 and 2021:
7.78% of this county's 2020 resident taxpayers moved to other counties in 2021 ($64,211 average adjusted gross income )
Here:
7.78%Florida average:
7.45%
0.06% of residents moved to foreign countries ($494 average AGI )Hillsborough County:
0.06%Florida average:
0.04%
Top counties to which taxpayers relocated from this county between 2020 and 2021: Businesses in Citrus Park, FL
Strongest AM radio stations in Citrus Park:
WFLA (970 AM; 25 kW; TAMPA, FL; Owner: CITICASTERS LICENSES, L.P.)
WHNZ (1250 AM; 25 kW; TAMPA, FL; Owner: CITICASTERS LICENSES, L.P.)
WTMP (1150 AM; 10 kW; EGYPT LAKE, FL; Owner: TAMPA BROADCASTING, LTD.)
WMGG (820 AM; 50 kW; LARGO, FL; Owner: MEGA COMMUNICATIONS OF ST. PETERSBURG LICENSEE)
WQYK (1010 AM; 50 kW; SEFFNER, FL; Owner: INFINITY BROADCASTING CORPORATION OF TAMPA)
WTBN (570 AM; 5 kW; PINELLAS PARK, FL; Owner: COMMON GROUND BROADCASTING, INC.)
WGUL (860 AM; 5 kW; DUNEDIN, FL; Owner: WGUL-FM, INC.)
WTIS (1110 AM; daytime; 10 kW; TAMPA, FL; Owner: WTIS-AM, INC.)
WLCC (760 AM; 10 kW; BRANDON, FL; Owner: MEGA COMMUNICATIONS OF TAMPA LICENSEE)
WDAE (620 AM; 5 kW; ST. PETERSBURG, FL; Owner: CLEAR CHANNEL BROADCASTING LICENSES, INC.)
WFLF (540 AM; 50 kW; PINE HILLS, FL; Owner: CLEAR CHANNEL BROADCASTING LICENSES, INC.)
WAMA (1550 AM; 10 kW; TAMPA, FL; Owner: WAMA, INC)
WLVU (1470 AM; 5 kW; DUNEDIN, FL; Owner: GENESIS COMMUNICATIONS OF TAMPA BAY, INC.)
Strongest FM radio stations in Citrus Park:
WBBY (107.3 FM; ST. PETERSBURG, FL; Owner: COX RADIO, INC.)
WRBQ-FM (104.7 FM; TAMPA, FL; Owner: INFINITY RADIO OPERATIONS INC.)
WXTB (97.9 FM; CLEARWATER, FL; Owner: CITICASTERS LICENSES, L.P.)
WDUV (105.5 FM; NEW PORT RICHEY, FL; Owner: CXR HOLDINGS, INC.)
WPOI (101.5 FM; ST. PETERSBURG, FL; Owner: CXR HOLDINGS, INC.)
WSUN-FM (97.1 FM; HOLIDAY, FL; Owner: COX RADIO, INC)
WWRM (94.9 FM; TAMPA, FL; Owner: COX RADIO, INC.)
WFLZ-FM (93.3 FM; TAMPA, FL; Owner: CITICASTERS LICENSES, L.P.)
WMTX (100.7 FM; TAMPA, FL; Owner: CITICASTERS LICENSES, L.P.)
WQYK-FM (99.5 FM; ST. PETERSBURG, FL; Owner: INFINITY BROADCASTING CORPORATION OF FLORIDA)
WTBT (103.5 FM; BRADENTON, FL; Owner: CITICASTERS LICENSES, L.P.)
WSSR (95.7 FM; CLEARWATER, FL; Owner: CLEAR CHANNEL BROADCASTING LICENSES, INC.)
WUSF (89.7 FM; TAMPA, FL; Owner: UNIVERSITY OF S. FLORIDA)
WBVM (90.5 FM; TAMPA, FL; Owner: BISHOP OF THE DIOCESE/ST. PETERSBURG)
WYFE (88.9 FM; TARPON SPRINGS, FL; Owner: BIBLE BROADCASTING NETWORK, INC.)
WSJT (94.1 FM; LAKELAND, FL; Owner: INFINITY RADIO OPERATIONS INC.)
WHPT (102.5 FM; SARASOTA, FL; Owner: CXR HOLDINGS, INC.)
WLPJ (91.5 FM; NEW PORT RICHEY, FL; Owner: RADIO TRAINING NETWORK)
WYUU (92.5 FM; SAFETY HARBOR, FL; Owner: INFINITY RADIO OPERATIONS INC.)
WMNF (88.5 FM; TAMPA, FL; Owner: NATHAN B. STUBBLEFIELD FOUNDATION)
TV broadcast stations around Citrus Park:
WTSP (Channel 10; ST. PETERSBURG, FL; Owner: PACIFIC AND SOUTHERN COMPANY, INC.)
W48AY (Channel 48; OLDSMAR, FL; Owner: AMKA BROADCAST NETWORK, INC.)
W36CO (Channel 36; ST. PETERSBURG, FL; Owner: TRINITY BROADCASTING NETWORK)
WEDU (Channel 3; TAMPA, FL; Owner: FLORIDA WEST COAST PUBLIC BROADCASTING, INC.)
WRMD-LP (Channel 57; TAMPA, FL; Owner: ZGS TELEVISION OF TAMPA, INC.)
WFLA-TV (Channel 8; TAMPA, FL; Owner: MEDIA GENERAL COMMUNICATIONS, INC.)
WFTS-TV (Channel 28; TAMPA, FL; Owner: TAMPA BAY TELEVISION, INC.)
WTOG (Channel 44; ST. PETERSBURG, FL; Owner: VIACOM INTERNATIONAL INC.)
WUSF-TV (Channel 16; TAMPA, FL; Owner: UNIVERSITY OF SOUTH FLORIDA)
WXPX (Channel 66; BRADENTON, FL; Owner: PAXSON COMMUNICATION LICENSE COMPANY, LLC)
WVEA-LP (Channel 61; TAMPA, FL; Owner: ENTRAVISION HOLDINGS, LLC)
WTTA (Channel 38; ST. PETERSBURG, FL; Owner: BAY TELEVISION, INC.)
WFTT (Channel 50; TAMPA, FL; Owner: TELEFUTURA TAMPA LLC)
WTVT (Channel 13; TAMPA, FL; Owner: TVT LICENSE, INC.)
WCLF (Channel 22; CLEARWATER, FL; Owner: CHRISTIAN TELEVISION CORPORATION, INC.)
WTAM-LP (Channel 6; TAMPA, FL; Owner: U.S. INTERACTIVE, L.L.C.)
WARP-CA (Channel 20; TAMPA-ST. PETERSBURG, FL; Owner: SUNSHINE BROADCASTING COMPANY, INC.)
WXAX-LP (Channel 26; CLEARWATER, FL; Owner: TIGER EYE BROADCASTING CORP.)
W33CC (Channel 33; ST. PETERSBURG, FL; Owner: VENTANA TELEVISION, INC.)
WMOR-TV (Channel 32; LAKELAND, FL; Owner: WMOR-TV COMPANY)
W61AI (Channel 61; ROCK HARBOR, FL; Owner: MAKO COMMUNICATIONS, LLC)
W56EB (Channel 56; TAMPA, FL; Owner: TRINITY BROADCASTING NETWORK)
WWSB (Channel 40; SARASOTA, FL; Owner: SOUTHERN BROADCAST CORPORATION OF SARASOTA)
WMOR-LP (Channel 63; ST. PETERSBURG, FL; Owner: WMOR-TV COMPANY)
WSVT-LP (Channel 18; BRADENTON, FL; Owner: WORD OF GOD FELLOWSHIP, INC.)
FCC Registered Antenna Towers: 7
Marin Fettman, 7502 Gunn Highway (G052-A) (Lat: 28.075278 Lon: -82.570833), Type: 50.3, Overall height: 50.3 m, Registrant: Voicestream Tampa/Orlando, Inc., Marin.Fettman@t-Mobile.Com, , Belle-vue, Phone: (425) 378-4000 Dan Menser, 7502 Gunn Highway (G052-A) (Lat: 28.075278 Lon: -82.570833), Type: 50.3, Overall height: 50.3 m, Registrant: Voicestream Tampa/Orlando, Inc., Dan.Menser@t-Mobile.Com, , Belle-vue, Phone: (425) 378-4000 Marin Fettman, 7502 Gunn Highway (G052-A) (Lat: 28.075278 Lon: -82.570833), Type: 50.3, Overall height: 50.3 m, Registrant: T-Mobile South LLC, Fccregulatorycompliancecontact@t-Mobile.Com, , Belle-vue, Phone: (425) 383-8401 Marin Fettman, 7502 Gunn Highway (G052-A) (Lat: 28.075278 Lon: -82.570833), Type: 50.3, Overall height: 50.3 m, Registrant: T-Mobile South LLC, Fccregulatorycompliancecontact@t-Mobile.Com, , Belle-vue, Phone: (425) 383-8401 MARIN FETTMAN, 7502 Gunn Highway (G052-A) (Lat: 28.075278 Lon: -82.570833), Type: 50.3, Overall height: 50.3 m, Registrant: T-Mobile South LLC, Marin.Fettman@t-Mobile.Com, , Belle-vue, Phone: (425) 378-4000 Dan Menser, 7502 Gunn Highway (G052-A) (Lat: 28.075278 Lon: -82.570833), Type: 50.3, Overall height: 50.3 m, Registrant: T-Mobile South LLC, Fccasrrequest@t-Mobile.Com, , Belle-vue, Phone: (425) 383-5178 Shannon Reilly Kraus, 7502 Gunn Highway (G052-A) (Lat: 28.075278 Lon: -82.570833), Type: 50.3, Overall height: 50.3 m, Registrant: T-Mobile South LLC, Fccregulatorycompliancecontact@t-Mobile.Com, , Belle-vue, Phone: (425) 383-8401 FCC Registered Private Land Mobile Towers: 2
Hutchinson Rd W (Lat: 28.097806 Lon: -82.542861), Type: Building, Structure height: 9 m, Call Sign: WPLX413, Assigned Frequencies: 912.000 MHz, 912.750 MHz, 913.000 MHz, 916.000 MHz, 918.750 MHz, 919.000 MHz, 921.000 MHz, 921.500 MHz, 903.000 MHz, 910.000 MHz, 918.000 MHz, Grant Date: 02/10/2023, Expiration Date: 03/31/2033, Certifier: Robert L Gottschalk, Registrant: State Of Florida, 605 Suwannee Street, Ms 90, Tallahassee, FL 32399-0450, Phone: (850) 410-5600, Fax: (850) 410-5501, Email:
Van Dyke Rd W (Lat: 28.163889 Lon: -82.549806), Type: Building, Structure height: 9 m, Call Sign: WPML268, Assigned Frequencies: 912.000 MHz, 912.750 MHz, 913.000 MHz, 916.000 MHz, 918.750 MHz, 919.000 MHz, 921.000 MHz, 921.500 MHz, 903.000 MHz, 910.000 MHz, 918.000 MHz, Grant Date: 07/12/2023, Expiration Date: 09/01/2033, Certifier: Robert L Gottschalk, Registrant: State Of Florida, 605 Suwannee Street, Ms 90, Tallahassee, FL 32399-0450, Phone: (850) 410-5600, Fax: (850) 410-5501, Email:
FCC Registered Microwave Towers: 4
TAM0412, Deadend Of Horse Pond Rd Off Peterson Rd (Lat: 28.094806 Lon: -82.566806), Type: Pole, Structure height: 46.6 m, Call Sign: WQFD403, Licensee ID: L01728370, Assigned Frequencies: 11325.0 MHz, 11405.0 MHz, Grant Date: 06/20/2006, Expiration Date: 06/20/2016, Cancellation Date: 09/06/2013, Certifier: Joseph M Sandri Jr., Registrant: Fibertower Network Services, Corp., Debtor-In-Possession, 1875 Eye Street, Nw, 5th Floor, Room 505, Washington, DC 20006, Phone: (202) 223-1028, Email:
TA03XC014, 7718 Gardner Road (Lat: 28.050611 Lon: -82.567472), Type: Pole, Structure height: 54.9 m, Call Sign: WQML505, Assigned Frequencies: 19575.0 MHz, 19625.0 MHz, 19575.0 MHz, 19625.0 MHz, 19575.0 MHz, 19625.0 MHz, 19575.0 MHz, 19625.0 MHz, 19575.0 MHz, 19625.0 MHz... (+13 more), Grant Date: 09/14/2010, Expiration Date: 09/14/2020, Cancellation Date: 08/11/2020, Certifier: Nadja S Sodos-Wallace, Registrant: Sprint Corporation, 12502 Sunrise Valley Drive, M/S: Varesa0209, Reston, VA 20196, Phone: (800) 572-8256, Fax: (703) 433-4483, Email:
A2G0052A, 7502 Gunn Highway (G052-A) (Lat: 28.075278 Lon: -82.570833), Type: Ltower, Structure height: 50.3 m, Call Sign: WRMU897, Assigned Frequencies: 23025.0 MHz, 23025.0 MHz, 23025.0 MHz, 23025.0 MHz, 23025.0 MHz, 23025.0 MHz, 23025.0 MHz, 23025.0 MHz, 23025.0 MHz, 23025.0 MHz, Grant Date: 06/08/2021, Expiration Date: 06/08/2031, Cancellation Date: 03/07/2024, Certifier: David Werblow, Registrant: T-Mobile Usa, Inc., 12920 Se 38th Street, Bellevue, WA 98006, Phone: (425) 383-8401, Fax: (425) 383-4040, Email:
A2G1803A, 13421 Sheldon Road (Lat: 28.070944 Lon: -82.582000), Type: Mtower, Structure height: 51.8 m, Call Sign: WRMU898, Assigned Frequencies: 21825.0 MHz, 21825.0 MHz, 21825.0 MHz, 21825.0 MHz, 21825.0 MHz, 21825.0 MHz, 21825.0 MHz, 21825.0 MHz, 21825.0 MHz, 21825.0 MHz, Grant Date: 06/08/2021, Expiration Date: 06/08/2031, Cancellation Date: 03/07/2024, Certifier: David Werblow, Registrant: T-Mobile Usa, Inc., 12920 Se 38th Street, Bellevue, WA 98006, Phone: (425) 383-8401, Fax: (425) 383-4040, Email:
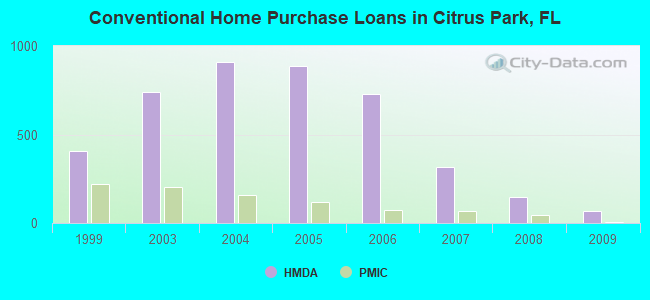
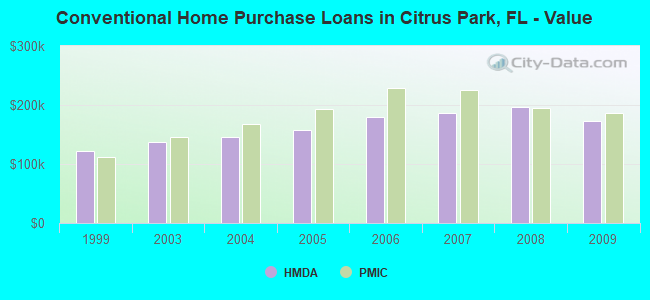
Home Mortgage Disclosure Act Aggregated Statistics For Year 2009(Based on 4 full and 1 partial tracts) A) FHA, FSA/RHS & VA B) Conventional C) Refinancings D) Home Improvement Loans F) Non-occupant Loans on G) Loans On Manufactured Number Average Value Number Average Value Number Average Value Number Average Value Number Average Value Number Average Value
LOANS ORIGINATED 119 $151,454 70 $172,210 240 $163,712 10 $97,570 19 $97,825 8 $108,335 APPLICATIONS APPROVED, NOT ACCEPTED 7 $119,983 7 $106,209 29 $170,878 4 $13,688 3 $155,667 2 $78,500 APPLICATIONS DENIED 27 $146,008 28 $159,105 142 $185,493 12 $64,132 21 $119,554 15 $85,027 APPLICATIONS WITHDRAWN 18 $136,397 7 $160,001 91 $175,894 1 $5,550 2 $97,970 4 $128,750 FILES CLOSED FOR INCOMPLETENESS 1 $211,000 2 $150,825 22 $178,906 0 $0 0 $0 0 $0
Aggregated Statistics For Year 2008(Based on 4 full and 1 partial tracts) A) FHA, FSA/RHS & VA B) Conventional C) Refinancings D) Home Improvement Loans E) Loans on Dwellings For 5+ Families F) Non-occupant Loans on G) Loans On Manufactured Number Average Value Number Average Value Number Average Value Number Average Value Number Average Value Number Average Value Number Average Value
LOANS ORIGINATED 93 $179,266 147 $196,057 247 $169,821 38 $47,477 0 $0 32 $137,487 8 $94,969 APPLICATIONS APPROVED, NOT ACCEPTED 5 $169,684 25 $180,139 54 $189,838 13 $43,005 0 $0 5 $136,544 4 $89,500 APPLICATIONS DENIED 17 $176,596 45 $199,796 214 $191,186 44 $70,950 0 $0 19 $250,437 12 $92,000 APPLICATIONS WITHDRAWN 9 $166,999 21 $208,781 78 $185,424 7 $84,221 0 $0 7 $189,350 4 $95,500 FILES CLOSED FOR INCOMPLETENESS 4 $187,250 7 $179,526 27 $204,881 5 $100,744 1 $2,650,000 4 $176,540 1 $178,000
Aggregated Statistics For Year 2007(Based on 4 full and 1 partial tracts) A) FHA, FSA/RHS & VA B) Conventional C) Refinancings D) Home Improvement Loans E) Loans on Dwellings For 5+ Families F) Non-occupant Loans on G) Loans On Manufactured Number Average Value Number Average Value Number Average Value Number Average Value Number Average Value Number Average Value Number Average Value
LOANS ORIGINATED 47 $187,806 319 $187,089 595 $181,042 76 $91,016 1 $169,000 62 $176,754 11 $103,528 APPLICATIONS APPROVED, NOT ACCEPTED 2 $190,500 108 $168,591 128 $169,814 27 $62,084 0 $0 19 $150,558 4 $72,698 APPLICATIONS DENIED 16 $169,750 98 $183,536 416 $189,847 78 $76,330 0 $0 36 $179,588 7 $147,000 APPLICATIONS WITHDRAWN 6 $195,000 35 $153,594 194 $182,961 25 $144,036 0 $0 9 $174,057 7 $140,429 FILES CLOSED FOR INCOMPLETENESS 1 $186,000 20 $177,548 56 $201,710 7 $105,000 0 $0 6 $169,833 1 $25,000
Aggregated Statistics For Year 2006(Based on 4 full and 1 partial tracts) A) FHA, FSA/RHS & VA B) Conventional C) Refinancings D) Home Improvement Loans E) Loans on Dwellings For 5+ Families F) Non-occupant Loans on G) Loans On Manufactured Number Average Value Number Average Value Number Average Value Number Average Value Number Average Value Number Average Value Number Average Value
LOANS ORIGINATED 10 $197,782 728 $179,072 915 $173,124 120 $100,828 0 $0 163 $158,805 11 $122,827 APPLICATIONS APPROVED, NOT ACCEPTED 0 $0 98 $197,678 165 $158,891 29 $93,518 0 $0 27 $155,584 5 $113,800 APPLICATIONS DENIED 1 $205,000 199 $153,875 424 $166,536 86 $100,270 0 $0 53 $145,322 27 $98,016 APPLICATIONS WITHDRAWN 6 $150,118 73 $220,117 296 $170,456 39 $111,364 1 $10,000 12 $175,131 4 $86,612 FILES CLOSED FOR INCOMPLETENESS 0 $0 35 $189,605 109 $181,035 6 $83,992 0 $0 12 $139,083 0 $0
Aggregated Statistics For Year 2005(Based on 4 full and 1 partial tracts) A) FHA, FSA/RHS & VA B) Conventional C) Refinancings D) Home Improvement Loans F) Non-occupant Loans on G) Loans On Manufactured Number Average Value Number Average Value Number Average Value Number Average Value Number Average Value Number Average Value
LOANS ORIGINATED 22 $146,695 886 $158,062 811 $150,081 79 $99,369 177 $134,238 8 $97,471 APPLICATIONS APPROVED, NOT ACCEPTED 4 $145,678 110 $149,660 142 $129,509 22 $83,005 22 $144,682 5 $53,400 APPLICATIONS DENIED 8 $131,018 199 $133,771 401 $141,952 56 $65,216 33 $135,307 18 $81,199 APPLICATIONS WITHDRAWN 4 $130,250 115 $145,510 306 $145,180 37 $148,073 31 $162,389 5 $69,200 FILES CLOSED FOR INCOMPLETENESS 0 $0 37 $175,886 175 $148,734 11 $55,724 3 $113,687 1 $94,850
Aggregated Statistics For Year 2004(Based on 4 full and 1 partial tracts) A) FHA, FSA/RHS & VA B) Conventional C) Refinancings D) Home Improvement Loans E) Loans on Dwellings For 5+ Families F) Non-occupant Loans on G) Loans On Manufactured Number Average Value Number Average Value Number Average Value Number Average Value Number Average Value Number Average Value Number Average Value
LOANS ORIGINATED 74 $146,175 910 $146,316 717 $122,356 93 $59,810 1 $16,394,000 142 $123,402 11 $68,182 APPLICATIONS APPROVED, NOT ACCEPTED 4 $140,500 106 $150,235 151 $116,824 24 $68,440 0 $0 14 $139,022 5 $68,858 APPLICATIONS DENIED 16 $120,441 153 $120,162 359 $116,797 86 $54,331 0 $0 35 $125,190 14 $72,709 APPLICATIONS WITHDRAWN 10 $118,229 111 $155,191 225 $122,523 15 $46,857 0 $0 12 $114,952 7 $92,143 FILES CLOSED FOR INCOMPLETENESS 1 $114,000 29 $165,259 146 $129,426 9 $56,076 0 $0 4 $128,000 2 $119,500
Aggregated Statistics For Year 2003(Based on 4 full and 1 partial tracts) A) FHA, FSA/RHS & VA B) Conventional C) Refinancings D) Home Improvement Loans F) Non-occupant Loans on Number Average Value Number Average Value Number Average Value Number Average Value Number Average Value
LOANS ORIGINATED 98 $131,472 741 $137,499 1,496 $115,683 53 $36,172 124 $104,737 APPLICATIONS APPROVED, NOT ACCEPTED 7 $119,499 82 $150,028 201 $111,376 24 $43,991 17 $109,235 APPLICATIONS DENIED 15 $114,340 90 $128,981 505 $109,733 48 $27,103 28 $84,353 APPLICATIONS WITHDRAWN 8 $123,316 77 $129,835 298 $112,330 11 $31,909 20 $106,676 FILES CLOSED FOR INCOMPLETENESS 4 $129,500 22 $145,354 79 $108,193 5 $19,216 7 $81,961
Aggregated Statistics For Year 1999(Based on 1 full and 2 partial tracts) A) FHA, FSA/RHS & VA B) Conventional C) Refinancings D) Home Improvement Loans F) Non-occupant Loans on Number Average Value Number Average Value Number Average Value Number Average Value Number Average Value
LOANS ORIGINATED 215 $92,586 407 $121,396 409 $74,033 87 $22,179 36 $72,223 APPLICATIONS APPROVED, NOT ACCEPTED 7 $95,093 49 $88,287 120 $90,174 38 $24,549 9 $71,620 APPLICATIONS DENIED 20 $82,520 98 $98,709 304 $66,601 101 $22,439 11 $62,575 APPLICATIONS WITHDRAWN 15 $102,411 38 $111,892 156 $72,762 15 $46,693 3 $73,523 FILES CLOSED FOR INCOMPLETENESS 6 $91,287 13 $94,889 77 $82,090 4 $29,108 2 $73,130
Detailed HMDA statistics for the following Tracts:
0114.10
, 0114.12 , 0114.13 , 0114.14 , 0114.15
Private Mortgage Insurance Companies Aggregated Statistics For Year 2009(Based on 3 full and 1 partial tracts) A) Conventional B) Refinancings Number Average Value Number Average Value
LOANS ORIGINATED 8 $186,949 2 $136,500 APPLICATIONS APPROVED, NOT ACCEPTED 2 $76,280 2 $231,000 APPLICATIONS DENIED 2 $338,000 1 $53,480 APPLICATIONS WITHDRAWN 2 $155,000 0 $0 FILES CLOSED FOR INCOMPLETENESS 0 $0 0 $0
Aggregated Statistics For Year 2008(Based on 4 full and 1 partial tracts) A) Conventional B) Refinancings C) Non-occupant Loans on Number Average Value Number Average Value Number Average Value
LOANS ORIGINATED 48 $195,582 17 $216,878 6 $163,740 APPLICATIONS APPROVED, NOT ACCEPTED 22 $215,110 18 $224,724 2 $206,500 APPLICATIONS DENIED 11 $169,474 4 $154,120 5 $158,800 APPLICATIONS WITHDRAWN 3 $262,000 1 $198,000 3 $176,000 FILES CLOSED FOR INCOMPLETENESS 0 $0 1 $108,000 1 $108,000
Aggregated Statistics For Year 2007(Based on 4 full and 1 partial tracts) A) Conventional B) Refinancings C) Non-occupant Loans on Number Average Value Number Average Value Number Average Value
LOANS ORIGINATED 65 $226,006 60 $216,848 11 $238,806 APPLICATIONS APPROVED, NOT ACCEPTED 13 $230,628 17 $211,449 3 $262,000 APPLICATIONS DENIED 0 $0 2 $161,520 0 $0 APPLICATIONS WITHDRAWN 1 $260,000 8 $260,009 0 $0 FILES CLOSED FOR INCOMPLETENESS 0 $0 1 $299,000 0 $0
Aggregated Statistics For Year 2006(Based on 4 full and 1 partial tracts) A) Conventional B) Refinancings C) Non-occupant Loans on Number Average Value Number Average Value Number Average Value
LOANS ORIGINATED 72 $229,539 32 $218,821 16 $200,082 APPLICATIONS APPROVED, NOT ACCEPTED 11 $283,537 9 $173,629 1 $192,720 APPLICATIONS DENIED 0 $0 2 $216,500 1 $226,000 APPLICATIONS WITHDRAWN 1 $204,000 3 $191,847 2 $185,500 FILES CLOSED FOR INCOMPLETENESS 2 $154,855 0 $0 0 $0
Aggregated Statistics For Year 2005(Based on 4 full and 1 partial tracts) A) Conventional B) Refinancings C) Non-occupant Loans on Number Average Value Number Average Value Number Average Value
LOANS ORIGINATED 118 $193,176 39 $183,744 22 $174,685 APPLICATIONS APPROVED, NOT ACCEPTED 22 $217,842 14 $161,291 5 $135,708 APPLICATIONS DENIED 2 $316,000 0 $0 1 $132,000 APPLICATIONS WITHDRAWN 11 $243,176 3 $145,333 1 $58,020 FILES CLOSED FOR INCOMPLETENESS 0 $0 0 $0 0 $0
Aggregated Statistics For Year 2004(Based on 4 full and 1 partial tracts) A) Conventional B) Refinancings C) Non-occupant Loans on Number Average Value Number Average Value Number Average Value
LOANS ORIGINATED 158 $168,539 51 $140,924 21 $152,054 APPLICATIONS APPROVED, NOT ACCEPTED 103 $163,864 21 $130,019 7 $123,237 APPLICATIONS DENIED 3 $110,667 0 $0 2 $131,000 APPLICATIONS WITHDRAWN 19 $188,499 5 $119,200 1 $110,000 FILES CLOSED FOR INCOMPLETENESS 11 $129,273 1 $200,000 3 $102,000
Aggregated Statistics For Year 2003(Based on 4 full and 1 partial tracts) A) Conventional B) Refinancings C) Non-occupant Loans on Number Average Value Number Average Value Number Average Value
LOANS ORIGINATED 204 $145,960 139 $133,706 31 $130,365 APPLICATIONS APPROVED, NOT ACCEPTED 193 $139,376 31 $123,651 15 $144,200 APPLICATIONS DENIED 16 $165,812 4 $132,558 3 $165,000 APPLICATIONS WITHDRAWN 38 $141,167 8 $134,666 7 $114,979 FILES CLOSED FOR INCOMPLETENESS 1 $143,000 0 $0 0 $0
Aggregated Statistics For Year 1999(Based on 1 full and 2 partial tracts) A) Conventional B) Refinancings C) Non-occupant Loans on Number Average Value Number Average Value Number Average Value
LOANS ORIGINATED 223 $111,281 55 $99,787 14 $77,319 APPLICATIONS APPROVED, NOT ACCEPTED 41 $110,843 11 $120,321 4 $80,865 APPLICATIONS DENIED 74 $107,631 1 $42,190 1 $93,990 APPLICATIONS WITHDRAWN 26 $129,751 4 $121,300 1 $97,150 FILES CLOSED FOR INCOMPLETENESS 36 $126,611 2 $89,810 2 $102,055
Detailed PMIC statistics for the following Tracts:
0114.10
, 0114.12 , 0114.13 , 0114.14 , 0114.15 Citrus Park compared to Florida state average:
Unemployed percentage significantly below state average. Hispanic race population percentage above state average. Foreign-born population percentage above state average. Length of stay since moving in significantly above state average. House age below state average. Percentage of population with a bachelor's degree or higher above state average. Citrus Park on our top lists :
#49 on the list of "Top 101 cities with the most residents born in Venezuela (population 500+)"
#54 on the list of "Top 101 cities with the most residents born in Sierra Leone (population 500+)"
#71 on the list of "Top 101 cities with largest percentage of males in occupations: office and administrative support occupations (population 5,000+)"
#78 on the list of "Top 101 cities with the most residents born in Dominican Republic (population 500+)"
#3 on the list of "Top 101 counties with the largest number of people moving in compared to moving out (pop. 50,000+)"
#16 on the list of "Top 101 counties with the most Evangelical Protestant congregations"
#17 on the list of "Top 101 counties with the most Evangelical Protestant adherents"
#22 on the list of "Top 101 counties with the highest percentage of residents relocating from other counties between 2010 and 2011 (pop. 50,000+)"
#27 on the list of "Top 101 counties with the highest ground withdrawal of fresh water for public supply"


 Recent articles from our blog. Our writers, many of them Ph.D. graduates or candidates, create easy-to-read articles on a wide variety of topics.


 , pop. 100,423).