Collierville, Tennessee Submit your own pictures of this town and show them to the world
OSM Map
General Map
Google Map
MSN Map
OSM Map
General Map
Google Map
MSN Map
OSM Map
General Map
Google Map
MSN Map
OSM Map
General Map
Google Map
MSN Map
Please wait while loading the map...
Population in 2022: 51,594 (100% urban, 0% rural). Population change since 2000: +61.9%Males: 24,586 Females: 27,008
March 2022 cost of living index in Collierville: 87.2 (less than average, U.S. average is 100) Percentage of residents living in poverty in 2022: 2.7%for White Non-Hispanic residents , 10.0% for Black residents , 1.8% for Hispanic or Latino residents , 2.7% for two or more races residents )
Profiles of local businesses
Business Search - 14 Million verified businesses
Data:
Median household income ($)
Median household income (% change since 2000)
Household income diversity
Ratio of average income to average house value (%)
Ratio of average income to average rent
Median household income ($) - White
Median household income ($) - Black or African American
Median household income ($) - Asian
Median household income ($) - Hispanic or Latino
Median household income ($) - American Indian and Alaska Native
Median household income ($) - Multirace
Median household income ($) - Other Race
Median household income for houses/condos with a mortgage ($)
Median household income for apartments without a mortgage ($)
Races - White alone (%)
Races - White alone (% change since 2000)
Races - Black alone (%)
Races - Black alone (% change since 2000)
Races - American Indian alone (%)
Races - American Indian alone (% change since 2000)
Races - Asian alone (%)
Races - Asian alone (% change since 2000)
Races - Hispanic (%)
Races - Hispanic (% change since 2000)
Races - Native Hawaiian and Other Pacific Islander alone (%)
Races - Native Hawaiian and Other Pacific Islander alone (% change since 2000)
Races - Two or more races (%)
Races - Two or more races (% change since 2000)
Races - Other race alone (%)
Races - Other race alone (% change since 2000)
Racial diversity
Unemployment (%)
Unemployment (% change since 2000)
Unemployment (%) - White
Unemployment (%) - Black or African American
Unemployment (%) - Asian
Unemployment (%) - Hispanic or Latino
Unemployment (%) - American Indian and Alaska Native
Unemployment (%) - Multirace
Unemployment (%) - Other Race
Population density (people per square mile)
Population - Males (%)
Population - Females (%)
Population - Males (%) - White
Population - Males (%) - Black or African American
Population - Males (%) - Asian
Population - Males (%) - Hispanic or Latino
Population - Males (%) - American Indian and Alaska Native
Population - Males (%) - Multirace
Population - Males (%) - Other Race
Population - Females (%) - White
Population - Females (%) - Black or African American
Population - Females (%) - Asian
Population - Females (%) - Hispanic or Latino
Population - Females (%) - American Indian and Alaska Native
Population - Females (%) - Multirace
Population - Females (%) - Other Race
Coronavirus confirmed cases (Apr 25, 2024)
Deaths caused by coronavirus (Apr 25, 2024)
Coronavirus confirmed cases (per 100k population) (Apr 25, 2024)
Deaths caused by coronavirus (per 100k population) (Apr 25, 2024)
Daily increase in number of cases (Apr 25, 2024)
Weekly increase in number of cases (Apr 25, 2024)
Cases doubled (in days) (Apr 25, 2024)
Hospitalized patients (Apr 18, 2022)
Negative test results (Apr 18, 2022)
Total test results (Apr 18, 2022)
COVID Vaccine doses distributed (per 100k population) (Sep 19, 2023)
COVID Vaccine doses administered (per 100k population) (Sep 19, 2023)
COVID Vaccine doses distributed (Sep 19, 2023)
COVID Vaccine doses administered (Sep 19, 2023)
Likely homosexual households (%)
Likely homosexual households (% change since 2000)
Likely homosexual households - Lesbian couples (%)
Likely homosexual households - Lesbian couples (% change since 2000)
Likely homosexual households - Gay men (%)
Likely homosexual households - Gay men (% change since 2000)
Cost of living index
Median gross rent ($)
Median contract rent ($)
Median monthly housing costs ($)
Median house or condo value ($)
Median house or condo value ($ change since 2000)
Mean house or condo value by units in structure - 1, detached ($)
Mean house or condo value by units in structure - 1, attached ($)
Mean house or condo value by units in structure - 2 ($)
Mean house or condo value by units in structure by units in structure - 3 or 4 ($)
Mean house or condo value by units in structure - 5 or more ($)
Mean house or condo value by units in structure - Boat, RV, van, etc. ($)
Mean house or condo value by units in structure - Mobile home ($)
Median house or condo value ($) - White
Median house or condo value ($) - Black or African American
Median house or condo value ($) - Asian
Median house or condo value ($) - Hispanic or Latino
Median house or condo value ($) - American Indian and Alaska Native
Median house or condo value ($) - Multirace
Median house or condo value ($) - Other Race
Median resident age
Resident age diversity
Median resident age - Males
Median resident age - Females
Median resident age - White
Median resident age - Black or African American
Median resident age - Asian
Median resident age - Hispanic or Latino
Median resident age - American Indian and Alaska Native
Median resident age - Multirace
Median resident age - Other Race
Median resident age - Males - White
Median resident age - Males - Black or African American
Median resident age - Males - Asian
Median resident age - Males - Hispanic or Latino
Median resident age - Males - American Indian and Alaska Native
Median resident age - Males - Multirace
Median resident age - Males - Other Race
Median resident age - Females - White
Median resident age - Females - Black or African American
Median resident age - Females - Asian
Median resident age - Females - Hispanic or Latino
Median resident age - Females - American Indian and Alaska Native
Median resident age - Females - Multirace
Median resident age - Females - Other Race
Commute - mean travel time to work (minutes)
Travel time to work - Less than 5 minutes (%)
Travel time to work - Less than 5 minutes (% change since 2000)
Travel time to work - 5 to 9 minutes (%)
Travel time to work - 5 to 9 minutes (% change since 2000)
Travel time to work - 10 to 19 minutes (%)
Travel time to work - 10 to 19 minutes (% change since 2000)
Travel time to work - 20 to 29 minutes (%)
Travel time to work - 20 to 29 minutes (% change since 2000)
Travel time to work - 30 to 39 minutes (%)
Travel time to work - 30 to 39 minutes (% change since 2000)
Travel time to work - 40 to 59 minutes (%)
Travel time to work - 40 to 59 minutes (% change since 2000)
Travel time to work - 60 to 89 minutes (%)
Travel time to work - 60 to 89 minutes (% change since 2000)
Travel time to work - 90 or more minutes (%)
Travel time to work - 90 or more minutes (% change since 2000)
Marital status - Never married (%)
Marital status - Now married (%)
Marital status - Separated (%)
Marital status - Widowed (%)
Marital status - Divorced (%)
Median family income ($)
Median family income (% change since 2000)
Median non-family income ($)
Median non-family income (% change since 2000)
Median per capita income ($)
Median per capita income (% change since 2000)
Median family income ($) - White
Median family income ($) - Black or African American
Median family income ($) - Asian
Median family income ($) - Hispanic or Latino
Median family income ($) - American Indian and Alaska Native
Median family income ($) - Multirace
Median family income ($) - Other Race
Median year house/condo built
Median year apartment built
Year house built - Built 2005 or later (%)
Year house built - Built 2000 to 2004 (%)
Year house built - Built 1990 to 1999 (%)
Year house built - Built 1980 to 1989 (%)
Year house built - Built 1970 to 1979 (%)
Year house built - Built 1960 to 1969 (%)
Year house built - Built 1950 to 1959 (%)
Year house built - Built 1940 to 1949 (%)
Year house built - Built 1939 or earlier (%)
Average household size
Household density (households per square mile)
Average household size - White
Average household size - Black or African American
Average household size - Asian
Average household size - Hispanic or Latino
Average household size - American Indian and Alaska Native
Average household size - Multirace
Average household size - Other Race
Occupied housing units (%)
Vacant housing units (%)
Owner occupied housing units (%)
Renter occupied housing units (%)
Vacancy status - For rent (%)
Vacancy status - For sale only (%)
Vacancy status - Rented or sold, not occupied (%)
Vacancy status - For seasonal, recreational, or occasional use (%)
Vacancy status - For migrant workers (%)
Vacancy status - Other vacant (%)
Residents with income below the poverty level (%)
Residents with income below 50% of the poverty level (%)
Children below poverty level (%)
Poor families by family type - Married-couple family (%)
Poor families by family type - Male, no wife present (%)
Poor families by family type - Female, no husband present (%)
Poverty status for native-born residents (%)
Poverty status for foreign-born residents (%)
Poverty among high school graduates not in families (%)
Poverty among people who did not graduate high school not in families (%)
Residents with income below the poverty level (%) - White
Residents with income below the poverty level (%) - Black or African American
Residents with income below the poverty level (%) - Asian
Residents with income below the poverty level (%) - Hispanic or Latino
Residents with income below the poverty level (%) - American Indian and Alaska Native
Residents with income below the poverty level (%) - Multirace
Residents with income below the poverty level (%) - Other Race
Air pollution - Air Quality Index (AQI)
Air pollution - CO
Air pollution - NO2
Air pollution - SO2
Air pollution - Ozone
Air pollution - PM10
Air pollution - PM25
Air pollution - Pb
Crime - Murders per 100,000 population
Crime - Rapes per 100,000 population
Crime - Robberies per 100,000 population
Crime - Assaults per 100,000 population
Crime - Burglaries per 100,000 population
Crime - Thefts per 100,000 population
Crime - Auto thefts per 100,000 population
Crime - Arson per 100,000 population
Crime - City-data.com crime index
Crime - Violent crime index
Crime - Property crime index
Crime - Murders per 100,000 population (5 year average)
Crime - Rapes per 100,000 population (5 year average)
Crime - Robberies per 100,000 population (5 year average)
Crime - Assaults per 100,000 population (5 year average)
Crime - Burglaries per 100,000 population (5 year average)
Crime - Thefts per 100,000 population (5 year average)
Crime - Auto thefts per 100,000 population (5 year average)
Crime - Arson per 100,000 population (5 year average)
Crime - City-data.com crime index (5 year average)
Crime - Violent crime index (5 year average)
Crime - Property crime index (5 year average)
1996 Presidential Elections Results (%) - Democratic Party (Clinton)
1996 Presidential Elections Results (%) - Republican Party (Dole)
1996 Presidential Elections Results (%) - Other
2000 Presidential Elections Results (%) - Democratic Party (Gore)
2000 Presidential Elections Results (%) - Republican Party (Bush)
2000 Presidential Elections Results (%) - Other
2004 Presidential Elections Results (%) - Democratic Party (Kerry)
2004 Presidential Elections Results (%) - Republican Party (Bush)
2004 Presidential Elections Results (%) - Other
2008 Presidential Elections Results (%) - Democratic Party (Obama)
2008 Presidential Elections Results (%) - Republican Party (McCain)
2008 Presidential Elections Results (%) - Other
2012 Presidential Elections Results (%) - Democratic Party (Obama)
2012 Presidential Elections Results (%) - Republican Party (Romney)
2012 Presidential Elections Results (%) - Other
2016 Presidential Elections Results (%) - Democratic Party (Clinton)
2016 Presidential Elections Results (%) - Republican Party (Trump)
2016 Presidential Elections Results (%) - Other
2020 Presidential Elections Results (%) - Democratic Party (Biden)
2020 Presidential Elections Results (%) - Republican Party (Trump)
2020 Presidential Elections Results (%) - Other
Ancestries Reported - Arab (%)
Ancestries Reported - Czech (%)
Ancestries Reported - Danish (%)
Ancestries Reported - Dutch (%)
Ancestries Reported - English (%)
Ancestries Reported - French (%)
Ancestries Reported - French Canadian (%)
Ancestries Reported - German (%)
Ancestries Reported - Greek (%)
Ancestries Reported - Hungarian (%)
Ancestries Reported - Irish (%)
Ancestries Reported - Italian (%)
Ancestries Reported - Lithuanian (%)
Ancestries Reported - Norwegian (%)
Ancestries Reported - Polish (%)
Ancestries Reported - Portuguese (%)
Ancestries Reported - Russian (%)
Ancestries Reported - Scotch-Irish (%)
Ancestries Reported - Scottish (%)
Ancestries Reported - Slovak (%)
Ancestries Reported - Subsaharan African (%)
Ancestries Reported - Swedish (%)
Ancestries Reported - Swiss (%)
Ancestries Reported - Ukrainian (%)
Ancestries Reported - United States (%)
Ancestries Reported - Welsh (%)
Ancestries Reported - West Indian (%)
Ancestries Reported - Other (%)
Educational Attainment - No schooling completed (%)
Educational Attainment - Less than high school (%)
Educational Attainment - High school or equivalent (%)
Educational Attainment - Less than 1 year of college (%)
Educational Attainment - 1 or more years of college (%)
Educational Attainment - Associate degree (%)
Educational Attainment - Bachelor's degree (%)
Educational Attainment - Master's degree (%)
Educational Attainment - Professional school degree (%)
Educational Attainment - Doctorate degree (%)
School Enrollment - Nursery, preschool (%)
School Enrollment - Kindergarten (%)
School Enrollment - Grade 1 to 4 (%)
School Enrollment - Grade 5 to 8 (%)
School Enrollment - Grade 9 to 12 (%)
School Enrollment - College undergrad (%)
School Enrollment - Graduate or professional (%)
School Enrollment - Not enrolled in school (%)
School enrollment - Public schools (%)
School enrollment - Private schools (%)
School enrollment - Not enrolled (%)
Median number of rooms in houses and condos
Median number of rooms in apartments
Housing units lacking complete plumbing facilities (%)
Housing units lacking complete kitchen facilities (%)
Density of houses
Urban houses (%)
Rural houses (%)
Households with people 60 years and over (%)
Households with people 65 years and over (%)
Households with people 75 years and over (%)
Households with one or more nonrelatives (%)
Households with no nonrelatives (%)
Population in households (%)
Family households (%)
Nonfamily households (%)
Population in families (%)
Family households with own children (%)
Median number of bedrooms in owner occupied houses
Mean number of bedrooms in owner occupied houses
Median number of bedrooms in renter occupied houses
Mean number of bedrooms in renter occupied houses
Median number of vehichles in owner occupied houses
Mean number of vehichles in owner occupied houses
Median number of vehichles in renter occupied houses
Mean number of vehichles in renter occupied houses
Mortgage status - with mortgage (%)
Mortgage status - with second mortgage (%)
Mortgage status - with home equity loan (%)
Mortgage status - with both second mortgage and home equity loan (%)
Mortgage status - without a mortgage (%)
Average family size
Average family size - White
Average family size - Black or African American
Average family size - Asian
Average family size - Hispanic or Latino
Average family size - American Indian and Alaska Native
Average family size - Multirace
Average family size - Other Race
Geographical mobility - Same house 1 year ago (%)
Geographical mobility - Moved within same county (%)
Geographical mobility - Moved from different county within same state (%)
Geographical mobility - Moved from different state (%)
Geographical mobility - Moved from abroad (%)
Place of birth - Born in state of residence (%)
Place of birth - Born in other state (%)
Place of birth - Native, outside of US (%)
Place of birth - Foreign born (%)
Housing units in structures - 1, detached (%)
Housing units in structures - 1, attached (%)
Housing units in structures - 2 (%)
Housing units in structures - 3 or 4 (%)
Housing units in structures - 5 to 9 (%)
Housing units in structures - 10 to 19 (%)
Housing units in structures - 20 to 49 (%)
Housing units in structures - 50 or more (%)
Housing units in structures - Mobile home (%)
Housing units in structures - Boat, RV, van, etc. (%)
House/condo owner moved in on average (years ago)
Renter moved in on average (years ago)
Year householder moved into unit - Moved in 1999 to March 2000 (%)
Year householder moved into unit - Moved in 1995 to 1998 (%)
Year householder moved into unit - Moved in 1990 to 1994 (%)
Year householder moved into unit - Moved in 1980 to 1989 (%)
Year householder moved into unit - Moved in 1970 to 1979 (%)
Year householder moved into unit - Moved in 1969 or earlier (%)
Means of transportation to work - Drove car alone (%)
Means of transportation to work - Carpooled (%)
Means of transportation to work - Public transportation (%)
Means of transportation to work - Bus or trolley bus (%)
Means of transportation to work - Streetcar or trolley car (%)
Means of transportation to work - Subway or elevated (%)
Means of transportation to work - Railroad (%)
Means of transportation to work - Ferryboat (%)
Means of transportation to work - Taxicab (%)
Means of transportation to work - Motorcycle (%)
Means of transportation to work - Bicycle (%)
Means of transportation to work - Walked (%)
Means of transportation to work - Other means (%)
Working at home (%)
Industry diversity
Most Common Industries - Agriculture, forestry, fishing and hunting, and mining (%)
Most Common Industries - Agriculture, forestry, fishing and hunting (%)
Most Common Industries - Mining, quarrying, and oil and gas extraction (%)
Most Common Industries - Construction (%)
Most Common Industries - Manufacturing (%)
Most Common Industries - Wholesale trade (%)
Most Common Industries - Retail trade (%)
Most Common Industries - Transportation and warehousing, and utilities (%)
Most Common Industries - Transportation and warehousing (%)
Most Common Industries - Utilities (%)
Most Common Industries - Information (%)
Most Common Industries - Finance and insurance, and real estate and rental and leasing (%)
Most Common Industries - Finance and insurance (%)
Most Common Industries - Real estate and rental and leasing (%)
Most Common Industries - Professional, scientific, and management, and administrative and waste management services (%)
Most Common Industries - Professional, scientific, and technical services (%)
Most Common Industries - Management of companies and enterprises (%)
Most Common Industries - Administrative and support and waste management services (%)
Most Common Industries - Educational services, and health care and social assistance (%)
Most Common Industries - Educational services (%)
Most Common Industries - Health care and social assistance (%)
Most Common Industries - Arts, entertainment, and recreation, and accommodation and food services (%)
Most Common Industries - Arts, entertainment, and recreation (%)
Most Common Industries - Accommodation and food services (%)
Most Common Industries - Other services, except public administration (%)
Most Common Industries - Public administration (%)
Occupation diversity
Most Common Occupations - Management, business, science, and arts occupations (%)
Most Common Occupations - Management, business, and financial occupations (%)
Most Common Occupations - Management occupations (%)
Most Common Occupations - Business and financial operations occupations (%)
Most Common Occupations - Computer, engineering, and science occupations (%)
Most Common Occupations - Computer and mathematical occupations (%)
Most Common Occupations - Architecture and engineering occupations (%)
Most Common Occupations - Life, physical, and social science occupations (%)
Most Common Occupations - Education, legal, community service, arts, and media occupations (%)
Most Common Occupations - Community and social service occupations (%)
Most Common Occupations - Legal occupations (%)
Most Common Occupations - Education, training, and library occupations (%)
Most Common Occupations - Arts, design, entertainment, sports, and media occupations (%)
Most Common Occupations - Healthcare practitioners and technical occupations (%)
Most Common Occupations - Health diagnosing and treating practitioners and other technical occupations (%)
Most Common Occupations - Health technologists and technicians (%)
Most Common Occupations - Service occupations (%)
Most Common Occupations - Healthcare support occupations (%)
Most Common Occupations - Protective service occupations (%)
Most Common Occupations - Fire fighting and prevention, and other protective service workers including supervisors (%)
Most Common Occupations - Law enforcement workers including supervisors (%)
Most Common Occupations - Food preparation and serving related occupations (%)
Most Common Occupations - Building and grounds cleaning and maintenance occupations (%)
Most Common Occupations - Personal care and service occupations (%)
Most Common Occupations - Sales and office occupations (%)
Most Common Occupations - Sales and related occupations (%)
Most Common Occupations - Office and administrative support occupations (%)
Most Common Occupations - Natural resources, construction, and maintenance occupations (%)
Most Common Occupations - Farming, fishing, and forestry occupations (%)
Most Common Occupations - Construction and extraction occupations (%)
Most Common Occupations - Installation, maintenance, and repair occupations (%)
Most Common Occupations - Production, transportation, and material moving occupations (%)
Most Common Occupations - Production occupations (%)
Most Common Occupations - Transportation occupations (%)
Most Common Occupations - Material moving occupations (%)
People in Group quarters - Institutionalized population (%)
People in Group quarters - Correctional institutions (%)
People in Group quarters - Federal prisons and detention centers (%)
People in Group quarters - Halfway houses (%)
People in Group quarters - Local jails and other confinement facilities (including police lockups) (%)
People in Group quarters - Military disciplinary barracks (%)
People in Group quarters - State prisons (%)
People in Group quarters - Other types of correctional institutions (%)
People in Group quarters - Nursing homes (%)
People in Group quarters - Hospitals/wards, hospices, and schools for the handicapped (%)
People in Group quarters - Hospitals/wards and hospices for chronically ill (%)
People in Group quarters - Hospices or homes for chronically ill (%)
People in Group quarters - Military hospitals or wards for chronically ill (%)
People in Group quarters - Other hospitals or wards for chronically ill (%)
People in Group quarters - Hospitals or wards for drug/alcohol abuse (%)
People in Group quarters - Mental (Psychiatric) hospitals or wards (%)
People in Group quarters - Schools, hospitals, or wards for the mentally retarded (%)
People in Group quarters - Schools, hospitals, or wards for the physically handicapped (%)
People in Group quarters - Institutions for the deaf (%)
People in Group quarters - Institutions for the blind (%)
People in Group quarters - Orthopedic wards and institutions for the physically handicapped (%)
People in Group quarters - Wards in general hospitals for patients who have no usual home elsewhere (%)
People in Group quarters - Wards in military hospitals for patients who have no usual home elsewhere (%)
People in Group quarters - Juvenile institutions (%)
People in Group quarters - Long-term care (%)
People in Group quarters - Homes for abused, dependent, and neglected children (%)
People in Group quarters - Residential treatment centers for emotionally disturbed children (%)
People in Group quarters - Training schools for juvenile delinquents (%)
People in Group quarters - Short-term care, detention or diagnostic centers for delinquent children (%)
People in Group quarters - Type of juvenile institution unknown (%)
People in Group quarters - Noninstitutionalized population (%)
People in Group quarters - College dormitories (includes college quarters off campus) (%)
People in Group quarters - Military quarters (%)
People in Group quarters - On base (%)
People in Group quarters - Barracks, unaccompanied personnel housing (UPH), (Enlisted/Officer), ;and similar group living quarters for military personnel (%)
People in Group quarters - Transient quarters for temporary residents (%)
People in Group quarters - Military ships (%)
People in Group quarters - Group homes (%)
People in Group quarters - Homes or halfway houses for drug/alcohol abuse (%)
People in Group quarters - Homes for the mentally ill (%)
People in Group quarters - Homes for the mentally retarded (%)
People in Group quarters - Homes for the physically handicapped (%)
People in Group quarters - Other group homes (%)
People in Group quarters - Religious group quarters (%)
People in Group quarters - Dormitories (%)
People in Group quarters - Agriculture workers' dormitories on farms (%)
People in Group quarters - Job Corps and vocational training facilities (%)
People in Group quarters - Other workers' dormitories (%)
People in Group quarters - Crews of maritime vessels (%)
People in Group quarters - Other nonhousehold living situations (%)
People in Group quarters - Other noninstitutional group quarters (%)
Residents speaking English at home (%)
Residents speaking English at home - Born in the United States (%)
Residents speaking English at home - Native, born elsewhere (%)
Residents speaking English at home - Foreign born (%)
Residents speaking Spanish at home (%)
Residents speaking Spanish at home - Born in the United States (%)
Residents speaking Spanish at home - Native, born elsewhere (%)
Residents speaking Spanish at home - Foreign born (%)
Residents speaking other language at home (%)
Residents speaking other language at home - Born in the United States (%)
Residents speaking other language at home - Native, born elsewhere (%)
Residents speaking other language at home - Foreign born (%)
Class of Workers - Employee of private company (%)
Class of Workers - Self-employed in own incorporated business (%)
Class of Workers - Private not-for-profit wage and salary workers (%)
Class of Workers - Local government workers (%)
Class of Workers - State government workers (%)
Class of Workers - Federal government workers (%)
Class of Workers - Self-employed workers in own not incorporated business and Unpaid family workers (%)
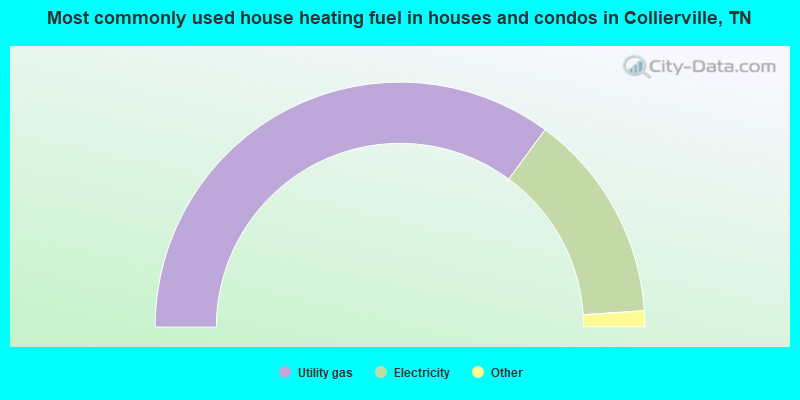
House heating fuel used in houses and condos - Utility gas (%)
House heating fuel used in houses and condos - Bottled, tank, or LP gas (%)
House heating fuel used in houses and condos - Electricity (%)
House heating fuel used in houses and condos - Fuel oil, kerosene, etc. (%)
House heating fuel used in houses and condos - Coal or coke (%)
House heating fuel used in houses and condos - Wood (%)
House heating fuel used in houses and condos - Solar energy (%)
House heating fuel used in houses and condos - Other fuel (%)
House heating fuel used in houses and condos - No fuel used (%)
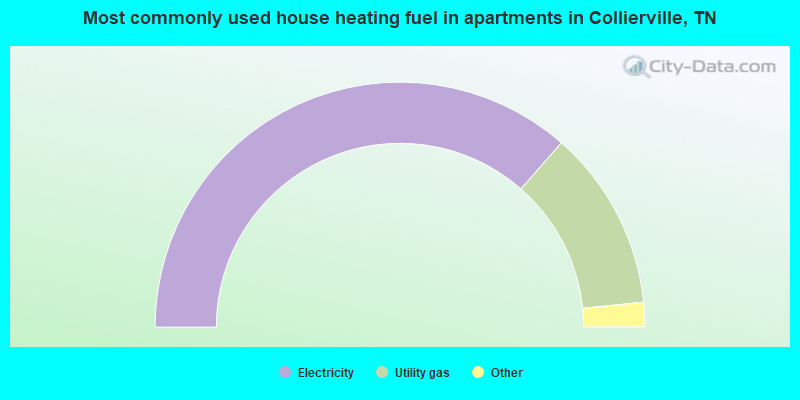
House heating fuel used in apartments - Utility gas (%)
House heating fuel used in apartments - Bottled, tank, or LP gas (%)
House heating fuel used in apartments - Electricity (%)
House heating fuel used in apartments - Fuel oil, kerosene, etc. (%)
House heating fuel used in apartments - Coal or coke (%)
House heating fuel used in apartments - Wood (%)
House heating fuel used in apartments - Solar energy (%)
House heating fuel used in apartments - Other fuel (%)
House heating fuel used in apartments - No fuel used (%)
Armed forces status - In Armed Forces (%)
Armed forces status - Civilian (%)
Armed forces status - Civilian - Veteran (%)
Armed forces status - Civilian - Nonveteran (%)
Fatal accidents locations in years 2005-2021
Fatal accidents locations in 2005
Fatal accidents locations in 2006
Fatal accidents locations in 2007
Fatal accidents locations in 2008
Fatal accidents locations in 2009
Fatal accidents locations in 2010
Fatal accidents locations in 2011
Fatal accidents locations in 2012
Fatal accidents locations in 2013
Fatal accidents locations in 2014
Fatal accidents locations in 2015
Fatal accidents locations in 2016
Fatal accidents locations in 2017
Fatal accidents locations in 2018
Fatal accidents locations in 2019
Fatal accidents locations in 2020
Fatal accidents locations in 2021
Alcohol use - People drinking some alcohol every month (%)
Alcohol use - People not drinking at all (%)
Alcohol use - Average days/month drinking alcohol
Alcohol use - Average drinks/week
Alcohol use - Average days/year people drink much
Audiometry - Average condition of hearing (%)
Audiometry - People that can hear a whisper from across a quiet room (%)
Audiometry - People that can hear normal voice from across a quiet room (%)
Audiometry - Ears ringing, roaring, buzzing (%)
Audiometry - Had a job exposure to loud noise (%)
Audiometry - Had off-work exposure to loud noise (%)
Blood Pressure & Cholesterol - Has high blood pressure (%)
Blood Pressure & Cholesterol - Checking blood pressure at home (%)
Blood Pressure & Cholesterol - Frequently checking blood cholesterol (%)
Blood Pressure & Cholesterol - Has high cholesterol level (%)
Consumer Behavior - Money monthly spent on food at supermarket/grocery store
Consumer Behavior - Money monthly spent on food at other stores
Consumer Behavior - Money monthly spent on eating out
Consumer Behavior - Money monthly spent on carryout/delivered foods
Consumer Behavior - Income spent on food at supermarket/grocery store (%)
Consumer Behavior - Income spent on food at other stores (%)
Consumer Behavior - Income spent on eating out (%)
Consumer Behavior - Income spent on carryout/delivered foods (%)
Current Health Status - General health condition (%)
Current Health Status - Blood donors (%)
Current Health Status - Has blood ever tested for HIV virus (%)
Current Health Status - Left-handed people (%)
Dermatology - People using sunscreen (%)
Diabetes - Diabetics (%)
Diabetes - Had a blood test for high blood sugar (%)
Diabetes - People taking insulin (%)
Diet Behavior & Nutrition - Diet health (%)
Diet Behavior & Nutrition - Milk product consumption (# of products/month)
Diet Behavior & Nutrition - Meals not home prepared (#/week)
Diet Behavior & Nutrition - Meals from fast food or pizza place (#/week)
Diet Behavior & Nutrition - Ready-to-eat foods (#/month)
Diet Behavior & Nutrition - Frozen meals/pizza (#/month)
Drug Use - People that ever used marijuana or hashish (%)
Drug Use - Ever used hard drugs (%)
Drug Use - Ever used any form of cocaine (%)
Drug Use - Ever used heroin (%)
Drug Use - Ever used methamphetamine (%)
Health Insurance - People covered by health insurance (%)
Kidney Conditions-Urology - Avg. # of times urinating at night
Medical Conditions - People with asthma (%)
Medical Conditions - People with anemia (%)
Medical Conditions - People with psoriasis (%)
Medical Conditions - People with overweight (%)
Medical Conditions - Elderly people having difficulties in thinking or remembering (%)
Medical Conditions - People who ever received blood transfusion (%)
Medical Conditions - People having trouble seeing even with glass/contacts (%)
Medical Conditions - People with arthritis (%)
Medical Conditions - People with gout (%)
Medical Conditions - People with congestive heart failure (%)
Medical Conditions - People with coronary heart disease (%)
Medical Conditions - People with angina pectoris (%)
Medical Conditions - People who ever had heart attack (%)
Medical Conditions - People who ever had stroke (%)
Medical Conditions - People with emphysema (%)
Medical Conditions - People with thyroid problem (%)
Medical Conditions - People with chronic bronchitis (%)
Medical Conditions - People with any liver condition (%)
Medical Conditions - People who ever had cancer or malignancy (%)
Mental Health - People who have little interest in doing things (%)
Mental Health - People feeling down, depressed, or hopeless (%)
Mental Health - People who have trouble sleeping or sleeping too much (%)
Mental Health - People feeling tired or having little energy (%)
Mental Health - People with poor appetite or overeating (%)
Mental Health - People feeling bad about themself (%)
Mental Health - People who have trouble concentrating on things (%)
Mental Health - People moving or speaking slowly or too fast (%)
Mental Health - People having thoughts they would be better off dead (%)
Oral Health - Average years since last visit a dentist
Oral Health - People embarrassed because of mouth (%)
Oral Health - People with gum disease (%)
Oral Health - General health of teeth and gums (%)
Oral Health - Average days a week using dental floss/device
Oral Health - Average days a week using mouthwash for dental problem
Oral Health - Average number of teeth
Pesticide Use - Households using pesticides to control insects (%)
Pesticide Use - Households using pesticides to kill weeds (%)
Physical Activity - People doing vigorous-intensity work activities (%)
Physical Activity - People doing moderate-intensity work activities (%)
Physical Activity - People walking or bicycling (%)
Physical Activity - People doing vigorous-intensity recreational activities (%)
Physical Activity - People doing moderate-intensity recreational activities (%)
Physical Activity - Average hours a day doing sedentary activities
Physical Activity - Average hours a day watching TV or videos
Physical Activity - Average hours a day using computer
Physical Functioning - People having limitations keeping them from working (%)
Physical Functioning - People limited in amount of work they can do (%)
Physical Functioning - People that need special equipment to walk (%)
Physical Functioning - People experiencing confusion/memory problems (%)
Physical Functioning - People requiring special healthcare equipment (%)
Prescription Medications - Average number of prescription medicines taking
Preventive Aspirin Use - Adults 40+ taking low-dose aspirin (%)
Reproductive Health - Vaginal deliveries (%)
Reproductive Health - Cesarean deliveries (%)
Reproductive Health - Deliveries resulted in a live birth (%)
Reproductive Health - Pregnancies resulted in a delivery (%)
Reproductive Health - Women breastfeeding newborns (%)
Reproductive Health - Women that had a hysterectomy (%)
Reproductive Health - Women that had both ovaries removed (%)
Reproductive Health - Women that have ever taken birth control pills (%)
Reproductive Health - Women taking birth control pills (%)
Reproductive Health - Women that have ever used Depo-Provera or injectables (%)
Reproductive Health - Women that have ever used female hormones (%)
Sexual Behavior - People 18+ that ever had sex (vaginal, anal, or oral) (%)
Sexual Behavior - Males 18+ that ever had vaginal sex with a woman (%)
Sexual Behavior - Males 18+ that ever performed oral sex on a woman (%)
Sexual Behavior - Males 18+ that ever had anal sex with a woman (%)
Sexual Behavior - Males 18+ that ever had any sex with a man (%)
Sexual Behavior - Females 18+ that ever had vaginal sex with a man (%)
Sexual Behavior - Females 18+ that ever performed oral sex on a man (%)
Sexual Behavior - Females 18+ that ever had anal sex with a man (%)
Sexual Behavior - Females 18+ that ever had any kind of sex with a woman (%)
Sexual Behavior - Average age people first had sex
Sexual Behavior - Average number of female sex partners in lifetime (males 18+)
Sexual Behavior - Average number of female vaginal sex partners in lifetime (males 18+)
Sexual Behavior - Average age people first performed oral sex on a woman (18+)
Sexual Behavior - Average number of woman performed oral sex on in lifetime (18+)
Sexual Behavior - Average number of male sex partners in lifetime (males 18+)
Sexual Behavior - Average number of male anal sex partners in lifetime (males 18+)
Sexual Behavior - Average age people first performed oral sex on a man (18+)
Sexual Behavior - Average number of male oral sex partners in lifetime (18+)
Sexual Behavior - People using protection when performing oral sex (%)
Sexual Behavior - Average number of times people have vaginal or anal sex a year
Sexual Behavior - People having sex without condom (%)
Sexual Behavior - Average number of male sex partners in lifetime (females 18+)
Sexual Behavior - Average number of male vaginal sex partners in lifetime (females 18+)
Sexual Behavior - Average number of female sex partners in lifetime (females 18+)
Sexual Behavior - Circumcised males 18+ (%)
Sleep Disorders - Average hours sleeping at night
Sleep Disorders - People that has trouble sleeping (%)
Smoking-Cigarette Use - People smoking cigarettes (%)
Taste & Smell - People 40+ having problems with smell (%)
Taste & Smell - People 40+ having problems with taste (%)
Taste & Smell - People 40+ that ever had wisdom teeth removed (%)
Taste & Smell - People 40+ that ever had tonsils teeth removed (%)
Taste & Smell - People 40+ that ever had a loss of consciousness because of a head injury (%)
Taste & Smell - People 40+ that ever had a broken nose or other serious injury to face or skull (%)
Taste & Smell - People 40+ that ever had two or more sinus infections (%)
Weight - Average height (inches)
Weight - Average weight (pounds)
Weight - Average BMI
Weight - People that are obese (%)
Weight - People that ever were obese (%)
Weight - People trying to lose weight (%)
According to our research of Tennessee and other state lists, there were 23 registered sex offenders living in Collierville, Tennessee as of April 25, 2024 . The ratio of all residents to sex offenders in Collierville is 2,082 to 1.The ratio of registered sex offenders to all residents in this city is much lower than the state average.
Officers per 1,000 residents here:
2.11Tennessee average:
2.57
Latest news from Collierville, TN collected exclusively by city-data.com from local newspapers, TV, and radio stations
Collierville, TN City Guides: Ancestries: American (17.7%), English (9.2%), Irish (4.7%), German (3.8%), European (3.2%), Italian (2.2%).
Current Local Time:
Land area: 24.5 square miles.
Population density: 2,102 people per square mile (low).
7,175 residents are foreign born (10.1% Asia ).
This town:
14.2%Tennessee:
5.4%
Median real estate property taxes paid for housing units with mortgages in 2022: $4,390 (0.9%)Median real estate property taxes paid for housing units with no mortgage in 2022: $4,459 (0.9%)
Nearest city with pop. 50,000+: Memphis, TN
Nearest city with pop. 1,000,000+: Dallas, TX
Nearest cities:
Latitude: 35.05 N, Longitude: 89.68 W
Daytime population change due to commuting: -481 (-1.0%)Workers who live and work in this town: 9,938 (38.9%)
Property values in Collierville, TN
Collierville tourist attractions:
Single-family new house construction building permits:
2022: 172 buildings , average cost: $250,7002021: 271 buildings , average cost: $260,9002020: 191 buildings , average cost: $234,1002019: 199 buildings , average cost: $406,1002018: 183 buildings , average cost: $384,2002017: 195 buildings , average cost: $386,2002016: 177 buildings , average cost: $372,8002015: 160 buildings , average cost: $336,7002014: 142 buildings , average cost: $354,6002013: 220 buildings , average cost: $243,2002012: 172 buildings , average cost: $316,0002011: 103 buildings , average cost: $338,3002010: 54 buildings , average cost: $404,5002009: 45 buildings , average cost: $326,2002008: 78 buildings , average cost: $370,8002007: 226 buildings , average cost: $355,3002006: 378 buildings , average cost: $360,4002005: 548 buildings , average cost: $322,4002004: 534 buildings , average cost: $320,9002003: 489 buildings , average cost: $304,0002002: 639 buildings , average cost: $260,0002001: 374 buildings , average cost: $277,9002000: 347 buildings , average cost: $274,0001999: 628 buildings , average cost: $241,2001998: 693 buildings , average cost: $233,7001997: 504 buildings , average cost: $217,900Unemployment in December 2023:
Population change in the 1990s: +17,100 (+115.8%).
Most common industries in Collierville, TN (%)
Both Males Females
Health care (8.3%)
Truck transportation (7.5%)
Educational services (5.9%)
Finance & insurance (5.3%)
Professional, scientific, technical services (5.0%)
Construction (4.8%)
Accommodation & food services (3.7%)
Truck transportation (10.1%)
Construction (6.6%)
Finance & insurance (5.0%)
Professional, scientific, technical services (4.6%)
Public administration (4.4%)
Accommodation & food services (4.0%)
Air transportation (3.9%)
Health care (16.0%)
Educational services (11.2%)
Finance & insurance (5.7%)
Professional, scientific, technical services (5.4%)
Social assistance (4.1%)
Truck transportation (4.0%)
Religious, grantmaking, civic, professional, similar organizations (3.7%)
Most common occupations in Collierville, TN (%)
Both Males Females
Other sales and related occupations, including supervisors (6.2%)
Other management occupations, except farmers and farm managers (5.7%)
Sales representatives, services, wholesale and manufacturing (5.2%)
Top executives (4.7%)
Other office and administrative support workers, including supervisors (4.2%)
Computer specialists (3.5%)
Preschool, kindergarten, elementary, and middle school teachers (3.3%)
Other sales and related occupations, including supervisors (7.2%)
Top executives (7.2%)
Sales representatives, services, wholesale and manufacturing (6.8%)
Other management occupations, except farmers and farm managers (6.6%)
Aircraft and traffic control occupations (5.8%)
Computer specialists (5.2%)
Operations specialties managers, except financial managers (4.1%)
Other office and administrative support workers, including supervisors (7.5%)
Preschool, kindergarten, elementary, and middle school teachers (6.8%)
Secretaries and administrative assistants (6.4%)
Registered nurses (5.6%)
Other sales and related occupations, including supervisors (4.9%)
Other management occupations, except farmers and farm managers (4.6%)
Information and record clerks, except customer service representatives (4.2%)
Tornado activity:
Collierville-area historical tornado activity is slightly above Tennessee state average. It is 94% greater than the overall U.S. average.
On 3/21/1952, a category F4 (max. wind speeds 207-260 mph) tornado 12.8 miles away from the Collierville town center killed 16 people and injured 74 people and caused between $50,000 and $500,000 in damages.
On 4/24/1970, a category F3 (max. wind speeds 158-206 mph) tornado 2.7 miles away from the town center injured 5 people and caused between $500,000 and $5,000,000 in damages.
Earthquake activity:
Collierville-area historical earthquake activity is significantly above Tennessee state average. It is 354% greater than the overall U.S. average. On 3/25/1976 at 00:41:20, a magnitude 5.0 (4.9 MB, 5.0 LG, Class: Moderate, Intensity: VI - VII) earthquake occurred 54.3 miles away from Collierville center On 5/4/1991 at 01:18:54, a magnitude 5.0 (4.4 MB, 4.6 LG, 5.0 LG, Depth: 3.1 mi) earthquake occurred 104.7 miles away from Collierville center On 4/27/1989 at 16:47:49, a magnitude 4.7 (4.6 MB, 4.7 LG, 4.3 LG, Class: Light, Intensity: IV - V) earthquake occurred 66.0 miles away from the city center On 9/26/1990 at 13:18:51, a magnitude 5.0 (4.7 MB, 4.8 LG, 5.0 LG, Depth: 7.7 mi) earthquake occurred 146.4 miles away from Collierville center On 3/25/1976 at 01:00:11, a magnitude 4.5 (4.1 MB, 4.5 LG) earthquake occurred 59.2 miles away from the city center On 4/18/2008 at 09:36:59, a magnitude 5.4 (5.1 MB, 4.8 MS, 5.4 MW, 5.2 MW) earthquake occurred 255.2 miles away from the city center Magnitude types: regional Lg-wave magnitude (LG), body-wave magnitude (MB), surface-wave magnitude (MS), moment magnitude (MW) Natural disasters: The number of natural disasters in Shelby County (18) is near the US average (15).Major Disasters (Presidential) Declared: 14Emergencies Declared: 2Floods: 13, Storms: 13, Tornadoes: 8, Winds: 8, Winter Storms: 2, Flash Flood: 1, Heavy Rain: 1, Hurricane: 1, Ice Storm: 1, Other: 1 (Note: some incidents may be assigned to more than one category). Hospitals and medical centers in Collierville: BAPTIST MEMORIAL HOSPITAL-COLLIERVILLE (provides emergency services, 1500 WEST POPLAR AVENUE) COLLIERVILLE HEALTH AND REHAB (490 WEST POPLAR)
DOVE HEALTH AND REHAB OF COLLIERVILLE, LLC (490 WEST POPLAR AVENUE)
COLLIERVILLE DIALYSIS (791 WEST POPLAR AVENUE)
FMC COLLIERVILLE (155 CRESCENT DRIVE)
NO PLACE LIKE HOME, INC (4747 WINDSONG PARK DRIVE)
Colleges/universities with over 2000 students nearest to Collierville:
University of Memphis (about 18 miles; Memphis, TN ; Full-time enrollment: 17,427)
Rhodes College (about 19 miles; Memphis, TN ; FT enrollment: 2,052)
Southwest Tennessee Community College (about 21 miles; Memphis, TN ; FT enrollment: 8,043)
Northwest Mississippi Community College (about 35 miles; Senatobia, MS ; FT enrollment: 6,607)
University of Mississippi (about 49 miles; University, MS ; FT enrollment: 17,642)
Union University (about 64 miles; Jackson, TN ; FT enrollment: 4,051)
Jackson State Community College (about 66 miles; Jackson, TN ; FT enrollment: 2,958)
Private high school in Collierville: ST GEORGE'S INDEPENDENT SCHOOL Students: 1,207, Location: 1880 WOLF RIVER BLVD, Grades: PK-12)
Private elementary/middle schools in Collierville: CENTRAL DAY SCHOOL Students: 275, Location: 2005 E WINCHESTER BLVD, Grades: KG-8)INCARNATION CATHOLIC SCHOOL - SACC Students: 198, Location: 360 BRAY STATION RD, Grades: PK-8)
See full list of schools located in Collierville Library in Collierville: LUCIUS E. AND ELSIE C. BURCH, JR. LIBRARY Operating income: $1,183,841; Location: 501 POPLAR VIEW PKWY; 85,785 books ; 500 e-books ; 2,801 audio materials ; 2,586 video materials ; 17 local licensed databases ; 32 state licensed databases ; 257 print serial subscriptions )
Notable locations in Collierville: (A) , Frank Road Landfill (B) , Collierville Northwest Sewage Treatment Plant (C) , Collierville Sewage Treatment Plant (D) , Collierville Fire and Rescue Station 2 (E) , Collierville Fire and Rescue Station 1 (F) , Collierville Fire and Rescue Station 4 (G) , Collierville Fire and Rescue Station 5 (H) , Collierville Fire and Rescue Station 3 (I) , Rural / Metro Ambulance Memphis (J) . Display/hide their locations on the map
Shopping Centers: (1) , City Shopping Center (2) , Great Oaks Shopping Center (3) , Roseview Shopping Center (4) . Display/hide their locations on the map
Churches in Collierville include: (A) , Collierville Church of God in Christ (B) , Saint James Church (C) , Saint Pauls Church (D) , Collierville Baptist Church (E) , Collierville Christian Church (F) , Collierville Church of Christ (G) , Collierville Church of God (H) , Collierville Presbyterian Church (I) . Display/hide their locations on the map
Cemeteries: (1) , Magnolia Cemetery (2) , Saint James Cemetery (3) , Saint Marks Cemetery (4) . Display/hide their locations on the map
Reservoirs: (A) , Houston Levee Golf Course Lake (B) , Ridgeway Country Club Lake (C) , Milton Schaeffers Lake (D) . Display/hide their locations on the map
Tourist attraction: (1) . Display/hide its approximate location on the map
Hotels: (1) , Comfort Inn (1230 West Poplar Avenue) (2) , Hampton Inn Memphis - Collierville (1280 West Poplar Avenue) (3) . Display/hide their approximate locations on the map
Birthplace of: Major Owens - Politician, Marv Throneberry - Baseball player, James Smith - College football player (UT-Chattanooga Mocs), Morgan Cox - Football player, Nikki McCray - WNBA player (San Antonio Silver Stars, born : Dec 17, 1971).
Shelby County has a predicted average indoor radon screening level less than 2 pCi/L (pico curies per liter) - Low Potential Drinking water stations with addresses in Collierville that have no violations reported:
COLLIERVILLE WATER DEPT (Population served: 42,557, Primary Water Source Type: Groundwater)
PIPERTON WATER SYSTEM (Population served: 1,595, Primary Water Source Type: Purch groundwater)
Average household size: This town:
2.9 peopleTennessee:
2.5 people
Percentage of family households: This town:
83.0%Whole state:
67.3%
Percentage of households with unmarried partners: This town:
2.2%Whole state:
5.8%
Likely homosexual households (counted as self-reported same-sex unmarried-partner households)
Lesbian couples: 0.3% of all households Gay men: 0.2% of all households
62 people in nursing facilities/skilled-nursing facilities in 2010people in nursing homes in 2000
Banks with most branches in Collierville (2011 data):
First Tennessee Bank, National Association: Harley Oaks Financial Center Branch, Houston-Levee/Dogwood Branch, Collierville Branch. Info updated 2009/09/08: Bank assets: $24,563.4 mil, Deposits: $16,402.1 mil, headquarters in Memphis, TN, positive income , Commercial Lending Specialization, 180 total offices , Holding Company: First Horizon National Corporation
Regions Bank: Collierville Branch at 1130 West Poplar Avenue, branch established on 1996/02/05; Collierville Branch at 1300 West Poplar Avenue, branch established on 1990/10/29. Info updated 2011/02/24: Bank assets: $123,368.2 mil, Deposits: $98,301.3 mil, headquarters in Birmingham, AL, positive income , Commercial Lending Specialization, 1778 total offices , Holding Company: Regions Financial Corporation
Trustmark National Bank: Collierville Drive-In Branch at 595 West Poplar Street, branch established on 1964/11/18; Collierville Branch at 305 Poplar View Parkway, branch established on 1944/09/25. Info updated 2012/03/26: Bank assets: $9,612.1 mil, Deposits: $7,410.1 mil, headquarters in Jackson, MS, positive income , Commercial Lending Specialization, 186 total offices , Holding Company: Trustmark Corporation
BancorpSouth Bank: Houston Levee Branch at 3550 South Houston Levee Road, branch established on 2008/06/02; Collierville Branch at 604 West Poplar Avenue, branch established on 1999/10/06. Info updated 2007/07/18: Bank assets: $12,990.3 mil, Deposits: $10,863.8 mil, headquarters in Tupelo, MS, positive income , Commercial Lending Specialization, 271 total offices , Holding Company: Bancorpsouth, Inc.
BankTennessee: Mulberry Street Branch at 100 West Mulberry Street, branch established on 1998/02/02; Banktennessee at 1125 West Poplar Ave, branch established on 1934/10/01. Info updated 2006/11/03: Bank assets: $246.8 mil, Deposits: $220.4 mil, local headquarters , positive income , Commercial Lending Specialization, 7 total offices , Holding Company: Banktennessee Bancshares, Inc.
Independent Bank: Kroger-Collierville Branch at 240 New Byhalia Road, branch established on 2007/02/13; Collierville Branch at 2116 West Poplar, branch established on 2001/05/10. Info updated 2006/11/03: Bank assets: $819.3 mil, Deposits: $691.2 mil, headquarters in Memphis, TN, positive income , Consumer Lending Specialization, 10 total offices , Holding Company: Independent Holdings, Inc
SunTrust Bank: Byhalia Branch - 962 at 252 New Byhalia Road, branch established on 1978/04/12; Schilling Farms Branch - 961 at 1175 West Poplar Avenue, branch established on 2000/12/01. Info updated 2010/05/27: Bank assets: $171,291.7 mil, Deposits: $129,833.2 mil, headquarters in Atlanta, GA, positive income , Commercial Lending Specialization, 1716 total offices , Holding Company: Suntrust Banks, Inc.
Triumph Bank: Collierville Office Branch at 1130 West Poplar Avenue, branch established on 2008/01/02. Info updated 2011/05/17: Bank assets: $308.1 mil, Deposits: $277.5 mil, headquarters in Germantown, TN, positive income , Commercial Lending Specialization, 4 total offices , Holding Company: Triumph Bancshares, Inc.
The Fort Sill National Bank: Collierville Branch at 560 West Poplar Avenue, branch established on 2010/03/24. Info updated 2006/11/03: Bank assets: $369.8 mil, Deposits: $324.4 mil, headquarters in Fort Sill, OK, positive income , 71 total offices , Holding Company: Jrmb Ii, Inc
8 other banks with 8 local branches
For population 15 years and over in Collierville:
Never married: 23.0%Now married: 63.1%Separated: 1.1%Widowed: 5.2%Divorced: 7.6% For population 25 years and over in Collierville:
High school or higher: 95.5%Bachelor's degree or higher: 60.4%Graduate or professional degree: 25.9%Unemployed: 2.7%Mean travel time to work (commute): 19.7 minutes
Education Gini index (Inequality in education) Here:
9.2Tennessee average:
11.4
Religion statistics for Collierville, TN (based on Shelby County data)
Religion Adherents Congregations Evangelical Protestant 260,401 504 Black Protestant 150,894 292 Mainline Protestant 87,990 127 Catholic 61,202 29 Other 26,520 68 Orthodox 1,125 6 None 339,512 -
Source: Clifford Grammich, Kirk Hadaway, Richard Houseal, Dale E.Jones, Alexei Krindatch, Richie Stanley and Richard H.Taylor. 2012. 2010 U.S.Religion Census: Religious Congregations & Membership Study. Association of Statisticians of American Religious Bodies. Jones, Dale E., et al. 2002. Congregations and Membership in the United States 2000. Nashville, TN: Glenmary Research Center. Graphs represent county-level data
Food Environment Statistics: Number of grocery stores : 186This county :
2.05 / 10,000 pop.Tennessee :
1.99 / 10,000 pop.
Number of supercenters and club stores : 13This county :
0.14 / 10,000 pop.State :
0.17 / 10,000 pop.
Number of convenience stores (no gas) : 49Shelby County :
0.54 / 10,000 pop.State :
0.65 / 10,000 pop.
Number of convenience stores (with gas) : 386This county :
4.25 / 10,000 pop.Tennessee :
5.16 / 10,000 pop.
Number of full-service restaurants : 556This county :
6.12 / 10,000 pop.Tennessee :
6.56 / 10,000 pop.
Adult diabetes rate : This county :
11.3%State :
11.4%
Adult obesity rate : Shelby County :
32.8%State :
30.2%
Low-income preschool obesity rate : Health and Nutrition: Healthy diet rate : Collierville:
54.2%Tennessee:
49.3%
Average overall health of teeth and gums : Average BMI : Collierville:
28.0Tennessee:
28.8
People feeling badly about themselves : Collierville:
18.8%State:
21.0%
People not drinking alcohol at all : This city:
7.6%Tennessee:
10.5%
Average hours sleeping at night : This city:
6.9Tennessee:
6.8
Overweight people : Collierville:
33.5%Tennessee:
33.9%
General health condition : Here:
61.3%Tennessee:
55.9%
Average condition of hearing : More about Health and Nutrition of Collierville, TN Residents
Local government employment and payroll (March 2022)
Function
Full-time employees
Monthly full-time payroll
Average yearly full-time wage
Part-time employees
Monthly part-time payroll
Elementary and Secondary - Instruction
883 $4,215,759 $57,292 75 $46,190 Elementary and Secondary - Other Total
163 $698,268 $51,406 35 $24,260 Police Protection - Officers
106 $594,441 $67,295 0 $0 Firefighters
69 $422,776 $73,526 0 $0 Parks and Recreation
46 $172,327 $44,955 7 $9,601 Other and Unallocable
46 $219,980 $57,386 0 $0 Other Government Administration
43 $218,065 $60,855 0 $0 Financial Administration
32 $166,085 $62,282 0 $0 Streets and Highways
32 $131,529 $49,323 1 $1,532 Solid Waste Management
29 $111,321 $46,064 1 $1,975 Water Supply
25 $124,000 $59,520 0 $0 Police - Other
24 $103,567 $51,784 13 $5,211 Judicial and Legal
17 $43,258 $30,535 6 $14,889 Sewerage
13 $68,855 $63,558 0 $0 Correction
12 $51,582 $51,582 0 $0 Local Libraries
8 $31,326 $46,989 16 $20,757 Health
3 $11,246 $44,984 4 $7,199 Fire - Other
3 $13,935 $55,740 1 $844
Totals for Government
1,554 $7,398,318 $57,130 159 $132,458
Collierville government finances - Expenditure in 2021 (per resident):
Construction - Regular Highways: $2,337,000 ($45.30)
General Public Buildings: $1,300,000 ($25.20)General - Other: $256,000 ($4.96)Local Fire Protection: $199,000 ($3.86)Parks and Recreation: $118,000 ($2.29)Police Protection: $26,000 ($0.50)Current Operations - Police Protection: $14,340,000 ($277.94)
Local Fire Protection: $8,710,000 ($168.82)General - Other: $5,705,000 ($110.57)Regular Highways: $5,504,000 ($106.68)General Public Buildings: $5,216,000 ($101.10)Solid Waste Management: $3,565,000 ($69.10)Water Utilities: $3,178,000 ($61.60)Sewerage: $2,086,000 ($40.43)Parks and Recreation: $1,824,000 ($35.35)Health - Other: $1,663,000 ($32.23)Financial Administration: $1,183,000 ($22.93)Libraries: $1,113,000 ($21.57)Protective Inspection and Regulation - Other: $1,088,000 ($21.09)Central Staff Services: $980,000 ($18.99)Judicial and Legal Services: $944,000 ($18.30)Public Welfare - Other: $114,000 ($2.21)General - Interest on Debt: $4,165,000 ($80.73)
Other Capital Outlay - Police Protection: $648,000 ($12.56)
Solid Waste Management: $471,000 ($9.13)General - Other: $390,000 ($7.56)Parks and Recreation: $375,000 ($7.27)Local Fire Protection: $202,000 ($3.92)Central Staff Services: $178,000 ($3.45)Regular Highways: $94,000 ($1.82)Protective Inspection and Regulation - Other: $73,000 ($1.41)General Public Building: $67,000 ($1.30)Libraries: $4,000 ($0.08)Total Salaries and Wages: $27,463,000 ($532.29)
Water Utilities - Interest on Debt: $377,000 ($7.31)
Collierville government finances - Revenue in 2021 (per resident):
Charges - Sewerage: $9,283,000 ($179.92)
Solid Waste Management: $4,419,000 ($85.65)Parks and Recreation: $278,000 ($5.39)Federal Intergovernmental - Other: $2,586,000 ($50.12)
Local Intergovernmental - Other: $480,000 ($9.30)
Miscellaneous - Fines and Forfeits: $1,939,000 ($37.58)
Rents: $477,000 ($9.25)General Revenue - Other: $383,000 ($7.42)Interest Earnings: $182,000 ($3.53)Donations From Private Sources: $83,000 ($1.61)Revenue - Water Utilities: $6,919,000 ($134.10)
State Intergovernmental - Highways: $2,566,000 ($49.73)
Public Welfare: $75,000 ($1.45)Tax - Property: $34,627,000 ($671.14)
General Sales and Gross Receipts: $21,178,000 ($410.47)Other License: $2,920,000 ($56.60)Motor Vehicle License: $1,527,000 ($29.60)Occupation and Business License - Other: $1,267,000 ($24.56)Alcoholic Beverage Sales: $1,246,000 ($24.15)Public Utilities Sales: $590,000 ($11.44)Other Selective Sales: $398,000 ($7.71)Alcoholic Beverage License: $36,000 ($0.70)Public Utility License: $1,000 ($0.02)
Collierville government finances - Debt in 2021 (per resident):
Long Term Debt - Beginning Outstanding - Unspecified Public Purpose: $120,170,000 ($2329.15)
Outstanding Unspecified Public Purpose: $113,630,000 ($2202.39)Retired Unspecified Public Purpose: $6,540,000 ($126.76)
Collierville government finances - Cash and Securities in 2021 (per resident):
Other Funds - Cash and Securities: $258,111,000 ($5002.73)
4.35% of this county's 2021 resident taxpayers lived in other counties in 2020 ($59,303 average adjusted gross income )
Here:
4.35%Tennessee average:
8.49%
0.02% of residents moved from foreign countries ($242 average AGI )Shelby County:
0.02%Tennessee average:
0.02%
Top counties from which taxpayers relocated into this county between 2020 and 2021:
5.27% of this county's 2020 resident taxpayers moved to other counties in 2021 ($68,956 average adjusted gross income )
Here:
5.27%Tennessee average:
7.40%
0.02% of residents moved to foreign countries ($220 average AGI )Shelby County:
0.02%Tennessee average:
0.01%
Top counties to which taxpayers relocated from this county between 2020 and 2021:
Businesses in Collierville, TN
Name Count Name Count
AT&T 1 KFC 1 Abercrombie & Fitch 1 Kohl's 1 Academy Sports + Outdoors 1 Kroger 2 Aeropostale 1 La-Z-Boy 1 American Eagle Outfitters 1 Lane Bryant 1 Ann Taylor 1 Lane Furniture 1 Arby's 1 Little Caesars Pizza 1 AutoZone 1 Lowe's 1 Banana Republic 1 Macy's 1 Barnes & Noble 1 Marriott 1 Baskin-Robbins 1 MasterBrand Cabinets 2 Bath & Body Works 1 McDonald's 2 Bed Bath & Beyond 1 Men's Wearhouse 1 Blockbuster 1 Motherhood Maternity 1 Brookstone 1 New Balance 1 Burger King 1 New York & Co 1 Cache 1 Nike 1 Catherines 1 Office Depot 1 Chevrolet 1 Old Navy 1 Chick-Fil-A 1 Papa John's Pizza 1 Chico's 1 Payless 1 Circle K 2 Pier 1 Imports 1 Clarks 1 Pizza Hut 1 Curves 1 Popeyes 1 Days Inn 1 RadioShack 1 Domino's Pizza 1 Red Robin 1 DressBarn 1 Rue21 1 Dressbarn 1 SONIC Drive-In 2 Eddie Bauer 1 Sears 1 Express 1 Sephora 1 FedEx 9 Shoe Carnival 1 Finish Line 1 Starbucks 3 Firestone Complete Auto Care 1 Subway 2 Ford 1 T-Mobile 3 GNC 2 Taco Bell 1 GameStop 2 Talbots 1 Gap 1 Target 1 Goodwill 1 Toys"R"Us 1 Gymboree 1 U-Haul 1 H&R Block 1 UPS 6 Hilton 1 Vans 1 Hobby Lobby 1 Verizon Wireless 1 Hollister Co. 1 Victoria's Secret 1 Home Depot 1 Walgreens 3 JoS. A. Bank 1 Walmart 1 Jones New York 2 Wendy's 1 Journeys 1 YMCA 1 Justice 1
Strongest AM radio stations in Collierville:
WCRV (640 AM; 50 kW; COLLIERVILLE, TN; Owner: BOTT BROADCASTING COMPANY/TENNESSEE)
WMQM (1600 AM; 50 kW; LAKELAND, TN; Owner: WMQM, INC.)
WGSF (1030 AM; 50 kW; MEMPHIS, TN; Owner: FLINN BROADCASTING CORPORATION)
WPLX (1170 AM; 10 kW; GERMANTOWN, TN; Owner: EDUCATIONAL MEDIA FOUNDATION)
WDIA (1070 AM; 50 kW; MEMPHIS, TN; Owner: CLEAR CHANNEL BROADCASTING LICENSES, INC.)
WMC (790 AM; 5 kW; MEMPHIS, TN; Owner: INFINITY RADIO OPERATIONS INC.)
WJCE (680 AM; 10 kW; MEMPHIS, TN; Owner: ENTERCOM MEMPHIS LICENSE, LLC)
KWAM (990 AM; 10 kW; MEMPHIS, TN; Owner: CONCORD MEDIA GROUP, INC.)
WREC (600 AM; 5 kW; MEMPHIS, TN; Owner: CLEAR CHANNEL BROADCASTING LICENSES, INC.)
WOWW (1430 AM; 2 kW; GERMANTOWN, TN; Owner: FLINN BROADCASTING CORPORATION)
WHBQ (560 AM; 5 kW; MEMPHIS, TN; Owner: FLINN BROADCASTING CORPORATION)
WCPC (940 AM; 50 kW; HOUSTON, MS; Owner: WCPC BROADCASTING CO., INC.)
WBBP (1480 AM; 5 kW; MEMPHIS, TN)
Strongest FM radio stations in Collierville:
WSRR-FM (98.1 FM; MILLINGTON, TN; Owner: KOOL BROADCASTING, INC.)
WGKX (105.9 FM; MEMPHIS, TN; Owner: KIX BROADCASTING, INC.)
WRVR-FM (104.5 FM; MEMPHIS, TN; Owner: ENTERCOM MEMPHIS LICENSE, LLC)
WMC-FM (99.7 FM; MEMPHIS, TN; Owner: INFINITY RADIO OPERATIONS INC.)
WKNO-FM (91.1 FM; MEMPHIS, TN; Owner: MID-SOUTH PUBLIC COMMUNICATIONS FOUNDATION)
WEGR (102.7 FM; MEMPHIS, TN; Owner: CLEAR CHANNEL BROADCASTING LICENSES, INC.)
WKVF (94.9 FM; BYHALIA, MS; Owner: EDUCATIONAL MEDIA FOUNDATION)
WMPS (107.5 FM; GERMANTOWN, TN; Owner: FLINN BROADCASTING CORPORATION)
WEVL (89.9 FM; MEMPHIS, TN; Owner: SOUTHERN COMMUNICATION VOLUNTEERS, INC.)
WMBZ (94.1 FM; GERMANTOWN, TN; Owner: ENTERCOM MEMPHIS LICENSE, LLC)
WQOX (88.5 FM; MEMPHIS, TN; Owner: MEMPHIS CITY SCHOOLS)
WUMR (91.7 FM; MEMPHIS, TN; Owner: THE UNIVERSITY OF MEMPHIS)
WYPL (89.3 FM; MEMPHIS, TN; Owner: MEMPHIS/SHELBY COUNTY PUBLIC LIBRARY & INFO CNTR.)
WMFS (92.9 FM; BARTLETT, TN; Owner: INFINITY BROADCASTING CORP. OF ILLINOIS)
KJMS (101.1 FM; MEMPHIS, TN; Owner: CLEAR CHANNEL BROADCASTING LICENSES, INC.)
WHRK (97.1 FM; MEMPHIS, TN; Owner: CLEAR CHANNEL BROADCASTING LICENSES, INC.)
WHAL-FM (95.7 FM; OLIVE BRANCH, MS; Owner: CLEAR CHANNEL BROADCASTING LICENSES, INC.)
WRBO (103.5 FM; COMO, MS; Owner: MEMPHIS III LIMITED PARTNERSHIP)
KXHT (107.1 FM; MARION, AR; Owner: FLINN BROADCASTING CORPORATION)
WVIM-FM (95.3 FM; COLDWATER, MS; Owner: DESOTO COUNTY B/CING. CO.)
TV broadcast stations around Collierville:
WBUY (Channel 40; HOLLY SPRINGS, MS; Owner: TRINITY BROADCASTING NETWORK)
WREG-TV (Channel 3; MEMPHIS, TN; Owner: NEW YORK TIMES MANAGEMENT SERVICES)
WKNO (Channel 10; MEMPHIS, TN; Owner: MID-SOUTH PUBLIC COMMUNICATIONS FOUNDATION)
WMC-TV (Channel 5; MEMPHIS, TN; Owner: RAYCOM AMERICA, INC.)
WHBQ-TV (Channel 13; MEMPHIS, TN; Owner: FOX TELEVISION STATIONS, INC.)
WPXX-TV (Channel 50; MEMPHIS, TN; Owner: FLINN BROADCASTING CORPORATION)
WLMT (Channel 30; MEMPHIS, TN; Owner: CLEAR CHANNEL BROADCASTING LICENSES, INC.)
WPTY-TV (Channel 24; MEMPHIS, TN; Owner: CLEAR CHANNEL BROADCASTING LICENSES, INC.)
W57CG (Channel 57; MEMPHIS, TN; Owner: GEORGE S. FLINN, JR.)
W67CV (Channel 67; MEMPHIS, TN; Owner: GEORGE S. FLINN, JR.)
WBXP-CA (Channel 44; MEMPHIS, TN; Owner: THE BOX WORLDWIDE LLC)
W42BY (Channel 42; MEMPHIS, TN; Owner: THREE ANGELS BROADCASTING NETWORK, INC,)
WJRJ-LP (Channel 59; MEMPHIS, TN; Owner: WORD OF GOD FELLOWSHIP, INC.)
W61BP (Channel 61; MEMPHIS, TN; Owner: JIMMY BOYD)
WBII-LP (Channel 20; HOLLY SPRINGS, MS; Owner: MID-SOUTH BROADCASTING)
National Bridge Inventory (NBI) Statistics 97 Number of bridges1,857ft / 566m Total length $21,014,000 Total costs1,057,226 Total average daily traffic141,997 Total average daily truck traffic
New bridges - historical statistics
3 1930-1939 4 1940-1949 5 1950-1959 7 1960-1969 4 1970-1979 1 1980-1989 10 1990-1999 46 2000-2009 16 2010-2019 1 2020-2022
See full National Bridge Inventory statistics for Collierville, TN
Home Mortgage Disclosure Act Aggregated Statistics For Year 2009(Based on 3 full and 5 partial tracts) A) FHA, FSA/RHS & VA B) Conventional C) Refinancings D) Home Improvement Loans F) Non-occupant Loans on G) Loans On Manufactured Number Average Value Number Average Value Number Average Value Number Average Value Number Average Value Number Average Value
LOANS ORIGINATED 171 $217,163 393 $258,557 1,299 $230,647 30 $103,409 41 $208,629 0 $0 APPLICATIONS APPROVED, NOT ACCEPTED 6 $202,002 11 $214,036 95 $227,507 1 $206,900 2 $96,120 2 $81,035 APPLICATIONS DENIED 9 $214,014 30 $285,185 257 $245,507 18 $41,147 5 $126,788 0 $0 APPLICATIONS WITHDRAWN 18 $213,870 47 $278,605 244 $242,589 6 $106,768 6 $161,578 0 $0 FILES CLOSED FOR INCOMPLETENESS 0 $0 6 $244,873 40 $210,595 1 $49,810 0 $0 0 $0
Aggregated Statistics For Year 2008(Based on 3 full and 5 partial tracts) A) FHA, FSA/RHS & VA B) Conventional C) Refinancings D) Home Improvement Loans F) Non-occupant Loans on G) Loans On Manufactured Number Average Value Number Average Value Number Average Value Number Average Value Number Average Value Number Average Value
LOANS ORIGINATED 95 $210,704 514 $256,262 540 $222,480 43 $49,118 59 $170,306 0 $0 APPLICATIONS APPROVED, NOT ACCEPTED 3 $243,327 47 $281,224 63 $227,599 7 $38,034 4 $121,835 3 $122,720 APPLICATIONS DENIED 11 $168,716 50 $260,032 268 $242,447 30 $77,067 11 $124,557 2 $113,000 APPLICATIONS WITHDRAWN 12 $183,037 57 $285,015 127 $229,886 6 $151,648 6 $124,060 0 $0 FILES CLOSED FOR INCOMPLETENESS 2 $181,035 10 $277,215 27 $253,098 1 $151,800 0 $0 0 $0
Aggregated Statistics For Year 2007(Based on 3 full and 5 partial tracts) A) FHA, FSA/RHS & VA B) Conventional C) Refinancings D) Home Improvement Loans E) Loans on Dwellings For 5+ Families F) Non-occupant Loans on G) Loans On Manufactured Number Average Value Number Average Value Number Average Value Number Average Value Number Average Value Number Average Value Number Average Value
LOANS ORIGINATED 27 $209,770 870 $233,601 593 $199,114 73 $89,788 3 $10,143,540 69 $174,849 2 $16,610 APPLICATIONS APPROVED, NOT ACCEPTED 2 $232,765 89 $218,973 81 $193,952 15 $66,465 0 $0 4 $85,840 1 $20,140 APPLICATIONS DENIED 3 $208,733 103 $263,352 324 $231,793 49 $74,592 0 $0 7 $139,261 1 $104,000 APPLICATIONS WITHDRAWN 4 $241,045 76 $248,387 127 $224,614 9 $71,370 0 $0 8 $145,618 1 $18,590 FILES CLOSED FOR INCOMPLETENESS 0 $0 27 $311,669 43 $219,324 1 $43,100 0 $0 0 $0 0 $0
Aggregated Statistics For Year 2006(Based on 3 full and 5 partial tracts) A) FHA, FSA/RHS & VA B) Conventional C) Refinancings D) Home Improvement Loans F) Non-occupant Loans on G) Loans On Manufactured Number Average Value Number Average Value Number Average Value Number Average Value Number Average Value Number Average Value
LOANS ORIGINATED 31 $181,101 1,109 $212,167 567 $195,946 78 $57,015 81 $143,310 3 $123,897 APPLICATIONS APPROVED, NOT ACCEPTED 0 $0 115 $200,096 113 $183,066 14 $102,627 9 $120,713 2 $51,250 APPLICATIONS DENIED 3 $181,220 144 $250,973 306 $208,624 37 $66,474 19 $173,639 2 $92,580 APPLICATIONS WITHDRAWN 7 $193,237 82 $220,511 197 $210,401 11 $79,581 12 $113,368 1 $110,000 FILES CLOSED FOR INCOMPLETENESS 0 $0 21 $275,854 92 $202,377 2 $68,380 4 $113,500 0 $0
Aggregated Statistics For Year 2005(Based on 3 full and 5 partial tracts) A) FHA, FSA/RHS & VA B) Conventional C) Refinancings D) Home Improvement Loans F) Non-occupant Loans on G) Loans On Manufactured Number Average Value Number Average Value Number Average Value Number Average Value Number Average Value Number Average Value
LOANS ORIGINATED 31 $174,519 1,233 $212,287 746 $190,731 55 $51,912 108 $143,778 2 $32,500 APPLICATIONS APPROVED, NOT ACCEPTED 0 $0 86 $210,101 131 $190,395 15 $48,189 12 $116,776 2 $162,300 APPLICATIONS DENIED 4 $117,512 134 $251,166 358 $212,924 45 $52,782 13 $284,304 2 $72,415 APPLICATIONS WITHDRAWN 6 $152,953 127 $218,720 285 $209,767 32 $144,781 15 $160,808 1 $116,500 FILES CLOSED FOR INCOMPLETENESS 0 $0 31 $205,600 109 $204,539 3 $46,357 0 $0 0 $0
Aggregated Statistics For Year 2004(Based on 3 full and 5 partial tracts) A) FHA, FSA/RHS & VA B) Conventional C) Refinancings D) Home Improvement Loans E) Loans on Dwellings For 5+ Families F) Non-occupant Loans on G) Loans On Manufactured Number Average Value Number Average Value Number Average Value Number Average Value Number Average Value Number Average Value Number Average Value
LOANS ORIGINATED 27 $162,715 1,174 $214,391 888 $185,427 46 $68,595 2 $8,800,000 78 $142,962 1 $17,990 APPLICATIONS APPROVED, NOT ACCEPTED 0 $0 90 $214,260 150 $180,405 10 $92,710 0 $0 4 $136,285 3 $21,080 APPLICATIONS DENIED 3 $82,387 109 $201,264 345 $193,469 51 $48,312 0 $0 13 $157,741 8 $27,976 APPLICATIONS WITHDRAWN 3 $93,863 97 $216,243 229 $190,793 17 $77,874 0 $0 9 $128,060 0 $0 FILES CLOSED FOR INCOMPLETENESS 1 $176,680 34 $173,911 93 $183,095 5 $90,448 0 $0 2 $88,305 0 $0
Aggregated Statistics For Year 2003(Based on 3 full and 5 partial tracts) A) FHA, FSA/RHS & VA B) Conventional C) Refinancings D) Home Improvement Loans F) Non-occupant Loans on Number Average Value Number Average Value Number Average Value Number Average Value Number Average Value
LOANS ORIGINATED 38 $154,763 1,170 $201,625 2,486 $180,172 51 $43,465 92 $113,187 APPLICATIONS APPROVED, NOT ACCEPTED 2 $233,415 82 $203,446 212 $173,566 13 $70,078 7 $101,973 APPLICATIONS DENIED 3 $112,323 90 $206,484 492 $173,038 30 $37,661 8 $173,325 APPLICATIONS WITHDRAWN 7 $161,326 103 $192,910 275 $176,661 7 $73,606 7 $96,826 FILES CLOSED FOR INCOMPLETENESS 1 $110,750 27 $166,498 86 $169,959 4 $56,812 1 $39,000
Aggregated Statistics For Year 2002(Based on 2 partial tracts) A) FHA, FSA/RHS & VA B) Conventional C) Refinancings D) Home Improvement Loans E) Loans on Dwellings For 5+ Families F) Non-occupant Loans on Number Average Value Number Average Value Number Average Value Number Average Value Number Average Value Number Average Value
LOANS ORIGINATED 9 $111,166 87 $244,507 179 $232,249 4 $95,622 1 $513,270 11 $112,294 APPLICATIONS APPROVED, NOT ACCEPTED 0 $0 8 $273,661 22 $159,972 2 $99,345 0 $0 3 $64,160 APPLICATIONS DENIED 0 $0 9 $210,099 51 $140,083 5 $38,740 0 $0 3 $64,943 APPLICATIONS WITHDRAWN 0 $0 13 $239,434 24 $175,470 0 $0 0 $0 1 $143,600 FILES CLOSED FOR INCOMPLETENESS 0 $0 2 $340,210 7 $189,833 0 $0 0 $0 1 $48,120
Aggregated Statistics For Year 2001(Based on 2 partial tracts) A) FHA, FSA/RHS & VA B) Conventional C) Refinancings D) Home Improvement Loans F) Non-occupant Loans on Number Average Value Number Average Value Number Average Value Number Average Value Number Average Value
LOANS ORIGINATED 10 $104,547 90 $246,847 111 $227,455 9 $44,232 9 $115,083 APPLICATIONS APPROVED, NOT ACCEPTED 0 $0 4 $300,720 11 $146,005 1 $17,770 1 $241,710 APPLICATIONS DENIED 0 $0 12 $234,208 46 $105,792 7 $13,536 2 $45,165 APPLICATIONS WITHDRAWN 0 $0 6 $269,907 24 $139,842 0 $0 2 $110,880 FILES CLOSED FOR INCOMPLETENESS 0 $0 0 $0 5 $205,278 0 $0 0 $0
Aggregated Statistics For Year 2000(Based on 2 partial tracts) A) FHA, FSA/RHS & VA B) Conventional C) Refinancings D) Home Improvement Loans E) Loans on Dwellings For 5+ Families F) Non-occupant Loans on Number Average Value Number Average Value Number Average Value Number Average Value Number Average Value Number Average Value
LOANS ORIGINATED 7 $83,696 68 $248,534 27 $154,212 20 $17,140 1 $911,740 6 $88,597 APPLICATIONS APPROVED, NOT ACCEPTED 1 $79,350 6 $211,843 10 $106,384 4 $9,602 0 $0 0 $0 APPLICATIONS DENIED 1 $58,250 10 $238,404 32 $103,564 5 $32,060 0 $0 1 $167,570 APPLICATIONS WITHDRAWN 1 $43,050 7 $201,876 21 $107,821 2 $53,695 0 $0 0 $0 FILES CLOSED FOR INCOMPLETENESS 0 $0 2 $446,990 8 $139,498 0 $0 0 $0 1 $21,110
Aggregated Statistics For Year 1999(Based on 4 partial tracts) A) FHA, FSA/RHS & VA B) Conventional C) Refinancings D) Home Improvement Loans F) Non-occupant Loans on Number Average Value Number Average Value Number Average Value Number Average Value Number Average Value
LOANS ORIGINATED 125 $134,663 750 $183,307 472 $139,803 96 $24,971 38 $100,553 APPLICATIONS APPROVED, NOT ACCEPTED 2 $146,520 34 $164,409 75 $107,355 21 $18,963 2 $107,090 APPLICATIONS DENIED 12 $131,708 69 $190,390 176 $124,323 46 $28,800 3 $158,677 APPLICATIONS WITHDRAWN 7 $111,444 61 $183,109 109 $126,558 11 $60,958 6 $99,157 FILES CLOSED FOR INCOMPLETENESS 0 $0 16 $164,131 51 $117,405 1 $23,280 1 $41,480
Detailed HMDA statistics for the following Tracts:
0213.53
, 0215.20 , 0215.30 , 0215.40 , 0216.11 , 0216.12 , 0216.13 , 0216.20
Private Mortgage Insurance Companies Aggregated Statistics For Year 2009(Based on 3 full and 5 partial tracts) A) Conventional B) Refinancings Number Average Value Number Average Value
LOANS ORIGINATED 68 $273,125 58 $259,030 APPLICATIONS APPROVED, NOT ACCEPTED 21 $269,550 32 $249,300 APPLICATIONS DENIED 10 $279,100 15 $251,071 APPLICATIONS WITHDRAWN 2 $296,560 4 $257,027 FILES CLOSED FOR INCOMPLETENESS 1 $378,080 2 $362,050
Aggregated Statistics For Year 2008(Based on 3 full and 5 partial tracts) A) Conventional B) Refinancings C) Non-occupant Loans on Number Average Value Number Average Value Number Average Value
LOANS ORIGINATED 151 $269,502 50 $247,814 6 $191,935 APPLICATIONS APPROVED, NOT ACCEPTED 36 $273,703 29 $299,142 2 $241,345 APPLICATIONS DENIED 8 $313,221 4 $265,790 4 $347,870 APPLICATIONS WITHDRAWN 7 $249,469 2 $185,380 1 $29,550 FILES CLOSED FOR INCOMPLETENESS 4 $190,978 0 $0 1 $202,420
Aggregated Statistics For Year 2007(Based on 3 full and 5 partial tracts) A) Conventional B) Refinancings C) Non-occupant Loans on Number Average Value Number Average Value Number Average Value
LOANS ORIGINATED 195 $237,648 76 $245,427 7 $204,007 APPLICATIONS APPROVED, NOT ACCEPTED 15 $184,782 9 $245,324 1 $46,430 APPLICATIONS DENIED 6 $298,258 1 $183,000 1 $297,000 APPLICATIONS WITHDRAWN 7 $266,627 4 $262,455 1 $183,000 FILES CLOSED FOR INCOMPLETENESS 0 $0 0 $0 0 $0
Aggregated Statistics For Year 2006(Based on 3 full and 5 partial tracts) A) Conventional B) Refinancings C) Non-occupant Loans on Number Average Value Number Average Value Number Average Value
LOANS ORIGINATED 119 $232,750 35 $211,651 6 $166,610 APPLICATIONS APPROVED, NOT ACCEPTED 11 $309,162 13 $222,026 0 $0 APPLICATIONS DENIED 0 $0 0 $0 0 $0 APPLICATIONS WITHDRAWN 5 $266,860 4 $249,905 0 $0 FILES CLOSED FOR INCOMPLETENESS 0 $0 0 $0 0 $0
Aggregated Statistics For Year 2005(Based on 3 full and 5 partial tracts) A) Conventional B) Refinancings C) Non-occupant Loans on Number Average Value Number Average Value Number Average Value
LOANS ORIGINATED 112 $225,578 64 $215,625 8 $114,886 APPLICATIONS APPROVED, NOT ACCEPTED 18 $201,702 21 $204,759 5 $107,344 APPLICATIONS DENIED 0 $0 1 $137,070 0 $0 APPLICATIONS WITHDRAWN 4 $280,028 3 $136,983 1 $90,000 FILES CLOSED FOR INCOMPLETENESS 0 $0 0 $0 0 $0
Aggregated Statistics For Year 2004(Based on 3 full and 5 partial tracts) A) Conventional B) Refinancings C) Non-occupant Loans on Number Average Value Number Average Value Number Average Value
LOANS ORIGINATED 134 $209,139 86 $195,012 9 $125,138 APPLICATIONS APPROVED, NOT ACCEPTED 19 $226,806 37 $207,616 3 $116,233 APPLICATIONS DENIED 1 $162,550 1 $101,600 1 $22,790 APPLICATIONS WITHDRAWN 5 $263,194 12 $245,493 1 $301,000 FILES CLOSED FOR INCOMPLETENESS 0 $0 1 $142,720 0 $0
Aggregated Statistics For Year 2003(Based on 3 full and 5 partial tracts) A) Conventional B) Refinancings C) Non-occupant Loans on Number Average Value Number Average Value Number Average Value
LOANS ORIGINATED 219 $208,727 326 $193,917 13 $127,175 APPLICATIONS APPROVED, NOT ACCEPTED 26 $226,089 62 $213,819 1 $165,070 APPLICATIONS DENIED 1 $224,000 2 $212,510 0 $0 APPLICATIONS WITHDRAWN 15 $256,854 15 $206,196 0 $0 FILES CLOSED FOR INCOMPLETENESS 0 $0 0 $0 0 $0
Aggregated Statistics For Year 2002(Based on 2 partial tracts) A) Conventional B) Refinancings C) Non-occupant Loans on Number Average Value Number Average Value Number Average Value
LOANS ORIGINATED 12 $197,067 11 $179,981 1 $59,940 APPLICATIONS APPROVED, NOT ACCEPTED 3 $315,590 1 $205,590 1 $102,990 APPLICATIONS DENIED 0 $0 0 $0 0 $0 APPLICATIONS WITHDRAWN 0 $0 1 $259,230 0 $0 FILES CLOSED FOR INCOMPLETENESS 0 $0 0 $0 0 $0
Aggregated Statistics For Year 2001(Based on 2 partial tracts) A) Conventional B) Refinancings C) Non-occupant Loans on Number Average Value Number Average Value Number Average Value
LOANS ORIGINATED 15 $223,012 5 $231,310 2 $48,540 APPLICATIONS APPROVED, NOT ACCEPTED 2 $241,195 1 $222,360 1 $87,800 APPLICATIONS DENIED 0 $0 0 $0 0 $0 APPLICATIONS WITHDRAWN 1 $45,590 0 $0 1 $45,590 FILES CLOSED FOR INCOMPLETENESS 0 $0 0 $0 0 $0
Aggregated Statistics For Year 2000(Based on 2 partial tracts) A) Conventional B) Refinancings C) Non-occupant Loans on Number Average Value Number Average Value Number Average Value
LOANS ORIGINATED 12 $212,542 1 $234,600 2 $47,275 APPLICATIONS APPROVED, NOT ACCEPTED 1 $273,960 0 $0 0 $0 APPLICATIONS DENIED 0 $0 0 $0 0 $0 APPLICATIONS WITHDRAWN 0 $0 0 $0 0 $0 FILES CLOSED FOR INCOMPLETENESS 0 $0 0 $0 0 $0
Aggregated Statistics For Year 1999(Based on 4 partial tracts) A) Conventional B) Refinancings C) Non-occupant Loans on Number Average Value Number Average Value Number Average Value
LOANS ORIGINATED 259 $192,279 60 $166,735 5 $121,652 APPLICATIONS APPROVED, NOT ACCEPTED 12 $191,639 18 $156,384 1 $120,760 APPLICATIONS DENIED 7 $294,290 2 $160,395 0 $0 APPLICATIONS WITHDRAWN 5 $230,316 2 $178,830 0 $0 FILES CLOSED FOR INCOMPLETENESS 0 $0 1 $158,380 0 $0
Detailed PMIC statistics for the following Tracts:
0213.53
, 0215.20 , 0215.30 , 0215.40 , 0216.11 , 0216.12 , 0216.13 , 0216.20 Fire-safe hotels and motels in Collierville, Tennessee:
Days Inn & Suites, 1230 W Poplar Ave, Collierville, Tennessee 38017 Phone: (901) 853-1235, Fax: (901) 853-1290
Courtyard By Marriott/Memphis-Collierville, 4640 Merchants Park Cir, Collierville, Tennessee 38017 Phone: (901) 850-9390, Fax: (901) 755-8230
All 2 fire-safe hotels and motels in Collierville, Tennessee
Most common first names in Collierville, TN among deceased individuals Name Count Lived (average)
James 110 72.0 years Mary 109 80.2 years William 95 75.7 years John 85 74.5 years Robert 68 71.8 years Willie 58 74.7 years Charles 49 72.0 years George 38 73.2 years Martha 37 78.1 years Annie 35 83.0 years
Most common last names in Collierville, TN among deceased individuals Last name Count Lived (average)
Jones 54 71.5 years Smith 54 74.7 years Williams 40 74.5 years Moore 39 78.3 years Wilson 38 76.2 years Davis 31 75.7 years Johnson 29 74.4 years Joyner 27 80.5 years Taylor 26 76.8 years Thomas 24 74.4 years
Collierville compared to Tennessee state average:
Median household income above state average. Median house value above state average. Unemployed percentage significantly below state average. Foreign-born population percentage significantly above state average. Renting percentage below state average. Number of rooms per house above state average. House age below state average. Percentage of population with a bachelor's degree or higher significantly above state average. Collierville on our top lists :
#19 on the list of "Top 101 cities with largest percentage of males in industries: transportation and warehousing (population 5,000+)"
#41 on the list of "Top 101 cities with largest percentage of females in industries: transportation and warehousing (population 5,000+)"
#97 on the list of "Top 101 cities with largest percentage of males in occupations: management occupations (population 5,000+)"
#71 (38139) on the list of "Top 101 zip codes with the highest 2012 average reported profit/loss from business (pop 5,000+)"
#1 on the list of "Top 101 counties with the most Black Protestant adherents"
#2 on the list of "Top 101 counties with the most Black Protestant congregations"
#3 on the list of "Top 101 counties with the highest number of infant deaths per 1000 residents 2007-2013 (pop. 50,000+)"
#9 on the list of "Top 101 counties with the lowest percentage of residents that drank alcohol in the past 30 days"
#10 on the list of "Top 101 counties with the highest average weight of females"
Top Patent Applicants
Cong Thanh Dinh (28)
Anshu A. Pradhan (27)
David C. Kelman (25)
Nicholas S. Ritchey (23)
Greg C. Marik (21)
John Rose (20)
Eric C. Lange (19)
Gary S. Lindemann (17)
Carlos E. Gil (16)
Gregory C. Marik (16)
Total of 910 patent applications in 2008-2024.
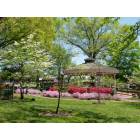
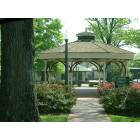
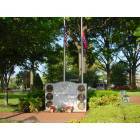

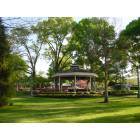
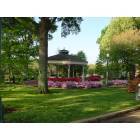
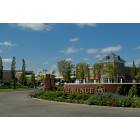
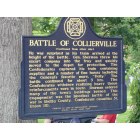


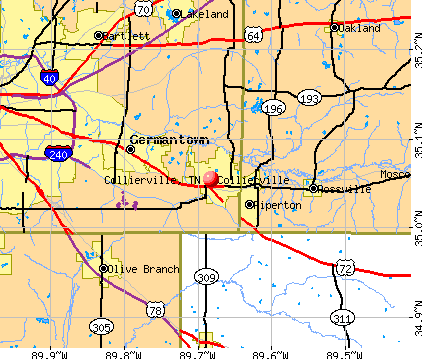


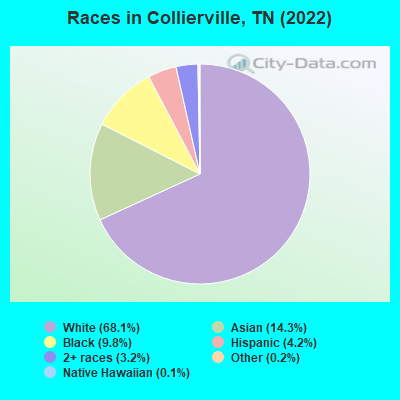
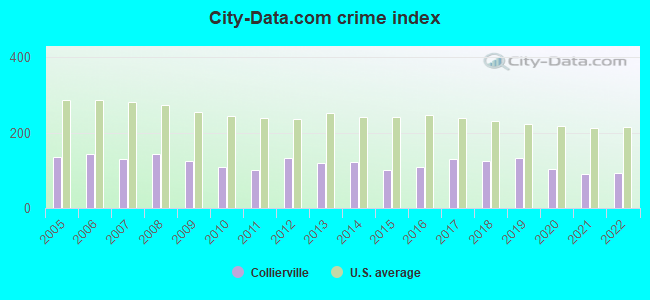
 Recent articles from our blog. Our writers, many of them Ph.D. graduates or candidates, create easy-to-read articles on a wide variety of topics.


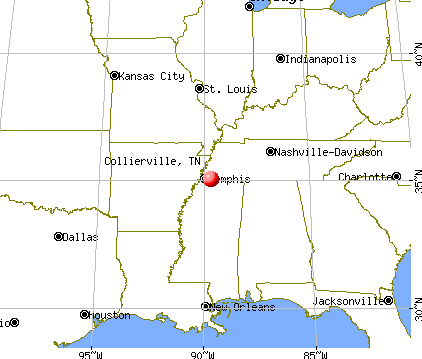
 (16.9 miles
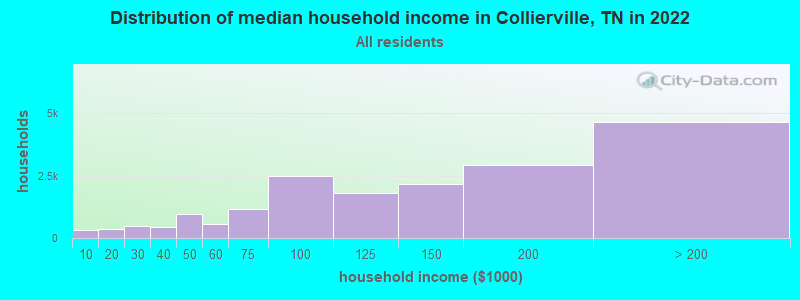
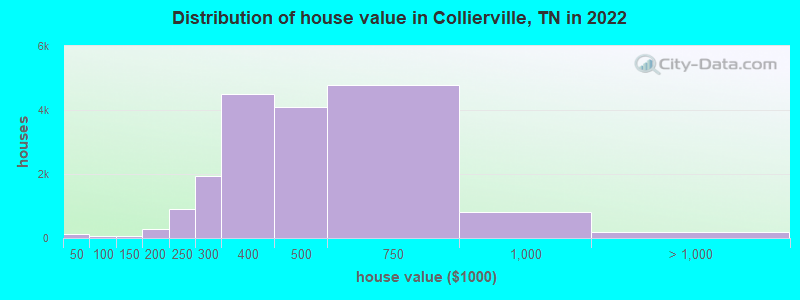
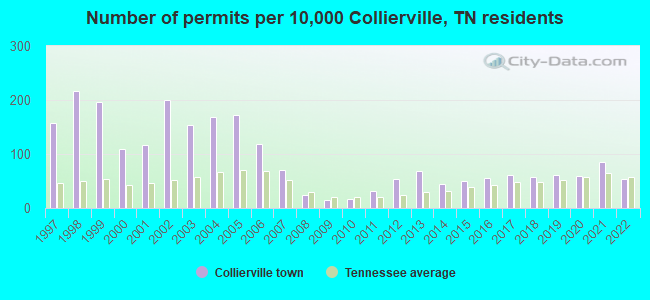
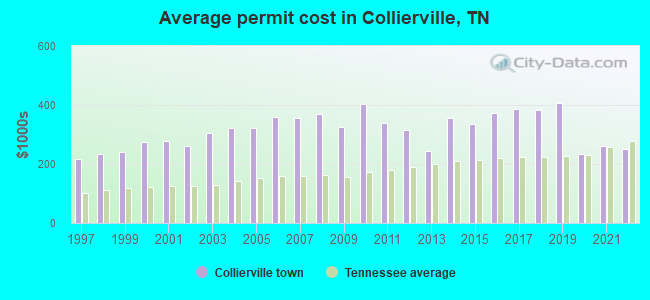
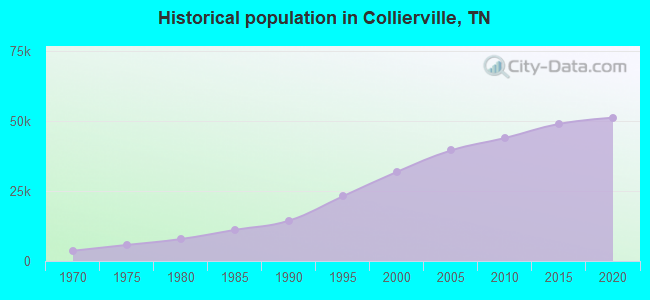
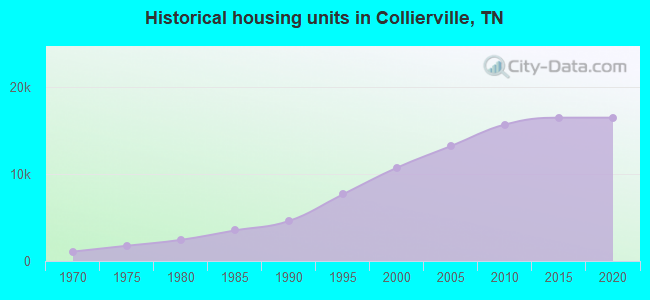
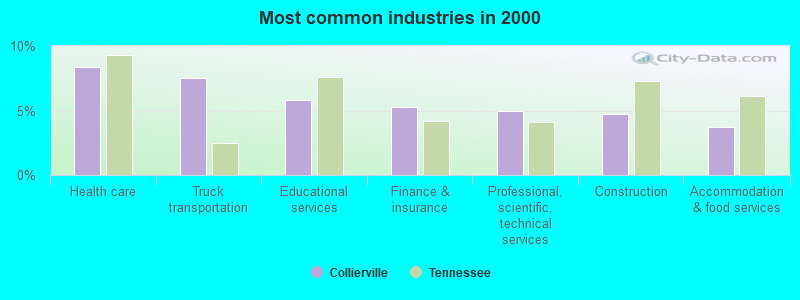
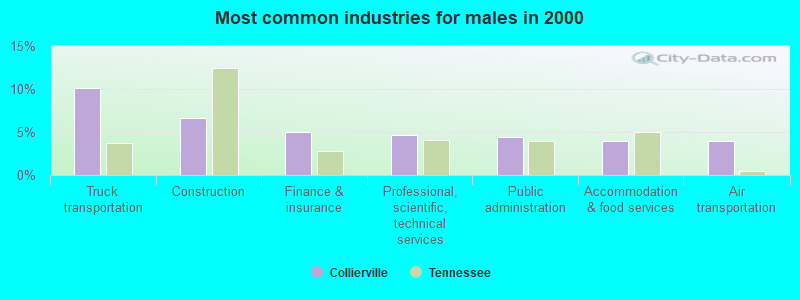
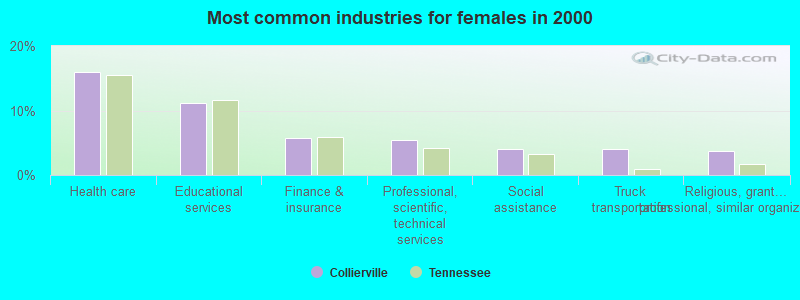
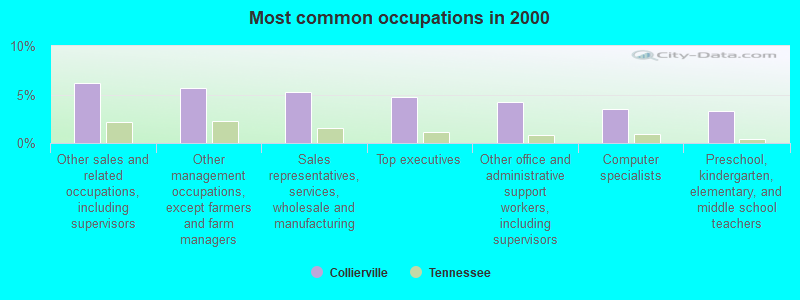
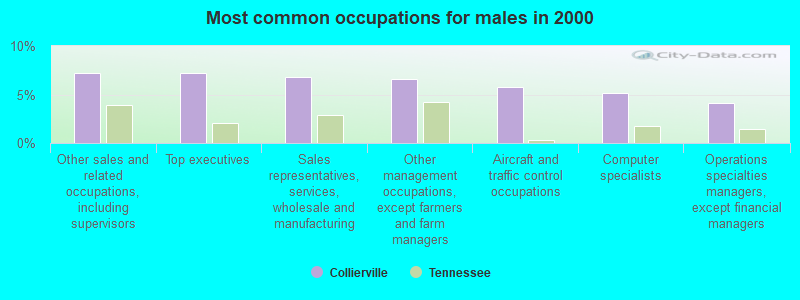
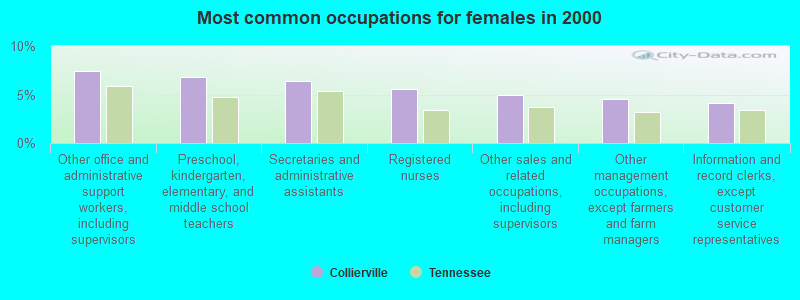
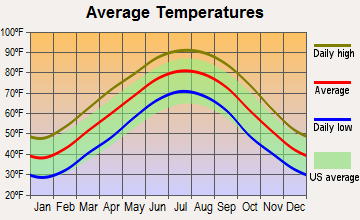
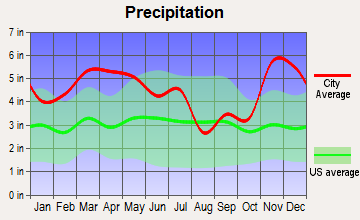
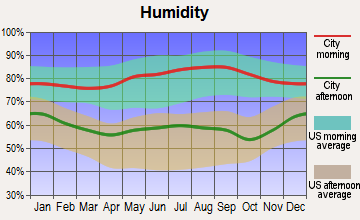
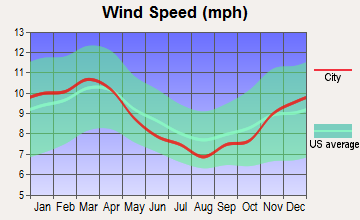
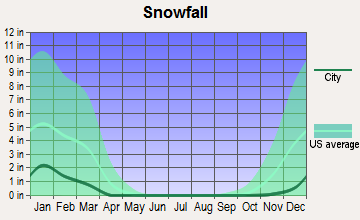
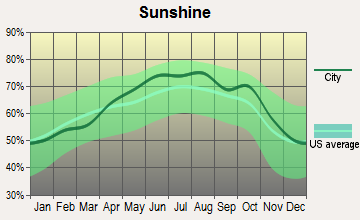
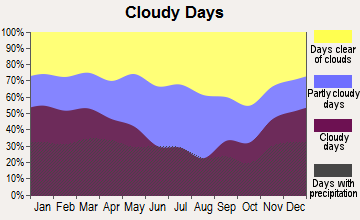
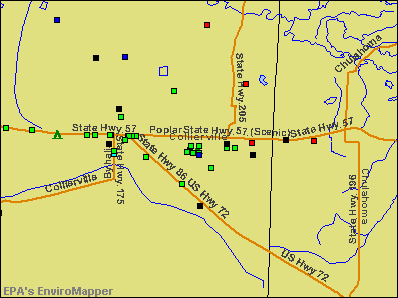

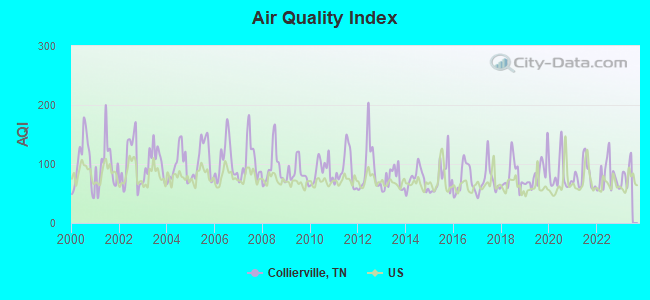
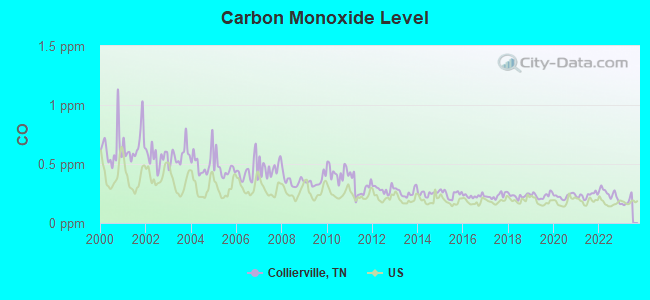
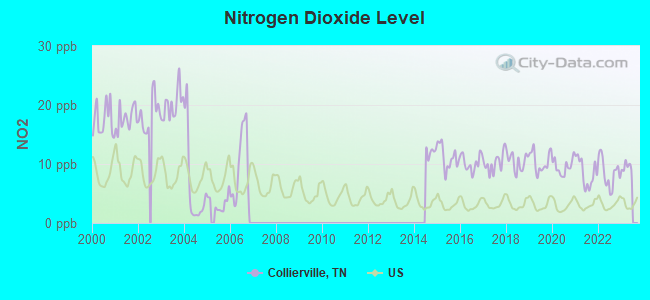
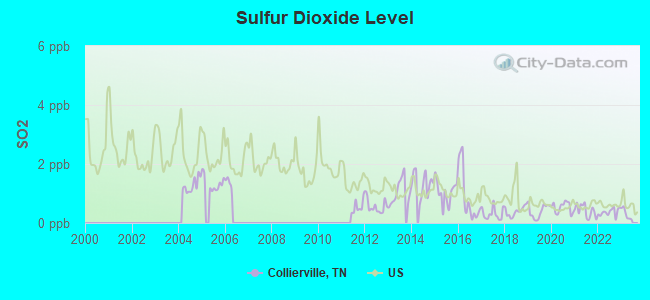
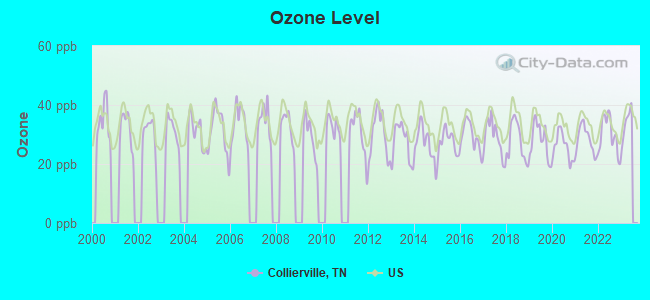
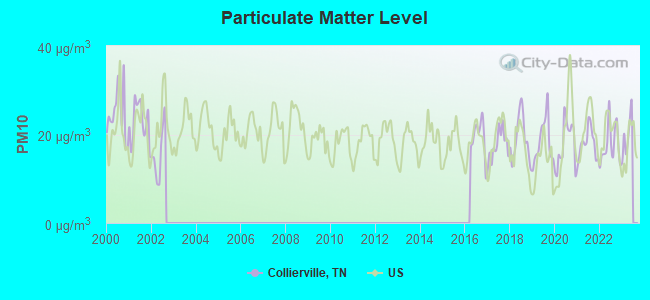
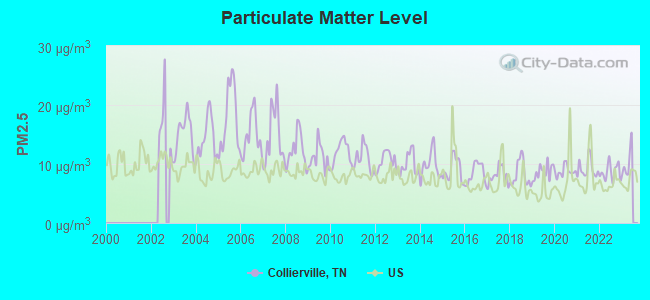
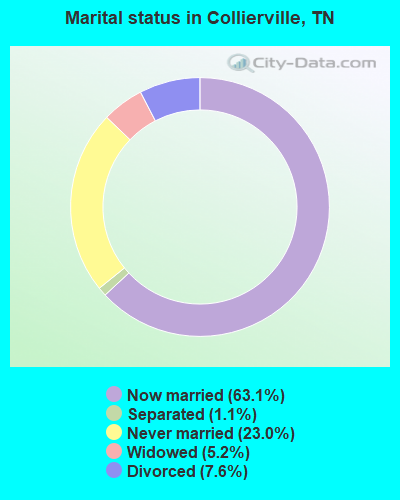
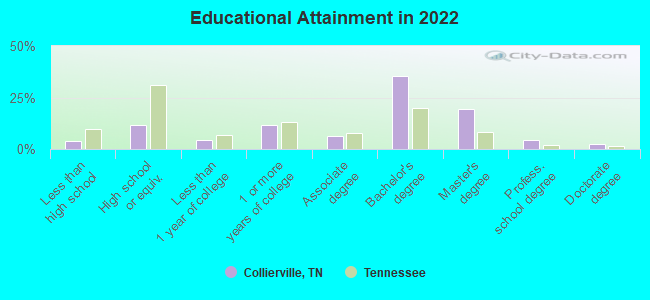
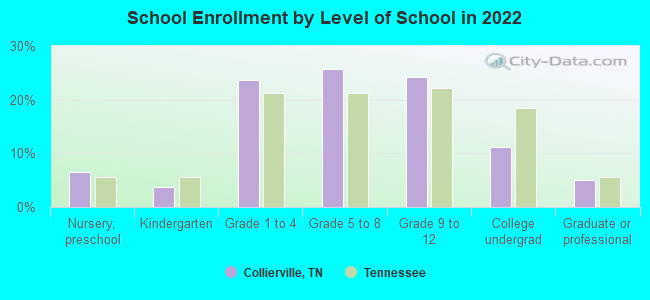
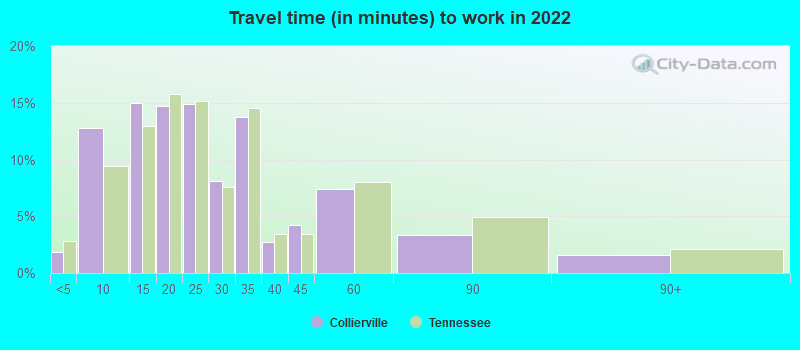
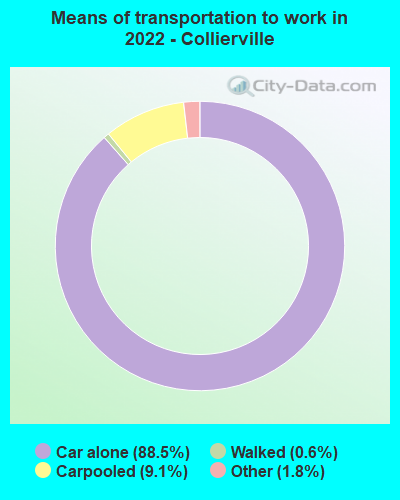
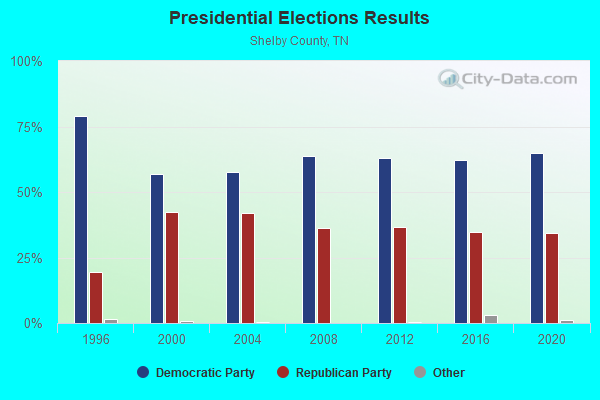
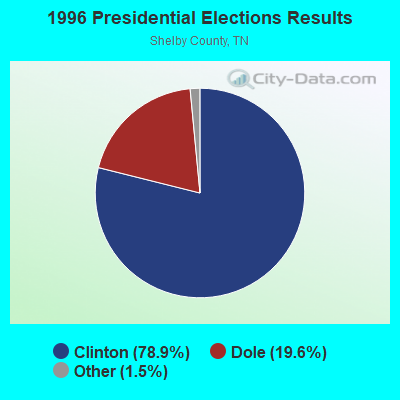
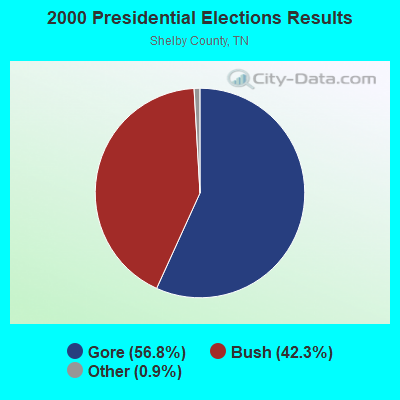
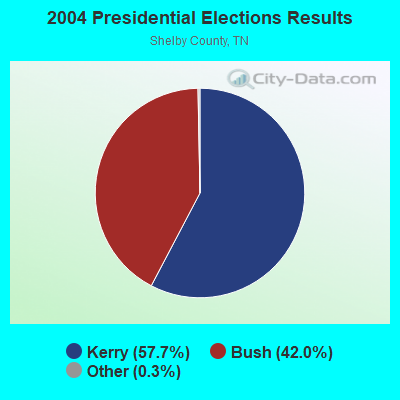
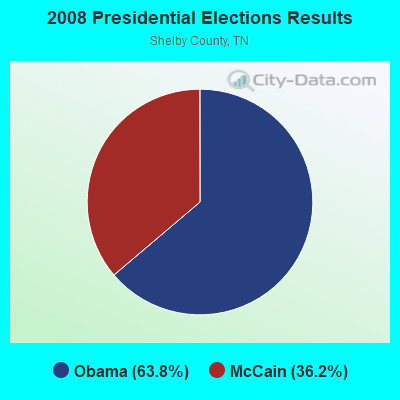
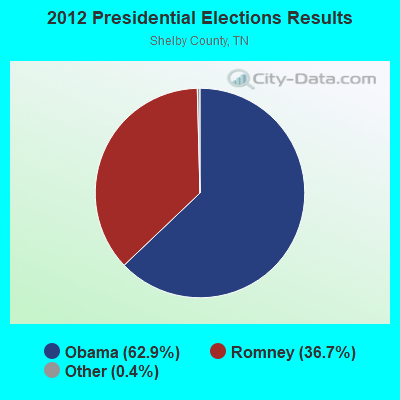
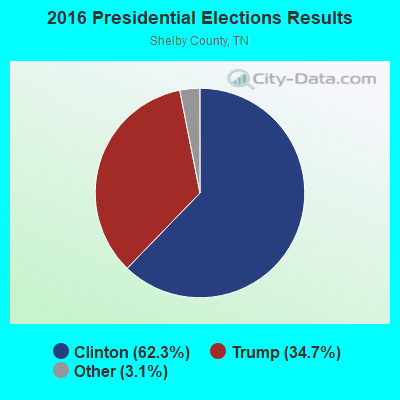
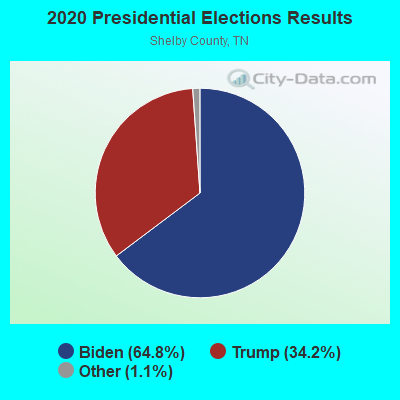
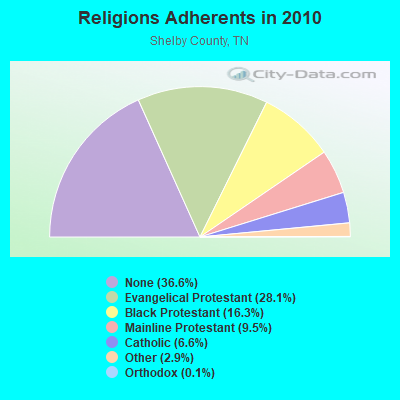
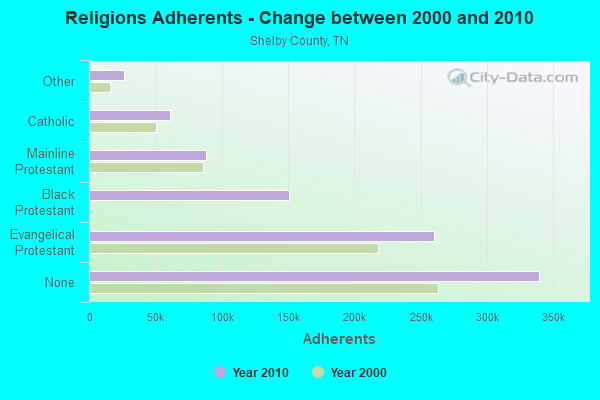
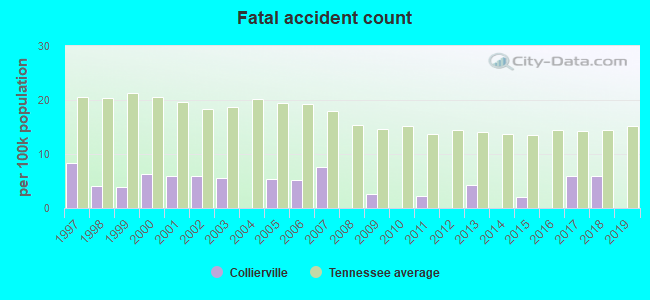
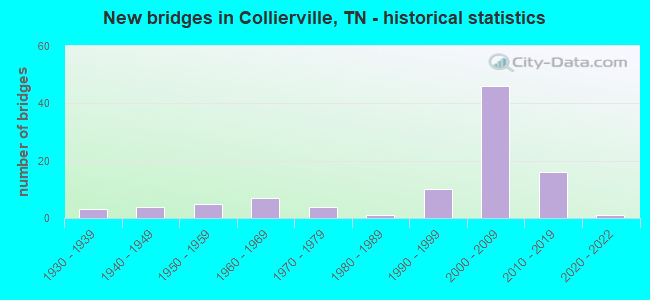
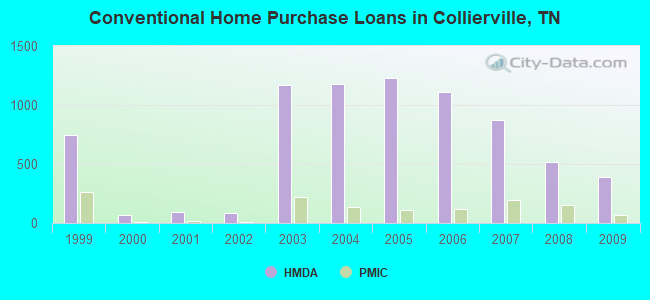
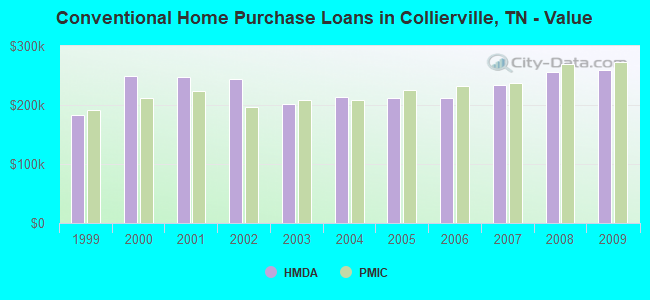
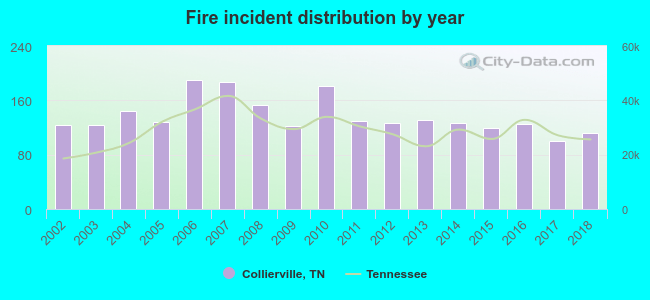 Based on the data from the years 2002 - 2018 the average number of fires per year is 137. The highest number of fires - 190 took place in 2006, and the least - 100 in 2017. The data has a declining trend.
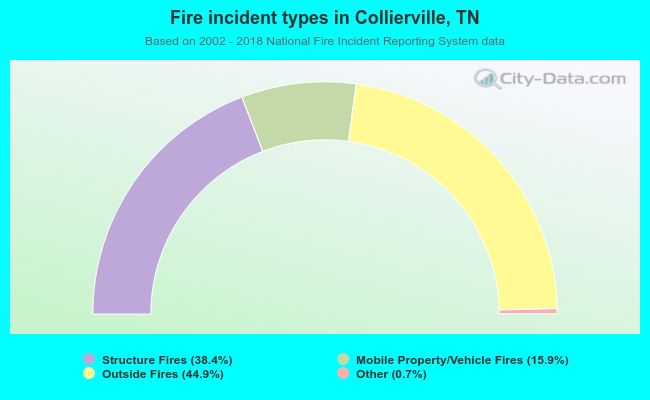 When looking into fire subcategories, the most incidents belonged to: Outside Fires (44.9%), and Structure Fires (38.4%).