Connersville, Indiana Submit your own pictures of this city and show them to the world
OSM Map
General Map
Google Map
MSN Map
OSM Map
General Map
Google Map
MSN Map
OSM Map
General Map
Google Map
MSN Map
OSM Map
General Map
Google Map
MSN Map
Please wait while loading the map...
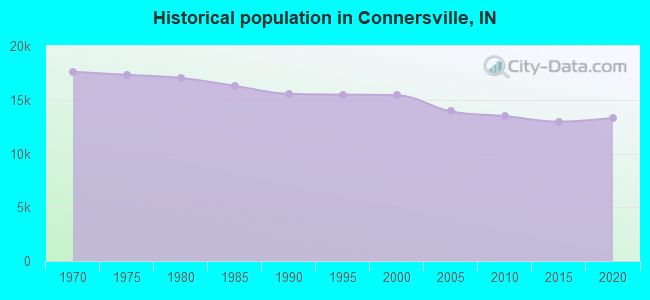
Population in 2022: 13,292 (100% urban, 0% rural). Population change since 2000: -13.7%Males: 6,349 Females: 6,943
March 2022 cost of living index in Connersville: 75.5 (low, U.S. average is 100) Percentage of residents living in poverty in 2022: 22.2%for White Non-Hispanic residents , 27.2% for Black residents , 24.6% for Hispanic or Latino residents , 18.3% for other race residents , 29.4% for two or more races residents )
Profiles of local businesses
Business Search - 14 Million verified businesses
Data:
Median household income ($)
Median household income (% change since 2000)
Household income diversity
Ratio of average income to average house value (%)
Ratio of average income to average rent
Median household income ($) - White
Median household income ($) - Black or African American
Median household income ($) - Asian
Median household income ($) - Hispanic or Latino
Median household income ($) - American Indian and Alaska Native
Median household income ($) - Multirace
Median household income ($) - Other Race
Median household income for houses/condos with a mortgage ($)
Median household income for apartments without a mortgage ($)
Races - White alone (%)
Races - White alone (% change since 2000)
Races - Black alone (%)
Races - Black alone (% change since 2000)
Races - American Indian alone (%)
Races - American Indian alone (% change since 2000)
Races - Asian alone (%)
Races - Asian alone (% change since 2000)
Races - Hispanic (%)
Races - Hispanic (% change since 2000)
Races - Native Hawaiian and Other Pacific Islander alone (%)
Races - Native Hawaiian and Other Pacific Islander alone (% change since 2000)
Races - Two or more races (%)
Races - Two or more races (% change since 2000)
Races - Other race alone (%)
Races - Other race alone (% change since 2000)
Racial diversity
Unemployment (%)
Unemployment (% change since 2000)
Unemployment (%) - White
Unemployment (%) - Black or African American
Unemployment (%) - Asian
Unemployment (%) - Hispanic or Latino
Unemployment (%) - American Indian and Alaska Native
Unemployment (%) - Multirace
Unemployment (%) - Other Race
Population density (people per square mile)
Population - Males (%)
Population - Females (%)
Population - Males (%) - White
Population - Males (%) - Black or African American
Population - Males (%) - Asian
Population - Males (%) - Hispanic or Latino
Population - Males (%) - American Indian and Alaska Native
Population - Males (%) - Multirace
Population - Males (%) - Other Race
Population - Females (%) - White
Population - Females (%) - Black or African American
Population - Females (%) - Asian
Population - Females (%) - Hispanic or Latino
Population - Females (%) - American Indian and Alaska Native
Population - Females (%) - Multirace
Population - Females (%) - Other Race
Coronavirus confirmed cases (Apr 25, 2024)
Deaths caused by coronavirus (Apr 25, 2024)
Coronavirus confirmed cases (per 100k population) (Apr 25, 2024)
Deaths caused by coronavirus (per 100k population) (Apr 25, 2024)
Daily increase in number of cases (Apr 25, 2024)
Weekly increase in number of cases (Apr 25, 2024)
Cases doubled (in days) (Apr 25, 2024)
Hospitalized patients (Apr 18, 2022)
Negative test results (Apr 18, 2022)
Total test results (Apr 18, 2022)
COVID Vaccine doses distributed (per 100k population) (Sep 19, 2023)
COVID Vaccine doses administered (per 100k population) (Sep 19, 2023)
COVID Vaccine doses distributed (Sep 19, 2023)
COVID Vaccine doses administered (Sep 19, 2023)
Likely homosexual households (%)
Likely homosexual households (% change since 2000)
Likely homosexual households - Lesbian couples (%)
Likely homosexual households - Lesbian couples (% change since 2000)
Likely homosexual households - Gay men (%)
Likely homosexual households - Gay men (% change since 2000)
Cost of living index
Median gross rent ($)
Median contract rent ($)
Median monthly housing costs ($)
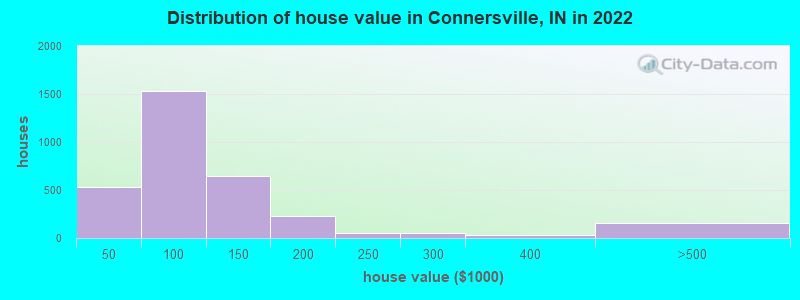
Median house or condo value ($)
Median house or condo value ($ change since 2000)
Mean house or condo value by units in structure - 1, detached ($)
Mean house or condo value by units in structure - 1, attached ($)
Mean house or condo value by units in structure - 2 ($)
Mean house or condo value by units in structure by units in structure - 3 or 4 ($)
Mean house or condo value by units in structure - 5 or more ($)
Mean house or condo value by units in structure - Boat, RV, van, etc. ($)
Mean house or condo value by units in structure - Mobile home ($)
Median house or condo value ($) - White
Median house or condo value ($) - Black or African American
Median house or condo value ($) - Asian
Median house or condo value ($) - Hispanic or Latino
Median house or condo value ($) - American Indian and Alaska Native
Median house or condo value ($) - Multirace
Median house or condo value ($) - Other Race
Median resident age
Resident age diversity
Median resident age - Males
Median resident age - Females
Median resident age - White
Median resident age - Black or African American
Median resident age - Asian
Median resident age - Hispanic or Latino
Median resident age - American Indian and Alaska Native
Median resident age - Multirace
Median resident age - Other Race
Median resident age - Males - White
Median resident age - Males - Black or African American
Median resident age - Males - Asian
Median resident age - Males - Hispanic or Latino
Median resident age - Males - American Indian and Alaska Native
Median resident age - Males - Multirace
Median resident age - Males - Other Race
Median resident age - Females - White
Median resident age - Females - Black or African American
Median resident age - Females - Asian
Median resident age - Females - Hispanic or Latino
Median resident age - Females - American Indian and Alaska Native
Median resident age - Females - Multirace
Median resident age - Females - Other Race
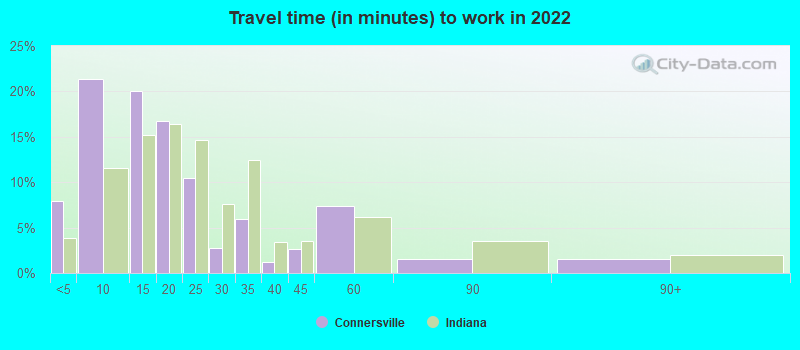
Commute - mean travel time to work (minutes)
Travel time to work - Less than 5 minutes (%)
Travel time to work - Less than 5 minutes (% change since 2000)
Travel time to work - 5 to 9 minutes (%)
Travel time to work - 5 to 9 minutes (% change since 2000)
Travel time to work - 10 to 19 minutes (%)
Travel time to work - 10 to 19 minutes (% change since 2000)
Travel time to work - 20 to 29 minutes (%)
Travel time to work - 20 to 29 minutes (% change since 2000)
Travel time to work - 30 to 39 minutes (%)
Travel time to work - 30 to 39 minutes (% change since 2000)
Travel time to work - 40 to 59 minutes (%)
Travel time to work - 40 to 59 minutes (% change since 2000)
Travel time to work - 60 to 89 minutes (%)
Travel time to work - 60 to 89 minutes (% change since 2000)
Travel time to work - 90 or more minutes (%)
Travel time to work - 90 or more minutes (% change since 2000)
Marital status - Never married (%)
Marital status - Now married (%)
Marital status - Separated (%)
Marital status - Widowed (%)
Marital status - Divorced (%)
Median family income ($)
Median family income (% change since 2000)
Median non-family income ($)
Median non-family income (% change since 2000)
Median per capita income ($)
Median per capita income (% change since 2000)
Median family income ($) - White
Median family income ($) - Black or African American
Median family income ($) - Asian
Median family income ($) - Hispanic or Latino
Median family income ($) - American Indian and Alaska Native
Median family income ($) - Multirace
Median family income ($) - Other Race
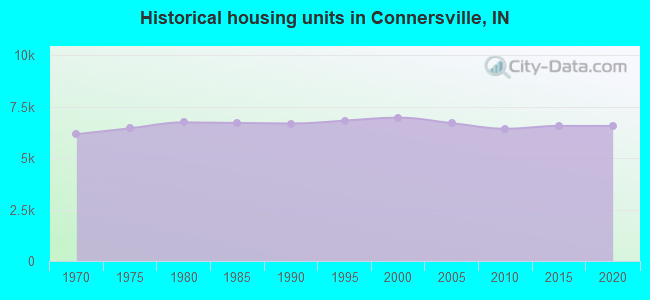
Median year house/condo built
Median year apartment built
Year house built - Built 2005 or later (%)
Year house built - Built 2000 to 2004 (%)
Year house built - Built 1990 to 1999 (%)
Year house built - Built 1980 to 1989 (%)
Year house built - Built 1970 to 1979 (%)
Year house built - Built 1960 to 1969 (%)
Year house built - Built 1950 to 1959 (%)
Year house built - Built 1940 to 1949 (%)
Year house built - Built 1939 or earlier (%)
Average household size
Household density (households per square mile)
Average household size - White
Average household size - Black or African American
Average household size - Asian
Average household size - Hispanic or Latino
Average household size - American Indian and Alaska Native
Average household size - Multirace
Average household size - Other Race
Occupied housing units (%)
Vacant housing units (%)
Owner occupied housing units (%)
Renter occupied housing units (%)
Vacancy status - For rent (%)
Vacancy status - For sale only (%)
Vacancy status - Rented or sold, not occupied (%)
Vacancy status - For seasonal, recreational, or occasional use (%)
Vacancy status - For migrant workers (%)
Vacancy status - Other vacant (%)
Residents with income below the poverty level (%)
Residents with income below 50% of the poverty level (%)
Children below poverty level (%)
Poor families by family type - Married-couple family (%)
Poor families by family type - Male, no wife present (%)
Poor families by family type - Female, no husband present (%)
Poverty status for native-born residents (%)
Poverty status for foreign-born residents (%)
Poverty among high school graduates not in families (%)
Poverty among people who did not graduate high school not in families (%)
Residents with income below the poverty level (%) - White
Residents with income below the poverty level (%) - Black or African American
Residents with income below the poverty level (%) - Asian
Residents with income below the poverty level (%) - Hispanic or Latino
Residents with income below the poverty level (%) - American Indian and Alaska Native
Residents with income below the poverty level (%) - Multirace
Residents with income below the poverty level (%) - Other Race
Air pollution - Air Quality Index (AQI)
Air pollution - CO
Air pollution - NO2
Air pollution - SO2
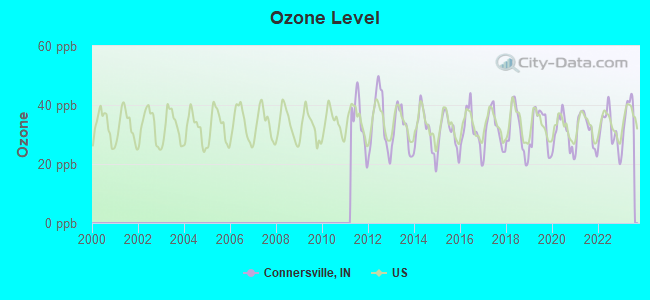
Air pollution - Ozone
Air pollution - PM10
Air pollution - PM25
Air pollution - Pb
Crime - Murders per 100,000 population
Crime - Rapes per 100,000 population
Crime - Robberies per 100,000 population
Crime - Assaults per 100,000 population
Crime - Burglaries per 100,000 population
Crime - Thefts per 100,000 population
Crime - Auto thefts per 100,000 population
Crime - Arson per 100,000 population
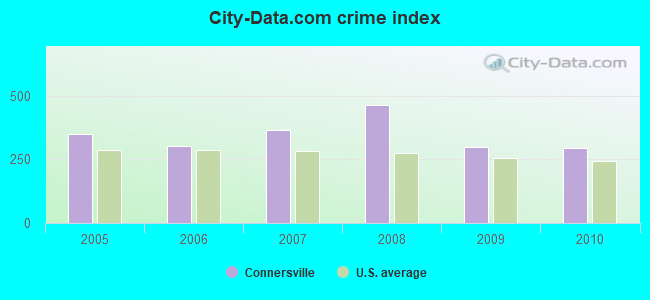
Crime - City-data.com crime index
Crime - Violent crime index
Crime - Property crime index
Crime - Murders per 100,000 population (5 year average)
Crime - Rapes per 100,000 population (5 year average)
Crime - Robberies per 100,000 population (5 year average)
Crime - Assaults per 100,000 population (5 year average)
Crime - Burglaries per 100,000 population (5 year average)
Crime - Thefts per 100,000 population (5 year average)
Crime - Auto thefts per 100,000 population (5 year average)
Crime - Arson per 100,000 population (5 year average)
Crime - City-data.com crime index (5 year average)
Crime - Violent crime index (5 year average)
Crime - Property crime index (5 year average)
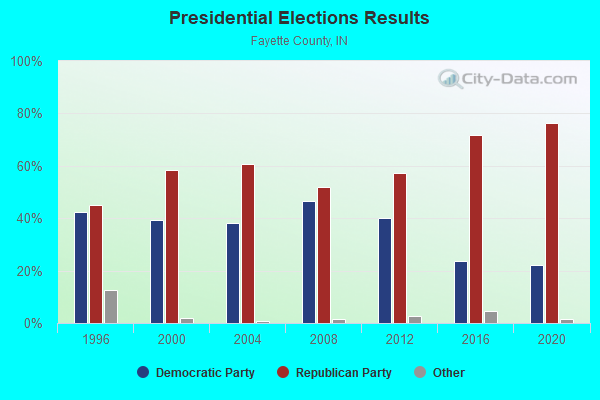
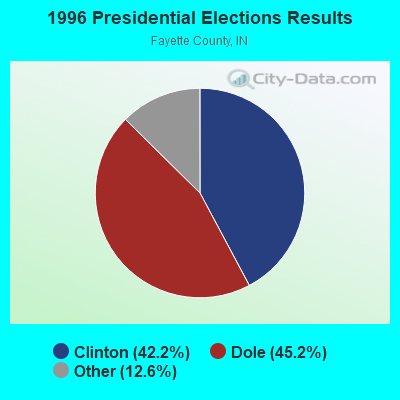
1996 Presidential Elections Results (%) - Democratic Party (Clinton)
1996 Presidential Elections Results (%) - Republican Party (Dole)
1996 Presidential Elections Results (%) - Other
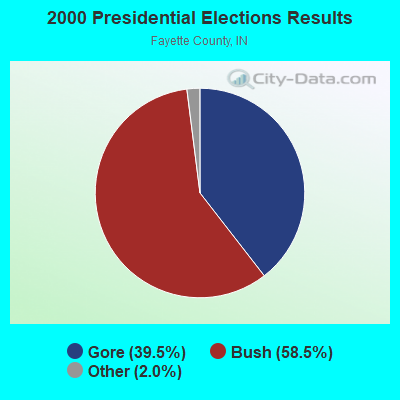
2000 Presidential Elections Results (%) - Democratic Party (Gore)
2000 Presidential Elections Results (%) - Republican Party (Bush)
2000 Presidential Elections Results (%) - Other
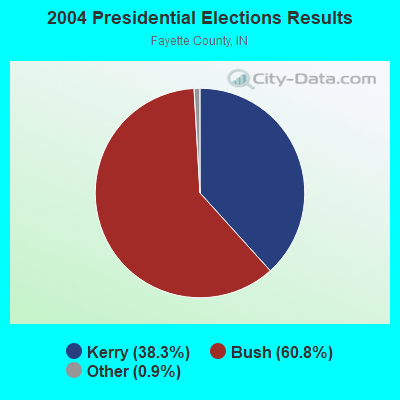
2004 Presidential Elections Results (%) - Democratic Party (Kerry)
2004 Presidential Elections Results (%) - Republican Party (Bush)
2004 Presidential Elections Results (%) - Other
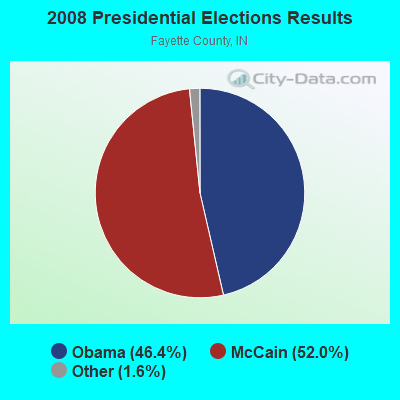
2008 Presidential Elections Results (%) - Democratic Party (Obama)
2008 Presidential Elections Results (%) - Republican Party (McCain)
2008 Presidential Elections Results (%) - Other
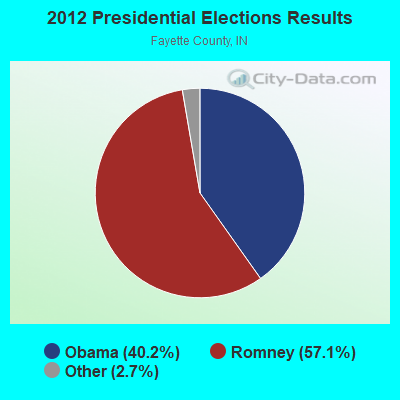
2012 Presidential Elections Results (%) - Democratic Party (Obama)
2012 Presidential Elections Results (%) - Republican Party (Romney)
2012 Presidential Elections Results (%) - Other
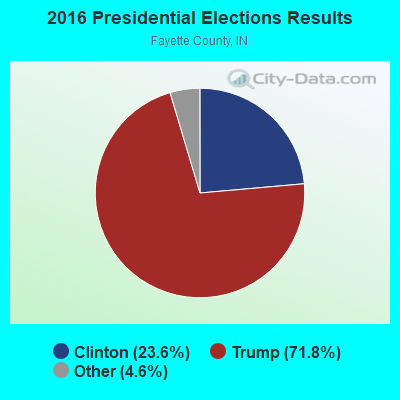
2016 Presidential Elections Results (%) - Democratic Party (Clinton)
2016 Presidential Elections Results (%) - Republican Party (Trump)
2016 Presidential Elections Results (%) - Other
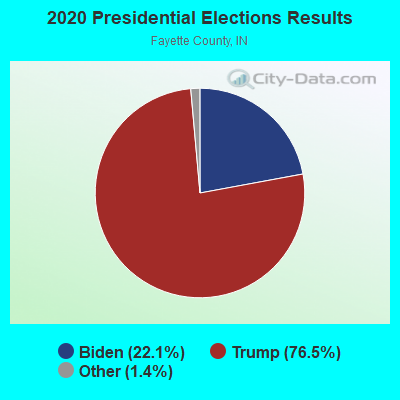
2020 Presidential Elections Results (%) - Democratic Party (Biden)
2020 Presidential Elections Results (%) - Republican Party (Trump)
2020 Presidential Elections Results (%) - Other
Ancestries Reported - Arab (%)
Ancestries Reported - Czech (%)
Ancestries Reported - Danish (%)
Ancestries Reported - Dutch (%)
Ancestries Reported - English (%)
Ancestries Reported - French (%)
Ancestries Reported - French Canadian (%)
Ancestries Reported - German (%)
Ancestries Reported - Greek (%)
Ancestries Reported - Hungarian (%)
Ancestries Reported - Irish (%)
Ancestries Reported - Italian (%)
Ancestries Reported - Lithuanian (%)
Ancestries Reported - Norwegian (%)
Ancestries Reported - Polish (%)
Ancestries Reported - Portuguese (%)
Ancestries Reported - Russian (%)
Ancestries Reported - Scotch-Irish (%)
Ancestries Reported - Scottish (%)
Ancestries Reported - Slovak (%)
Ancestries Reported - Subsaharan African (%)
Ancestries Reported - Swedish (%)
Ancestries Reported - Swiss (%)
Ancestries Reported - Ukrainian (%)
Ancestries Reported - United States (%)
Ancestries Reported - Welsh (%)
Ancestries Reported - West Indian (%)
Ancestries Reported - Other (%)
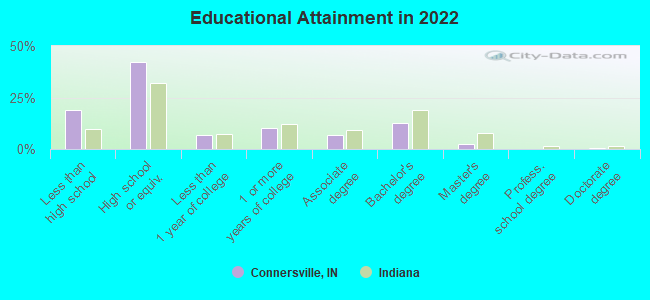
Educational Attainment - No schooling completed (%)
Educational Attainment - Less than high school (%)
Educational Attainment - High school or equivalent (%)
Educational Attainment - Less than 1 year of college (%)
Educational Attainment - 1 or more years of college (%)
Educational Attainment - Associate degree (%)
Educational Attainment - Bachelor's degree (%)
Educational Attainment - Master's degree (%)
Educational Attainment - Professional school degree (%)
Educational Attainment - Doctorate degree (%)
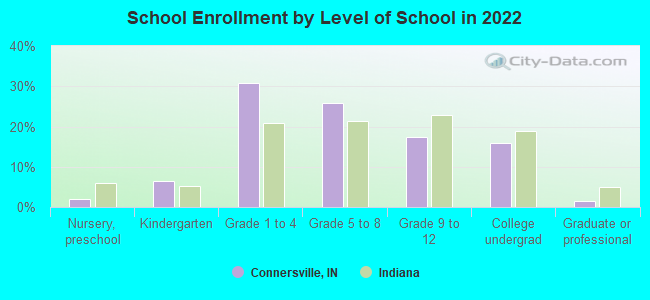
School Enrollment - Nursery, preschool (%)
School Enrollment - Kindergarten (%)
School Enrollment - Grade 1 to 4 (%)
School Enrollment - Grade 5 to 8 (%)
School Enrollment - Grade 9 to 12 (%)
School Enrollment - College undergrad (%)
School Enrollment - Graduate or professional (%)
School Enrollment - Not enrolled in school (%)
School enrollment - Public schools (%)
School enrollment - Private schools (%)
School enrollment - Not enrolled (%)
Median number of rooms in houses and condos
Median number of rooms in apartments
Housing units lacking complete plumbing facilities (%)
Housing units lacking complete kitchen facilities (%)
Density of houses
Urban houses (%)
Rural houses (%)
Households with people 60 years and over (%)
Households with people 65 years and over (%)
Households with people 75 years and over (%)
Households with one or more nonrelatives (%)
Households with no nonrelatives (%)
Population in households (%)
Family households (%)
Nonfamily households (%)
Population in families (%)
Family households with own children (%)
Median number of bedrooms in owner occupied houses
Mean number of bedrooms in owner occupied houses
Median number of bedrooms in renter occupied houses
Mean number of bedrooms in renter occupied houses
Median number of vehichles in owner occupied houses
Mean number of vehichles in owner occupied houses
Median number of vehichles in renter occupied houses
Mean number of vehichles in renter occupied houses
Mortgage status - with mortgage (%)
Mortgage status - with second mortgage (%)
Mortgage status - with home equity loan (%)
Mortgage status - with both second mortgage and home equity loan (%)
Mortgage status - without a mortgage (%)
Average family size
Average family size - White
Average family size - Black or African American
Average family size - Asian
Average family size - Hispanic or Latino
Average family size - American Indian and Alaska Native
Average family size - Multirace
Average family size - Other Race
Geographical mobility - Same house 1 year ago (%)
Geographical mobility - Moved within same county (%)
Geographical mobility - Moved from different county within same state (%)
Geographical mobility - Moved from different state (%)
Geographical mobility - Moved from abroad (%)
Place of birth - Born in state of residence (%)
Place of birth - Born in other state (%)
Place of birth - Native, outside of US (%)
Place of birth - Foreign born (%)
Housing units in structures - 1, detached (%)
Housing units in structures - 1, attached (%)
Housing units in structures - 2 (%)
Housing units in structures - 3 or 4 (%)
Housing units in structures - 5 to 9 (%)
Housing units in structures - 10 to 19 (%)
Housing units in structures - 20 to 49 (%)
Housing units in structures - 50 or more (%)
Housing units in structures - Mobile home (%)
Housing units in structures - Boat, RV, van, etc. (%)
House/condo owner moved in on average (years ago)
Renter moved in on average (years ago)
Year householder moved into unit - Moved in 1999 to March 2000 (%)
Year householder moved into unit - Moved in 1995 to 1998 (%)
Year householder moved into unit - Moved in 1990 to 1994 (%)
Year householder moved into unit - Moved in 1980 to 1989 (%)
Year householder moved into unit - Moved in 1970 to 1979 (%)
Year householder moved into unit - Moved in 1969 or earlier (%)
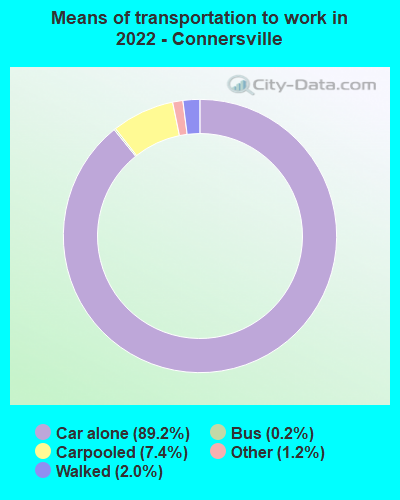
Means of transportation to work - Drove car alone (%)
Means of transportation to work - Carpooled (%)
Means of transportation to work - Public transportation (%)
Means of transportation to work - Bus or trolley bus (%)
Means of transportation to work - Streetcar or trolley car (%)
Means of transportation to work - Subway or elevated (%)
Means of transportation to work - Railroad (%)
Means of transportation to work - Ferryboat (%)
Means of transportation to work - Taxicab (%)
Means of transportation to work - Motorcycle (%)
Means of transportation to work - Bicycle (%)
Means of transportation to work - Walked (%)
Means of transportation to work - Other means (%)
Working at home (%)
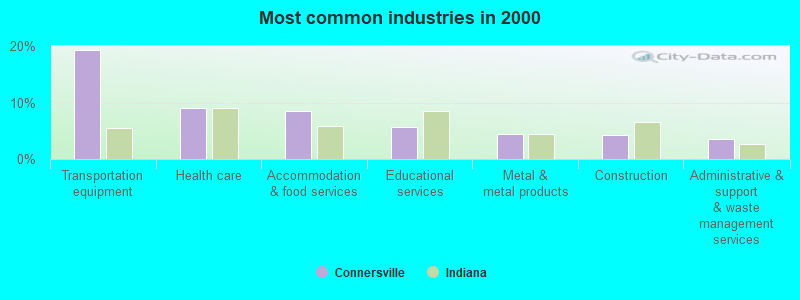
Industry diversity
Most Common Industries - Agriculture, forestry, fishing and hunting, and mining (%)
Most Common Industries - Agriculture, forestry, fishing and hunting (%)
Most Common Industries - Mining, quarrying, and oil and gas extraction (%)
Most Common Industries - Construction (%)
Most Common Industries - Manufacturing (%)
Most Common Industries - Wholesale trade (%)
Most Common Industries - Retail trade (%)
Most Common Industries - Transportation and warehousing, and utilities (%)
Most Common Industries - Transportation and warehousing (%)
Most Common Industries - Utilities (%)
Most Common Industries - Information (%)
Most Common Industries - Finance and insurance, and real estate and rental and leasing (%)
Most Common Industries - Finance and insurance (%)
Most Common Industries - Real estate and rental and leasing (%)
Most Common Industries - Professional, scientific, and management, and administrative and waste management services (%)
Most Common Industries - Professional, scientific, and technical services (%)
Most Common Industries - Management of companies and enterprises (%)
Most Common Industries - Administrative and support and waste management services (%)
Most Common Industries - Educational services, and health care and social assistance (%)
Most Common Industries - Educational services (%)
Most Common Industries - Health care and social assistance (%)
Most Common Industries - Arts, entertainment, and recreation, and accommodation and food services (%)
Most Common Industries - Arts, entertainment, and recreation (%)
Most Common Industries - Accommodation and food services (%)
Most Common Industries - Other services, except public administration (%)
Most Common Industries - Public administration (%)
Occupation diversity
Most Common Occupations - Management, business, science, and arts occupations (%)
Most Common Occupations - Management, business, and financial occupations (%)
Most Common Occupations - Management occupations (%)
Most Common Occupations - Business and financial operations occupations (%)
Most Common Occupations - Computer, engineering, and science occupations (%)
Most Common Occupations - Computer and mathematical occupations (%)
Most Common Occupations - Architecture and engineering occupations (%)
Most Common Occupations - Life, physical, and social science occupations (%)
Most Common Occupations - Education, legal, community service, arts, and media occupations (%)
Most Common Occupations - Community and social service occupations (%)
Most Common Occupations - Legal occupations (%)
Most Common Occupations - Education, training, and library occupations (%)
Most Common Occupations - Arts, design, entertainment, sports, and media occupations (%)
Most Common Occupations - Healthcare practitioners and technical occupations (%)
Most Common Occupations - Health diagnosing and treating practitioners and other technical occupations (%)
Most Common Occupations - Health technologists and technicians (%)
Most Common Occupations - Service occupations (%)
Most Common Occupations - Healthcare support occupations (%)
Most Common Occupations - Protective service occupations (%)
Most Common Occupations - Fire fighting and prevention, and other protective service workers including supervisors (%)
Most Common Occupations - Law enforcement workers including supervisors (%)
Most Common Occupations - Food preparation and serving related occupations (%)
Most Common Occupations - Building and grounds cleaning and maintenance occupations (%)
Most Common Occupations - Personal care and service occupations (%)
Most Common Occupations - Sales and office occupations (%)
Most Common Occupations - Sales and related occupations (%)
Most Common Occupations - Office and administrative support occupations (%)
Most Common Occupations - Natural resources, construction, and maintenance occupations (%)
Most Common Occupations - Farming, fishing, and forestry occupations (%)
Most Common Occupations - Construction and extraction occupations (%)
Most Common Occupations - Installation, maintenance, and repair occupations (%)
Most Common Occupations - Production, transportation, and material moving occupations (%)
Most Common Occupations - Production occupations (%)
Most Common Occupations - Transportation occupations (%)
Most Common Occupations - Material moving occupations (%)
People in Group quarters - Institutionalized population (%)
People in Group quarters - Correctional institutions (%)
People in Group quarters - Federal prisons and detention centers (%)
People in Group quarters - Halfway houses (%)
People in Group quarters - Local jails and other confinement facilities (including police lockups) (%)
People in Group quarters - Military disciplinary barracks (%)
People in Group quarters - State prisons (%)
People in Group quarters - Other types of correctional institutions (%)
People in Group quarters - Nursing homes (%)
People in Group quarters - Hospitals/wards, hospices, and schools for the handicapped (%)
People in Group quarters - Hospitals/wards and hospices for chronically ill (%)
People in Group quarters - Hospices or homes for chronically ill (%)
People in Group quarters - Military hospitals or wards for chronically ill (%)
People in Group quarters - Other hospitals or wards for chronically ill (%)
People in Group quarters - Hospitals or wards for drug/alcohol abuse (%)
People in Group quarters - Mental (Psychiatric) hospitals or wards (%)
People in Group quarters - Schools, hospitals, or wards for the mentally retarded (%)
People in Group quarters - Schools, hospitals, or wards for the physically handicapped (%)
People in Group quarters - Institutions for the deaf (%)
People in Group quarters - Institutions for the blind (%)
People in Group quarters - Orthopedic wards and institutions for the physically handicapped (%)
People in Group quarters - Wards in general hospitals for patients who have no usual home elsewhere (%)
People in Group quarters - Wards in military hospitals for patients who have no usual home elsewhere (%)
People in Group quarters - Juvenile institutions (%)
People in Group quarters - Long-term care (%)
People in Group quarters - Homes for abused, dependent, and neglected children (%)
People in Group quarters - Residential treatment centers for emotionally disturbed children (%)
People in Group quarters - Training schools for juvenile delinquents (%)
People in Group quarters - Short-term care, detention or diagnostic centers for delinquent children (%)
People in Group quarters - Type of juvenile institution unknown (%)
People in Group quarters - Noninstitutionalized population (%)
People in Group quarters - College dormitories (includes college quarters off campus) (%)
People in Group quarters - Military quarters (%)
People in Group quarters - On base (%)
People in Group quarters - Barracks, unaccompanied personnel housing (UPH), (Enlisted/Officer), ;and similar group living quarters for military personnel (%)
People in Group quarters - Transient quarters for temporary residents (%)
People in Group quarters - Military ships (%)
People in Group quarters - Group homes (%)
People in Group quarters - Homes or halfway houses for drug/alcohol abuse (%)
People in Group quarters - Homes for the mentally ill (%)
People in Group quarters - Homes for the mentally retarded (%)
People in Group quarters - Homes for the physically handicapped (%)
People in Group quarters - Other group homes (%)
People in Group quarters - Religious group quarters (%)
People in Group quarters - Dormitories (%)
People in Group quarters - Agriculture workers' dormitories on farms (%)
People in Group quarters - Job Corps and vocational training facilities (%)
People in Group quarters - Other workers' dormitories (%)
People in Group quarters - Crews of maritime vessels (%)
People in Group quarters - Other nonhousehold living situations (%)
People in Group quarters - Other noninstitutional group quarters (%)
Residents speaking English at home (%)
Residents speaking English at home - Born in the United States (%)
Residents speaking English at home - Native, born elsewhere (%)
Residents speaking English at home - Foreign born (%)
Residents speaking Spanish at home (%)
Residents speaking Spanish at home - Born in the United States (%)
Residents speaking Spanish at home - Native, born elsewhere (%)
Residents speaking Spanish at home - Foreign born (%)
Residents speaking other language at home (%)
Residents speaking other language at home - Born in the United States (%)
Residents speaking other language at home - Native, born elsewhere (%)
Residents speaking other language at home - Foreign born (%)
Class of Workers - Employee of private company (%)
Class of Workers - Self-employed in own incorporated business (%)
Class of Workers - Private not-for-profit wage and salary workers (%)
Class of Workers - Local government workers (%)
Class of Workers - State government workers (%)
Class of Workers - Federal government workers (%)
Class of Workers - Self-employed workers in own not incorporated business and Unpaid family workers (%)
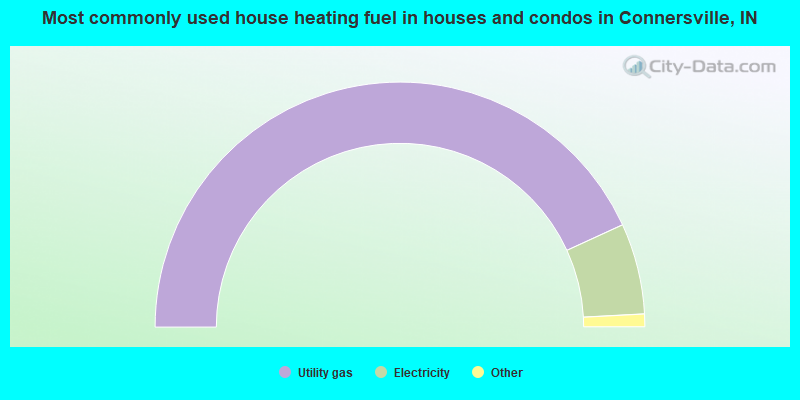
House heating fuel used in houses and condos - Utility gas (%)
House heating fuel used in houses and condos - Bottled, tank, or LP gas (%)
House heating fuel used in houses and condos - Electricity (%)
House heating fuel used in houses and condos - Fuel oil, kerosene, etc. (%)
House heating fuel used in houses and condos - Coal or coke (%)
House heating fuel used in houses and condos - Wood (%)
House heating fuel used in houses and condos - Solar energy (%)
House heating fuel used in houses and condos - Other fuel (%)
House heating fuel used in houses and condos - No fuel used (%)
House heating fuel used in apartments - Utility gas (%)
House heating fuel used in apartments - Bottled, tank, or LP gas (%)
House heating fuel used in apartments - Electricity (%)
House heating fuel used in apartments - Fuel oil, kerosene, etc. (%)
House heating fuel used in apartments - Coal or coke (%)
House heating fuel used in apartments - Wood (%)
House heating fuel used in apartments - Solar energy (%)
House heating fuel used in apartments - Other fuel (%)
House heating fuel used in apartments - No fuel used (%)
Armed forces status - In Armed Forces (%)
Armed forces status - Civilian (%)
Armed forces status - Civilian - Veteran (%)
Armed forces status - Civilian - Nonveteran (%)
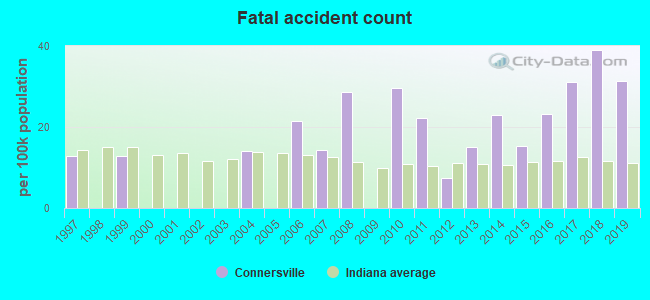
Fatal accidents locations in years 2005-2021
Fatal accidents locations in 2005
Fatal accidents locations in 2006
Fatal accidents locations in 2007
Fatal accidents locations in 2008
Fatal accidents locations in 2009
Fatal accidents locations in 2010
Fatal accidents locations in 2011
Fatal accidents locations in 2012
Fatal accidents locations in 2013
Fatal accidents locations in 2014
Fatal accidents locations in 2015
Fatal accidents locations in 2016
Fatal accidents locations in 2017
Fatal accidents locations in 2018
Fatal accidents locations in 2019
Fatal accidents locations in 2020
Fatal accidents locations in 2021
Alcohol use - People drinking some alcohol every month (%)
Alcohol use - People not drinking at all (%)
Alcohol use - Average days/month drinking alcohol
Alcohol use - Average drinks/week
Alcohol use - Average days/year people drink much
Audiometry - Average condition of hearing (%)
Audiometry - People that can hear a whisper from across a quiet room (%)
Audiometry - People that can hear normal voice from across a quiet room (%)
Audiometry - Ears ringing, roaring, buzzing (%)
Audiometry - Had a job exposure to loud noise (%)
Audiometry - Had off-work exposure to loud noise (%)
Blood Pressure & Cholesterol - Has high blood pressure (%)
Blood Pressure & Cholesterol - Checking blood pressure at home (%)
Blood Pressure & Cholesterol - Frequently checking blood cholesterol (%)
Blood Pressure & Cholesterol - Has high cholesterol level (%)
Consumer Behavior - Money monthly spent on food at supermarket/grocery store
Consumer Behavior - Money monthly spent on food at other stores
Consumer Behavior - Money monthly spent on eating out
Consumer Behavior - Money monthly spent on carryout/delivered foods
Consumer Behavior - Income spent on food at supermarket/grocery store (%)
Consumer Behavior - Income spent on food at other stores (%)
Consumer Behavior - Income spent on eating out (%)
Consumer Behavior - Income spent on carryout/delivered foods (%)
Current Health Status - General health condition (%)
Current Health Status - Blood donors (%)
Current Health Status - Has blood ever tested for HIV virus (%)
Current Health Status - Left-handed people (%)
Dermatology - People using sunscreen (%)
Diabetes - Diabetics (%)
Diabetes - Had a blood test for high blood sugar (%)
Diabetes - People taking insulin (%)
Diet Behavior & Nutrition - Diet health (%)
Diet Behavior & Nutrition - Milk product consumption (# of products/month)
Diet Behavior & Nutrition - Meals not home prepared (#/week)
Diet Behavior & Nutrition - Meals from fast food or pizza place (#/week)
Diet Behavior & Nutrition - Ready-to-eat foods (#/month)
Diet Behavior & Nutrition - Frozen meals/pizza (#/month)
Drug Use - People that ever used marijuana or hashish (%)
Drug Use - Ever used hard drugs (%)
Drug Use - Ever used any form of cocaine (%)
Drug Use - Ever used heroin (%)
Drug Use - Ever used methamphetamine (%)
Health Insurance - People covered by health insurance (%)
Kidney Conditions-Urology - Avg. # of times urinating at night
Medical Conditions - People with asthma (%)
Medical Conditions - People with anemia (%)
Medical Conditions - People with psoriasis (%)
Medical Conditions - People with overweight (%)
Medical Conditions - Elderly people having difficulties in thinking or remembering (%)
Medical Conditions - People who ever received blood transfusion (%)
Medical Conditions - People having trouble seeing even with glass/contacts (%)
Medical Conditions - People with arthritis (%)
Medical Conditions - People with gout (%)
Medical Conditions - People with congestive heart failure (%)
Medical Conditions - People with coronary heart disease (%)
Medical Conditions - People with angina pectoris (%)
Medical Conditions - People who ever had heart attack (%)
Medical Conditions - People who ever had stroke (%)
Medical Conditions - People with emphysema (%)
Medical Conditions - People with thyroid problem (%)
Medical Conditions - People with chronic bronchitis (%)
Medical Conditions - People with any liver condition (%)
Medical Conditions - People who ever had cancer or malignancy (%)
Mental Health - People who have little interest in doing things (%)
Mental Health - People feeling down, depressed, or hopeless (%)
Mental Health - People who have trouble sleeping or sleeping too much (%)
Mental Health - People feeling tired or having little energy (%)
Mental Health - People with poor appetite or overeating (%)
Mental Health - People feeling bad about themself (%)
Mental Health - People who have trouble concentrating on things (%)
Mental Health - People moving or speaking slowly or too fast (%)
Mental Health - People having thoughts they would be better off dead (%)
Oral Health - Average years since last visit a dentist
Oral Health - People embarrassed because of mouth (%)
Oral Health - People with gum disease (%)
Oral Health - General health of teeth and gums (%)
Oral Health - Average days a week using dental floss/device
Oral Health - Average days a week using mouthwash for dental problem
Oral Health - Average number of teeth
Pesticide Use - Households using pesticides to control insects (%)
Pesticide Use - Households using pesticides to kill weeds (%)
Physical Activity - People doing vigorous-intensity work activities (%)
Physical Activity - People doing moderate-intensity work activities (%)
Physical Activity - People walking or bicycling (%)
Physical Activity - People doing vigorous-intensity recreational activities (%)
Physical Activity - People doing moderate-intensity recreational activities (%)
Physical Activity - Average hours a day doing sedentary activities
Physical Activity - Average hours a day watching TV or videos
Physical Activity - Average hours a day using computer
Physical Functioning - People having limitations keeping them from working (%)
Physical Functioning - People limited in amount of work they can do (%)
Physical Functioning - People that need special equipment to walk (%)
Physical Functioning - People experiencing confusion/memory problems (%)
Physical Functioning - People requiring special healthcare equipment (%)
Prescription Medications - Average number of prescription medicines taking
Preventive Aspirin Use - Adults 40+ taking low-dose aspirin (%)
Reproductive Health - Vaginal deliveries (%)
Reproductive Health - Cesarean deliveries (%)
Reproductive Health - Deliveries resulted in a live birth (%)
Reproductive Health - Pregnancies resulted in a delivery (%)
Reproductive Health - Women breastfeeding newborns (%)
Reproductive Health - Women that had a hysterectomy (%)
Reproductive Health - Women that had both ovaries removed (%)
Reproductive Health - Women that have ever taken birth control pills (%)
Reproductive Health - Women taking birth control pills (%)
Reproductive Health - Women that have ever used Depo-Provera or injectables (%)
Reproductive Health - Women that have ever used female hormones (%)
Sexual Behavior - People 18+ that ever had sex (vaginal, anal, or oral) (%)
Sexual Behavior - Males 18+ that ever had vaginal sex with a woman (%)
Sexual Behavior - Males 18+ that ever performed oral sex on a woman (%)
Sexual Behavior - Males 18+ that ever had anal sex with a woman (%)
Sexual Behavior - Males 18+ that ever had any sex with a man (%)
Sexual Behavior - Females 18+ that ever had vaginal sex with a man (%)
Sexual Behavior - Females 18+ that ever performed oral sex on a man (%)
Sexual Behavior - Females 18+ that ever had anal sex with a man (%)
Sexual Behavior - Females 18+ that ever had any kind of sex with a woman (%)
Sexual Behavior - Average age people first had sex
Sexual Behavior - Average number of female sex partners in lifetime (males 18+)
Sexual Behavior - Average number of female vaginal sex partners in lifetime (males 18+)
Sexual Behavior - Average age people first performed oral sex on a woman (18+)
Sexual Behavior - Average number of woman performed oral sex on in lifetime (18+)
Sexual Behavior - Average number of male sex partners in lifetime (males 18+)
Sexual Behavior - Average number of male anal sex partners in lifetime (males 18+)
Sexual Behavior - Average age people first performed oral sex on a man (18+)
Sexual Behavior - Average number of male oral sex partners in lifetime (18+)
Sexual Behavior - People using protection when performing oral sex (%)
Sexual Behavior - Average number of times people have vaginal or anal sex a year
Sexual Behavior - People having sex without condom (%)
Sexual Behavior - Average number of male sex partners in lifetime (females 18+)
Sexual Behavior - Average number of male vaginal sex partners in lifetime (females 18+)
Sexual Behavior - Average number of female sex partners in lifetime (females 18+)
Sexual Behavior - Circumcised males 18+ (%)
Sleep Disorders - Average hours sleeping at night
Sleep Disorders - People that has trouble sleeping (%)
Smoking-Cigarette Use - People smoking cigarettes (%)
Taste & Smell - People 40+ having problems with smell (%)
Taste & Smell - People 40+ having problems with taste (%)
Taste & Smell - People 40+ that ever had wisdom teeth removed (%)
Taste & Smell - People 40+ that ever had tonsils teeth removed (%)
Taste & Smell - People 40+ that ever had a loss of consciousness because of a head injury (%)
Taste & Smell - People 40+ that ever had a broken nose or other serious injury to face or skull (%)
Taste & Smell - People 40+ that ever had two or more sinus infections (%)
Weight - Average height (inches)
Weight - Average weight (pounds)
Weight - Average BMI
Weight - People that are obese (%)
Weight - People that ever were obese (%)
Weight - People trying to lose weight (%)
According to our research of Indiana and other state lists, there were 4 registered sex offenders living in Connersville, Indiana as of April 25, 2024 . The ratio of all residents to sex offenders in Connersville is 3,322 to 1.The ratio of registered sex offenders to all residents in this city is much lower than the state average.
Officers per 1,000 residents here:
1.99Indiana average:
1.75
Latest news from Connersville, IN collected exclusively by city-data.com from local newspapers, TV, and radio stations
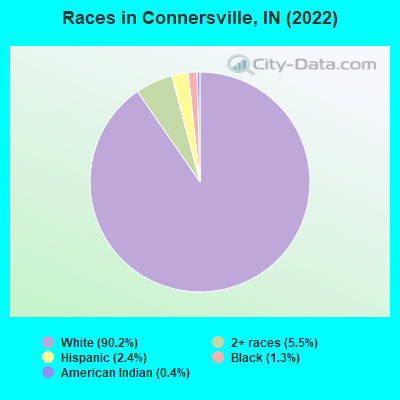
Ancestries: American (27.1%), German (20.5%), Irish (10.0%), English (8.7%), European (2.6%), Italian (1.5%).
Current Local Time:
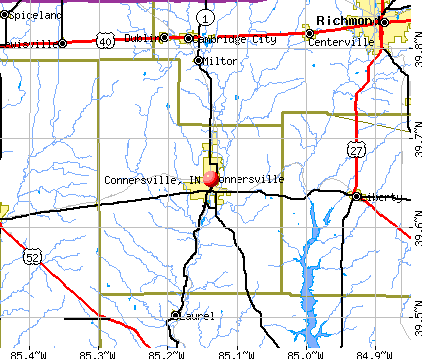
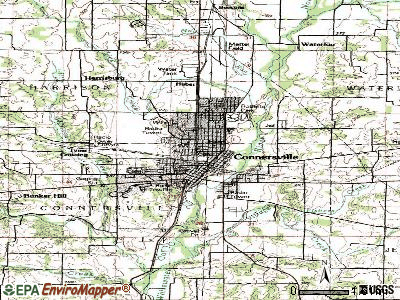
Land area: 8.13 square miles.
Population density: 1,634 people per square mile (low).
272 residents are foreign born (1.3% Latin America , 0.3% Africa ).
This city:
2.0%Indiana:
5.6%
Median real estate property taxes paid for housing units with mortgages in 2022: $783 (0.8%)Median real estate property taxes paid for housing units with no mortgage in 2022: $662 (0.7%)
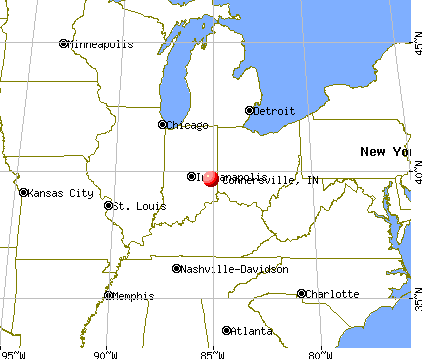
Nearest city with pop. 50,000+: Hamilton, OH
Nearest city with pop. 200,000+: Cincinnati, OH
Nearest city with pop. 1,000,000+: Chicago, IL
Nearest cities:
Mount Auburn, IN (3.4 miles),
Latitude: 39.65 N, Longitude: 85.14 W
Daytime population change due to commuting: +699 (+5.2%)Workers who live and work in this city: 3,308 (58.5%)
Unemployment in December 2023:
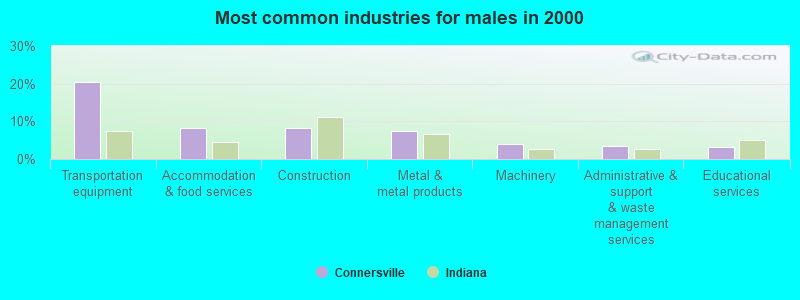
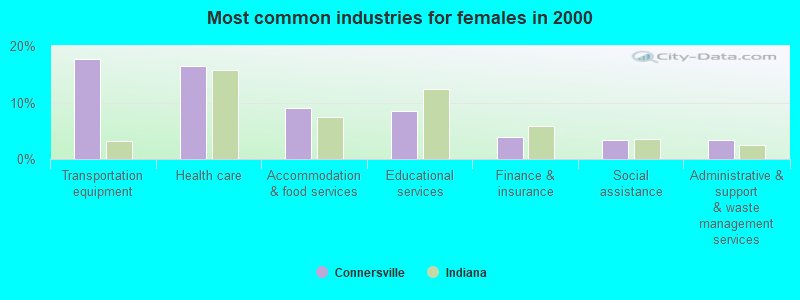
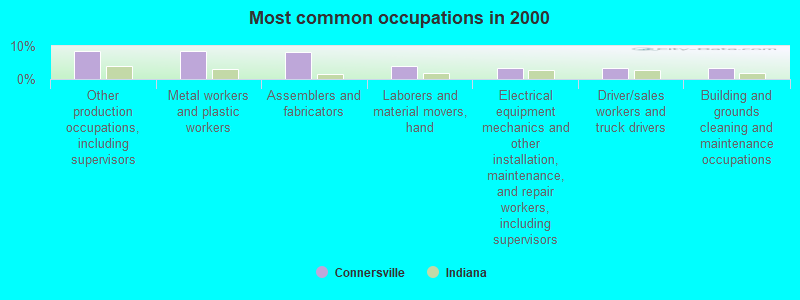
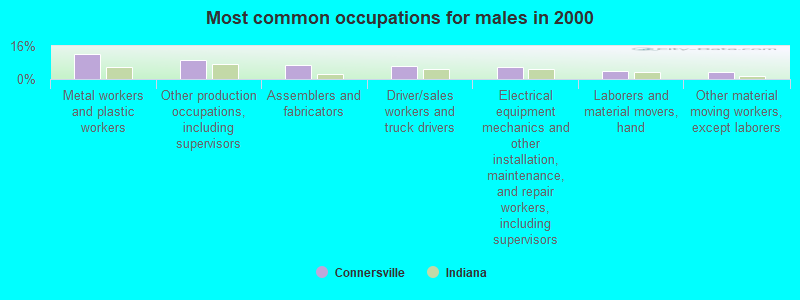
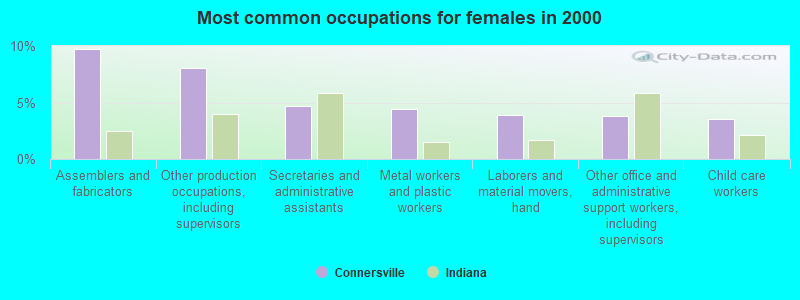
Most common occupations in Connersville, IN (%)
Both Males Females
Other production occupations, including supervisors (8.6%)
Metal workers and plastic workers (8.6%)
Assemblers and fabricators (8.3%)
Laborers and material movers, hand (4.0%)
Electrical equipment mechanics and other installation, maintenance, and repair workers, including supervisors (3.5%)
Driver/sales workers and truck drivers (3.3%)
Building and grounds cleaning and maintenance occupations (3.2%)
Metal workers and plastic workers (12.3%)
Other production occupations, including supervisors (9.1%)
Assemblers and fabricators (7.0%)
Driver/sales workers and truck drivers (6.1%)
Electrical equipment mechanics and other installation, maintenance, and repair workers, including supervisors (5.7%)
Laborers and material movers, hand (4.1%)
Other material moving workers, except laborers (3.5%)
Assemblers and fabricators (9.7%)
Other production occupations, including supervisors (8.0%)
Secretaries and administrative assistants (4.7%)
Metal workers and plastic workers (4.4%)
Laborers and material movers, hand (3.9%)
Other office and administrative support workers, including supervisors (3.8%)
Child care workers (3.5%)
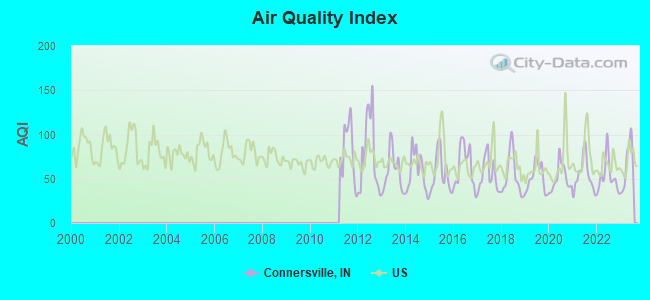
Air pollution and air quality trends(lower is better)
AQI Ozone
Tornado activity:
Connersville-area historical tornado activity is slightly above Indiana state average. It is 109% greater than the overall U.S. average.
On 4/3/1974, a category F4 (max. wind speeds 207-260 mph) tornado 12.9 miles away from the Connersville city center killed 4 people and injured 17 people and caused between $5,000,000 and $50,000,000 in damages.
On 7/9/1980, a category F4 tornado 15.5 miles away from the city center killed 2 people and injured 25 people and caused between $500,000 and $5,000,000 in damages.
Earthquake activity:
Connersville-area historical earthquake activity is significantly above Indiana state average. It is 53% greater than the overall U.S. average. On 7/27/1980 at 18:52:21, a magnitude 5.2 (5.1 MB, 4.7 MS, 5.0 UK, 5.2 UK, Class: Moderate, Intensity: VI - VII) earthquake occurred 119.1 miles away from the city center On 4/18/2008 at 09:36:59, a magnitude 5.4 (5.1 MB, 4.8 MS, 5.4 MW, 5.2 MW) earthquake occurred 169.4 miles away from the city center On 4/18/2008 at 09:36:59, a magnitude 5.2 (5.2 MW, Depth: 8.9 mi) earthquake occurred 169.4 miles away from the city center On 6/10/1987 at 23:48:54, a magnitude 5.1 (4.9 MB, 4.4 MS, 4.6 MS, 5.1 LG) earthquake occurred 158.0 miles away from the city center On 7/12/1986 at 08:19:37, a magnitude 4.5 (4.5 MB, Class: Light, Intensity: IV - V) earthquake occurred 73.3 miles away from the city center On 6/18/2002 at 17:37:15, a magnitude 5.0 (4.3 MB, 4.6 MW, 5.0 LG) earthquake occurred 183.2 miles away from Connersville center Magnitude types: regional Lg-wave magnitude (LG), body-wave magnitude (MB), surface-wave magnitude (MS), moment magnitude (MW) Natural disasters: The number of natural disasters in Fayette County (13) is near the US average (15).Major Disasters (Presidential) Declared: 8Emergencies Declared: 4Floods: 5, Storms: 5, Tornadoes: 2, Winter Storms: 2, Blizzard: 1, Hurricane: 1, Ice Storm: 1, Snow: 1, Snowstorm: 1, Other: 1 (Note: some incidents may be assigned to more than one category). Hospitals in Connersville: FAYETTE REGIONAL HEALTH SYSTEM (Proprietary, provides emergency services, 1941 VIRGINIA AVE) RESIDENTIAL CRF INC (2846 W SR 44) RESIDENTIAL CRF INC (100 GRAY ROAD) RESIDENTIAL CRF INC (311 N DORSETT DR) RESIDENTIAL CRF INC (405 S GRAY RD) RESIDENTIAL CRF INC (1725 W COUNTRY CLUB RD) RESIDENTIAL CRF INC (324 W 3RD STREET) Nursing Homes in Connersville: CAROLETON MANOR (2500 IOWA AVE) CAROLETON MANOR (2500 IOWA AVENUE) CONNERSVILLE NURSING HOME (2600 NORTH GRAND AVENUE) HERITAGE HOUSE REHABILITATION AND HEALTHCARE CENTER (281 S CR 200 E) HICKORY CREEK AT CONNERSVILLE (2600 N GRAND AVE) LINCOLN CENTERS FOR REHAB AND (1039 EAST 5TH STREET) LINCOLN CENTERS FOR REHABILITATION AND HEALTHCARE (1029 E 5TH ST) LINCOLN MANOR NURSING CENTER (1029 EAST 5TH STREET) TRANSITIONAL CARE CENTER OF FA (1941 VIRGINIA AVE) Dialysis Facilities in Connersville: FMC - CONNERSVILLE (6049 INDUSTRIAL AVENUE, NORTH) Home Health Centers in Connersville: FAYETTE REGIONAL HEALTH SYSTEM HOME HEALTH (420 W 24TH ST) SYMPHONY HOME CARE SERVICES SERV # 100 (3039-3041 THIRTY COURT) Amtrak station: CONNERSVILLE (1012 EASTERN AVE.)
.
Services: partially wheelchair accessible, public payphones, free short-term parking, free long-term parking, call for taxi service.
Colleges/universities with over 2000 students nearest to Connersville:
Indiana University-East (about 20 miles; Richmond, IN ; Full-time enrollment: 2,867)
Miami University-Oxford (about 24 miles; Oxford, OH ; FT enrollment: 17,670)
Miami University-Hamilton (about 37 miles; Hamilton, OH ; FT enrollment: 2,906)
Ball State University (about 41 miles; Muncie, IN ; FT enrollment: 20,254)
Anderson University (about 43 miles; Anderson, IN ; FT enrollment: 2,378)
College of Mount St Joseph (about 47 miles; Cincinnati, OH ; FT enrollment: 2,073)
Cincinnati State Technical and Community College (about 48 miles; Cincinnati, OH ; FT enrollment: 8,757)
Public high schools in Connersville:
Public elementary/middle schools in Connersville: CONNERSVILLE MIDDLE SCHOOL Students: 679, Location: 1900 GRAND AVE, Grades: 7-8)MAPLEWOOD ELEMENTARY SCHOOL Students: 391, Location: 1800 EASTERN AVE, Grades: KG-6)FRAZEE ELEMENTARY SCHOOL Students: 381, Location: 600 W 3RD ST, Grades: PK-6)FAYETTE CENTRAL ELEMENTARY Students: 364, Location: 2928 N CR 225 W, Grades: PK-6)GRANDVIEW ELEMENTARY SCHOOL Students: 359, Location: 2620 IOWA AVE, Grades: PK-6)EASTVIEW ELEMENTARY SCHOOL Students: 336, Location: 401 S FOUNTAIN ST, Grades: PK-6)EVERTON ELEMENTARY SCHOOL Students: 237, Location: 2440 E EVERTON RD, Grades: KG-6)Private elementary/middle school in Connersville: ST GABRIEL ELEMENTARY SCHOOL Students: 146, Location: 224 W 9TH ST, Grades: PK-6)
See full list of schools located in Connersville Library in Connersville: FAYETTE COUNTY PUBLIC LIBRARY Operating income: $834,618; Location: 828 GRAND AVENUE; 98,667 books ; 2,981 audio materials ; 5,457 video materials ; 5 local licensed databases ; 37 state licensed databases ; 125 print serial subscriptions )
User-submitted facts and corrections:
1972 and 1983 Indiana State High School Basketball Champs Mr. Phil Cox, 1972 recipient of "Indiana Mr. Basketball", Award as best ball player in the state Home of the Cord Automobile Birthplace of the "Roots Blower" Home of Calib Mills, Cabinet memeber for Abe Lincoln 1st High School Band in America
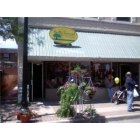
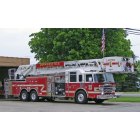
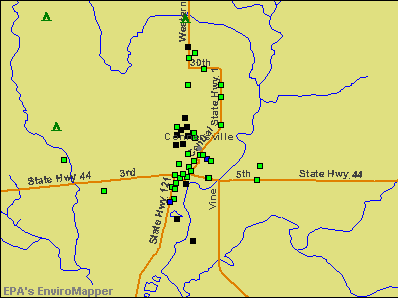
Notable locations in Connersville: (A) , Connersville Fire Department Station 3 (B) , Connersville Fire Department Station 1 Headquarters (C) , Clark's Greenhouses (D) . Display/hide their locations on the map
Cemeteries: (1) , Parker Cemetery (2) , Shrine of Memories Mausoleum (3) , Connersville City Cemetery (4) , Dale Cemetery (5) . Display/hide their locations on the map
Creek: (A) . Display/hide its location on the map
Park in Connersville: (1) . Display/hide its location on the map
Tourist attractions:
Hotels:
Courts:
Birthplace of: Matt Howard (basketball) - Professional basketball player, Tom Gegax - Philanthropist, John W. Griffin (archaeologist) - Archaelogist, April McDivitt - WNBA player (Minnesota Lynx, born : Dec 9, 1980), Scott Halberstadt - Film actor.
Fayette County has a predicted average indoor radon screening level greater than 4 pCi/L (pico curies per liter) - Highest Potential Drinking water stations with addresses in Connersville that have no violations reported:
CONNERSVILLE UTILITIES (Population served: 13,480, Primary Water Source Type: Groundwater)
EVERTON WATER CORPORATION (Population served: 2,500, Primary Water Source Type: Groundwater)
QUAKERTOWN MARINA, INC. (Population served: 100, Primary Water Source Type: Groundwater)
ORANGE ELEMENTARY SCHOOL (STORAGE) (Population served: 25, Primary Water Source Type: Groundwater)
Average household size: This city:
2.4 peopleIndiana:
2.5 people
Percentage of family households: This city:
62.8%Whole state:
66.9%
Percentage of households with unmarried partners: This city:
8.1%Whole state:
6.9%
Likely homosexual households (counted as self-reported same-sex unmarried-partner households)
Lesbian couples: 0.2% of all households Gay men: 0.1% of all households
People in group quarters in Connersville in 2010:
196 people in nursing facilities/skilled-nursing facilities
33 people in group homes intended for adults
2 people in group homes for juveniles (non-correctional)
People in group quarters in Connersville in 2000:
302 people in nursing homes
113 people in local jails and other confinement facilities (including police lockups)
26 people in homes for the mentally retarded
19 people in mental (psychiatric) hospitals or wards
11 people in other group homes
9 people in other noninstitutional group quarters
Banks with branches in Connersville (2011 data):
U.S. Bank National Association: Midtown Branch at 536 Central Avenue, branch established on 1902/04/02; North Branch at 720 West 30th Street, branch established on 1960/07/08. Info updated 2012/01/30: Bank assets: $330,470.8 mil, Deposits: $236,091.5 mil, headquarters in Cincinnati, OH, positive income , 3121 total offices , Holding Company: U.S. Bancorp
First Merchants Bank National Association: Connersville North at 3030 Western Avenue, branch established on 1999/06/11; Connersville Banking Center Branch at 832 N Central Ave, branch established on 1990/03/29. Info updated 2012/02/13: Bank assets: $4,154.9 mil, Deposits: $3,154.7 mil, headquarters in Muncie, IN, positive income , Commercial Lending Specialization, 89 total offices , Holding Company: First Merchants Corporation
Union Savings and Loan Association: Connersville Branch at 500 West 30th Street, branch established on 2000/06/01; Union Savings And Loan Association at 730 Central Avenue, branch established on 1937/08/01. Info updated 2011/07/21: Bank assets: $128.3 mil, Deposits: $112.0 mil, local headquarters , positive income , Mortgage Lending Specialization, 3 total offices
MainSource Bank: Connersville Branch at 206 W 30th Street, branch established on 1996/09/12. Info updated 2009/12/09: Bank assets: $2,729.1 mil, Deposits: $2,167.0 mil, headquarters in Greensburg, IN, positive income , 86 total offices , Holding Company: Mainsource Financial Group, Inc.
Fifth Third Bank: Connersville Banking Center at 120 W 5th Street, branch established on 1960/07/08. Info updated 2009/10/05: Bank assets: $114,540.4 mil, Deposits: $89,689.1 mil, headquarters in Cincinnati, OH, positive income , Commercial Lending Specialization, 1378 total offices , Holding Company: Fifth Third Bancorp
First Financial Bank, National Association: Connersville Branch at 630 Central Avenue, branch established on 1887/01/01. Info updated 2009/09/21: Bank assets: $6,663.4 mil, Deposits: $5,754.9 mil, headquarters in Hamilton, OH, positive income , Commercial Lending Specialization, 101 total offices , Holding Company: First Financial Bancorp
FCN Bank, National Association: Everton Branch at 5444 South State Road 1, branch established on 1966/12/17. Info updated 2006/11/03: Bank assets: $375.4 mil, Deposits: $324.8 mil, headquarters in Brookville, IN, positive income , Mortgage Lending Specialization, 5 total offices , Holding Company: Fcn Banc Corp.
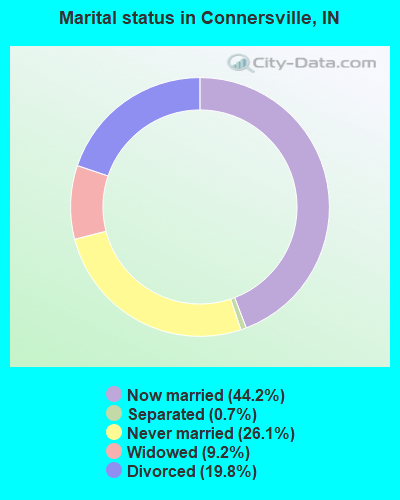
For population 15 years and over in Connersville:
Never married: 26.1%Now married: 44.2%Separated: 0.7%Widowed: 9.2%Divorced: 19.8% For population 25 years and over in Connersville:
High school or higher: 80.7%Bachelor's degree or higher: 14.2%Graduate or professional degree: 2.5%Unemployed: 7.0%Mean travel time to work (commute): 22.6 minutes
Education Gini index (Inequality in education) Here:
11.3Indiana average:
11.3
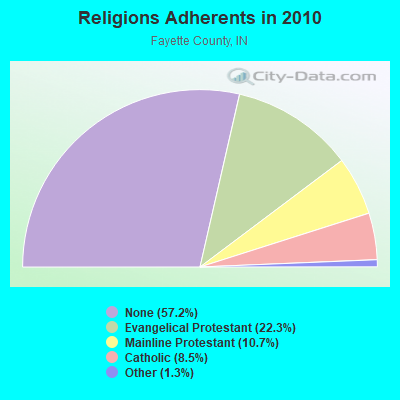
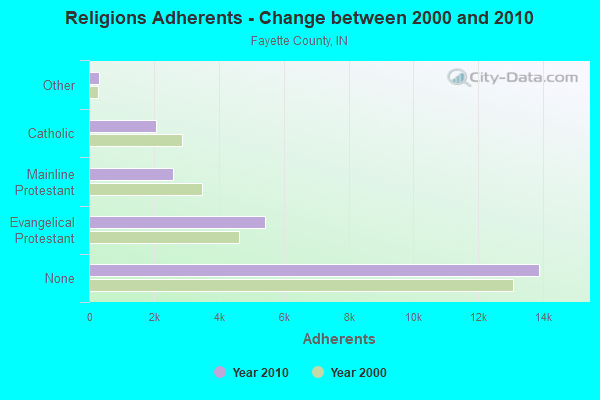
Religion statistics for Connersville, IN (based on Fayette County data)
Religion Adherents Congregations Evangelical Protestant 5,421 33 Mainline Protestant 2,589 14 Catholic 2,060 1 Other 323 3 None 13,884 -
Source: Clifford Grammich, Kirk Hadaway, Richard Houseal, Dale E.Jones, Alexei Krindatch, Richie Stanley and Richard H.Taylor. 2012. 2010 U.S.Religion Census: Religious Congregations & Membership Study. Association of Statisticians of American Religious Bodies. Jones, Dale E., et al. 2002. Congregations and Membership in the United States 2000. Nashville, TN: Glenmary Research Center. Graphs represent county-level data
Food Environment Statistics: Number of grocery stores : 5This county :
2.06 / 10,000 pop.Indiana :
1.73 / 10,000 pop.
Number of convenience stores (no gas) : 1Fayette County :
0.41 / 10,000 pop.Indiana :
0.50 / 10,000 pop.
Number of convenience stores (with gas) : 8Fayette County :
3.30 / 10,000 pop.Indiana :
3.57 / 10,000 pop.
Number of full-service restaurants : 11Fayette County :
4.54 / 10,000 pop.Indiana :
6.78 / 10,000 pop.
Adult diabetes rate : Fayette County :
9.8%Indiana :
9.2%
Adult obesity rate : Fayette County :
28.8%Indiana :
29.0%
Low-income preschool obesity rate : Fayette County :
13.3%State :
14.3%
Health and Nutrition:
Average overall health of teeth and gums : Connersville:
44.7%Indiana:
46.2%
People feeling badly about themselves : This city:
21.6%Indiana:
21.3%
People not drinking alcohol at all : This city:
10.9%Indiana:
10.6%
Average hours sleeping at night : Connersville:
6.9Indiana:
6.8
General health condition : Connersville:
55.1%Indiana:
56.1%
Average condition of hearing : More about Health and Nutrition of Connersville, IN Residents
Local government employment and payroll (March 2022)
Function
Full-time employees
Monthly full-time payroll
Average yearly full-time wage
Part-time employees
Monthly part-time payroll
Firefighters
29 $132,764 $54,937 0 $0 Police Protection - Officers
26 $103,974 $47,988 0 $0 Other and Unallocable
22 $109,809 $59,896 3 $4,854 Water Supply
19 $79,632 $50,294 7 $1,154 Sewerage
10 $42,556 $51,067 0 $0 Streets and Highways
9 $27,291 $36,388 0 $0 Solid Waste Management
8 $28,088 $42,132 3 $3,906 Parks and Recreation
6 $18,872 $37,744 4 $3,494 Financial Administration
3 $9,745 $38,980 1 $520 Other Government Administration
2 $7,225 $43,350 13 $6,921 Police - Other
2 $6,293 $37,758 3 $1,535 Airports
0 $0 5 $178 Judicial and Legal
0 $0 3 $1,847
Totals for Government
136 $566,250 $49,963 42 $24,410
Connersville government finances - Expenditure in 2021 (per resident):
Construction - Air Transportation: $219,000 ($16.48)
General - Other: $14,000 ($1.05)Current Operations - General - Other: $3,482,000 ($261.96)
Local Fire Protection: $3,110,000 ($233.98)Police Protection: $2,931,000 ($220.51)Health - Other: $2,548,000 ($191.69)Sewerage: $1,982,000 ($149.11)Water Utilities: $1,459,000 ($109.77)Solid Waste Management: $1,220,000 ($91.78)Regular Highways: $1,118,000 ($84.11)Parks and Recreation: $1,063,000 ($79.97)Central Staff Services: $944,000 ($71.02)General Public Buildings: $215,000 ($16.18)Financial Administration: $206,000 ($15.50)Miscellaneous Commercial Activities - Other: $190,000 ($14.29)Air Transportation: $188,000 ($14.14)Judicial and Legal Services: $160,000 ($12.04)Elementary and Secondary Education: $15,000 ($1.13)General - Interest on Debt: $287,000 ($21.59)
Other Capital Outlay - Police Protection: $146,000 ($10.98)
Local Fire Protection: $131,000 ($9.86)Regular Highways: $108,000 ($8.13)Sewerage: $55,000 ($4.14)Solid Waste Management: $49,000 ($3.69)Parks and Recreation: $19,000 ($1.43)Miscellaneous Commercial Activities - Other: $15,000 ($1.13)General - Other: $3,000 ($0.23)
Connersville government finances - Revenue in 2021 (per resident):
Charges - Sewerage: $7,018,000 ($527.99)
Other: $1,178,000 ($88.62)Solid Waste Management: $802,000 ($60.34)Parks and Recreation: $230,000 ($17.30)Air Transportation: $62,000 ($4.66)Local Intergovernmental - Highways: $99,000 ($7.45)
Miscellaneous - Donations From Private Sources: $214,000 ($16.10)
General Revenue - Other: $197,000 ($14.82)Interest Earnings: $173,000 ($13.02)Rents: $99,000 ($7.45)Sale of Property: $22,000 ($1.66)Fines and Forfeits: $2,000 ($0.15)Revenue - Water Utilities: $3,583,000 ($269.56)
State Intergovernmental - Other: $3,543,000 ($266.55)
General Local Government Support: $1,331,000 ($100.14)Highways: $907,000 ($68.24)Sewerage: $661,000 ($49.73)Tax - Property: $7,064,000 ($531.45)
Connersville government finances - Debt in 2021 (per resident):
Long Term Debt - Outstanding Unspecified Public Purpose: $10,838,000 ($815.38)
Beginning Outstanding - Unspecified Public Purpose: $10,838,000 ($815.38)
Connersville government finances - Cash and Securities in 2021 (per resident):
Bond Funds - Cash and Securities: $848,000 ($63.80)
Other Funds - Cash and Securities: $21,436,000 ($1612.70)
Businesses in Connersville, IN
Name Count Name Count
Advance Auto Parts 1 Papa John's Pizza 1 Arby's 1 Penske 1 AutoZone 1 Pizza Hut 1 Burger King 1 Quiznos 1 Dairy Queen 1 RadioShack 1 Fashion Bug 1 Sears 1 Ford 1 Subway 2 H&R Block 1 Taco Bell 1 JCPenney 1 U-Haul 1 Kroger 1 UPS 2 Little Caesars Pizza 1 Vans 1 Long John Silver's 1 Walmart 1 MasterBrand Cabinets 1 Wendy's 1 McDonald's 1
Strongest AM radio stations in Connersville:
WCNB (1580 AM; 0 kW; CONNERSVILLE, IN; Owner: RODGERS BROADCASTING CORP.)
WLW (700 AM; 50 kW; CINCINNATI, OH; Owner: JACOR BROADCASTING CORPORATION)
WSAI (1530 AM; 50 kW; CINCINNATI, OH; Owner: JACOR BROADCASTING CORPORATION)
WIBC (1070 AM; 50 kW; INDIANAPOLIS, IN; Owner: EMMIS RADIO LICENSE CORPORATION)
WHAS (840 AM; 50 kW; LOUISVILLE, KY; Owner: CLEAR CHANNEL BROADCASTING LICENSES, INC.)
WTVN (610 AM; 50 kW; COLUMBUS, OH; Owner: CITICASTERS LICENSES, L.P.)
WOWO (1190 AM; 50 kW; FORT WAYNE, IN; Owner: PATHFINDER COMMUNICATIONS CORPORATION)
WKBV (1490 AM; 1 kW; RICHMOND, IN; Owner: RODGERS BROADCASTING CORP.)
WKRC (550 AM; 5 kW; CINCINNATI, OH; Owner: JACOR BROADCASTING CORPORATION)
WCNW (1560 AM; daytime; 5 kW; FAIRFIELD, OH)
WCKY (1360 AM; 5 kW; CINCINNATI, OH; Owner: JACOR BROADCASTING CORPORATION)
WRFD (880 AM; daytime; 23 kW; COLUMBUS-WORTHINGTON, OH; Owner: SALEM MEDIA OF OHIO, INC.)
WONE (980 AM; 5 kW; DAYTON, OH; Owner: CITICASTERS LICENSES, L.P.)
Strongest FM radio stations in Connersville:
WIFE (100.3 FM; CONNERSVILLE, IN; Owner: RODGERS BROADCASTING CORPORATION)
WFMG (101.3 FM; RICHMOND, IN; Owner: RODGERS BROADCASTING CORP.)
WKWH-FM (94.3 FM; RUSHVILLE, IN; Owner: RSE BROADCASTING, LLC)
WMUB (88.5 FM; OXFORD, OH; Owner: THE PRES.& TRUSTEES OF MIAMI UNIV.)
WQLK (96.1 FM; RICHMOND, IN; Owner: BREWER BROADCASTING CORP.)
WMOJ (94.9 FM; FAIRFIELD, OH; Owner: WVAE LICO, INC.)
WGRR (103.5 FM; HAMILTON, OH; Owner: INFINITY RADIO OPERATIONS INC.)
WMDH-FM (102.5 FM; NEW CASTLE, IN; Owner: CITADEL BROADCASTING COMPANY)
WOXY (97.7 FM; OXFORD, OH; Owner: BALOGH BROADCASTING COMPANY, INC.)
WBSH (91.1 FM; HAGERSTOWN, IN; Owner: BALL STATE UNIVERSITY)
TV broadcast stations around Connersville:
WPTO (Channel 14; OXFORD, OH; Owner: GREATER DAYTON PUBLIC TELEVISION, INC.)
WKOI (Channel 43; RICHMOND, IN; Owner: TRINITY BROADCASTING OF INDIANA, INC.)
WKEF (Channel 22; DAYTON, OH; Owner: WKEF LICENSEE L.P.)
WRGT-TV (Channel 45; DAYTON, OH; Owner: WRGT LICENSEE, LLC)
WPTD (Channel 16; DAYTON, OH; Owner: GREATER DAYTON PUBLIC TV, INC.)
National Bridge Inventory (NBI) Statistics 59 Number of bridges558ft / 170m Total length $4,175,000 Total costs79,542 Total average daily traffic6,502 Total average daily truck traffic124,580 Total future (year 2030) average daily traffic
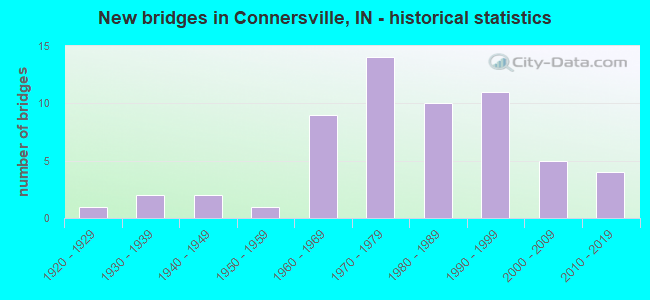
New bridges - historical statistics
1 1920-1929 2 1930-1939 2 1940-1949 1 1950-1959 9 1960-1969 14 1970-1979 10 1980-1989 11 1990-1999 5 2000-2009 4 2010-2019
See full National Bridge Inventory statistics for Connersville, IN
Most common first names in Connersville, IN among deceased individuals Name Count Lived (average)
Mary 235 79.6 years William 214 74.3 years John 193 73.6 years Robert 179 71.4 years Charles 162 74.7 years James 152 72.4 years George 96 74.3 years Helen 95 77.4 years Paul 79 71.3 years Dorothy 76 77.9 years
Most common last names in Connersville, IN among deceased individuals Last name Count Lived (average)
Smith 95 76.9 years Miller 60 77.8 years Johnson 58 78.9 years Brown 57 76.3 years Jones 55 74.1 years Gabbard 48 72.3 years Baker 47 78.2 years Isaacs 47 67.3 years Moore 46 76.7 years Harrison 44 71.7 years
Connersville compared to Indiana state average:
Median household income below state average. Median house value below state average. Unemployed percentage below state average. Black race population percentage significantly below state average. Hispanic race population percentage significantly below state average. Foreign-born population percentage significantly below state average. House age above state average. Connersville on our top lists :
#59 on the list of "Top 101 cities with the highest number of thefts per 100,000 residents, excludes tourist destinations and others with a lot of outsiders visiting based on city industries data (population 5,000+)"
#79 on the list of "Top 101 cities with the largest percentage of divorced people (15+ years)(population 5,000+)"
#91 on the list of "Top 101 cities with largest percentage of females in industries: health care and social assistance (population 5,000+)"
#92 on the list of "Top 101 cities with the largest percentage population decrease from 2000 (population 5,000+)"
#97 on the list of "Top 101 cities with the most full-time firefighters per 1000 residents (population 5,000+)"
Top Patent Applicants
Daniel J. Parker (9)
Jason M. Crawford (7)
Michael S. Brock (5)
Louis T. Frank (4)
Kimball Rustin Scarr (4)
Gary L. Dunkle (3)
Kevin L Young (3)
Gary Lee Dunkle (2)
Cory Alfred Nation (2)
Jimmy D. Gamble (2)
Total of 47 patent applications in 2008-2024.


 Recent articles from our blog. Our writers, many of them Ph.D. graduates or candidates, create easy-to-read articles on a wide variety of topics.


 (35.4 miles
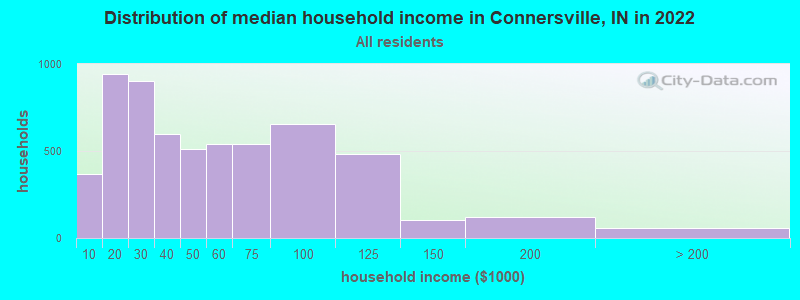

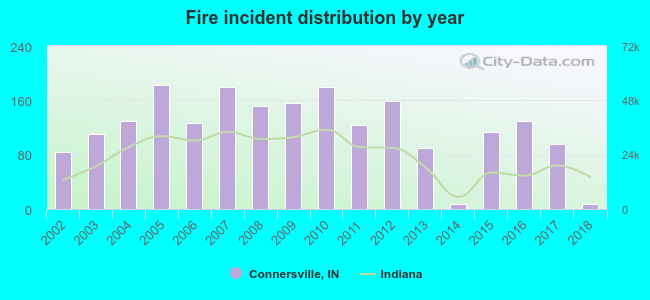 According to the data from the years 2002 - 2018 the average number of fires per year is 119. The highest number of fires - 182 took place in 2005, and the least - 8 in 2014. The data has a declining trend.
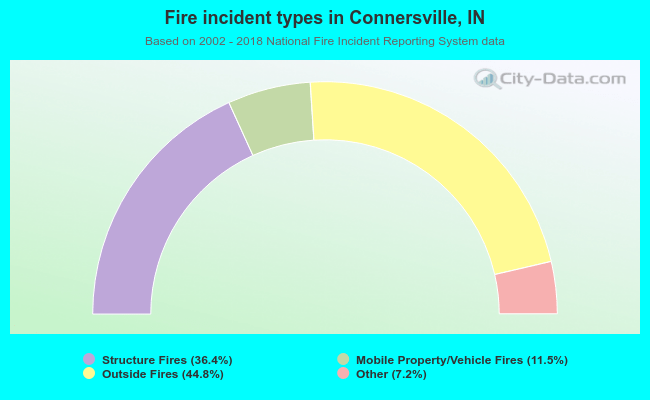 When looking into fire subcategories, the most reports belonged to: Outside Fires (44.8%), and Structure Fires (36.4%).