Dundalk, Maryland Submit your own pictures of this place and show them to the world
OSM Map
General Map
Google Map
MSN Map
OSM Map
General Map
Google Map
MSN Map
OSM Map
General Map
Google Map
MSN Map
OSM Map
General Map
Google Map
MSN Map
Please wait while loading the map...
Population in 2022: 66,537 (100% urban, 0% rural). Population change since 2000: +6.8%Males: 33,316 Females: 33,221
March 2022 cost of living index in Dundalk: 106.2 (more than average, U.S. average is 100) Percentage of residents living in poverty in 2022: 25.0%for White Non-Hispanic residents , 31.4% for Black residents , 32.6% for Hispanic or Latino residents , 15.6% for American Indian residents , 46.8% for other race residents , 28.5% for two or more races residents )
Profiles of local businesses
Business Search - 14 Million verified businesses
Data:
Median household income ($)
Median household income (% change since 2000)
Household income diversity
Ratio of average income to average house value (%)
Ratio of average income to average rent
Median household income ($) - White
Median household income ($) - Black or African American
Median household income ($) - Asian
Median household income ($) - Hispanic or Latino
Median household income ($) - American Indian and Alaska Native
Median household income ($) - Multirace
Median household income ($) - Other Race
Median household income for houses/condos with a mortgage ($)
Median household income for apartments without a mortgage ($)
Races - White alone (%)
Races - White alone (% change since 2000)
Races - Black alone (%)
Races - Black alone (% change since 2000)
Races - American Indian alone (%)
Races - American Indian alone (% change since 2000)
Races - Asian alone (%)
Races - Asian alone (% change since 2000)
Races - Hispanic (%)
Races - Hispanic (% change since 2000)
Races - Native Hawaiian and Other Pacific Islander alone (%)
Races - Native Hawaiian and Other Pacific Islander alone (% change since 2000)
Races - Two or more races (%)
Races - Two or more races (% change since 2000)
Races - Other race alone (%)
Races - Other race alone (% change since 2000)
Racial diversity
Unemployment (%)
Unemployment (% change since 2000)
Unemployment (%) - White
Unemployment (%) - Black or African American
Unemployment (%) - Asian
Unemployment (%) - Hispanic or Latino
Unemployment (%) - American Indian and Alaska Native
Unemployment (%) - Multirace
Unemployment (%) - Other Race
Population density (people per square mile)
Population - Males (%)
Population - Females (%)
Population - Males (%) - White
Population - Males (%) - Black or African American
Population - Males (%) - Asian
Population - Males (%) - Hispanic or Latino
Population - Males (%) - American Indian and Alaska Native
Population - Males (%) - Multirace
Population - Males (%) - Other Race
Population - Females (%) - White
Population - Females (%) - Black or African American
Population - Females (%) - Asian
Population - Females (%) - Hispanic or Latino
Population - Females (%) - American Indian and Alaska Native
Population - Females (%) - Multirace
Population - Females (%) - Other Race
Coronavirus confirmed cases (Apr 24, 2024)
Deaths caused by coronavirus (Apr 24, 2024)
Coronavirus confirmed cases (per 100k population) (Apr 24, 2024)
Deaths caused by coronavirus (per 100k population) (Apr 24, 2024)
Daily increase in number of cases (Apr 24, 2024)
Weekly increase in number of cases (Apr 24, 2024)
Cases doubled (in days) (Apr 24, 2024)
Hospitalized patients (Apr 18, 2022)
Negative test results (Apr 18, 2022)
Total test results (Apr 18, 2022)
COVID Vaccine doses distributed (per 100k population) (Sep 19, 2023)
COVID Vaccine doses administered (per 100k population) (Sep 19, 2023)
COVID Vaccine doses distributed (Sep 19, 2023)
COVID Vaccine doses administered (Sep 19, 2023)
Likely homosexual households (%)
Likely homosexual households (% change since 2000)
Likely homosexual households - Lesbian couples (%)
Likely homosexual households - Lesbian couples (% change since 2000)
Likely homosexual households - Gay men (%)
Likely homosexual households - Gay men (% change since 2000)
Cost of living index
Median gross rent ($)
Median contract rent ($)
Median monthly housing costs ($)
Median house or condo value ($)
Median house or condo value ($ change since 2000)
Mean house or condo value by units in structure - 1, detached ($)
Mean house or condo value by units in structure - 1, attached ($)
Mean house or condo value by units in structure - 2 ($)
Mean house or condo value by units in structure by units in structure - 3 or 4 ($)
Mean house or condo value by units in structure - 5 or more ($)
Mean house or condo value by units in structure - Boat, RV, van, etc. ($)
Mean house or condo value by units in structure - Mobile home ($)
Median house or condo value ($) - White
Median house or condo value ($) - Black or African American
Median house or condo value ($) - Asian
Median house or condo value ($) - Hispanic or Latino
Median house or condo value ($) - American Indian and Alaska Native
Median house or condo value ($) - Multirace
Median house or condo value ($) - Other Race
Median resident age
Resident age diversity
Median resident age - Males
Median resident age - Females
Median resident age - White
Median resident age - Black or African American
Median resident age - Asian
Median resident age - Hispanic or Latino
Median resident age - American Indian and Alaska Native
Median resident age - Multirace
Median resident age - Other Race
Median resident age - Males - White
Median resident age - Males - Black or African American
Median resident age - Males - Asian
Median resident age - Males - Hispanic or Latino
Median resident age - Males - American Indian and Alaska Native
Median resident age - Males - Multirace
Median resident age - Males - Other Race
Median resident age - Females - White
Median resident age - Females - Black or African American
Median resident age - Females - Asian
Median resident age - Females - Hispanic or Latino
Median resident age - Females - American Indian and Alaska Native
Median resident age - Females - Multirace
Median resident age - Females - Other Race
Commute - mean travel time to work (minutes)
Travel time to work - Less than 5 minutes (%)
Travel time to work - Less than 5 minutes (% change since 2000)
Travel time to work - 5 to 9 minutes (%)
Travel time to work - 5 to 9 minutes (% change since 2000)
Travel time to work - 10 to 19 minutes (%)
Travel time to work - 10 to 19 minutes (% change since 2000)
Travel time to work - 20 to 29 minutes (%)
Travel time to work - 20 to 29 minutes (% change since 2000)
Travel time to work - 30 to 39 minutes (%)
Travel time to work - 30 to 39 minutes (% change since 2000)
Travel time to work - 40 to 59 minutes (%)
Travel time to work - 40 to 59 minutes (% change since 2000)
Travel time to work - 60 to 89 minutes (%)
Travel time to work - 60 to 89 minutes (% change since 2000)
Travel time to work - 90 or more minutes (%)
Travel time to work - 90 or more minutes (% change since 2000)
Marital status - Never married (%)
Marital status - Now married (%)
Marital status - Separated (%)
Marital status - Widowed (%)
Marital status - Divorced (%)
Median family income ($)
Median family income (% change since 2000)
Median non-family income ($)
Median non-family income (% change since 2000)
Median per capita income ($)
Median per capita income (% change since 2000)
Median family income ($) - White
Median family income ($) - Black or African American
Median family income ($) - Asian
Median family income ($) - Hispanic or Latino
Median family income ($) - American Indian and Alaska Native
Median family income ($) - Multirace
Median family income ($) - Other Race
Median year house/condo built
Median year apartment built
Year house built - Built 2005 or later (%)
Year house built - Built 2000 to 2004 (%)
Year house built - Built 1990 to 1999 (%)
Year house built - Built 1980 to 1989 (%)
Year house built - Built 1970 to 1979 (%)
Year house built - Built 1960 to 1969 (%)
Year house built - Built 1950 to 1959 (%)
Year house built - Built 1940 to 1949 (%)
Year house built - Built 1939 or earlier (%)
Average household size
Household density (households per square mile)
Average household size - White
Average household size - Black or African American
Average household size - Asian
Average household size - Hispanic or Latino
Average household size - American Indian and Alaska Native
Average household size - Multirace
Average household size - Other Race
Occupied housing units (%)
Vacant housing units (%)
Owner occupied housing units (%)
Renter occupied housing units (%)
Vacancy status - For rent (%)
Vacancy status - For sale only (%)
Vacancy status - Rented or sold, not occupied (%)
Vacancy status - For seasonal, recreational, or occasional use (%)
Vacancy status - For migrant workers (%)
Vacancy status - Other vacant (%)
Residents with income below the poverty level (%)
Residents with income below 50% of the poverty level (%)
Children below poverty level (%)
Poor families by family type - Married-couple family (%)
Poor families by family type - Male, no wife present (%)
Poor families by family type - Female, no husband present (%)
Poverty status for native-born residents (%)
Poverty status for foreign-born residents (%)
Poverty among high school graduates not in families (%)
Poverty among people who did not graduate high school not in families (%)
Residents with income below the poverty level (%) - White
Residents with income below the poverty level (%) - Black or African American
Residents with income below the poverty level (%) - Asian
Residents with income below the poverty level (%) - Hispanic or Latino
Residents with income below the poverty level (%) - American Indian and Alaska Native
Residents with income below the poverty level (%) - Multirace
Residents with income below the poverty level (%) - Other Race
Air pollution - Air Quality Index (AQI)
Air pollution - CO
Air pollution - NO2
Air pollution - SO2
Air pollution - Ozone
Air pollution - PM10
Air pollution - PM25
Air pollution - Pb
Crime - Murders per 100,000 population
Crime - Rapes per 100,000 population
Crime - Robberies per 100,000 population
Crime - Assaults per 100,000 population
Crime - Burglaries per 100,000 population
Crime - Thefts per 100,000 population
Crime - Auto thefts per 100,000 population
Crime - Arson per 100,000 population
Crime - City-data.com crime index
Crime - Violent crime index
Crime - Property crime index
Crime - Murders per 100,000 population (5 year average)
Crime - Rapes per 100,000 population (5 year average)
Crime - Robberies per 100,000 population (5 year average)
Crime - Assaults per 100,000 population (5 year average)
Crime - Burglaries per 100,000 population (5 year average)
Crime - Thefts per 100,000 population (5 year average)
Crime - Auto thefts per 100,000 population (5 year average)
Crime - Arson per 100,000 population (5 year average)
Crime - City-data.com crime index (5 year average)
Crime - Violent crime index (5 year average)
Crime - Property crime index (5 year average)
1996 Presidential Elections Results (%) - Democratic Party (Clinton)
1996 Presidential Elections Results (%) - Republican Party (Dole)
1996 Presidential Elections Results (%) - Other
2000 Presidential Elections Results (%) - Democratic Party (Gore)
2000 Presidential Elections Results (%) - Republican Party (Bush)
2000 Presidential Elections Results (%) - Other
2004 Presidential Elections Results (%) - Democratic Party (Kerry)
2004 Presidential Elections Results (%) - Republican Party (Bush)
2004 Presidential Elections Results (%) - Other
2008 Presidential Elections Results (%) - Democratic Party (Obama)
2008 Presidential Elections Results (%) - Republican Party (McCain)
2008 Presidential Elections Results (%) - Other
2012 Presidential Elections Results (%) - Democratic Party (Obama)
2012 Presidential Elections Results (%) - Republican Party (Romney)
2012 Presidential Elections Results (%) - Other
2016 Presidential Elections Results (%) - Democratic Party (Clinton)
2016 Presidential Elections Results (%) - Republican Party (Trump)
2016 Presidential Elections Results (%) - Other
2020 Presidential Elections Results (%) - Democratic Party (Biden)
2020 Presidential Elections Results (%) - Republican Party (Trump)
2020 Presidential Elections Results (%) - Other
Ancestries Reported - Arab (%)
Ancestries Reported - Czech (%)
Ancestries Reported - Danish (%)
Ancestries Reported - Dutch (%)
Ancestries Reported - English (%)
Ancestries Reported - French (%)
Ancestries Reported - French Canadian (%)
Ancestries Reported - German (%)
Ancestries Reported - Greek (%)
Ancestries Reported - Hungarian (%)
Ancestries Reported - Irish (%)
Ancestries Reported - Italian (%)
Ancestries Reported - Lithuanian (%)
Ancestries Reported - Norwegian (%)
Ancestries Reported - Polish (%)
Ancestries Reported - Portuguese (%)
Ancestries Reported - Russian (%)
Ancestries Reported - Scotch-Irish (%)
Ancestries Reported - Scottish (%)
Ancestries Reported - Slovak (%)
Ancestries Reported - Subsaharan African (%)
Ancestries Reported - Swedish (%)
Ancestries Reported - Swiss (%)
Ancestries Reported - Ukrainian (%)
Ancestries Reported - United States (%)
Ancestries Reported - Welsh (%)
Ancestries Reported - West Indian (%)
Ancestries Reported - Other (%)
Educational Attainment - No schooling completed (%)
Educational Attainment - Less than high school (%)
Educational Attainment - High school or equivalent (%)
Educational Attainment - Less than 1 year of college (%)
Educational Attainment - 1 or more years of college (%)
Educational Attainment - Associate degree (%)
Educational Attainment - Bachelor's degree (%)
Educational Attainment - Master's degree (%)
Educational Attainment - Professional school degree (%)
Educational Attainment - Doctorate degree (%)
School Enrollment - Nursery, preschool (%)
School Enrollment - Kindergarten (%)
School Enrollment - Grade 1 to 4 (%)
School Enrollment - Grade 5 to 8 (%)
School Enrollment - Grade 9 to 12 (%)
School Enrollment - College undergrad (%)
School Enrollment - Graduate or professional (%)
School Enrollment - Not enrolled in school (%)
School enrollment - Public schools (%)
School enrollment - Private schools (%)
School enrollment - Not enrolled (%)
Median number of rooms in houses and condos
Median number of rooms in apartments
Housing units lacking complete plumbing facilities (%)
Housing units lacking complete kitchen facilities (%)
Density of houses
Urban houses (%)
Rural houses (%)
Households with people 60 years and over (%)
Households with people 65 years and over (%)
Households with people 75 years and over (%)
Households with one or more nonrelatives (%)
Households with no nonrelatives (%)
Population in households (%)
Family households (%)
Nonfamily households (%)
Population in families (%)
Family households with own children (%)
Median number of bedrooms in owner occupied houses
Mean number of bedrooms in owner occupied houses
Median number of bedrooms in renter occupied houses
Mean number of bedrooms in renter occupied houses
Median number of vehichles in owner occupied houses
Mean number of vehichles in owner occupied houses
Median number of vehichles in renter occupied houses
Mean number of vehichles in renter occupied houses
Mortgage status - with mortgage (%)
Mortgage status - with second mortgage (%)
Mortgage status - with home equity loan (%)
Mortgage status - with both second mortgage and home equity loan (%)
Mortgage status - without a mortgage (%)
Average family size
Average family size - White
Average family size - Black or African American
Average family size - Asian
Average family size - Hispanic or Latino
Average family size - American Indian and Alaska Native
Average family size - Multirace
Average family size - Other Race
Geographical mobility - Same house 1 year ago (%)
Geographical mobility - Moved within same county (%)
Geographical mobility - Moved from different county within same state (%)
Geographical mobility - Moved from different state (%)
Geographical mobility - Moved from abroad (%)
Place of birth - Born in state of residence (%)
Place of birth - Born in other state (%)
Place of birth - Native, outside of US (%)
Place of birth - Foreign born (%)
Housing units in structures - 1, detached (%)
Housing units in structures - 1, attached (%)
Housing units in structures - 2 (%)
Housing units in structures - 3 or 4 (%)
Housing units in structures - 5 to 9 (%)
Housing units in structures - 10 to 19 (%)
Housing units in structures - 20 to 49 (%)
Housing units in structures - 50 or more (%)
Housing units in structures - Mobile home (%)
Housing units in structures - Boat, RV, van, etc. (%)
House/condo owner moved in on average (years ago)
Renter moved in on average (years ago)
Year householder moved into unit - Moved in 1999 to March 2000 (%)
Year householder moved into unit - Moved in 1995 to 1998 (%)
Year householder moved into unit - Moved in 1990 to 1994 (%)
Year householder moved into unit - Moved in 1980 to 1989 (%)
Year householder moved into unit - Moved in 1970 to 1979 (%)
Year householder moved into unit - Moved in 1969 or earlier (%)
Means of transportation to work - Drove car alone (%)
Means of transportation to work - Carpooled (%)
Means of transportation to work - Public transportation (%)
Means of transportation to work - Bus or trolley bus (%)
Means of transportation to work - Streetcar or trolley car (%)
Means of transportation to work - Subway or elevated (%)
Means of transportation to work - Railroad (%)
Means of transportation to work - Ferryboat (%)
Means of transportation to work - Taxicab (%)
Means of transportation to work - Motorcycle (%)
Means of transportation to work - Bicycle (%)
Means of transportation to work - Walked (%)
Means of transportation to work - Other means (%)
Working at home (%)
Industry diversity
Most Common Industries - Agriculture, forestry, fishing and hunting, and mining (%)
Most Common Industries - Agriculture, forestry, fishing and hunting (%)
Most Common Industries - Mining, quarrying, and oil and gas extraction (%)
Most Common Industries - Construction (%)
Most Common Industries - Manufacturing (%)
Most Common Industries - Wholesale trade (%)
Most Common Industries - Retail trade (%)
Most Common Industries - Transportation and warehousing, and utilities (%)
Most Common Industries - Transportation and warehousing (%)
Most Common Industries - Utilities (%)
Most Common Industries - Information (%)
Most Common Industries - Finance and insurance, and real estate and rental and leasing (%)
Most Common Industries - Finance and insurance (%)
Most Common Industries - Real estate and rental and leasing (%)
Most Common Industries - Professional, scientific, and management, and administrative and waste management services (%)
Most Common Industries - Professional, scientific, and technical services (%)
Most Common Industries - Management of companies and enterprises (%)
Most Common Industries - Administrative and support and waste management services (%)
Most Common Industries - Educational services, and health care and social assistance (%)
Most Common Industries - Educational services (%)
Most Common Industries - Health care and social assistance (%)
Most Common Industries - Arts, entertainment, and recreation, and accommodation and food services (%)
Most Common Industries - Arts, entertainment, and recreation (%)
Most Common Industries - Accommodation and food services (%)
Most Common Industries - Other services, except public administration (%)
Most Common Industries - Public administration (%)
Occupation diversity
Most Common Occupations - Management, business, science, and arts occupations (%)
Most Common Occupations - Management, business, and financial occupations (%)
Most Common Occupations - Management occupations (%)
Most Common Occupations - Business and financial operations occupations (%)
Most Common Occupations - Computer, engineering, and science occupations (%)
Most Common Occupations - Computer and mathematical occupations (%)
Most Common Occupations - Architecture and engineering occupations (%)
Most Common Occupations - Life, physical, and social science occupations (%)
Most Common Occupations - Education, legal, community service, arts, and media occupations (%)
Most Common Occupations - Community and social service occupations (%)
Most Common Occupations - Legal occupations (%)
Most Common Occupations - Education, training, and library occupations (%)
Most Common Occupations - Arts, design, entertainment, sports, and media occupations (%)
Most Common Occupations - Healthcare practitioners and technical occupations (%)
Most Common Occupations - Health diagnosing and treating practitioners and other technical occupations (%)
Most Common Occupations - Health technologists and technicians (%)
Most Common Occupations - Service occupations (%)
Most Common Occupations - Healthcare support occupations (%)
Most Common Occupations - Protective service occupations (%)
Most Common Occupations - Fire fighting and prevention, and other protective service workers including supervisors (%)
Most Common Occupations - Law enforcement workers including supervisors (%)
Most Common Occupations - Food preparation and serving related occupations (%)
Most Common Occupations - Building and grounds cleaning and maintenance occupations (%)
Most Common Occupations - Personal care and service occupations (%)
Most Common Occupations - Sales and office occupations (%)
Most Common Occupations - Sales and related occupations (%)
Most Common Occupations - Office and administrative support occupations (%)
Most Common Occupations - Natural resources, construction, and maintenance occupations (%)
Most Common Occupations - Farming, fishing, and forestry occupations (%)
Most Common Occupations - Construction and extraction occupations (%)
Most Common Occupations - Installation, maintenance, and repair occupations (%)
Most Common Occupations - Production, transportation, and material moving occupations (%)
Most Common Occupations - Production occupations (%)
Most Common Occupations - Transportation occupations (%)
Most Common Occupations - Material moving occupations (%)
People in Group quarters - Institutionalized population (%)
People in Group quarters - Correctional institutions (%)
People in Group quarters - Federal prisons and detention centers (%)
People in Group quarters - Halfway houses (%)
People in Group quarters - Local jails and other confinement facilities (including police lockups) (%)
People in Group quarters - Military disciplinary barracks (%)
People in Group quarters - State prisons (%)
People in Group quarters - Other types of correctional institutions (%)
People in Group quarters - Nursing homes (%)
People in Group quarters - Hospitals/wards, hospices, and schools for the handicapped (%)
People in Group quarters - Hospitals/wards and hospices for chronically ill (%)
People in Group quarters - Hospices or homes for chronically ill (%)
People in Group quarters - Military hospitals or wards for chronically ill (%)
People in Group quarters - Other hospitals or wards for chronically ill (%)
People in Group quarters - Hospitals or wards for drug/alcohol abuse (%)
People in Group quarters - Mental (Psychiatric) hospitals or wards (%)
People in Group quarters - Schools, hospitals, or wards for the mentally retarded (%)
People in Group quarters - Schools, hospitals, or wards for the physically handicapped (%)
People in Group quarters - Institutions for the deaf (%)
People in Group quarters - Institutions for the blind (%)
People in Group quarters - Orthopedic wards and institutions for the physically handicapped (%)
People in Group quarters - Wards in general hospitals for patients who have no usual home elsewhere (%)
People in Group quarters - Wards in military hospitals for patients who have no usual home elsewhere (%)
People in Group quarters - Juvenile institutions (%)
People in Group quarters - Long-term care (%)
People in Group quarters - Homes for abused, dependent, and neglected children (%)
People in Group quarters - Residential treatment centers for emotionally disturbed children (%)
People in Group quarters - Training schools for juvenile delinquents (%)
People in Group quarters - Short-term care, detention or diagnostic centers for delinquent children (%)
People in Group quarters - Type of juvenile institution unknown (%)
People in Group quarters - Noninstitutionalized population (%)
People in Group quarters - College dormitories (includes college quarters off campus) (%)
People in Group quarters - Military quarters (%)
People in Group quarters - On base (%)
People in Group quarters - Barracks, unaccompanied personnel housing (UPH), (Enlisted/Officer), ;and similar group living quarters for military personnel (%)
People in Group quarters - Transient quarters for temporary residents (%)
People in Group quarters - Military ships (%)
People in Group quarters - Group homes (%)
People in Group quarters - Homes or halfway houses for drug/alcohol abuse (%)
People in Group quarters - Homes for the mentally ill (%)
People in Group quarters - Homes for the mentally retarded (%)
People in Group quarters - Homes for the physically handicapped (%)
People in Group quarters - Other group homes (%)
People in Group quarters - Religious group quarters (%)
People in Group quarters - Dormitories (%)
People in Group quarters - Agriculture workers' dormitories on farms (%)
People in Group quarters - Job Corps and vocational training facilities (%)
People in Group quarters - Other workers' dormitories (%)
People in Group quarters - Crews of maritime vessels (%)
People in Group quarters - Other nonhousehold living situations (%)
People in Group quarters - Other noninstitutional group quarters (%)
Residents speaking English at home (%)
Residents speaking English at home - Born in the United States (%)
Residents speaking English at home - Native, born elsewhere (%)
Residents speaking English at home - Foreign born (%)
Residents speaking Spanish at home (%)
Residents speaking Spanish at home - Born in the United States (%)
Residents speaking Spanish at home - Native, born elsewhere (%)
Residents speaking Spanish at home - Foreign born (%)
Residents speaking other language at home (%)
Residents speaking other language at home - Born in the United States (%)
Residents speaking other language at home - Native, born elsewhere (%)
Residents speaking other language at home - Foreign born (%)
Class of Workers - Employee of private company (%)
Class of Workers - Self-employed in own incorporated business (%)
Class of Workers - Private not-for-profit wage and salary workers (%)
Class of Workers - Local government workers (%)
Class of Workers - State government workers (%)
Class of Workers - Federal government workers (%)
Class of Workers - Self-employed workers in own not incorporated business and Unpaid family workers (%)
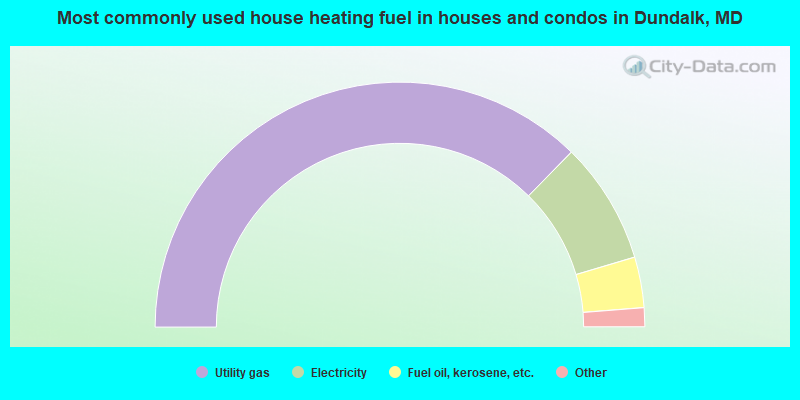
House heating fuel used in houses and condos - Utility gas (%)
House heating fuel used in houses and condos - Bottled, tank, or LP gas (%)
House heating fuel used in houses and condos - Electricity (%)
House heating fuel used in houses and condos - Fuel oil, kerosene, etc. (%)
House heating fuel used in houses and condos - Coal or coke (%)
House heating fuel used in houses and condos - Wood (%)
House heating fuel used in houses and condos - Solar energy (%)
House heating fuel used in houses and condos - Other fuel (%)
House heating fuel used in houses and condos - No fuel used (%)
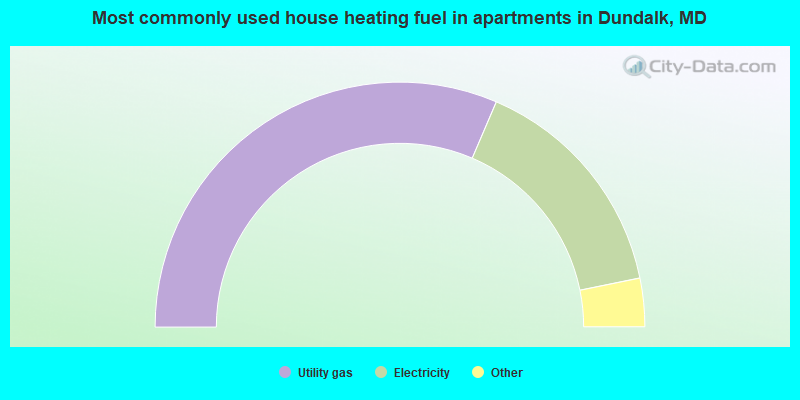
House heating fuel used in apartments - Utility gas (%)
House heating fuel used in apartments - Bottled, tank, or LP gas (%)
House heating fuel used in apartments - Electricity (%)
House heating fuel used in apartments - Fuel oil, kerosene, etc. (%)
House heating fuel used in apartments - Coal or coke (%)
House heating fuel used in apartments - Wood (%)
House heating fuel used in apartments - Solar energy (%)
House heating fuel used in apartments - Other fuel (%)
House heating fuel used in apartments - No fuel used (%)
Armed forces status - In Armed Forces (%)
Armed forces status - Civilian (%)
Armed forces status - Civilian - Veteran (%)
Armed forces status - Civilian - Nonveteran (%)
Fatal accidents locations in years 2005-2021
Fatal accidents locations in 2005
Fatal accidents locations in 2006
Fatal accidents locations in 2007
Fatal accidents locations in 2008
Fatal accidents locations in 2009
Fatal accidents locations in 2010
Fatal accidents locations in 2011
Fatal accidents locations in 2012
Fatal accidents locations in 2013
Fatal accidents locations in 2014
Fatal accidents locations in 2015
Fatal accidents locations in 2016
Fatal accidents locations in 2017
Fatal accidents locations in 2018
Fatal accidents locations in 2019
Fatal accidents locations in 2020
Fatal accidents locations in 2021
Alcohol use - People drinking some alcohol every month (%)
Alcohol use - People not drinking at all (%)
Alcohol use - Average days/month drinking alcohol
Alcohol use - Average drinks/week
Alcohol use - Average days/year people drink much
Audiometry - Average condition of hearing (%)
Audiometry - People that can hear a whisper from across a quiet room (%)
Audiometry - People that can hear normal voice from across a quiet room (%)
Audiometry - Ears ringing, roaring, buzzing (%)
Audiometry - Had a job exposure to loud noise (%)
Audiometry - Had off-work exposure to loud noise (%)
Blood Pressure & Cholesterol - Has high blood pressure (%)
Blood Pressure & Cholesterol - Checking blood pressure at home (%)
Blood Pressure & Cholesterol - Frequently checking blood cholesterol (%)
Blood Pressure & Cholesterol - Has high cholesterol level (%)
Consumer Behavior - Money monthly spent on food at supermarket/grocery store
Consumer Behavior - Money monthly spent on food at other stores
Consumer Behavior - Money monthly spent on eating out
Consumer Behavior - Money monthly spent on carryout/delivered foods
Consumer Behavior - Income spent on food at supermarket/grocery store (%)
Consumer Behavior - Income spent on food at other stores (%)
Consumer Behavior - Income spent on eating out (%)
Consumer Behavior - Income spent on carryout/delivered foods (%)
Current Health Status - General health condition (%)
Current Health Status - Blood donors (%)
Current Health Status - Has blood ever tested for HIV virus (%)
Current Health Status - Left-handed people (%)
Dermatology - People using sunscreen (%)
Diabetes - Diabetics (%)
Diabetes - Had a blood test for high blood sugar (%)
Diabetes - People taking insulin (%)
Diet Behavior & Nutrition - Diet health (%)
Diet Behavior & Nutrition - Milk product consumption (# of products/month)
Diet Behavior & Nutrition - Meals not home prepared (#/week)
Diet Behavior & Nutrition - Meals from fast food or pizza place (#/week)
Diet Behavior & Nutrition - Ready-to-eat foods (#/month)
Diet Behavior & Nutrition - Frozen meals/pizza (#/month)
Drug Use - People that ever used marijuana or hashish (%)
Drug Use - Ever used hard drugs (%)
Drug Use - Ever used any form of cocaine (%)
Drug Use - Ever used heroin (%)
Drug Use - Ever used methamphetamine (%)
Health Insurance - People covered by health insurance (%)
Kidney Conditions-Urology - Avg. # of times urinating at night
Medical Conditions - People with asthma (%)
Medical Conditions - People with anemia (%)
Medical Conditions - People with psoriasis (%)
Medical Conditions - People with overweight (%)
Medical Conditions - Elderly people having difficulties in thinking or remembering (%)
Medical Conditions - People who ever received blood transfusion (%)
Medical Conditions - People having trouble seeing even with glass/contacts (%)
Medical Conditions - People with arthritis (%)
Medical Conditions - People with gout (%)
Medical Conditions - People with congestive heart failure (%)
Medical Conditions - People with coronary heart disease (%)
Medical Conditions - People with angina pectoris (%)
Medical Conditions - People who ever had heart attack (%)
Medical Conditions - People who ever had stroke (%)
Medical Conditions - People with emphysema (%)
Medical Conditions - People with thyroid problem (%)
Medical Conditions - People with chronic bronchitis (%)
Medical Conditions - People with any liver condition (%)
Medical Conditions - People who ever had cancer or malignancy (%)
Mental Health - People who have little interest in doing things (%)
Mental Health - People feeling down, depressed, or hopeless (%)
Mental Health - People who have trouble sleeping or sleeping too much (%)
Mental Health - People feeling tired or having little energy (%)
Mental Health - People with poor appetite or overeating (%)
Mental Health - People feeling bad about themself (%)
Mental Health - People who have trouble concentrating on things (%)
Mental Health - People moving or speaking slowly or too fast (%)
Mental Health - People having thoughts they would be better off dead (%)
Oral Health - Average years since last visit a dentist
Oral Health - People embarrassed because of mouth (%)
Oral Health - People with gum disease (%)
Oral Health - General health of teeth and gums (%)
Oral Health - Average days a week using dental floss/device
Oral Health - Average days a week using mouthwash for dental problem
Oral Health - Average number of teeth
Pesticide Use - Households using pesticides to control insects (%)
Pesticide Use - Households using pesticides to kill weeds (%)
Physical Activity - People doing vigorous-intensity work activities (%)
Physical Activity - People doing moderate-intensity work activities (%)
Physical Activity - People walking or bicycling (%)
Physical Activity - People doing vigorous-intensity recreational activities (%)
Physical Activity - People doing moderate-intensity recreational activities (%)
Physical Activity - Average hours a day doing sedentary activities
Physical Activity - Average hours a day watching TV or videos
Physical Activity - Average hours a day using computer
Physical Functioning - People having limitations keeping them from working (%)
Physical Functioning - People limited in amount of work they can do (%)
Physical Functioning - People that need special equipment to walk (%)
Physical Functioning - People experiencing confusion/memory problems (%)
Physical Functioning - People requiring special healthcare equipment (%)
Prescription Medications - Average number of prescription medicines taking
Preventive Aspirin Use - Adults 40+ taking low-dose aspirin (%)
Reproductive Health - Vaginal deliveries (%)
Reproductive Health - Cesarean deliveries (%)
Reproductive Health - Deliveries resulted in a live birth (%)
Reproductive Health - Pregnancies resulted in a delivery (%)
Reproductive Health - Women breastfeeding newborns (%)
Reproductive Health - Women that had a hysterectomy (%)
Reproductive Health - Women that had both ovaries removed (%)
Reproductive Health - Women that have ever taken birth control pills (%)
Reproductive Health - Women taking birth control pills (%)
Reproductive Health - Women that have ever used Depo-Provera or injectables (%)
Reproductive Health - Women that have ever used female hormones (%)
Sexual Behavior - People 18+ that ever had sex (vaginal, anal, or oral) (%)
Sexual Behavior - Males 18+ that ever had vaginal sex with a woman (%)
Sexual Behavior - Males 18+ that ever performed oral sex on a woman (%)
Sexual Behavior - Males 18+ that ever had anal sex with a woman (%)
Sexual Behavior - Males 18+ that ever had any sex with a man (%)
Sexual Behavior - Females 18+ that ever had vaginal sex with a man (%)
Sexual Behavior - Females 18+ that ever performed oral sex on a man (%)
Sexual Behavior - Females 18+ that ever had anal sex with a man (%)
Sexual Behavior - Females 18+ that ever had any kind of sex with a woman (%)
Sexual Behavior - Average age people first had sex
Sexual Behavior - Average number of female sex partners in lifetime (males 18+)
Sexual Behavior - Average number of female vaginal sex partners in lifetime (males 18+)
Sexual Behavior - Average age people first performed oral sex on a woman (18+)
Sexual Behavior - Average number of woman performed oral sex on in lifetime (18+)
Sexual Behavior - Average number of male sex partners in lifetime (males 18+)
Sexual Behavior - Average number of male anal sex partners in lifetime (males 18+)
Sexual Behavior - Average age people first performed oral sex on a man (18+)
Sexual Behavior - Average number of male oral sex partners in lifetime (18+)
Sexual Behavior - People using protection when performing oral sex (%)
Sexual Behavior - Average number of times people have vaginal or anal sex a year
Sexual Behavior - People having sex without condom (%)
Sexual Behavior - Average number of male sex partners in lifetime (females 18+)
Sexual Behavior - Average number of male vaginal sex partners in lifetime (females 18+)
Sexual Behavior - Average number of female sex partners in lifetime (females 18+)
Sexual Behavior - Circumcised males 18+ (%)
Sleep Disorders - Average hours sleeping at night
Sleep Disorders - People that has trouble sleeping (%)
Smoking-Cigarette Use - People smoking cigarettes (%)
Taste & Smell - People 40+ having problems with smell (%)
Taste & Smell - People 40+ having problems with taste (%)
Taste & Smell - People 40+ that ever had wisdom teeth removed (%)
Taste & Smell - People 40+ that ever had tonsils teeth removed (%)
Taste & Smell - People 40+ that ever had a loss of consciousness because of a head injury (%)
Taste & Smell - People 40+ that ever had a broken nose or other serious injury to face or skull (%)
Taste & Smell - People 40+ that ever had two or more sinus infections (%)
Weight - Average height (inches)
Weight - Average weight (pounds)
Weight - Average BMI
Weight - People that are obese (%)
Weight - People that ever were obese (%)
Weight - People trying to lose weight (%)
Latest news from Dundalk, MD collected exclusively by city-data.com from local newspapers, TV, and radio stations
Ancestries: German (10.9%), American (8.6%), Irish (5.3%), Italian (5.0%), Polish (5.0%), English (4.5%).
Current Local Time:
Land area: 13.3 square miles.
Population density: 5,008 people per square mile (average).
6,267 residents are foreign born (5.6% Latin America , 1.9% Asia ).
This place:
9.5%Maryland:
15.7%
Median real estate property taxes paid for housing units with mortgages in 2022: $2,121 (1.0%)Median real estate property taxes paid for housing units with no mortgage in 2022: $2,275 (1.3%)
Nearest city with pop. 200,000+: Baltimore, MD
Nearest city with pop. 1,000,000+: Philadelphia, PA
Nearest cities:
Latitude: 39.27 N, Longitude: 76.51 W
Daytime population change due to commuting: -10,951 (-16.5%)Workers who live and work in this place: 5,219 (20.0%)
Property values in Dundalk, MD
Unemployment in December 2023:
Most common occupations in Dundalk, MD (%)
Both Males Females
Other office and administrative support workers, including supervisors (5.6%)
Other production occupations, including supervisors (5.1%)
Secretaries and administrative assistants (4.2%)
Driver/sales workers and truck drivers (4.0%)
Electrical equipment mechanics and other installation, maintenance, and repair workers, including supervisors (3.8%)
Material recording, scheduling, dispatching, and distributing workers (3.7%)
Building and grounds cleaning and maintenance occupations (3.4%)
Driver/sales workers and truck drivers (7.3%)
Electrical equipment mechanics and other installation, maintenance, and repair workers, including supervisors (7.2%)
Other production occupations, including supervisors (7.1%)
Material recording, scheduling, dispatching, and distributing workers (4.3%)
Vehicle and mobile equipment mechanics, installers, and repairers (4.1%)
Laborers and material movers, hand (4.1%)
Metal workers and plastic workers (3.6%)
Other office and administrative support workers, including supervisors (9.6%)
Secretaries and administrative assistants (8.7%)
Cashiers (5.2%)
Information and record clerks, except customer service representatives (5.0%)
Building and grounds cleaning and maintenance occupations (3.5%)
Retail sales workers, except cashiers (3.3%)
Other sales and related occupations, including supervisors (3.2%)
Tornado activity:
Dundalk-area historical tornado activity is slightly above Maryland state average. It is 16% greater than the overall U.S. average.
On 6/9/1961, a category F3 (max. wind speeds 158-206 mph) tornado 6.0 miles away from the Dundalk place center caused between $50,000 and $500,000 in damages.
On 9/24/2001, a category F3 tornado 17.6 miles away from the place center killed 2 people and injured 55 people and caused $101 million in damages.
Earthquake activity:
Dundalk-area historical earthquake activity is significantly above Maryland state average. It is 60% smaller than the overall U.S. average. On 8/23/2011 at 17:51:04, a magnitude 5.8 (5.8 MW, Depth: 3.7 mi, Class: Moderate, Intensity: VI - VII) earthquake occurred 121.6 miles away from Dundalk center On 1/16/1994 at 01:49:16, a magnitude 4.6 (4.6 MB, 4.6 LG, Depth: 3.1 mi, Class: Light, Intensity: IV - V) earthquake occurred 77.7 miles away from the city center On 9/25/1998 at 19:52:52, a magnitude 5.2 (4.8 MB, 4.3 MS, 5.2 LG, 4.5 MW, Depth: 3.1 mi) earthquake occurred 256.3 miles away from Dundalk center On 8/25/2011 at 05:07:52, a magnitude 4.5 (4.5 ML, Depth: 4.2 mi) earthquake occurred 120.7 miles away from the city center On 12/9/2003 at 20:59:18, a magnitude 4.5 (4.5 ML, Depth: 6.2 mi) earthquake occurred 134.5 miles away from the city center On 12/9/2003 at 20:59:14, a magnitude 4.5 (4.5 MB, 4.5 LG) earthquake occurred 138.6 miles away from Dundalk center Magnitude types: regional Lg-wave magnitude (LG), body-wave magnitude (MB), local magnitude (ML), surface-wave magnitude (MS), moment magnitude (MW) Natural disasters: The number of natural disasters in Baltimore County (21) is greater than the US average (15).Major Disasters (Presidential) Declared: 15Emergencies Declared: 5Hurricanes: 6, Winter Storms: 5, Floods: 4, Snowstorms: 4, Storms: 4, Tropical Storms: 2, Blizzard: 1, Heavy Rain: 1, Snow: 1, Snowfall: 1, Tornado: 1, Other: 1 (Note: some incidents may be assigned to more than one category). Hospitals and medical centers in Dundalk: HERITAGE CENTER (7232 GERMAN HILL ROAD)
DAVITA - DUNDALK (14 COMMERCE ST)
FMC OF PORTER DIALYSIS - DUNDALK (1107 N POINT BOULEVARD)
Amtrak stations near Dundalk: 7 miles: BALTIMORE (1500 N. CHARLES ST.) Services: ticket office, fully wheelchair accessible, enclosed waiting area, public restrooms, public payphones, full-service food facilities, snack bar, vending machines, ATM, paid short-term parking, paid long-term parking, call for car rental service, taxi stand, public transit connection.
12 miles: BWI AIRPORT RAIL STATION (BALTIMORE, AMTRAK WAY) Services: ticket office, fully wheelchair accessible, enclosed waiting area, public restrooms, public payphones, snack bar, ATM, paid short-term parking, paid long-term parking, call for car rental service, call for taxi service, public transit connection.
Colleges/universities with over 2000 students nearest to Dundalk:
All-State Career-Baltimore (about 3 miles; Baltimore, MD ; Full-time enrollment: 2,287)
The Community College of Baltimore County (about 7 miles; Baltimore, MD ; FT enrollment: 15,217)
University of Baltimore (about 7 miles; Baltimore, MD ; FT enrollment: 3,592)
University of Maryland-Baltimore (about 7 miles; Baltimore, MD ; FT enrollment: 3,162)
Morgan State University (about 7 miles; Baltimore, MD ; FT enrollment: 7,113)
Maryland Institute College of Art (about 7 miles; Baltimore, MD ; FT enrollment: 2,267)
Johns Hopkins University (about 8 miles; Baltimore, MD ; FT enrollment: 20,568)
Notable locations in Dundalk: (A) , Canton Industrial Park (B) , Sheltered Harbor Marina (C) , Anchor Bay East Marina (D) , Baltimore County Fire Department Station 15 Eastview (E) , Heritage Center Nursing Home (F) , Turners Station Branch Baltimore County Public Library (G) , North Point Area Branch Baltimore County Public Library (H) , Dundalk Branch Baltimore County Public Library (I) , Maryland Transportation Authority (J) , Baltimore County Police Training Division (K) , Baltimore County Fire Department Station 6 Dundalk (L) , Wise Avenue Volunteer Fire Company Station 27 (M) , Baltimore County Police Department Precinct 12 North Point (N) . Display/hide their locations on the map
Shopping Centers: (1) , Eastpoint Mall Shopping Center (2) , Merritt Park Shopping Center (3) , North Point Plaza Shopping Center (4) , North Point Village Shopping Center (5) , Poplar Place Shopping Center (6) , Talbot Shopping Center (7) , Towns Center Shopping Center (8) , Wise Avenue Shopping Center (9) . Display/hide their locations on the map
Churches in Dundalk include: (A) , Saint Mildreds Roman Catholic Church (B) , Saint Ritas Roman Catholic Church (C) , Saint Timothys Evangelical Lutheran Church (D) , New Shiloh Baptist Church (E) , Dundalk Church (F) , Galilee Baptist Church (G) , Calvary Baptist Church of Dundalk (H) , Colgate Baptist Church (I) . Display/hide their locations on the map
Cemeteries: (1) , Sacred Heart of Mary Cemetery (2) , Sacred Heart Cemetery (3) , Saint Andrews Cemetery (4) , Pussville Cemetery (5) , Oaklawn Cemetery (6) . Display/hide their locations on the map
Creeks: (A) , Bullneck Creek (B) , Chink Creek (C) . Display/hide their locations on the map
Parks in Dundalk include: (1) , Bear Creek Park (2) , Charlesmont Park (3) , Colgate Recreation Area (4) , Dundalk Heritage Park (5) , Dundalk Park (6) , Fairway Park (7) , Fleming Park (8) , Harbor View Park (9) . Display/hide their locations on the map
Tourist attractions:
Birthplace of: Bucky Lasek - Skateboarder, E. J. Pipkin - Politician, Joseph J. Minnick - Politician, Shonda Schilling - Health activist, Deborah Rudacille - Writer.
Baltimore County has a predicted average indoor radon screening level greater than 4 pCi/L (pico curies per liter) - Highest Potential Average household size: This place:
2.6 peopleMaryland:
2.6 people
Percentage of family households: This place:
66.3%Whole state:
67.1%
Percentage of households with unmarried partners: This place:
9.4%Whole state:
6.4%
Likely homosexual households (counted as self-reported same-sex unmarried-partner households)
Lesbian couples: 0.5% of all households Gay men: 0.3% of all households
People in group quarters in Dundalk in 2010:
301 people in nursing facilities/skilled-nursing facilities
95 people in other noninstitutional facilities
13 people in workers' group living quarters and job corps centers
People in group quarters in Dundalk in 2000:
337 people in nursing homes
55 people in mental (psychiatric) hospitals or wards
8 people in other noninstitutional group quarters
7 people in religious group quarters
Banks with branches in Dundalk (2011 data):
Manufacturers and Traders Trust Company: Dundalk Heritage Park Branch at 39 Shipping Place, branch established on 1920/06/01; Merritt Manor Branch at 1115 Merritt Boulevard, branch established on 1972/08/28. Info updated 2011/08/08: Bank assets: $76,887.1 mil, Deposits: $60,064.2 mil, headquarters in Buffalo, NY, positive income , Commercial Lending Specialization, 808 total offices , Holding Company: M&T Bank Corporation
PNC Bank, National Association: German Hill at 1400 Merritt Boulevard, branch established on 2009/08/14. Info updated 2012/03/20: Bank assets: $263,309.6 mil, Deposits: $197,343.0 mil, headquarters in Wilmington, DE, positive income , Commercial Lending Specialization, 3085 total offices , Holding Company: Pnc Financial Services Group, Inc., The
SunTrust Bank: Dundalk Branch at 1135 Merritt Blvd, branch established on 2002/07/01. Info updated 2010/05/27: Bank assets: $171,291.7 mil, Deposits: $129,833.2 mil, headquarters in Atlanta, GA, positive income , Commercial Lending Specialization, 1716 total offices , Holding Company: Suntrust Banks, Inc.
For population 15 years and over in Dundalk:
Never married: 39.9%Now married: 38.7%Separated: 1.9%Widowed: 7.8%Divorced: 11.7% For population 25 years and over in Dundalk:
High school or higher: 81.5%Bachelor's degree or higher: 15.3%Graduate or professional degree: 4.7%Unemployed: 4.0%Mean travel time to work (commute): 20.0 minutes
Education Gini index (Inequality in education) Here:
13.2Maryland average:
12.7
Religion statistics for Dundalk, MD (based on Baltimore County data)
Religion Adherents Congregations Catholic 153,243 34 Evangelical Protestant 62,367 232 Mainline Protestant 50,484 167 Other 32,628 54 Black Protestant 32,442 37 Orthodox 1,663 3 None 472,202 -
Source: Clifford Grammich, Kirk Hadaway, Richard Houseal, Dale E.Jones, Alexei Krindatch, Richie Stanley and Richard H.Taylor. 2012. 2010 U.S.Religion Census: Religious Congregations & Membership Study. Association of Statisticians of American Religious Bodies. Jones, Dale E., et al. 2002. Congregations and Membership in the United States 2000. Nashville, TN: Glenmary Research Center. Graphs represent county-level data
Food Environment Statistics: Number of grocery stores : 137Baltimore County :
1.74 / 10,000 pop.Maryland :
1.96 / 10,000 pop.
Number of supercenters and club stores : 7Baltimore County :
0.09 / 10,000 pop.Maryland :
0.07 / 10,000 pop.
Number of convenience stores (no gas) : 88This county :
1.12 / 10,000 pop.Maryland :
1.22 / 10,000 pop.
Number of convenience stores (with gas) : 150Baltimore County :
1.91 / 10,000 pop.Maryland :
2.05 / 10,000 pop.
Number of full-service restaurants : 367This county :
4.67 / 10,000 pop.State :
5.40 / 10,000 pop.
Adult diabetes rate : This county :
9.1%Maryland :
9.1%
Adult obesity rate : This county :
26.4%State :
26.7%
Low-income preschool obesity rate : Baltimore County :
12.7%State :
15.5%
Health and Nutrition: Healthy diet rate : This city:
48.9%State:
50.1%
Average overall health of teeth and gums : Average BMI : This city:
28.8Maryland:
28.8
People feeling badly about themselves : Dundalk:
21.9%Maryland:
20.0%
People not drinking alcohol at all : Dundalk:
11.3%Maryland:
11.3%
Average hours sleeping at night : Overweight people : This city:
34.6%Maryland:
34.1%
General health condition : This city:
54.2%State:
56.5%
Average condition of hearing : This city:
76.6%State:
80.5%
More about Health and Nutrition of Dundalk, MD Residents
6.77% of this county's 2021 resident taxpayers lived in other counties in 2020 ($67,217 average adjusted gross income )
Here:
6.77%Maryland average:
7.42%
0.01% of residents moved from foreign countries ($84 average AGI )Baltimore County:
0.01%Maryland average:
0.05%
Top counties from which taxpayers relocated into this county between 2020 and 2021:
7.32% of this county's 2020 resident taxpayers moved to other counties in 2021 ($75,485 average adjusted gross income )
Here:
7.32%Maryland average:
7.91%
0.01% of residents moved to foreign countries ($168 average AGI )Baltimore County:
0.01%Maryland average:
0.04%
Top counties to which taxpayers relocated from this county between 2020 and 2021:
Businesses in Dundalk, MD
Name Count Name Count
7-Eleven 1 IHOP 1 ALDI 1 Little Caesars Pizza 1 AutoZone 1 McDonald's 1 Bally Total Fitness 1 PetSmart 1 Blockbuster 1 Quiznos 1 Burger King 2 Sprint Nextel 1 ColorTyme 1 Subway 1 Cricket Wireless 1 T-Mobile 1 Dennys 1 Taco Bell 1 GameStop 1 U-Haul 1 Giant 1 UPS 2 H&R Block 1 Walmart 1
Strongest AM radio stations in Dundalk:
WWLG (1370 AM; 50 kW; BALTIMORE, MD; Owner: M-10 BROADCASTING, INC.)
WBGR (860 AM; 2 kW; BALTIMORE, MD; Owner: INFINITY RADIO OPERATIONS INC.)
WBAL (1090 AM; 50 kW; BALTIMORE, MD; Owner: HEARST RADIO, INC.)
WCBM (680 AM; 50 kW; BALTIMORE, MD; Owner: WCBM MARYLAND, INC.)
WBIS (1190 AM; 50 kW; ANNAPOLIS, MD; Owner: NATIONS RADIO, LLC)
WGOP (700 AM; daytime; 25 kW; WALKERSVILLE, MD; Owner: BIRACH BROADCASTING CORPORATION)
WBMD (750 AM; daytime; 1 kW; BALTIMORE, MD; Owner: INFINITY RADIO OPERATIONS INC.)
WTEM (980 AM; 50 kW; WASHINGTON, DC; Owner: AMFM RADIO LICENSES, L.L.C.)
WTOP (1500 AM; 50 kW; WASHINGTON, DC; Owner: BONNEVILLE HOLDING COMPANY)
WMET (1150 AM; 50 kW; GAITHERSBURG, MD; Owner: BELTWAY ACQUISITION CORPORATION)
WNST (1570 AM; 5 kW; TOWSON, MD)
WPGC (1580 AM; 50 kW; MORNINGSIDE, MD; Owner: INFINITY WPGC(AM), INC.)
WCAO (600 AM; 5 kW; BALTIMORE, MD; Owner: CITICASTERS LICENSES, L.P.)
Strongest FM radio stations in Dundalk:
WWMX (106.5 FM; BALTIMORE, MD; Owner: INFINITY RADIO OPERATIONS INC.)
WXYV (105.7 FM; CATONSVILLE, MD; Owner: INFINITY RADIO OPERATIONS INC.)
WIYY (97.9 FM; BALTIMORE, MD; Owner: HEARST RADIO, INC.)
WLIF (101.9 FM; BALTIMORE, MD; Owner: INFINITY WLIF, INC.)
WWIN-FM (95.9 FM; GLEN BURNIE, MD; Owner: RADIO ONE LICENSES, LLC)
WPOC (93.1 FM; BALTIMORE, MD; Owner: CITICASTERS LICENSES, L.P.)
WERQ-FM (92.3 FM; BALTIMORE, MD; Owner: RADIO ONE LICENSES, LLC)
WRBS (95.1 FM; BALTIMORE, MD; Owner: PETER & JOHN RADIO FELLOWSHIP, INC.)
WYPR (88.1 FM; BALTIMORE, MD; Owner: WYPR LICENSE HOLDING LLC)
WSMJ (104.3 FM; BALTIMORE, MD; Owner: CITICASTERS LICENSES, L.P.)
WEAA (88.9 FM; BALTIMORE, MD; Owner: MORGAN STATE COLLEGE)
WZBA (100.7 FM; WESTMINSTER, MD; Owner: SHAMROCK COMMUNICATIONS, INC.)
WBJC (91.5 FM; BALTIMORE, MD; Owner: BALTIMORE CITY COMMUNITY COLLEGE)
WQSR (102.7 FM; BALTIMORE, MD; Owner: INFINITY OF CHESAPEAKE LICENSEE CORP.)
WTMD (89.7 FM; TOWSON, MD; Owner: TOWSON UNIVERSITY)
WFSI (107.9 FM; ANNAPOLIS, MD; Owner: FAMILY STATIONS, INC.)
WWDC-FM (101.1 FM; WASHINGTON, DC; Owner: AMFM RADIO LICENSES, L.L.C.)
WRQX (107.3 FM; WASHINGTON, DC; Owner: WMAL, INC.)
WASH (97.1 FM; WASHINGTON, DC; Owner: AMFM RADIO LICENSES, L.L.C.)
WHUR-FM (96.3 FM; WASHINGTON, DC; Owner: THE HOWARD UNIVERSITY)
TV broadcast stations around Dundalk:
WBAL-TV (Channel 11; BALTIMORE, MD; Owner: WBAL HEARST-ARGYLE TV, INC. (CA CORP.))
WMAR-TV (Channel 2; BALTIMORE, MD; Owner: SCRIPPS HOWARD BROADCASTING COMPANY)
WBFF (Channel 45; BALTIMORE, MD; Owner: CHESAPEAKE TELEVISION LICENSEE, LLC)
WNUV (Channel 54; BALTIMORE, MD; Owner: BALTIMORE (WNUV-TV) LICENSEE, INC.)
WJZ-TV (Channel 13; BALTIMORE, MD; Owner: VIACOM INC.)
WUTB (Channel 24; BALTIMORE, MD; Owner: FOX TELEVISION STATIONS, INC.)
WMPB (Channel 67; BALTIMORE, MD; Owner: MARYLAND PUBLIC BROADCASTING COMMISSION)
WMPT (Channel 22; ANNAPOLIS, MD; Owner: MARYLAND PUBLIC BROADCASTING COMMISSION)
W63BP (Channel 63; ANNAPOLIS, MD; Owner: ANNAPOLIS BROADCASTING COMPANY, INC.)
W61BY (Channel 61; ANNAPOLIS, MD; Owner: ANNAPOLIS BROADCASTING COMPANY, INC.)
WTSD-CA (Channel 14; WILMINGTON, DE; Owner: PRIORITY COMMUNICATIONS MINISTRIES, INC.)
WMJF-LP (Channel 16; TOWSON, MD; Owner: TOWSON UNIVERSITY)
WBDC-TV (Channel 50; WASHINGTON, DC; Owner: WBDC BROADCASTING, INC.)
WETA-TV (Channel 26; WASHINGTON, DC; Owner: THE GREATER WASHINGTON ED TELECOMM. ASSOC)
WHUT-TV (Channel 32; WASHINGTON, DC; Owner: HOWARD UNIVERSITY)
National Bridge Inventory (NBI) Statistics 53 Number of bridges1,844ft / 562m Total length $15,286,000 Total costs1,335,202 Total average daily traffic74,215 Total average daily truck traffic
New bridges - historical statistics
1 1930-1939 5 1940-1949 1 1950-1959 20 1960-1969 17 1970-1979 1 1980-1989 8 1990-1999
See full National Bridge Inventory statistics for Dundalk, MD
FCC Registered Antenna Towers: 8 (
See the full list of FCC Registered Antenna Towers in Dundalk )
FCC Registered Broadcast Land Mobile Towers: 8 (
See the full list of FCC Registered Broadcast Land Mobile Towers in Dundalk, MD )
FCC Registered Microwave Towers: 9 (
See the full list of FCC Registered Microwave Towers in this town )
FCC Registered Paging Towers: 1 (
See the full list of FCC Registered Paging Towers )
FCC Registered Maritime Coast & Aviation Ground Towers: 1 (
See the full list of FCC Registered Maritime Coast & Aviation Ground Towers )
FCC Registered Amateur Radio Licenses: 48 (
See the full list of FCC Registered Amateur Radio Licenses in Dundalk )
FAA Registered Aircraft: 1
Aircraft: DJI INSPIRE 1 PRO (Category: Land, Engines: 4), Engine: ElectricN-Number: 184XT, N184XT, N-184XT, Serial Number: W21AC127011845, Certificate Issue Date: 07/06/2016Registrant (Individual): Richard D Jr Adelberg, 692 Wise Ave, Dundalk, MD 21222
Home Mortgage Disclosure Act Aggregated Statistics For Year 2009(Based on 20 full and 1 partial tracts) A) FHA, FSA/RHS & VA B) Conventional C) Refinancings D) Home Improvement Loans E) Loans on Dwellings For 5+ Families F) Non-occupant Loans on G) Loans On Manufactured Number Average Value Number Average Value Number Average Value Number Average Value Number Average Value Number Average Value Number Average Value
LOANS ORIGINATED 353 $151,529 89 $118,475 1,192 $151,510 77 $76,251 1 $2,075,000 116 $127,910 2 $30,160 APPLICATIONS APPROVED, NOT ACCEPTED 12 $145,917 7 $104,714 101 $152,864 13 $57,000 0 $0 7 $102,714 2 $38,710 APPLICATIONS DENIED 43 $154,001 26 $87,284 497 $154,427 60 $36,451 0 $0 29 $105,697 9 $46,800 APPLICATIONS WITHDRAWN 34 $154,265 15 $133,808 326 $155,266 13 $79,500 0 $0 18 $110,111 1 $52,000 FILES CLOSED FOR INCOMPLETENESS 18 $158,774 5 $110,800 116 $161,478 7 $89,286 0 $0 9 $139,556 0 $0
Aggregated Statistics For Year 2008(Based on 20 full and 1 partial tracts) A) FHA, FSA/RHS & VA B) Conventional C) Refinancings D) Home Improvement Loans E) Loans on Dwellings For 5+ Families F) Non-occupant Loans on G) Loans On Manufactured Number Average Value Number Average Value Number Average Value Number Average Value Number Average Value Number Average Value Number Average Value
LOANS ORIGINATED 332 $160,437 203 $138,685 1,186 $146,880 154 $61,359 4 $1,857,750 220 $115,032 7 $41,990 APPLICATIONS APPROVED, NOT ACCEPTED 12 $144,102 29 $118,497 165 $147,193 39 $36,791 1 $2,063,000 18 $104,278 7 $43,060 APPLICATIONS DENIED 45 $177,623 78 $141,914 646 $151,146 133 $55,258 1 $84,000 71 $117,768 10 $37,074 APPLICATIONS WITHDRAWN 29 $173,352 30 $149,720 310 $152,322 32 $85,338 1 $125,000 28 $145,820 0 $0 FILES CLOSED FOR INCOMPLETENESS 4 $156,500 37 $180,061 118 $159,879 14 $91,643 0 $0 73 $172,452 0 $0
Aggregated Statistics For Year 2007(Based on 20 full and 1 partial tracts) A) FHA, FSA/RHS & VA B) Conventional C) Refinancings D) Home Improvement Loans E) Loans on Dwellings For 5+ Families F) Non-occupant Loans on G) Loans On Manufactured Number Average Value Number Average Value Number Average Value Number Average Value Number Average Value Number Average Value Number Average Value
LOANS ORIGINATED 128 $172,041 718 $140,377 1,683 $137,488 242 $73,378 5 $1,129,200 251 $123,148 8 $43,684 APPLICATIONS APPROVED, NOT ACCEPTED 1 $135,000 85 $140,042 277 $135,460 50 $52,182 0 $0 36 $127,886 8 $44,814 APPLICATIONS DENIED 19 $171,316 201 $132,494 1,040 $146,974 186 $60,874 1 $50,000 90 $120,581 18 $40,237 APPLICATIONS WITHDRAWN 12 $157,417 89 $149,326 608 $141,221 42 $95,936 0 $0 45 $111,857 2 $23,500 FILES CLOSED FOR INCOMPLETENESS 0 $0 38 $144,785 151 $151,468 12 $76,879 0 $0 18 $135,019 0 $0
Aggregated Statistics For Year 2006(Based on 20 full and 1 partial tracts) A) FHA, FSA/RHS & VA B) Conventional C) Refinancings D) Home Improvement Loans E) Loans on Dwellings For 5+ Families F) Non-occupant Loans on G) Loans On Manufactured Number Average Value Number Average Value Number Average Value Number Average Value Number Average Value Number Average Value Number Average Value
LOANS ORIGINATED 131 $155,363 1,339 $110,431 2,298 $123,924 339 $70,198 3 $510,500 397 $101,811 14 $43,300 APPLICATIONS APPROVED, NOT ACCEPTED 10 $144,500 125 $108,571 330 $119,683 52 $44,643 0 $0 39 $117,077 5 $31,998 APPLICATIONS DENIED 12 $150,250 344 $101,199 1,196 $124,533 189 $67,880 1 $135,000 111 $102,697 14 $42,999 APPLICATIONS WITHDRAWN 9 $145,778 120 $142,492 1,023 $123,525 55 $110,574 1 $37,000 36 $142,971 0 $0 FILES CLOSED FOR INCOMPLETENESS 1 $281,000 64 $116,584 246 $132,479 12 $75,250 0 $0 17 $137,715 0 $0
Aggregated Statistics For Year 2005(Based on 20 full and 1 partial tracts) A) FHA, FSA/RHS & VA B) Conventional C) Refinancings D) Home Improvement Loans E) Loans on Dwellings For 5+ Families F) Non-occupant Loans on G) Loans On Manufactured Number Average Value Number Average Value Number Average Value Number Average Value Number Average Value Number Average Value Number Average Value
LOANS ORIGINATED 141 $119,841 1,328 $96,131 2,198 $112,725 280 $67,696 0 $0 389 $86,309 15 $33,133 APPLICATIONS APPROVED, NOT ACCEPTED 5 $98,642 111 $93,676 319 $104,872 54 $32,457 0 $0 42 $88,810 8 $57,786 APPLICATIONS DENIED 9 $112,000 287 $91,421 1,192 $106,223 216 $49,540 0 $0 75 $98,842 22 $42,660 APPLICATIONS WITHDRAWN 16 $136,666 199 $109,248 1,253 $113,439 92 $111,907 3 $148,667 55 $109,487 5 $36,384 FILES CLOSED FOR INCOMPLETENESS 2 $71,000 44 $104,767 190 $118,113 18 $56,944 0 $0 17 $106,529 1 $97,000
Aggregated Statistics For Year 2004(Based on 20 full and 1 partial tracts) A) FHA, FSA/RHS & VA B) Conventional C) Refinancings D) Home Improvement Loans E) Loans on Dwellings For 5+ Families F) Non-occupant Loans on G) Loans On Manufactured Number Average Value Number Average Value Number Average Value Number Average Value Number Average Value Number Average Value Number Average Value
LOANS ORIGINATED 286 $99,208 760 $87,335 1,570 $93,123 157 $44,015 1 $400,000 240 $71,836 12 $28,553 APPLICATIONS APPROVED, NOT ACCEPTED 12 $84,672 68 $86,561 354 $90,808 49 $36,165 1 $30,000 30 $73,433 4 $56,500 APPLICATIONS DENIED 23 $101,503 162 $79,682 1,204 $88,611 296 $52,427 0 $0 78 $56,779 16 $50,322 APPLICATIONS WITHDRAWN 22 $93,903 77 $95,078 1,024 $99,734 44 $45,507 0 $0 29 $72,542 4 $65,073 FILES CLOSED FOR INCOMPLETENESS 4 $96,750 33 $104,379 136 $106,741 17 $33,694 0 $0 7 $84,000 0 $0
Aggregated Statistics For Year 2003(Based on 20 full and 1 partial tracts) A) FHA, FSA/RHS & VA B) Conventional C) Refinancings D) Home Improvement Loans E) Loans on Dwellings For 5+ Families F) Non-occupant Loans on Number Average Value Number Average Value Number Average Value Number Average Value Number Average Value Number Average Value
LOANS ORIGINATED 397 $94,861 480 $82,247 2,229 $87,408 99 $25,013 0 $0 217 $62,954 APPLICATIONS APPROVED, NOT ACCEPTED 11 $83,574 39 $75,961 348 $84,999 42 $17,504 0 $0 23 $70,910 APPLICATIONS DENIED 25 $95,679 74 $77,225 1,039 $84,073 103 $19,133 0 $0 47 $67,961 APPLICATIONS WITHDRAWN 25 $100,940 55 $92,355 899 $92,872 17 $42,674 0 $0 28 $70,299 FILES CLOSED FOR INCOMPLETENESS 5 $98,106 8 $97,375 115 $83,447 0 $0 1 $108,000 7 $51,644
Aggregated Statistics For Year 2002(Based on 19 full and 1 partial tracts) A) FHA, FSA/RHS & VA B) Conventional C) Refinancings D) Home Improvement Loans E) Loans on Dwellings For 5+ Families F) Non-occupant Loans on Number Average Value Number Average Value Number Average Value Number Average Value Number Average Value Number Average Value
LOANS ORIGINATED 398 $87,572 280 $82,141 1,174 $85,129 86 $20,013 1 $370,000 107 $60,993 APPLICATIONS APPROVED, NOT ACCEPTED 15 $112,321 29 $74,223 203 $81,589 23 $11,304 0 $0 10 $55,500 APPLICATIONS DENIED 30 $88,857 62 $67,916 656 $78,533 87 $17,176 0 $0 31 $61,763 APPLICATIONS WITHDRAWN 27 $85,749 35 $75,556 558 $85,553 17 $26,118 0 $0 13 $60,766 FILES CLOSED FOR INCOMPLETENESS 10 $76,500 7 $74,684 77 $82,792 1 $7,900 0 $0 6 $60,000
Aggregated Statistics For Year 2001(Based on 19 full and 1 partial tracts) A) FHA, FSA/RHS & VA B) Conventional C) Refinancings D) Home Improvement Loans E) Loans on Dwellings For 5+ Families F) Non-occupant Loans on Number Average Value Number Average Value Number Average Value Number Average Value Number Average Value Number Average Value
LOANS ORIGINATED 410 $86,194 251 $73,980 1,044 $80,276 86 $16,001 0 $0 83 $61,566 APPLICATIONS APPROVED, NOT ACCEPTED 10 $95,231 42 $72,202 178 $69,321 35 $19,447 0 $0 15 $52,059 APPLICATIONS DENIED 23 $92,360 92 $55,301 773 $64,593 109 $15,024 1 $375,000 27 $53,251 APPLICATIONS WITHDRAWN 35 $95,983 37 $74,947 414 $79,224 22 $34,796 0 $0 10 $55,783 FILES CLOSED FOR INCOMPLETENESS 7 $81,286 8 $77,125 63 $83,270 2 $23,000 0 $0 1 $74,000
Aggregated Statistics For Year 2000(Based on 19 full and 1 partial tracts) A) FHA, FSA/RHS & VA B) Conventional C) Refinancings D) Home Improvement Loans F) Non-occupant Loans on Number Average Value Number Average Value Number Average Value Number Average Value Number Average Value
LOANS ORIGINATED 349 $82,039 252 $72,914 442 $65,374 128 $17,586 65 $51,847 APPLICATIONS APPROVED, NOT ACCEPTED 4 $78,982 38 $62,114 140 $63,682 62 $17,693 16 $59,000 APPLICATIONS DENIED 25 $77,755 103 $61,606 555 $58,465 212 $19,296 36 $62,222 APPLICATIONS WITHDRAWN 37 $91,990 38 $72,953 263 $64,441 29 $27,142 14 $41,446 FILES CLOSED FOR INCOMPLETENESS 3 $71,000 13 $67,216 48 $70,408 1 $15,000 3 $64,667
Aggregated Statistics For Year 1999(Based on 17 full and 5 partial tracts) A) FHA, FSA/RHS & VA B) Conventional C) Refinancings D) Home Improvement Loans F) Non-occupant Loans on Number Average Value Number Average Value Number Average Value Number Average Value Number Average Value
LOANS ORIGINATED 373 $81,879 222 $70,293 886 $66,622 175 $16,871 88 $50,850 APPLICATIONS APPROVED, NOT ACCEPTED 11 $89,886 33 $65,173 298 $66,459 60 $15,524 8 $68,194 APPLICATIONS DENIED 26 $93,127 90 $61,630 640 $64,894 179 $15,482 34 $59,174 APPLICATIONS WITHDRAWN 27 $81,309 48 $76,235 306 $63,814 27 $29,339 14 $45,924 FILES CLOSED FOR INCOMPLETENESS 6 $92,943 10 $60,474 83 $66,104 8 $34,089 6 $42,927
Detailed mortgage data for all 21 tracts in Dundalk, MD
Private Mortgage Insurance Companies Aggregated Statistics For Year 2009(Based on 17 full and 1 partial tracts) A) Conventional B) Refinancings C) Non-occupant Loans on Number Average Value Number Average Value Number Average Value
LOANS ORIGINATED 8 $154,012 13 $164,541 0 $0 APPLICATIONS APPROVED, NOT ACCEPTED 9 $169,889 7 $151,429 1 $119,000 APPLICATIONS DENIED 2 $131,000 6 $163,193 0 $0 APPLICATIONS WITHDRAWN 0 $0 3 $196,837 0 $0 FILES CLOSED FOR INCOMPLETENESS 1 $154,000 1 $238,000 0 $0
Aggregated Statistics For Year 2008(Based on 20 full and 1 partial tracts) A) Conventional B) Refinancings C) Non-occupant Loans on Number Average Value Number Average Value Number Average Value
LOANS ORIGINATED 94 $164,278 76 $192,939 14 $128,357 APPLICATIONS APPROVED, NOT ACCEPTED 40 $163,833 42 $192,510 9 $113,667 APPLICATIONS DENIED 18 $141,681 6 $172,333 12 $117,417 APPLICATIONS WITHDRAWN 6 $197,000 3 $163,333 0 $0 FILES CLOSED FOR INCOMPLETENESS 3 $122,477 2 $194,000 2 $100,715
Aggregated Statistics For Year 2007(Based on 20 full and 1 partial tracts) A) Conventional B) Refinancings C) Non-occupant Loans on Number Average Value Number Average Value Number Average Value
LOANS ORIGINATED 343 $163,270 142 $184,131 39 $131,125 APPLICATIONS APPROVED, NOT ACCEPTED 47 $163,574 25 $177,320 6 $105,667 APPLICATIONS DENIED 11 $141,273 6 $206,500 5 $129,000 APPLICATIONS WITHDRAWN 17 $172,488 16 $164,250 4 $135,750 FILES CLOSED FOR INCOMPLETENESS 1 $170,000 0 $0 0 $0
Aggregated Statistics For Year 2006(Based on 20 full and 1 partial tracts) A) Conventional B) Refinancings C) Non-occupant Loans on Number Average Value Number Average Value Number Average Value
LOANS ORIGINATED 227 $147,624 115 $148,345 33 $102,121 APPLICATIONS APPROVED, NOT ACCEPTED 33 $159,852 28 $146,096 4 $102,500 APPLICATIONS DENIED 1 $138,250 2 $189,500 0 $0 APPLICATIONS WITHDRAWN 14 $130,643 9 $180,064 5 $128,400 FILES CLOSED FOR INCOMPLETENESS 0 $0 0 $0 0 $0
Aggregated Statistics For Year 2005(Based on 20 full and 1 partial tracts) A) Conventional B) Refinancings C) Non-occupant Loans on Number Average Value Number Average Value Number Average Value
LOANS ORIGINATED 225 $122,771 140 $129,728 44 $83,531 APPLICATIONS APPROVED, NOT ACCEPTED 22 $122,414 31 $136,145 9 $106,444 APPLICATIONS DENIED 2 $142,500 0 $0 0 $0 APPLICATIONS WITHDRAWN 14 $124,714 12 $113,000 5 $81,800 FILES CLOSED FOR INCOMPLETENESS 1 $93,000 3 $129,333 1 $93,000
Aggregated Statistics For Year 2004(Based on 20 full and 1 partial tracts) A) Conventional B) Refinancings C) Non-occupant Loans on Number Average Value Number Average Value Number Average Value
LOANS ORIGINATED 241 $101,421 144 $107,788 56 $71,696 APPLICATIONS APPROVED, NOT ACCEPTED 26 $106,808 35 $102,036 7 $76,857 APPLICATIONS DENIED 3 $78,333 2 $85,000 2 $71,000 APPLICATIONS WITHDRAWN 12 $89,333 6 $105,167 0 $0 FILES CLOSED FOR INCOMPLETENESS 2 $88,000 2 $120,000 1 $135,000
Aggregated Statistics For Year 2003(Based on 20 full and 1 partial tracts) A) Conventional B) Refinancings C) Non-occupant Loans on Number Average Value Number Average Value Number Average Value
LOANS ORIGINATED 174 $88,411 272 $102,100 53 $61,491 APPLICATIONS APPROVED, NOT ACCEPTED 24 $81,733 68 $110,137 8 $46,625 APPLICATIONS DENIED 4 $137,750 7 $100,429 3 $64,333 APPLICATIONS WITHDRAWN 13 $102,923 23 $88,718 4 $62,750 FILES CLOSED FOR INCOMPLETENESS 1 $45,820 0 $0 0 $0
Aggregated Statistics For Year 2002(Based on 19 full and 1 partial tracts) A) Conventional B) Refinancings C) Non-occupant Loans on Number Average Value Number Average Value Number Average Value
LOANS ORIGINATED 126 $89,564 167 $97,825 31 $66,320 APPLICATIONS APPROVED, NOT ACCEPTED 21 $94,224 36 $98,815 4 $52,500 APPLICATIONS DENIED 6 $71,667 8 $126,372 3 $88,667 APPLICATIONS WITHDRAWN 5 $76,600 20 $101,660 3 $52,063 FILES CLOSED FOR INCOMPLETENESS 0 $0 0 $0 0 $0
Aggregated Statistics For Year 2001(Based on 19 full and 1 partial tracts) A) Conventional B) Refinancings C) Non-occupant Loans on Number Average Value Number Average Value Number Average Value
LOANS ORIGINATED 81 $94,721 116 $96,593 13 $58,308 APPLICATIONS APPROVED, NOT ACCEPTED 12 $96,128 24 $99,257 5 $71,800 APPLICATIONS DENIED 5 $71,800 13 $105,185 4 $54,000 APPLICATIONS WITHDRAWN 0 $0 5 $87,076 0 $0 FILES CLOSED FOR INCOMPLETENESS 0 $0 1 $122,000 0 $0
Aggregated Statistics For Year 2000(Based on 19 full and 1 partial tracts) A) Conventional B) Refinancings C) Non-occupant Loans on Number Average Value Number Average Value Number Average Value
LOANS ORIGINATED 72 $95,506 60 $92,035 20 $52,633 APPLICATIONS APPROVED, NOT ACCEPTED 4 $104,365 14 $85,777 0 $0 APPLICATIONS DENIED 1 $50,000 5 $162,642 1 $50,000 APPLICATIONS WITHDRAWN 1 $66,000 0 $0 0 $0 FILES CLOSED FOR INCOMPLETENESS 0 $0 1 $69,000 1 $69,000
Aggregated Statistics For Year 1999(Based on 17 full and 5 partial tracts) A) Conventional B) Refinancings C) Non-occupant Loans on Number Average Value Number Average Value Number Average Value
LOANS ORIGINATED 64 $85,343 108 $85,784 15 $47,853 APPLICATIONS APPROVED, NOT ACCEPTED 3 $81,173 18 $91,101 2 $106,500 APPLICATIONS DENIED 5 $124,344 6 $77,558 3 $61,137 APPLICATIONS WITHDRAWN 1 $69,940 1 $82,990 0 $0 FILES CLOSED FOR INCOMPLETENESS 0 $0 1 $81,170 0 $0
Most common first names in Dundalk, MD among deceased individuals Name Count Lived (average)
John 781 71.4 years William 672 70.8 years Mary 643 76.7 years James 484 69.1 years Joseph 446 71.6 years Charles 433 72.1 years George 372 71.5 years Robert 372 67.2 years Anna 321 79.0 years Margaret 303 76.4 years
Most common last names in Dundalk, MD among deceased individuals Last name Count Lived (average)
Smith 164 70.5 years Miller 122 71.8 years Jones 109 73.4 years Davis 88 70.9 years Johnson 77 69.9 years Brown 76 72.2 years Williams 66 68.5 years Harris 62 70.9 years White 58 72.0 years Wilson 57 74.5 years
Dundalk compared to Maryland state average:
Median household income below state average. Median house value below state average. Unemployed percentage significantly below state average. Median age above state average. Foreign-born population percentage below state average. House age above state average. Percentage of population with a bachelor's degree or higher below state average.
#3 on the list of "Top 101 cities with largest percentage of males in occupations: installation, maintenance, and repair occupations (population 50,000+)"
#8 on the list of "Top 101 cities with largest percentage of females in occupations: office and administrative support occupations (population 50,000+)"
#21 on the list of "Top 101 cities with the most people born in the same U.S. state as the city (population 50,000+)"
#22 on the list of "Top 101 cities with the least people having Master's or Doctorate degrees (population 50,000+)"
#30 on the list of "Top 101 cities with largest percentage of females in occupations: construction and extraction occupations (population 50,000+)"
#32 on the list of "Top 101 cities with largest percentage of males in occupations: construction and extraction occupations (population 50,000+)"
#33 on the list of "Top 101 cities with the least people having Doctorate degrees (population 50,000+)"
#37 on the list of "Top 101 cities with the lowest percentage of workers working at home, population 50,000+"
#38 on the list of "Top 101 cities with largest percentage population decreases in the 1990s) (population 50,000+)"
#39 on the list of "Top 101 cities with largest percentage of females in occupations: fire fighting and prevention workers including supervisors (population 50,000+)"
#49 on the list of "Top 101 cities with largest percentage of males in industries: construction (population 50,000+)"
#51 on the list of "Top 101 cities with largest percentage of males in occupations: law enforcement workers including supervisors (population 50,000+)"
#59 on the list of "Top 101 cities with the largest percentage of unmarried partner households (population 50,000+)"
#59 on the list of "Top 101 cities with the smallest precipitation differences during a year (population 50,000+)"
#59 on the list of "Top 101 cities with largest percentage of females in industries: construction (population 50,000+)"
#60 on the list of "Top 101 cities with largest percentage of females in industries: retail trade (population 50,000+)"
#70 on the list of "Top 101 cities with the least people having professional degrees (population 50,000+)"
#70 on the list of "Top 101 cities with the smallest percentage of one, detached housing units in structures (20,000+ housing units)"
#73 on the list of "Top 100 least-educated cities (pop. 50,000+)"
#74 on the list of "Top 101 cities where residents moved in more then 10 years ago (10,000+ households)"
#14 on the list of "Top 101 counties with the highest surface withdrawal of fresh water for public supply"
#15 on the list of "Top 101 counties with the largest increase in the number of births per 1000 residents 2000-2006 to 2007-2013 (pop 50,000+)"
#22 on the list of "Top 101 counties with the highest total withdrawal of fresh water for public supply"
#29 on the list of "Top 101 counties with the most Black Protestant adherents"
#35 on the list of "Top 101 counties with the lowest ground withdrawal of fresh water for public supply (pop. 50,000+)"
Top Patent Applicants
Edward W. Ott, Jr. (2)
Zhong-Xing Jiang (2)
Patrick Mishler (1)
Patrick C. Mishler (1)
Matt Szarek (1)
Matthew P. Szarek (1)
Adam Gluck (1)
Christine Pratcher (1)
Kenneth Edward Hibbard (1)
Matthew Thomas Poch (1)
Total of 18 patent applications in 2008-2024.
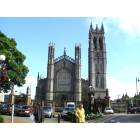

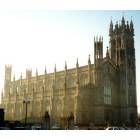


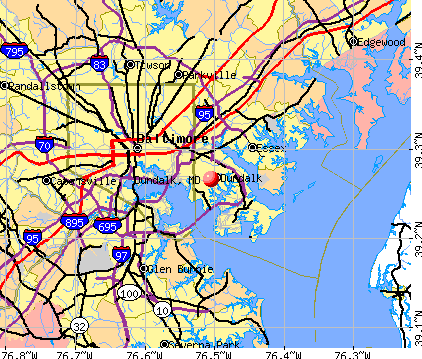


 Recent articles from our blog. Our writers, many of them Ph.D. graduates or candidates, create easy-to-read articles on a wide variety of topics.


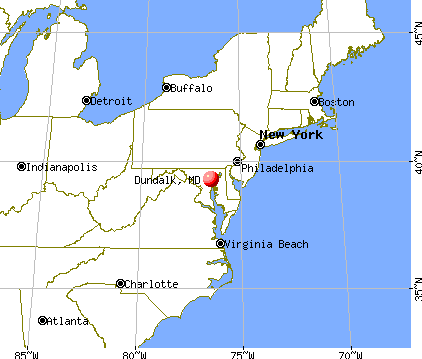
 (6.7 miles
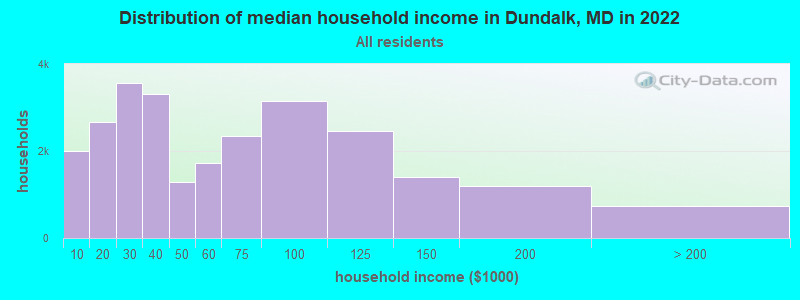
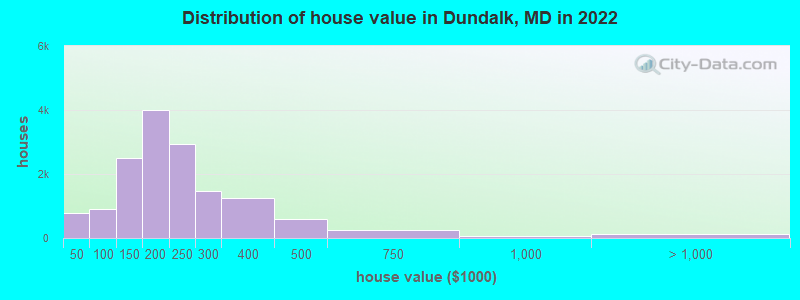

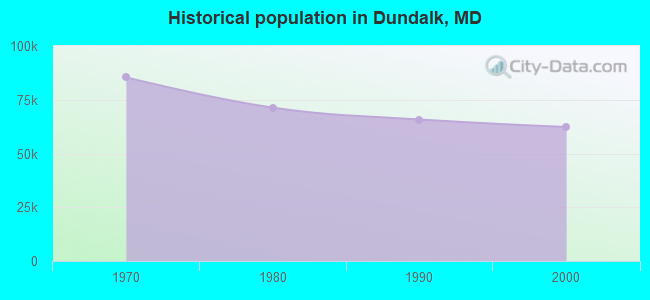
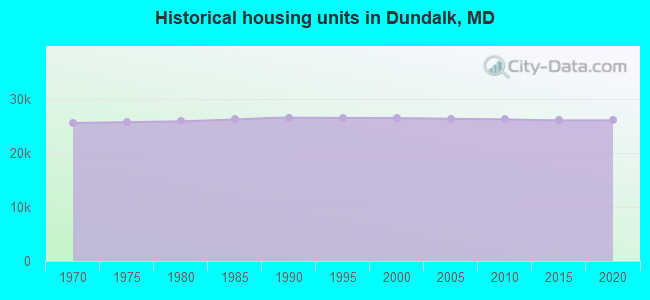
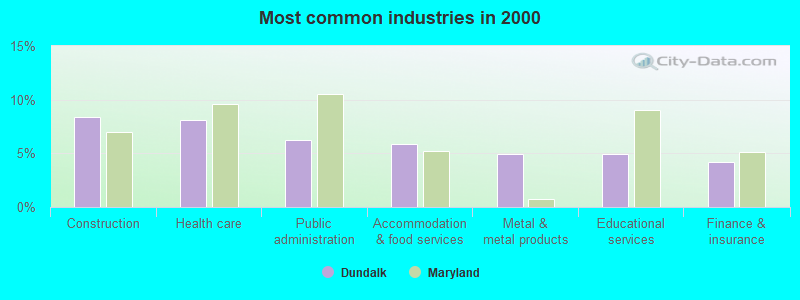

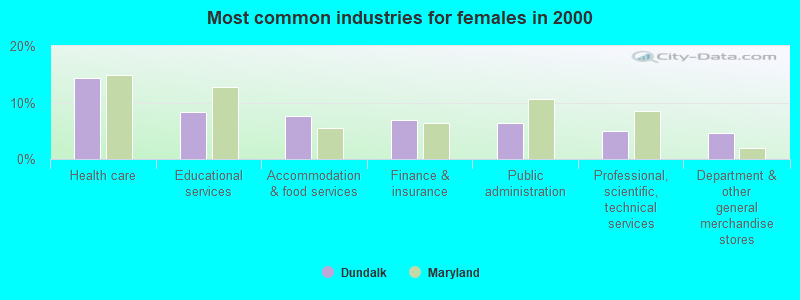
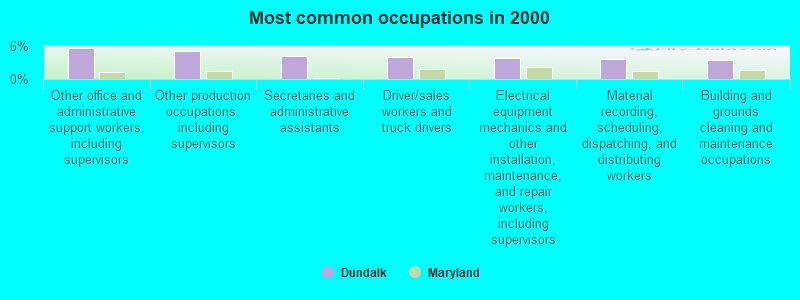
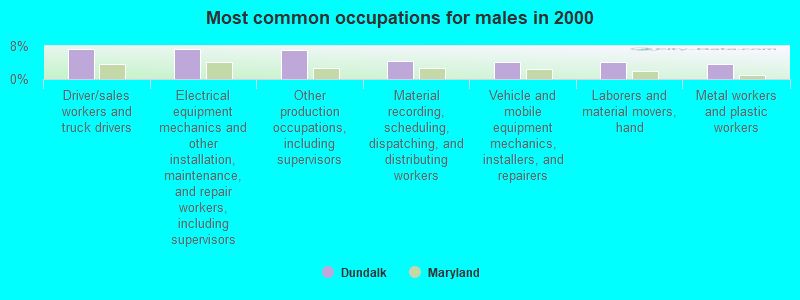
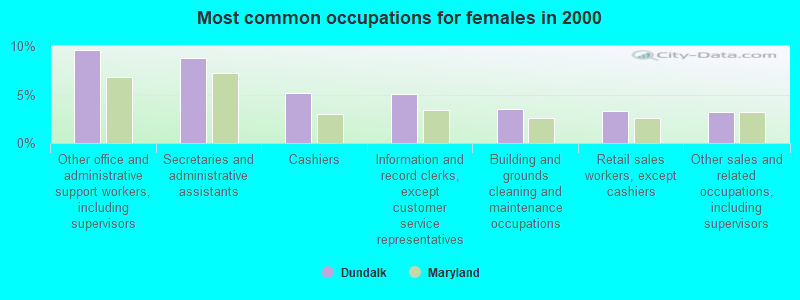
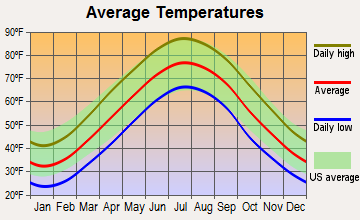
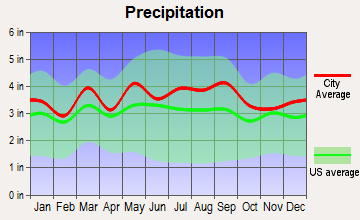
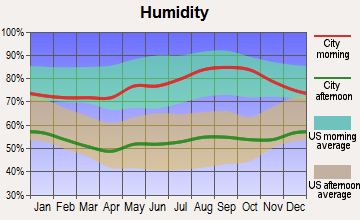
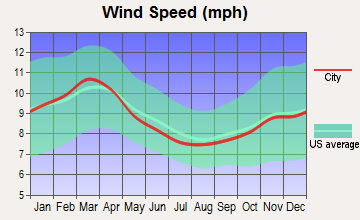
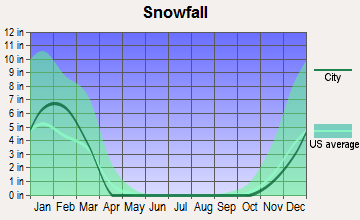
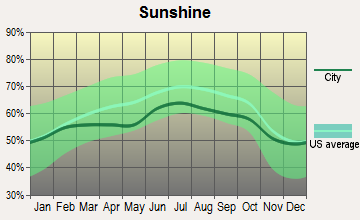
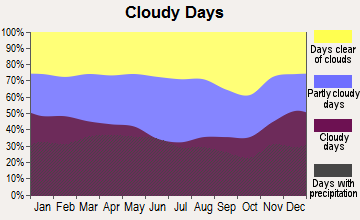
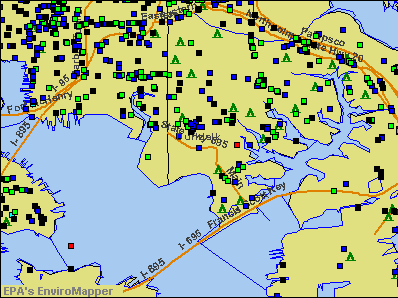

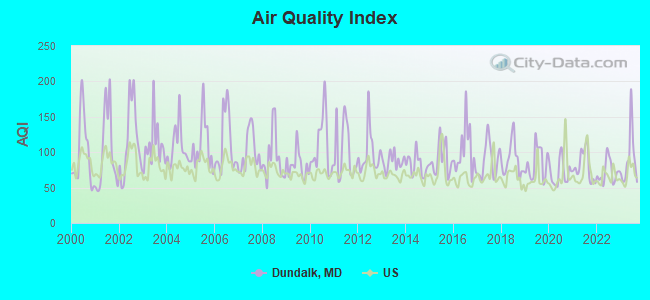
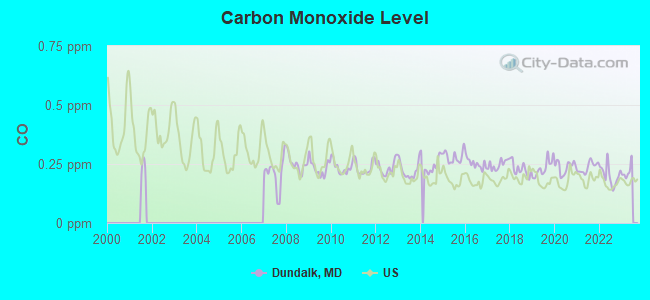
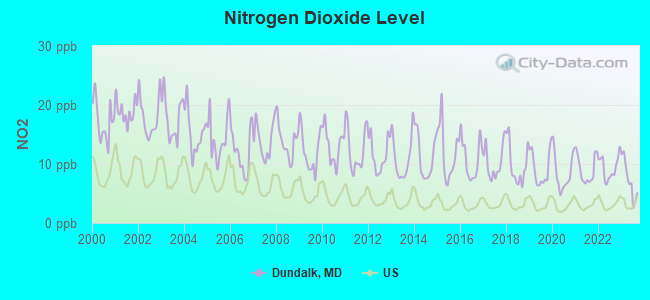

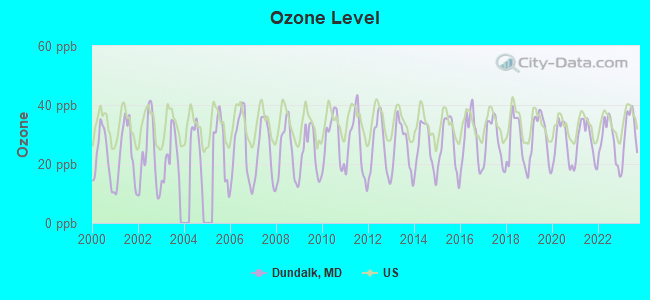
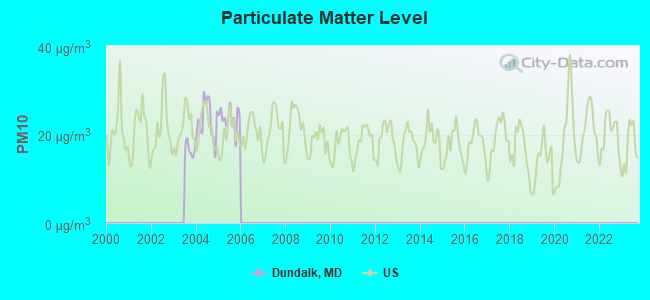
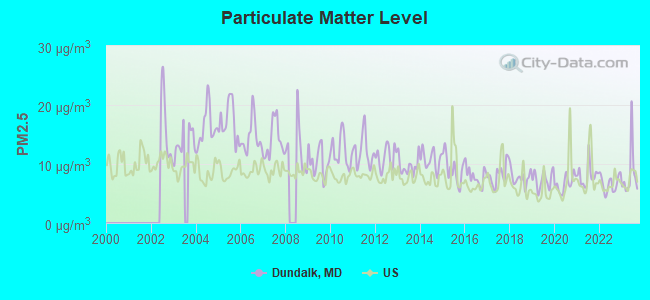
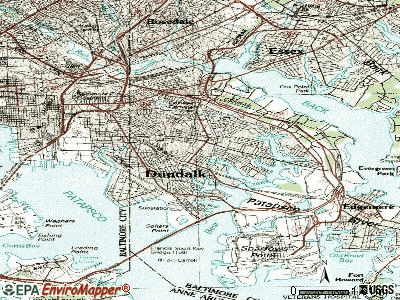
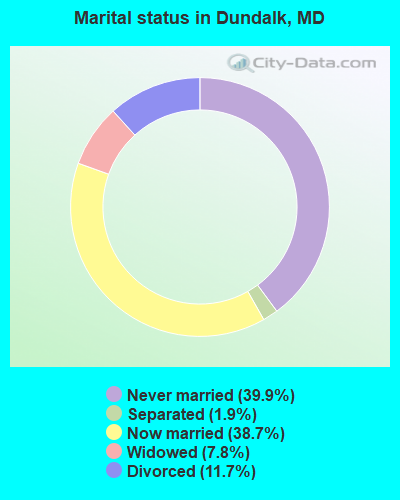
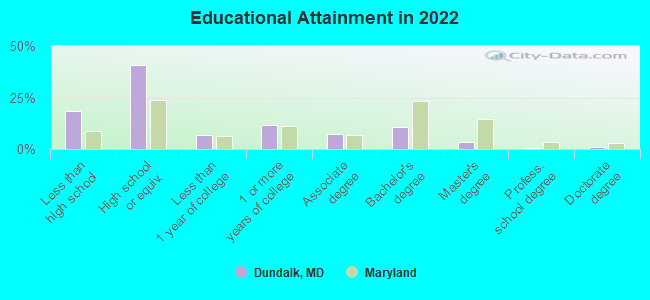
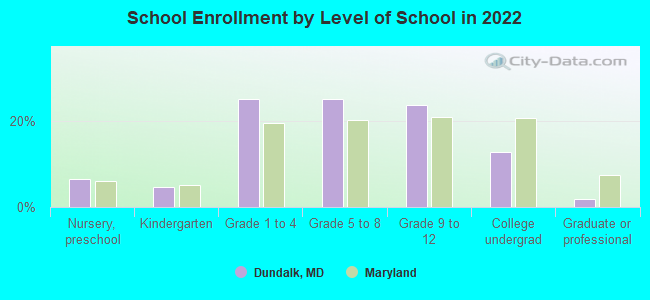
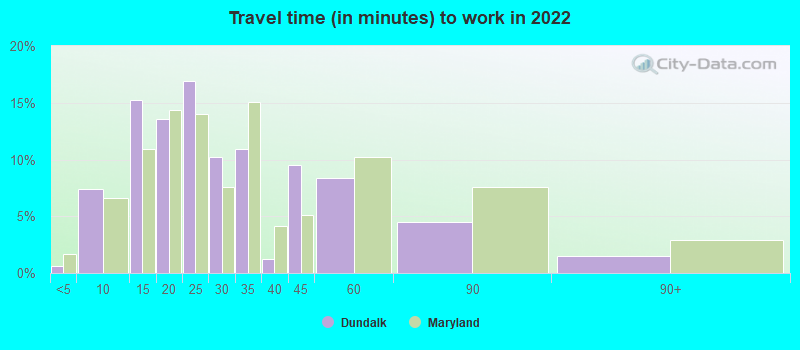
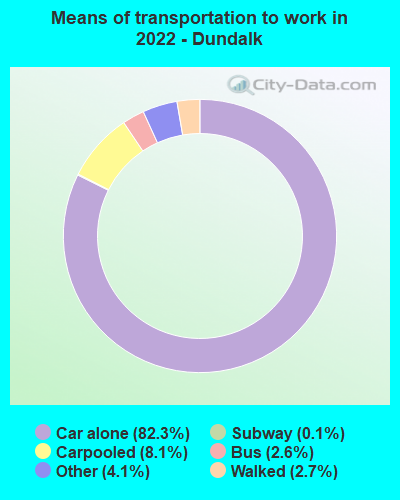
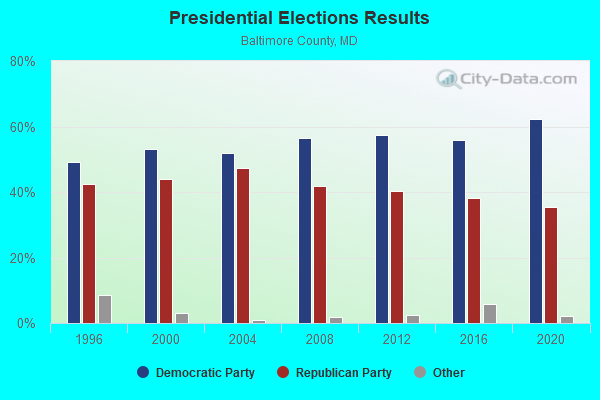
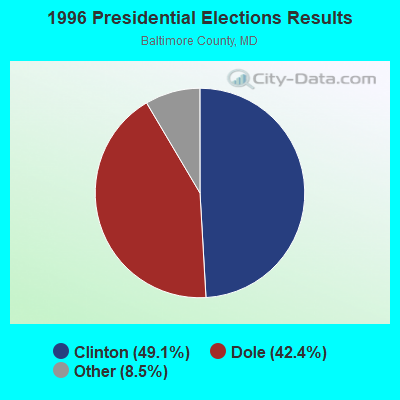
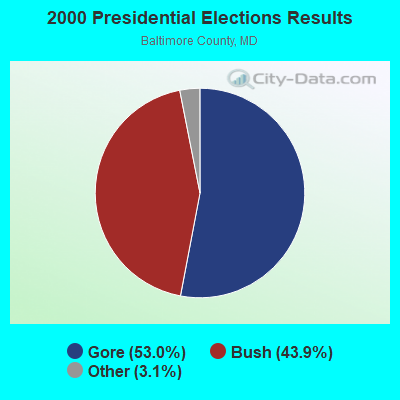
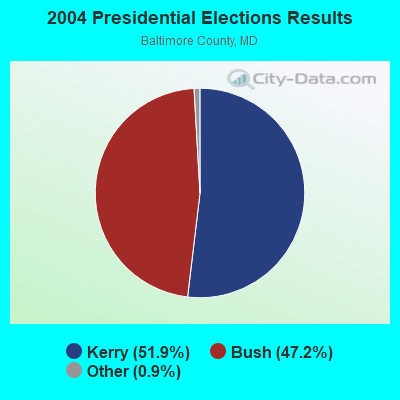

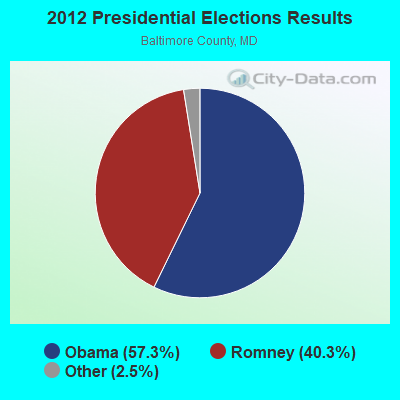
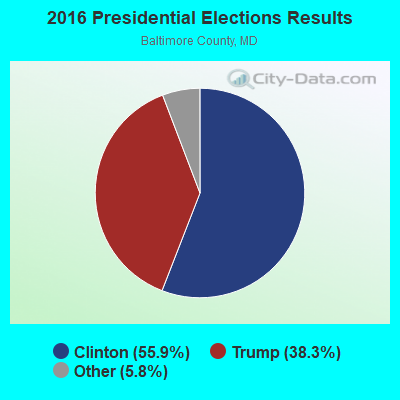
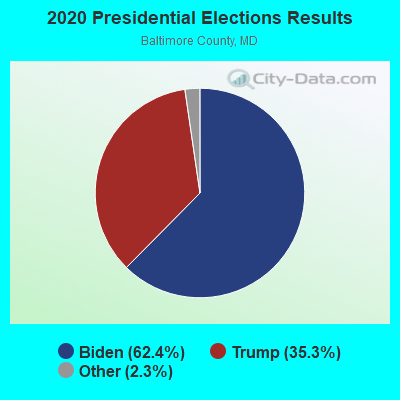
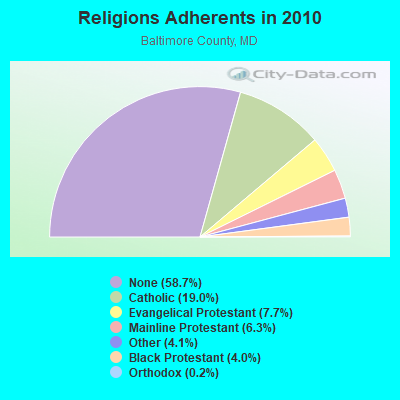
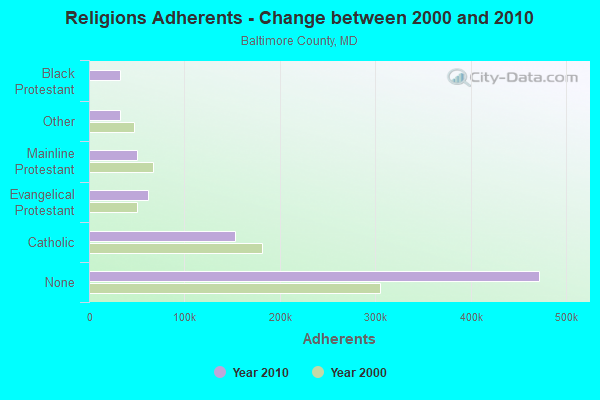
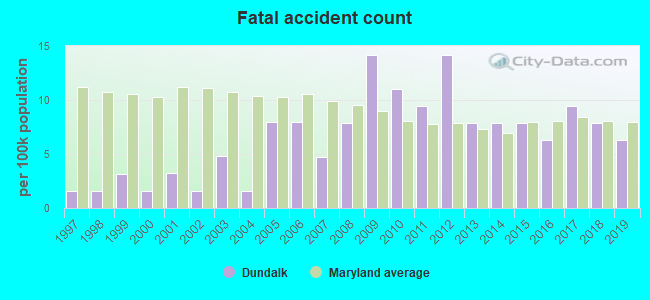
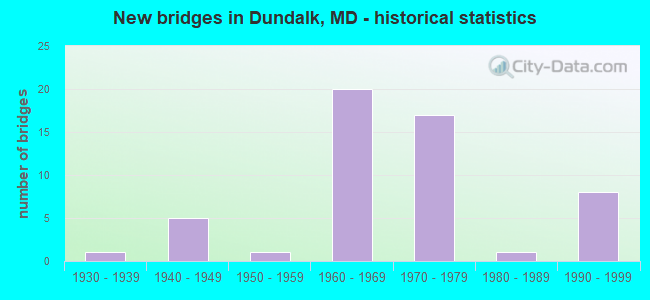
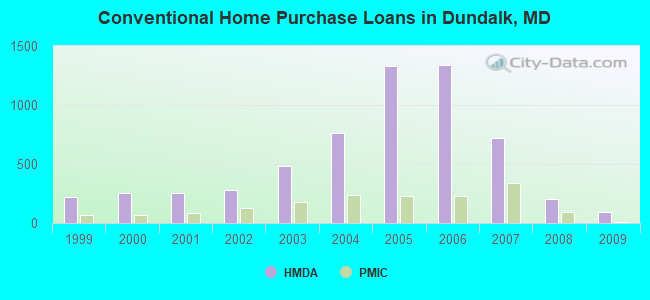
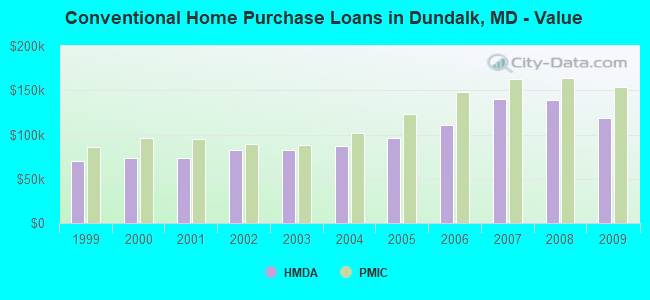
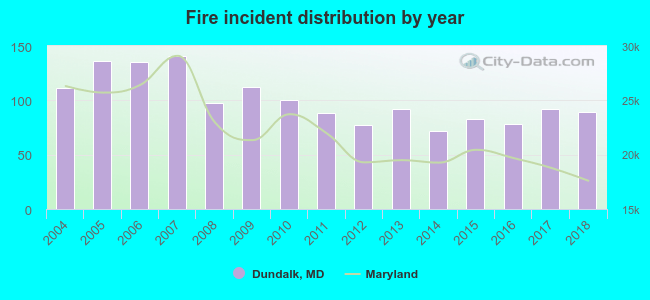 Based on the data from the years 2004 - 2018 the average number of fires per year is 100. The highest number of fires - 141 took place in 2007, and the least - 72 in 2014. The data has a decreasing trend.
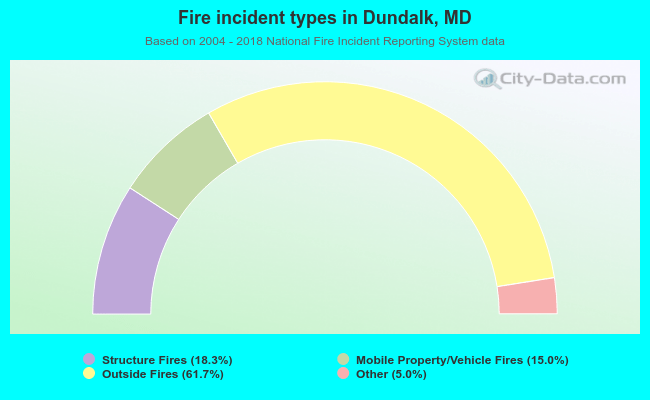 When looking into fire subcategories, the most reports belonged to: Outside Fires (61.7%), and Structure Fires (18.3%).