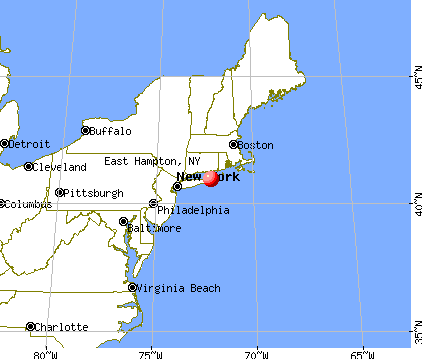
East Hampton, New York
East Hampton: Fishnet. East Hampton.NY

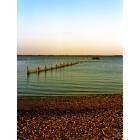
East Hampton: Sunset, Winter 2005
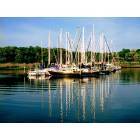
East Hampton: Three Mile Harbor. East Hampton.NY

East Hampton: Landscape.East Hampton.NY

East Hampton: Hook mill

East Hampton: Hook mill

East Hampton: in the smart trip, on the principal street
- add
your


Submit your own pictures of this village and show them to the world
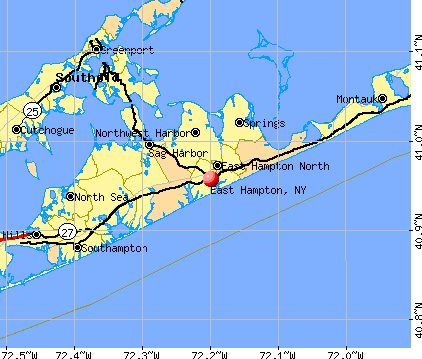
- OSM Map
- General Map
- Google Map
- MSN Map
Population change since 2000: +14.8%
| Males: 766 | |
| Females: 765 |
| Median resident age: | 57.7 years |
| New York median age: | 40.0 years |
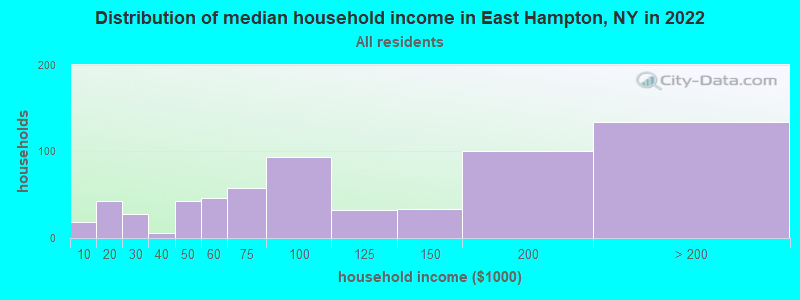
| East Hampton: | $92,326 |
| NY: | $79,557 |
Estimated per capita income in 2022: $113,701 (it was $51,316 in 2000)
East Hampton village income, earnings, and wages data
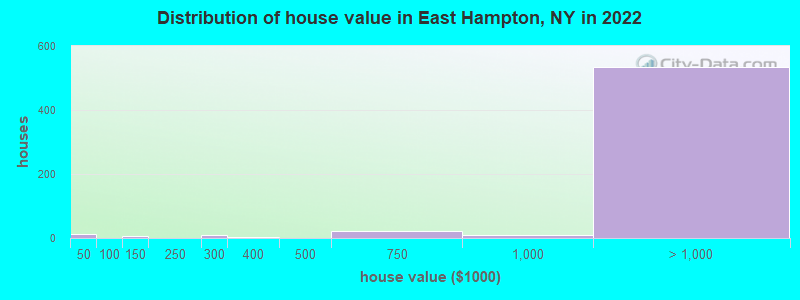
Estimated median house or condo value in 2022: over $1,000,000 (it was $657,300 in 2000)
| East Hampton: | over $1,000,000 |
| NY: | $400,400 |
Mean prices in 2022: all housing units: over $1,000,000; detached houses: over $1,000,000; townhouses or other attached units: over $1,000,000
Median gross rent in 2022: $1,837.
(11.3% for White Non-Hispanic residents, 11.6% for Hispanic or Latino residents, 5.7% for two or more races residents)
Detailed information about poverty and poor residents in East Hampton, NY


Compare current foreclosures near East Hampton, NY:
| Photo | Address | Area | Beds / Baths | Price | Details |
|---|---|---|---|---|---|

|
#1
N Woods Ln
East Hampton, NY 11937
|
- sq. feet
|
2 baths 3 beds |
$1,250,000
|
show details |

|
#2
Hands Creek Rd
East Hampton, NY 11937
|
- sq. feet
|
- baths 3 beds |
show details | |

|
#3
W End Ave
East Hampton, NY 11937
|
- sq. feet
|
- baths - beds |
show details | |

|
#4
N Main St
East Hampton, NY 11937
|
- sq. feet
|
- baths - beds |
show details | |

|
#5
Redwood Rd
Sag Harbor, NY 11963
|
2,010 sq. feet
|
2 baths 3 beds |
$1,716,000
|
show details |

|
#6
N Sea Rd
Southampton, NY 11968
|
1,913 sq. feet
|
3 baths 4 beds |
$999,990
|
show details |

|
#7
Spring Close Hwy
East Hampton, NY 11937
|
- sq. feet
|
- baths - beds |
show details | |

|
#8
Hands Creek Rd
East Hampton, NY 11937
|
- sq. feet
|
- baths - beds |
show details | |

|
#9
Bonac Wood Ln
East Hampton, NY 11937
|
- sq. feet
|
- baths - beds |
show details | |

|
#10
Sycamore Dr
East Hampton, NY 11937
|
- sq. feet
|
- baths - beds |
show details |
| Photo | Address | Area | Beds / Baths | Price | Details |
|---|---|---|---|---|---|

|
#11
Springs Fireplace Rd
East Hampton, NY 11937
|
- sq. feet
|
- baths - beds |
show details | |

|
#12
Woodcock Ln
East Hampton, NY 11937
|
- sq. feet
|
- baths - beds |
show details | |

|
#13
Fred’s Lane
Shelter Island, NY 11964
|
3,116 sq. feet
|
4 baths 5 beds |
show details | |

|
#14
Montauk Hwy
Southampton, NY 11968
|
1,890 sq. feet
|
2 baths 2 beds |
show details | |

|
#15
Montauk Hwy
Southampton, NY 11968
|
2,076 sq. feet
|
2 baths 3 beds |
show details | |

|
#16
New Lane Aka 5 New Lane Road
Southampton, NY 11968
|
4,809 sq. feet
|
6 baths 5 beds |
show details | |

|
#17
Miller Rd
Southampton, NY 11968
|
- sq. feet
|
2 baths 4 beds |
show details | |

|
#18
Little Fresh Pond Rd
Southampton, NY 11968
|
2,060 sq. feet
|
2 baths 3 beds |
show details | |

|
#19
Locust Woods Drive
Shelter Island, NY 11964
|
3,856 sq. feet
|
4 baths 4 beds |
show details | |

|
#20
Freds Ln
Shelter Island, NY 11964
|
3,116 sq. feet
|
4 baths 5 beds |
show details |
| Photo | Address | Area | Beds / Baths | Price | Details |
|---|---|---|---|---|---|

|
#21
Osprey Rd
Shelter Island, NY 11964
|
3,484 sq. feet
|
3 baths 4 beds |
show details | |

|
#22
Devonshire Ln
Amagansett, NY 11930
|
3,300 sq. feet
|
5 baths 4 beds |
show details | |

|
#23
Hampton Rd Apt 16
Southampton, NY 11968
|
1,468 sq. feet
|
3 baths 2 beds |
show details | |

|
#24
Locust Woods Dr
Shelter Island, NY 11964
|
3,856 sq. feet
|
4 baths 4 beds |
show details | |

|
#25
Jermain Ave
Sag Harbor, NY 11963
|
1,904 sq. feet
|
3 baths 3 beds |
show details | |

|
#26
Cliff Dr
Sag Harbor, NY 11963
|
2,395 sq. feet
|
2 baths 5 beds |
show details | |

|
#27
Redwood Rd
Sag Harbor, NY 11963
|
1,586 sq. feet
|
2 baths 3 beds |
show details | |

|
#28
Main St
Sag Harbor, NY 11963
|
2,840 sq. feet
|
2 baths 4 beds |
show details | |

|
#29
New Ln
Southampton, NY 11968
|
4,806 sq. feet
|
- baths 4 beds |
show details | |

|
#30
Main Rd
Cutchogue, NY 11935
|
- sq. feet
|
- baths - beds |
show details |
| Photo | Address | Area | Beds / Baths | Price | Details |
|---|---|---|---|---|---|

|
#31
Gansett Ln
Amagansett, NY 11930
|
- sq. feet
|
- baths - beds |
show details | |

|
#32
Sebonac Rd
Southampton, NY 11968
|
- sq. feet
|
- baths - beds |
show details | |

|
#33
Bishops Ln
Southampton, NY 11968
|
- sq. feet
|
- baths - beds |
show details | |

|
#34
Shore Rd
Southampton, NY 11968
|
- sq. feet
|
- baths - beds |
show details | |

|
#35
N Ferry Rd
Shelter Island, NY 11964
|
- sq. feet
|
- baths - beds |
show details | |

|
#36
Thistle Patch Ln
Sag Harbor, NY 11963
|
- sq. feet
|
- baths - beds |
show details | |

|
#37
Gin Ln
Southampton, NY 11968
|
- sq. feet
|
- baths - beds |
show details | |

|
#38
Deerfield Rd
Water Mill, NY 11976
|
- sq. feet
|
- baths - beds |
show details | |

|
#39
Bay Haven Ln
Southold, NY 11971
|
- sq. feet
|
- baths - beds |
show details | |

|
#40
N Sea Rd
Southampton, NY 11968
|
- sq. feet
|
- baths - beds |
show details |
| Photo | Address | Area | Beds / Baths | Price | Details |
|---|---|---|---|---|---|

|
#41
Little Neck Rd
Cutchogue, NY 11935
|
- sq. feet
|
- baths - beds |
show details | |

|
#42
Peconic Ln
Peconic, NY 11958
|
- sq. feet
|
- baths - beds |
show details | |

|
#43
Bridge Ln
Cutchogue, NY 11935
|
- sq. feet
|
- baths - beds |
show details | |

|
#44
County Road 48
Cutchogue, NY 11935
|
- sq. feet
|
- baths - beds |
show details | |

|
Check over 1 million property listings on Foreclosure.com!
|
browse all offers | |||


- 98877.8%White alone
- 17914.1%Hispanic
- 423.3%Two or more races
- 312.4%Black alone
- 80.6%Asian alone
- 50.4%Other race alone
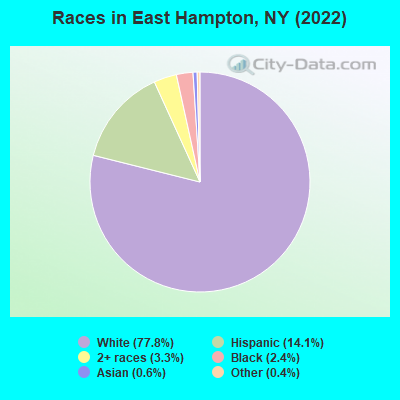
Races in East Hampton detailed stats: ancestries, foreign born residents, place of birth
According to our research of New York and other state lists, there were 2 registered sex offenders living in East Hampton, New York as of April 19, 2024.
The ratio of all residents to sex offenders in East Hampton is 608 to 1.
Type |
2009 |
2010 |
2011 |
2012 |
2013 |
2014 |
2015 |
2016 |
2017 |
2018 |
2019 |
2020 |
2022 |
|---|---|---|---|---|---|---|---|---|---|---|---|---|---|
| Murders (per 100,000) | 0 (0.0) | 0 (0.0) | 0 (0.0) | 0 (0.0) | 0 (0.0) | 0 (0.0) | 0 (0.0) | 0 (0.0) | 0 (0.0) | 0 (0.0) | 0 (0.0) | 0 (0.0) | 0 (0.0) |
| Rapes (per 100,000) | 0 (0.0) | 1 (92.3) | 0 (0.0) | 0 (0.0) | 0 (0.0) | 1 (90.3) | 0 (0.0) | 0 (0.0) | 0 (0.0) | 0 (0.0) | 0 (0.0) | 0 (0.0) | 0 (0.0) |
| Robberies (per 100,000) | 1 (71.4) | 0 (0.0) | 1 (91.9) | 1 (91.5) | 0 (0.0) | 0 (0.0) | 0 (0.0) | 0 (0.0) | 0 (0.0) | 0 (0.0) | 0 (0.0) | 0 (0.0) | 0 (0.0) |
| Assaults (per 100,000) | 8 (571.4) | 2 (184.7) | 0 (0.0) | 0 (0.0) | 0 (0.0) | 0 (0.0) | 0 (0.0) | 0 (0.0) | 1 (89.2) | 1 (88.5) | 0 (0.0) | 1 (87.7) | 1 (65.3) |
| Burglaries (per 100,000) | 11 (785.7) | 10 (923.4) | 7 (643.4) | 1 (91.5) | 4 (362.3) | 4 (361.0) | 5 (446.4) | 4 (354.0) | 4 (356.8) | 2 (177.0) | 2 (177.1) | 2 (175.4) | 1 (65.3) |
| Thefts (per 100,000) | 94 (6,714) | 123 (11,357) | 73 (6,710) | 78 (7,136) | 60 (5,435) | 56 (5,054) | 46 (4,107) | 42 (3,717) | 45 (4,014) | 31 (2,743) | 30 (2,657) | 19 (1,667) | 30 (1,960) |
| Auto thefts (per 100,000) | 2 (142.9) | 4 (369.3) | 2 (183.8) | 1 (91.5) | 2 (181.2) | 1 (90.3) | 1 (89.3) | 2 (177.0) | 0 (0.0) | 2 (177.0) | 2 (177.1) | 2 (175.4) | 2 (130.6) |
| Arson (per 100,000) | 0 (0.0) | 0 (0.0) | 0 (0.0) | 0 (0.0) | 0 (0.0) | 0 (0.0) | 0 (0.0) | 0 (0.0) | 0 (0.0) | 0 (0.0) | 0 (0.0) | 0 (0.0) | 0 (0.0) |
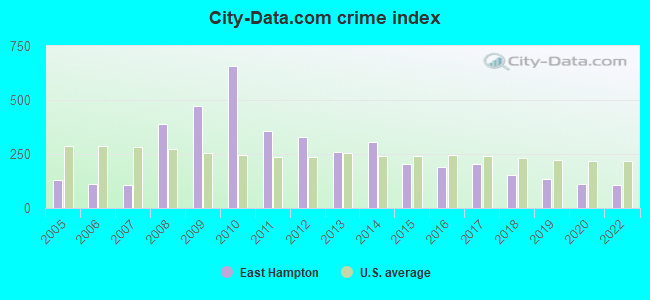
| City-Data.com crime index | 470.7 | 659.3 | 355.7 | 326.6 | 257.2 | 306.9 | 202.7 | 187.6 | 203.4 | 154.0 | 132.9 | 110.5 | 106.5 |
The City-Data.com crime index weighs serious crimes and violent crimes more heavily. Higher means more crime, U.S. average is 246.1. It adjusts for the number of visitors and daily workers commuting into cities.
Crime rate in East Hampton detailed stats: murders, rapes, robberies, assaults, burglaries, thefts, arson
Full-time law enforcement employees in 2021, including police officers: 89 (63 officers - 54 male; 9 female).
| Officers per 1,000 residents here: | 3.15 |
| New York average: | 3.28 |
 Recent articles from our blog. Our writers, many of them Ph.D. graduates or candidates, create easy-to-read articles on a wide variety of topics.


 | What bridges were elevated in East Hampton recently? (1 reply) |
| Hamptons Bachelorette (33 replies) |
| Greenport or Sag Harbor areas? (25 replies) |
| Long Island reported the highest gain in home sales in 2021 (32 replies) |
| Can anyone recommend a reputable lockmith near East Hampton? (2 replies) |
| Top 10 most expensive Long Island home sales of 2022 (2 replies) |
Latest news from East Hampton, NY collected exclusively by city-data.com from local newspapers, TV, and radio stations
East Hampton, NY City Guides:
Ancestries: English (11.1%), Russian (9.9%), American (7.4%), Eastern European (7.4%), Irish (6.0%), German (4.5%).
Current Local Time: EST time zone
Incorporated in 1920
Elevation: 36 feet
Land area: 4.76 square miles.
Population density: 322 people per square mile (very low).
258 residents are foreign born (9.7% Latin America, 7.2% Europe, 3.0% Africa).
| This village: | 20.3% |
| New York: | 22.6% |
Median real estate property taxes paid for housing units with mortgages in 2022: $10,001 (0.4%)
Median real estate property taxes paid for housing units with no mortgage in 2022: $7,955 (0.4%)
Nearest city with pop. 50,000+: New Haven, CT  (45.0 miles , pop. 123,626).
Nearest city with pop. 200,000+: North Hempstead, NY (77.8 miles , pop. 222,611).
Nearest city with pop. 1,000,000+: Queens, NY (86.5 miles , pop. 2,229,379).
Nearest cities:
), ), ), ), ), Latitude: 40.96 N, Longitude: 72.20 W
Daytime population change due to commuting: +5,244 (+412.6%)
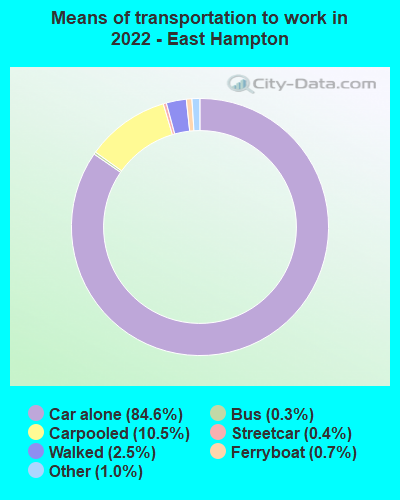
Workers who live and work in this village: 329 (58.3%)
Area code: 631
East Hampton tourist attractions:
East Hampton, New York accommodation & food services, waste management - Economy and Business Data
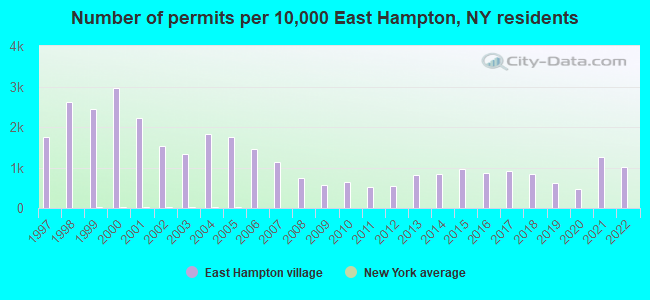
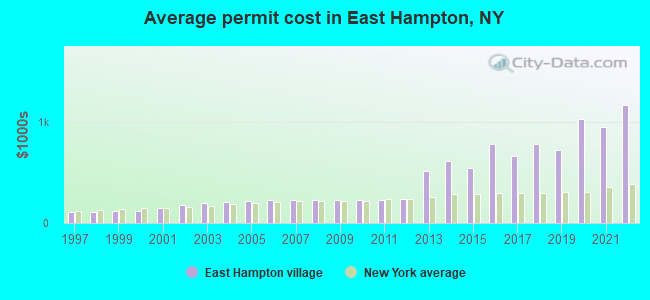
Single-family new house construction building permits:
- 2022: 135 buildings, average cost: $1,173,800
- 2021: 169 buildings, average cost: $958,200
- 2020: 63 buildings, average cost: $1,030,600
- 2019: 83 buildings, average cost: $726,300
- 2018: 111 buildings, average cost: $788,100
- 2017: 123 buildings, average cost: $667,700
- 2016: 115 buildings, average cost: $788,800
- 2015: 130 buildings, average cost: $550,400
- 2014: 111 buildings, average cost: $618,100
- 2013: 108 buildings, average cost: $519,500
- 2012: 74 buildings, average cost: $241,600
- 2011: 68 buildings, average cost: $225,100
- 2010: 87 buildings, average cost: $225,100
- 2009: 77 buildings, average cost: $225,100
- 2008: 98 buildings, average cost: $225,100
- 2007: 153 buildings, average cost: $225,200
- 2006: 196 buildings, average cost: $224,700
- 2005: 235 buildings, average cost: $214,000
- 2004: 243 buildings, average cost: $204,500
- 2003: 178 buildings, average cost: $202,300
- 2002: 204 buildings, average cost: $174,200
- 2001: 297 buildings, average cost: $152,700
- 2000: 394 buildings, average cost: $118,000
- 1999: 327 buildings, average cost: $116,000
- 1998: 349 buildings, average cost: $112,500
- 1997: 233 buildings, average cost: $110,800
| Here: | 3.7% |
| New York: | 4.4% |
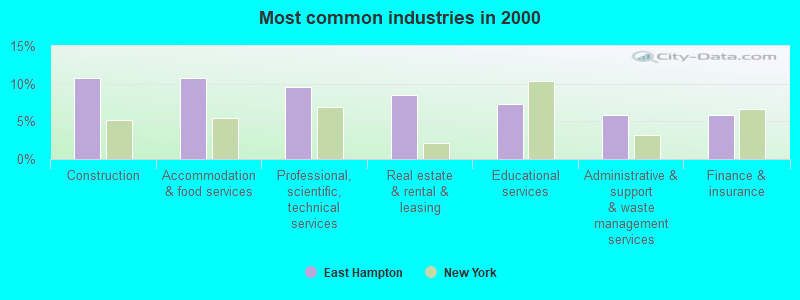
- Construction (10.8%)
- Accommodation & food services (10.8%)
- Professional, scientific, technical services (9.5%)
- Real estate & rental & leasing (8.6%)
- Educational services (7.3%)
- Administrative & support & waste management services (5.9%)
- Finance & insurance (5.9%)
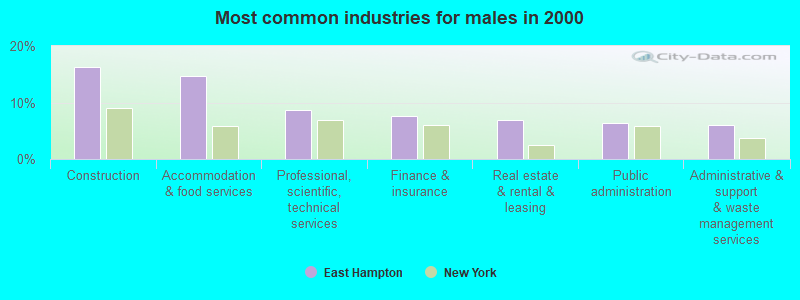
- Construction (16.3%)
- Accommodation & food services (14.7%)
- Professional, scientific, technical services (8.7%)
- Finance & insurance (7.6%)
- Real estate & rental & leasing (6.8%)
- Public administration (6.3%)
- Administrative & support & waste management services (6.0%)
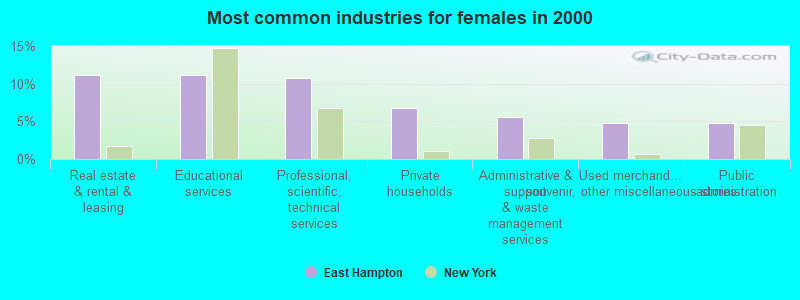
- Real estate & rental & leasing (11.2%)
- Educational services (11.2%)
- Professional, scientific, technical services (10.8%)
- Private households (6.8%)
- Administrative & support & waste management services (5.6%)
- Used merchandise, gift, novelty, souvenir, other miscellaneous stores (4.8%)
- Public administration (4.8%)
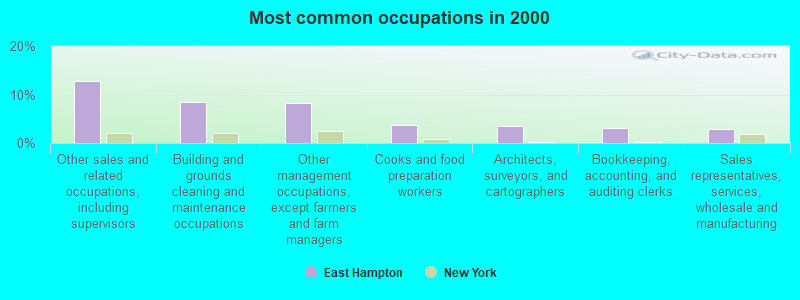
- Other sales and related occupations, including supervisors (12.8%)
- Building and grounds cleaning and maintenance occupations (8.4%)
- Other management occupations, except farmers and farm managers (8.2%)
- Cooks and food preparation workers (3.8%)
- Architects, surveyors, and cartographers (3.5%)
- Bookkeeping, accounting, and auditing clerks (3.0%)
- Sales representatives, services, wholesale and manufacturing (2.9%)
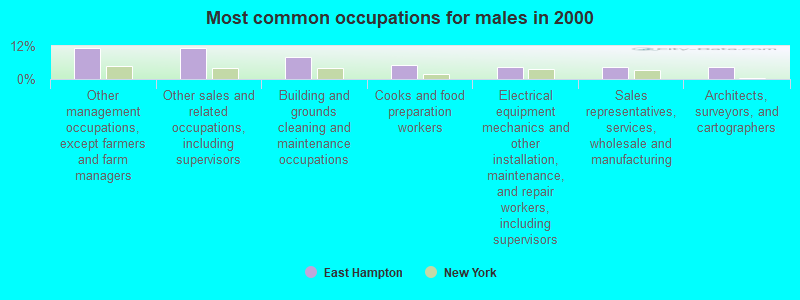
- Other management occupations, except farmers and farm managers (11.3%)
- Other sales and related occupations, including supervisors (11.3%)
- Building and grounds cleaning and maintenance occupations (8.1%)
- Cooks and food preparation workers (5.2%)
- Electrical equipment mechanics and other installation, maintenance, and repair workers, including supervisors (4.2%)
- Sales representatives, services, wholesale and manufacturing (4.2%)
- Architects, surveyors, and cartographers (4.2%)
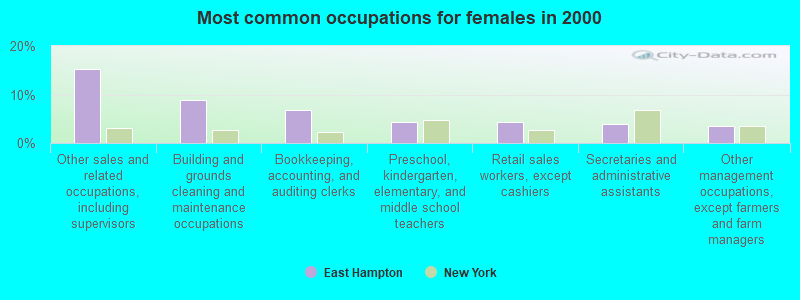
- Other sales and related occupations, including supervisors (15.2%)
- Building and grounds cleaning and maintenance occupations (8.8%)
- Bookkeeping, accounting, and auditing clerks (6.8%)
- Preschool, kindergarten, elementary, and middle school teachers (4.4%)
- Retail sales workers, except cashiers (4.4%)
- Secretaries and administrative assistants (4.0%)
- Other management occupations, except farmers and farm managers (3.6%)
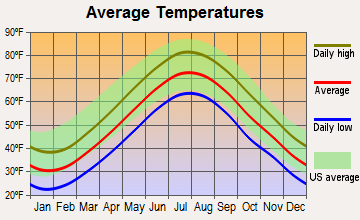
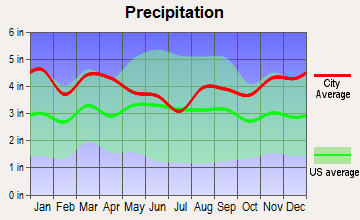
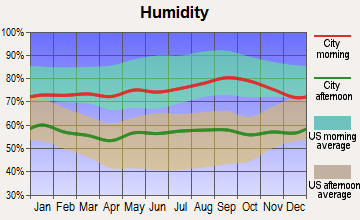
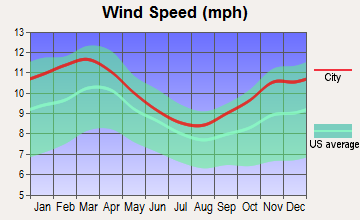
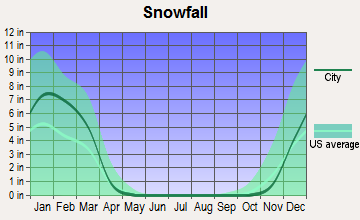
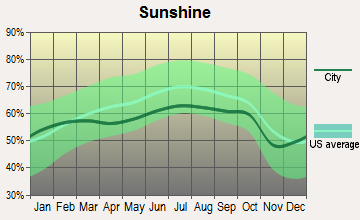
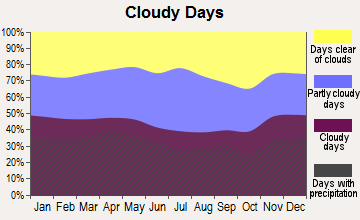
Average climate in East Hampton, New York
Based on data reported by over 4,000 weather stations
|
|


Tornado activity:
East Hampton-area historical tornado activity is slightly below New York state average. It is 72% smaller than the overall U.S. average.
On 7/10/1989, a category F4 (max. wind speeds 207-260 mph) tornado 45.2 miles away from the East Hampton village center injured 40 people and caused between $50,000,000 and $500,000,000 in damages.
On 8/8/1999, a category F2 (max. wind speeds 113-157 mph) tornado 14.5 miles away from the village center injured one person and caused $1 million in damages.
Earthquake activity:
East Hampton-area historical earthquake activity is significantly above New York state average. It is 73% smaller than the overall U.S. average.On 10/7/1983 at 10:18:46, a magnitude 5.3 (5.1 MB, 5.3 LG, 5.1 ML, Class: Moderate, Intensity: VI - VII) earthquake occurred 234.3 miles away from the city center
On 4/20/2002 at 10:50:47, a magnitude 5.3 (5.3 ML, Depth: 3.0 mi) earthquake occurred 257.4 miles away from the city center
On 8/22/1992 at 12:20:32, a magnitude 4.8 (4.8 MB, 3.8 MS, 4.7 LG, Depth: 6.2 mi, Class: Light, Intensity: IV - V) earthquake occurred 162.2 miles away from the city center
On 4/20/2002 at 10:50:47, a magnitude 5.2 (5.2 MB, 4.2 MS, 5.2 MW, 5.0 MW) earthquake occurred 256.1 miles away from East Hampton center
On 8/23/2011 at 17:51:04, a magnitude 5.8 (5.8 MW, Depth: 3.7 mi) earthquake occurred 371.9 miles away from the city center
On 1/19/1982 at 00:14:42, a magnitude 4.7 (4.5 MB, 4.7 MD, 4.5 LG) earthquake occurred 178.5 miles away from East Hampton center
Magnitude types: regional Lg-wave magnitude (LG), body-wave magnitude (MB), duration magnitude (MD), local magnitude (ML), surface-wave magnitude (MS), moment magnitude (MW)
Natural disasters:
The number of natural disasters in Suffolk County (28) is a lot greater than the US average (15).Major Disasters (Presidential) Declared: 19
Emergencies Declared: 7
Causes of natural disasters: Hurricanes: 9, Floods: 7, Storms: 7, Snowstorms: 4, Winter Storms: 3, Blizzards: 2, Heavy Rain: 1, Power Outage: 1, Tropical Depression: 1, Tropical Storm: 1, Water Shortage: 1, Other: 3 (Note: some incidents may be assigned to more than one category).

Hospitals and medical centers in East Hampton:
Other hospitals and medical centers near East Hampton:
- SOUTHAMPTON CARE CENTER (Nursing Home, about 11 miles away; SOUTHAMPTON, NY)
- SOUTHAMPTON HOSPITAL Acute Care Hospitals (about 11 miles away; SOUTHAMPTON, NY)
- THE HAMPTONS CENTER FOR REHABILITATION AND NURSING (Nursing Home, about 12 miles away; SOUTH HAMPTON, NY)
- INDEPENDENT GROUP HOME LIVING PROGRAM, INC (Hospital, about 13 miles away; SOUTH HAMPTON, NY)
- EASTERN LONG ISLAND HOSPITAL Acute Care Hospitals (about 14 miles away; GREENPORT, NY)
- AID TO THE DEVELOPMENTALLY DISABLED, INC (Hospital, about 15 miles away; CUTCHOGUE, NY)
Airports and heliports located in East Hampton:
- East Hampton Airport (HTO) (Runways: 2, Itinerant Ops: 15,322, Local Ops: 9,708, Military Ops: 50)
- Bistrians Heliport (4NY5)
Colleges/universities with over 2000 students nearest to East Hampton:
- Connecticut College (about 30 miles; New London, CT; Full-time enrollment: 2,068)
- Three Rivers Community College (about 39 miles; Norwich, CT; FT enrollment: 2,897)
- Gateway Community College (about 45 miles; New Haven, CT; FT enrollment: 4,672)
- Yale University (about 46 miles; New Haven, CT; FT enrollment: 13,121)
- Suffolk County Community College (about 46 miles; Selden, NY; FT enrollment: 18,540)
- University of New Haven (about 46 miles; West Haven, CT; FT enrollment: 6,205)
- Southern Connecticut State University (about 47 miles; New Haven, CT; FT enrollment: 8,708)
Public high school in East Hampton:
- EAST HAMPTON HIGH SCHOOL (Students: 948, Location: 2 LONG LN, Grades: 9-12)
Public elementary/middle schools in East Hampton:
- SPRINGS SCHOOL (Students: 641, Location: 48 SCHOOL ST, Grades: PK-8)
- JOHN M MARSHALL ELEMENTARY SCHOOL (Students: 524, Location: 3 GINGERBREAD LN, Grades: KG-5)
- EAST HAMPTON MIDDLE SCHOOL (Students: 346, Location: 76 NEWTOWN LN, Grades: 6-8)
Library in East Hampton:
- EAST HAMPTON LIBRARY (Operating income: $2,090,725; Location: 159 MAIN STREET; 94,122 books; 4,881 e-books; 7,952 audio materials; 6,412 video materials; 42 local licensed databases; 14 state licensed databases; 3 other licensed databases; 111 print serial subscriptions; 10,470 electronic serial subscriptions)
User-submitted facts and corrections:
- Radio station in East Hampton, NY: WPKM(88.7 FM; MONTAUK, NY; Owner: WPKN INC.)
Points of interest:
Notable locations in East Hampton: Hook Windmill (A), Maidstone Club West Course (B), Maidstone Club East Course (C), Hayground Windmill (D), East Hampton Village Hall (E), East Hampton Library (F), Home Sweet Home Museum (G), Osborn - Jackson House Museum (H). Display/hide their locations on the map
Churches in East Hampton include: First United Methodist Church (A), Most Holy Trinity Church (B), Saint Luke Episcopal Church (C), First Presbyterian Church (D). Display/hide their locations on the map
Cemeteries: North End Cemetery (1), Jericho Cemetery (2), South End Cemetery (3), Saint Luke's Memorial Garden (4). Display/hide their locations on the map
Lakes: Lily Pond (A), Town Pond (B), Hook Pond (C). Display/hide their locations on the map
Parks in East Hampton include: Fulling Mill Farm Preserve (1), Mulford House and Farm (2), Briar Patch Road Historic District (3), Buell's Lane Historic District (4), Egypt Lane Historic District (5), Jones Road Historic District (6), North Main Street Historic District (7), Pantigo Road Historic District (8). Display/hide their locations on the map
Beach: East Hampton Beach (A). Display/hide its location on the map
Tourist attractions: East Hampton Historical Society Inc - Mulford Farm Museum (Cultural Attractions- Events- & Facilities; 10 James Lane), East Hampton Historical Society Inc (Cultural Attractions- Events- & Facilities; Main Street).
Hotels: Centennial House (13 Woods Lane), Bassett House Inn (128 Montauk Highway), Accommodations Plus (172 Newtown Lane), Dutch Motel (488 Montauk Hwy), East Hampton House (226 Montauk Hwy), East Hampton Inn (488 Montauk Highway Rear), East Hampton Village Greenery (156 Montauk Highway).
Drinking water stations with addresses in East Hampton and their reported violations in the past:
HAMPTON RAQUET(FNA GREEN HOLLOW TENNIS C (Population served: 120, Groundwater):Past health violations:FRESH POND ROAD PARK & BEACH (Address: 159B Pantigo Road , Population served: 100, Groundwater):
- MCL, Monthly (TCR) - Between OCT-2006 and DEC-2006, Contaminant: Coliform. Follow-up actions: St Formal NOV issued (2 times from OCT-30-2006 to OCT-30-2006), St Public Notif requested (2 times from OCT-30-2006 to OCT-30-2006), St Compliance achieved (JUN-23-2007)
Past health violations:MAIDSTONE HARBOR MARINA/HARBOR BISTRO (Population served: 100, Groundwater):
- MCL, Monthly (TCR) - Between JUL-2008 and SEP-2008, Contaminant: Coliform. Follow-up actions: St Formal NOV issued (AUG-19-2008), St Public Notif requested (AUG-19-2008), St Compliance achieved (JUL-16-2009)
Past health violations:EAST HAMPTON POINT (Population served: 100, Groundwater):Past monitoring violations:
- MCL, Acute (TCR) - In SEP-2013, Contaminant: Coliform. Follow-up actions: St Public Notif requested (SEP-19-2013), St Formal NOV issued (SEP-19-2013), St Compliance achieved (MAR-31-2014)
- One routine major monitoring violation
Past monitoring violations:GARDINERS MARINA (Population served: 60, Groundwater):
- One routine major monitoring violation
Past health violations:MONTAUK TENNIS COURTS (E.HAMPTON TOWN) (Population served: 30, Groundwater):
- MCL, Monthly (TCR) - Between JUL-2008 and SEP-2008, Contaminant: Coliform. Follow-up actions: St Formal NOV issued (JUL-24-2008), St Public Notif requested (JUL-24-2008), St Compliance achieved (SEP-11-2008)
Past health violations:
- MCL, Monthly (TCR) - Between OCT-2011 and DEC-2011, Contaminant: Coliform. Follow-up actions: St Public Notif requested (OCT-13-2011), St Formal NOV issued (OCT-13-2011), St Compliance achieved (NOV-22-2011)
- MCL, Monthly (TCR) - Between JUL-2008 and SEP-2008, Contaminant: Coliform. Follow-up actions: St Formal NOV issued (JUL-23-2008), St Public Notif requested (JUL-23-2008), St Compliance achieved (MAY-11-2009)
Drinking water stations with addresses in East Hampton that have no violations reported:
- HARBOR MARINA-BOSTWICKS (Population served: 125, Primary Water Source Type: Groundwater)
- MAIDSTONE GUN CLUB (Population served: 100, Primary Water Source Type: Groundwater)
- MAIDSTONE PARK BEACH/BALLFIELD (Population served: 100, Primary Water Source Type: Groundwater)
- LONG HOUSE RESERVE (Population served: 50, Primary Water Source Type: Groundwater)
| This village: | 2.0 people |
| New York: | 2.6 people |
| This village: | 52.0% |
| Whole state: | 63.5% |
| This village: | 5.4% |
| Whole state: | 6.8% |
Likely homosexual households (counted as self-reported same-sex unmarried-partner households)
- Lesbian couples: 1.3% of all households
- Gay men: 1.5% of all households
Banks with branches in East Hampton (2011 data):
- The Suffolk County National Bank of Riverhead: East Hampton Village Branch at 99 Newtown Lane, branch established on 1975/07/12; East Hampton Branch at 351 Pantigo Road, branch established on 1965/01/04. Info updated 2012/01/10: Bank assets: $1,483.9 mil, Deposits: $1,312.3 mil, headquarters in Riverhead, NY, positive income, Commercial Lending Specialization, 30 total offices, Holding Company: Suffolk Bancorp
- The Bridgehampton National Bank: East Hampton Satellite Branch at 55 Main Street, branch established on 2010/11/01; East Hampton Branch at 55 Main Street, branch established on 1985/05/08. Info updated 2011/06/09: Bank assets: $1,333.4 mil, Deposits: $1,201.2 mil, headquarters in Bridgehampton, NY, positive income, Commercial Lending Specialization, 20 total offices, Holding Company: Bridge Bancorp, Inc.
- Bank of America, National Association: East Hampton Branch at 14 Newtown Lane, branch established on 1964/05/27. Info updated 2009/11/18: Bank assets: $1,451,969.3 mil, Deposits: $1,077,176.8 mil, headquarters in Charlotte, NC, positive income, 5782 total offices, Holding Company: Bank Of America Corporation
- JPMorgan Chase Bank, National Association: East Hampton Branch at 66 Main Street, branch established on 1961/10/16. Info updated 2011/11/10: Bank assets: $1,811,678.0 mil, Deposits: $1,190,738.0 mil, headquarters in Columbus, OH, positive income, International Specialization, 5577 total offices, Holding Company: Jpmorgan Chase & Co.
- Capital One, National Association: East Hampton Branch at 40 Newton Lane, branch established on 1984/01/30. Info updated 2011/07/01: Bank assets: $133,477.8 mil, Deposits: $97,063.7 mil, headquarters in Mclean, VA, positive income, 984 total offices, Holding Company: Capital One Financial Corporation
- Apple Bank for Savings: East Hampton Branch at 50 Montauk Highway, branch established on 1977/06/18. Info updated 2006/11/03: Bank assets: $7,582.2 mil, Deposits: $6,688.3 mil, headquarters in Manhasset, NY, positive income, Commercial Lending Specialization, 51 total offices, Holding Company: Apple Financial Holdings, Inc.
- Hudson City Savings Bank: East Hampton Branch at 126 N. Main St, branch established on 2007/10/15. Info updated 2012/01/09: Bank assets: $45,373.6 mil, Deposits: $25,645.6 mil, headquarters in Paramus, NJ, negative income in the last year, Mortgage Lending Specialization, 135 total offices
For population 15 years and over in East Hampton:
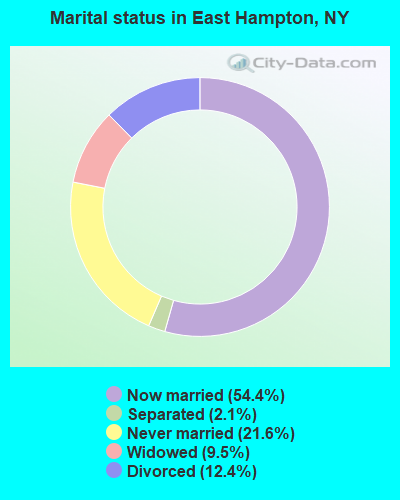
- Never married: 21.6%
- Now married: 54.4%
- Separated: 2.1%
- Widowed: 9.5%
- Divorced: 12.4%
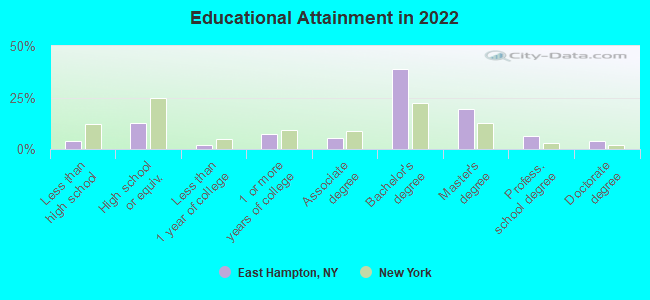
For population 25 years and over in East Hampton:
- High school or higher: 95.8%
- Bachelor's degree or higher: 66.6%
- Graduate or professional degree: 28.7%
- Unemployed: 2.8%
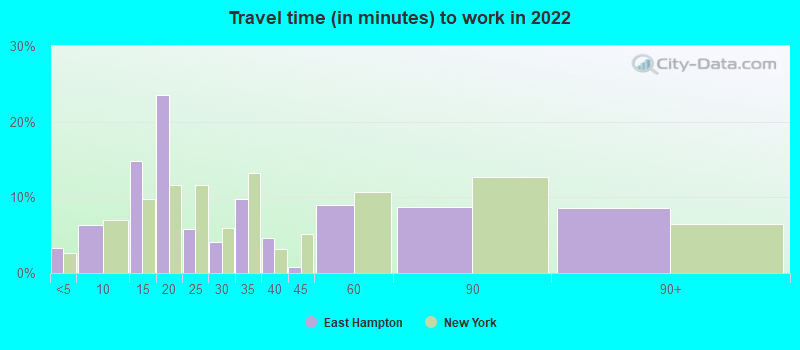
- Mean travel time to work (commute): 12.6 minutes
| Here: | 10.7 |
| New York average: | 13.9 |


Graphs represent county-level data. Detailed 2008 Election Results
Religion statistics for East Hampton, NY (based on Suffolk County data)


| Religion | Adherents | Congregations |
|---|---|---|
| Catholic | 879,457 | 75 |
| Mainline Protestant | 69,205 | 182 |
| Evangelical Protestant | 58,909 | 264 |
| Other | 50,771 | 124 |
| Orthodox | 10,190 | 10 |
| Black Protestant | 8,298 | 49 |
| None | 416,520 | - |
Food Environment Statistics:
| Suffolk County: | 3.40 / 10,000 pop. |
| State: | 4.13 / 10,000 pop. |
| This county: | 0.06 / 10,000 pop. |
| New York: | 0.06 / 10,000 pop. |
| Suffolk County: | 1.44 / 10,000 pop. |
| State: | 0.92 / 10,000 pop. |
| Suffolk County: | 1.69 / 10,000 pop. |
| New York: | 1.68 / 10,000 pop. |
| Suffolk County: | 8.15 / 10,000 pop. |
| New York: | 8.82 / 10,000 pop. |
| This county: | 8.1% |
| New York: | 8.2% |
| This county: | 23.4% |
| State: | 23.8% |
| This county: | 22.3% |
| New York: | 15.6% |
Health and Nutrition:
| This city: | 54.8% |
| State: | 50.1% |
| This city: | 52.5% |
| New York: | 48.1% |
| East Hampton: | 28.3 |
| New York: | 28.5 |
| Here: | 20.0% |
| State: | 20.3% |
| East Hampton: | 9.1% |
| New York: | 11.1% |
| Here: | 7.0 |
| New York: | 6.8 |
| East Hampton: | 35.6% |
| New York: | 33.4% |
| This city: | 58.9% |
| New York: | 56.5% |
| This city: | 77.0% |
| New York: | 80.2% |
More about Health and Nutrition of East Hampton, NY Residents
| Local government employment and payroll (March 2022) | |||||
| Function | Full-time employees | Monthly full-time payroll | Average yearly full-time wage | Part-time employees | Monthly part-time payroll |
|---|---|---|---|---|---|
| Police Protection - Officers | 25 | $324,464 | $155,743 | 1 | $1,880 |
| Police - Other | 23 | $195,090 | $101,786 | 7 | $3,939 |
| Streets and Highways | 20 | $136,028 | $81,617 | 1 | $913 |
| Other and Unallocable | 10 | $73,508 | $88,210 | 0 | $0 |
| Other Government Administration | 7 | $28,974 | $49,670 | 0 | $0 |
| Financial Administration | 5 | $34,484 | $82,762 | 0 | $0 |
| Health | 2 | $10,884 | $65,304 | 9 | $13,684 |
| Parks and Recreation | 1 | $6,250 | $75,000 | 2 | $3,674 |
| Totals for Government | 93 | $809,682 | $104,475 | 20 | $24,090 |
East Hampton government finances - Expenditure in 2017 (per resident):
- Construction - Regular Highways: $981,000 ($640.76)
Health - Other: $246,000 ($160.68)
Parks and Recreation: $111,000 ($72.50)
General Public Buildings: $49,000 ($32.01)
- Current Operations - General - Other: $7,822,000 ($5109.08)
Police Protection: $4,512,000 ($2947.09)
Regular Highways: $968,000 ($632.27)
Parks and Recreation: $919,000 ($600.26)
Financial Administration: $651,000 ($425.21)
General Public Buildings: $520,000 ($339.65)
Central Staff Services: $499,000 ($325.93)
Judicial and Legal Services: $442,000 ($288.70)
Health - Other: $317,000 ($207.05)
Protective Inspection and Regulation - Other: $307,000 ($200.52)
Solid Waste Management: $251,000 ($163.95)
Local Fire Protection: $202,000 ($131.94)
Sewerage: $109,000 ($71.20)
Parking Facilities: $104,000 ($67.93)
- General - Interest on Debt: $356,000 ($232.53)
- Other Capital Outlay - Parks and Recreation: $144,000 ($94.06)
Police Protection: $94,000 ($61.40)
Local Fire Protection: $73,000 ($47.68)
Health - Other: $68,000 ($44.42)
General - Other: $57,000 ($37.23)
Regular Highways: $16,000 ($10.45)
Solid Waste Management: $6,000 ($3.92)
- Total Salaries and Wages: $9,348,000 ($6105.81)
East Hampton government finances - Revenue in 2017 (per resident):
- Charges - Parks and Recreation: $219,000 ($143.04)
Other: $179,000 ($116.92)
- Local Intergovernmental - Other: $2,858,000 ($1866.75)
- Miscellaneous - Rents: $1,079,000 ($704.77)
Fines and Forfeits: $933,000 ($609.41)
General Revenue - Other: $773,000 ($504.90)
Donations From Private Sources: $191,000 ($124.76)
Interest Earnings: $133,000 ($86.87)
- State Intergovernmental - Highways: $186,000 ($121.49)
Other: $166,000 ($108.43)
General Local Government Support: $15,000 ($9.80)
- Tax - Property: $12,468,000 ($8143.70)
Other License: $3,042,000 ($1986.94)
Public Utilities Sales: $271,000 ($177.01)
East Hampton government finances - Debt in 2017 (per resident):
- Long Term Debt - Beginning Outstanding - Unspecified Public Purpose: $7,485,000 ($4888.96)
Outstanding Unspecified Public Purpose: $6,635,000 ($4333.77)
Retired Unspecified Public Purpose: $850,000 ($555.19)
East Hampton government finances - Cash and Securities in 2017 (per resident):
- Bond Funds - Cash and Securities: $49,000 ($32.01)
- Other Funds - Cash and Securities: $12,996,000 ($8488.57)
4.14% of this county's 2021 resident taxpayers lived in other counties in 2020 ($206,656 average adjusted gross income)
| Here: | 4.14% |
| New York average: | 5.29% |
0.01% of residents moved from foreign countries ($74 average AGI)
Suffolk County: 0.01% New York average: 0.01%
Top counties from which taxpayers relocated into this county between 2020 and 2021:
| from Nassau County, NY | |
| from Queens County, NY | |
| from New York County, NY |
4.28% of this county's 2020 resident taxpayers moved to other counties in 2021 ($141,172 average adjusted gross income)
| Here: | 4.28% |
| New York average: | 6.93% |
0.01% of residents moved to foreign countries ($169 average AGI)
Suffolk County: 0.01% New York average: 0.02%
Top counties to which taxpayers relocated from this county between 2020 and 2021:
| to Nassau County, NY | |
| to Queens County, NY | |
| to New York County, NY |
| Businesses in East Hampton, NY | ||||
| Name | Count | Name | Count | |
|---|---|---|---|---|
| CVS | 1 | Nike | 2 | |
| FedEx | 3 | Starbucks | 1 | |
| J.Crew | 1 | True Value | 1 | |
| Juicy Couture | 1 | U-Haul | 1 | |
| MasterBrand Cabinets | 2 | UPS | 2 | |
| New Balance | 4 | YMCA | 1 | |
Strongest AM radio stations in East Hampton:
- WTIC (1080 AM; 50 kW; HARTFORD, CT; Owner: INFINITY RADIO OPERATIONS INC.)
- WFAN (660 AM; 50 kW; NEW YORK, NY; Owner: INFINITY BROADCASTING OPERATIONS, INC.)
- WNNZ (640 AM; 50 kW; WESTFIELD, MA; Owner: CLEAR CHANNEL BROADCASTING LICENSES, INC.)
- WALE (990 AM; 50 kW; GREENVILLE, RI; Owner: NORTH AMERICAN BROADCASTING CO., INC.)
- WMCA (570 AM; 50 kW; NEW YORK, NY; Owner: SALEM MEDIA OF NEW YORK, LLC)
- WCBS (880 AM; 50 kW; NEW YORK, NY; Owner: INFINITY BROADCASTING OPERATIONS, INC.)
- WGSM (740 AM; 25 kW; HUNTINGTON, NY; Owner: K RADIO LICENSEE, INC.)
- WCRN (830 AM; 50 kW; WORCESTER, MA; Owner: CARTER BROADCASTING CORPORATION)
- WOR (710 AM; 50 kW; NEW YORK, NY; Owner: BUCKLEY BROADCASTING CORPORATION)
- WABC (770 AM; 50 kW; NEW YORK, NY; Owner: WABC-AM RADIO, INC.)
- WEEI (850 AM; 50 kW; BOSTON, MA; Owner: ENTERCOM BOSTON LICENSE, LLC)
- WRKO (680 AM; 50 kW; BOSTON, MA; Owner: ENTERCOM BOSTON LICENSE, LLC)
- WEPN (1050 AM; 50 kW; NEW YORK, NY; Owner: NEW YORK AM RADIO, LLC)
Strongest FM radio stations in East Hampton:
- WHBE (96.7 FM; EAST HAMPTON, NY; Owner: AAA ENTERTAINMENT LICENSING LLC)
- WBEA (101.7 FM; SOUTHOLD, NY; Owner: AAA ENTERTAINMENT LICENSING LLC)
- WLNG (92.1 FM; SAG HARBOR, NY; Owner: MAIN STREET BROADCASTING CO., INC.)
- WHFM (95.3 FM; SOUTHAMPTON, NY; Owner: CXR HOLDINGS, INC.)
- WBAZ (102.5 FM; BRIDGEHAMPTON, NY; Owner: AAA ENTERTAINMENT LICENSING LLC)
- W233AI (94.5 FM; SAG HARBOR, NY; Owner: MONROE BOARD OF EDUCATION)
- W277AB (103.3 FM; NOYACK, NY; Owner: SACRED HEART UNIVERSITY, INC.)
- WRLI-FM (91.3 FM; SOUTHAMPTON, NY; Owner: CONNECTICUT PUBLIC BROADCASTING, INC)
- WMOS (104.7 FM; MONTAUK, NY; Owner: CITADEL BROADCASTING COMPANY)
- WSUF (89.9 FM; NOYACK, NY; Owner: SACRED HEART UNIVERSITY, INC.)
- W264AJ (100.7 FM; SOUTHAMPTON, NY; Owner: MONROE BOARD OF EDUCATION)
- WLIU (88.3 FM; SOUTHAMPTON, NY; Owner: LONG ISLAND UNIVERSITY PUBLIC RADIO NETWORK)
- WALK-FM (97.5 FM; PATCHOGUE, NY; Owner: AMFM RADIO LICENSES, L.L.C.)
- WLVG (96.1 FM; CENTER MORICHES, NY; Owner: WAY BROADCASTING, INC.)
- WXXP (105.3 FM; CALVERTON-ROANOKE, NY; Owner: JARAD BROADCASTING CO. OF CALVERTON, INC)
- WRCN-FM (103.9 FM; RIVERHEAD, NY; Owner: IW LIMITED LIABILITY COMPANY)
- WBON (107.1 FM; HAMPTON BAYS, NY; Owner: NASSAU BROADCASTING HOLDINGS, INC.)
TV broadcast stations around East Hampton:
- WVVH-LP (Channel 23; SOUTHAMPTON, ETC., NY; Owner: VIDEO VOICE, INC.)
- WHPX (Channel 26; NEW LONDON, CT; Owner: PAXSON HARTFORD LICENSE, INC.)
- East Hampton, New York
- Fatal accident count88
- Vehicles involved in fatal accidents134
- Fatal accidents involving drunk persons:29
- Fatalities94
- Persons involved in fatal accidents213
- Pedestrians involved in fatal accidents22
- New York average
- Fatal accident count52414
- Vehicles involved in fatal accidents76240
- Fatal accidents involving drunk persons12383
- Fatalities56885
- Persons involved in fatal accidents132640
- Pedestrians involved in fatal accidents11057
- National Bridge Inventory (NBI) Statistics
- 3Number of bridges
- 3ft / 0.9mTotal length
- $645,000Total costs
- 10,279Total average daily traffic
- 99Total average daily truck traffic
FCC Registered Antenna Towers: 58 (See the full list of FCC Registered Antenna Towers)
FCC Registered Private Land Mobile Towers: 1 (See the full list of FCC Registered Private Land Mobile Towers in East Hampton, NY)
FCC Registered Broadcast Land Mobile Towers: 29 (See the full list of FCC Registered Broadcast Land Mobile Towers)
FCC Registered Microwave Towers: 15 (See the full list of FCC Registered Microwave Towers in this town)
FCC Registered Paging Towers: 5 (See the full list of FCC Registered Paging Towers)
FCC Registered Maritime Coast & Aviation Ground Towers: 12 (See the full list of FCC Registered Maritime Coast & Aviation Ground Towers)
FCC Registered Amateur Radio Licenses: 70 (See the full list of FCC Registered Amateur Radio Licenses in East Hampton)
FAA Registered Aircraft: 27 (See the full list of FAA Registered Aircraft in East Hampton)
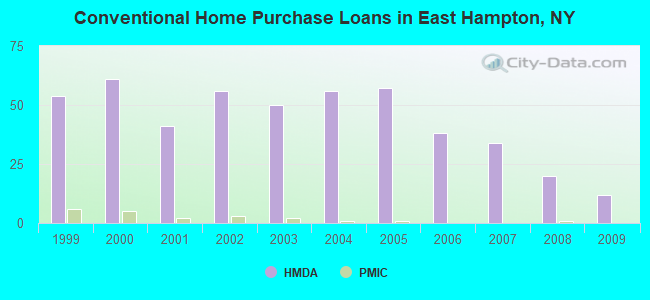
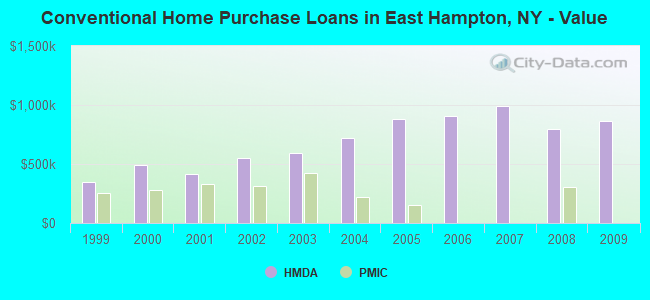
| Home Mortgage Disclosure Act Aggregated Statistics For Year 2009 (Based on 1 partial tract) | ||||||||||
| A) FHA, FSA/RHS & VA Home Purchase Loans | B) Conventional Home Purchase Loans | C) Refinancings | D) Home Improvement Loans | F) Non-occupant Loans on < 5 Family Dwellings (A B C & D) | ||||||
|---|---|---|---|---|---|---|---|---|---|---|
| Number | Average Value | Number | Average Value | Number | Average Value | Number | Average Value | Number | Average Value | |
| LOANS ORIGINATED | 1 | $406,580 | 12 | $864,576 | 41 | $592,799 | 5 | $338,042 | 25 | $765,942 |
| APPLICATIONS APPROVED, NOT ACCEPTED | 0 | $0 | 2 | $804,710 | 7 | $514,406 | 1 | $143,000 | 4 | $768,115 |
| APPLICATIONS DENIED | 0 | $0 | 3 | $1,137,613 | 21 | $844,303 | 2 | $830,285 | 9 | $1,248,034 |
| APPLICATIONS WITHDRAWN | 0 | $0 | 2 | $967,220 | 8 | $808,858 | 0 | $0 | 5 | $1,113,446 |
| FILES CLOSED FOR INCOMPLETENESS | 0 | $0 | 0 | $0 | 4 | $587,828 | 0 | $0 | 2 | $595,355 |
Detailed HMDA statistics for the following Tracts: 2009.00
| Private Mortgage Insurance Companies Aggregated Statistics For Year 2008 (Based on 1 partial tract) | ||
| A) Conventional Home Purchase Loans | ||
|---|---|---|
| Number | Average Value | |
| LOANS ORIGINATED | 1 | $303,820 |
| APPLICATIONS APPROVED, NOT ACCEPTED | 0 | $0 |
| APPLICATIONS DENIED | 0 | $0 |
| APPLICATIONS WITHDRAWN | 0 | $0 |
| FILES CLOSED FOR INCOMPLETENESS | 0 | $0 |
Detailed PMIC statistics for the following Tracts: 2009.00
2002 - 2018 National Fire Incident Reporting System (NFIRS) incidents
- Fire incident types reported to NFIRS in East Hampton, NY
- 42061.9%Structure Fires
- 17726.1%Outside Fires
- 649.4%Mobile Property/Vehicle Fires
- 182.7%Other
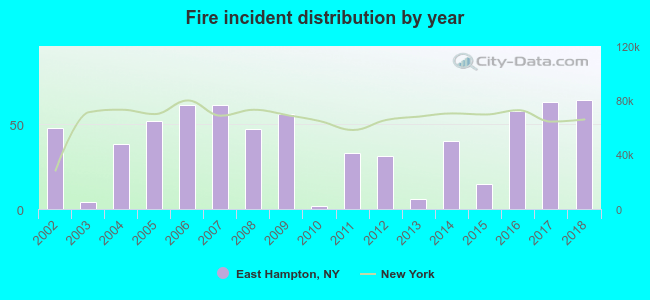 According to the data from the years 2002 - 2018 the average number of fire incidents per year is 40. The highest number of reported fires - 64 took place in 2018, and the least - 2 in 2010. The data has an increasing trend.
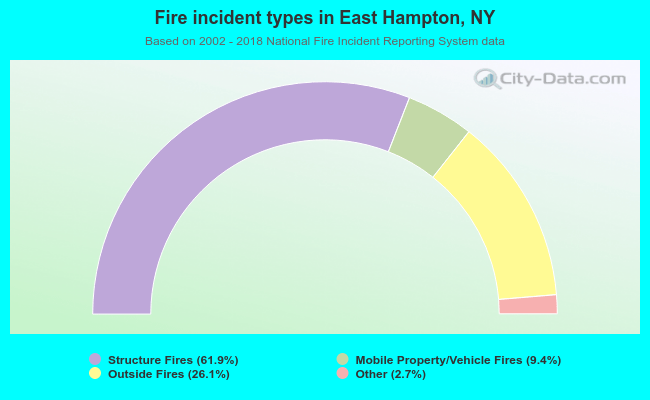 When looking into fire subcategories, the most incidents belonged to: Structure Fires (61.9%), and Outside Fires (26.1%).
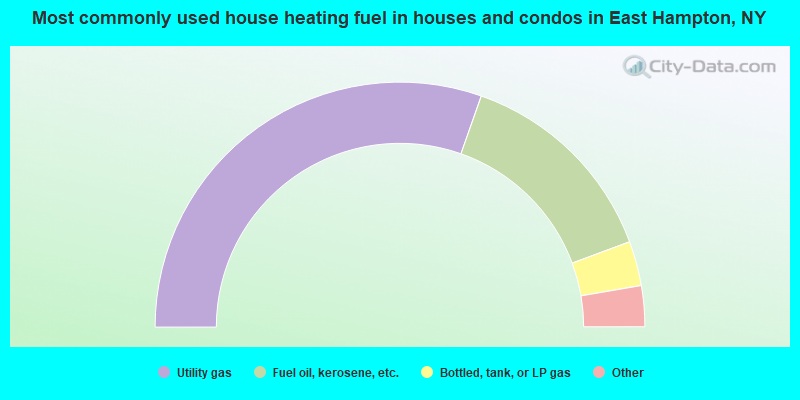
- 60.8%Utility gas
- 27.9%Fuel oil, kerosene, etc.
- 5.9%Bottled, tank, or LP gas
- 3.2%Electricity
- 1.2%Other fuel
- 1.0%No fuel used
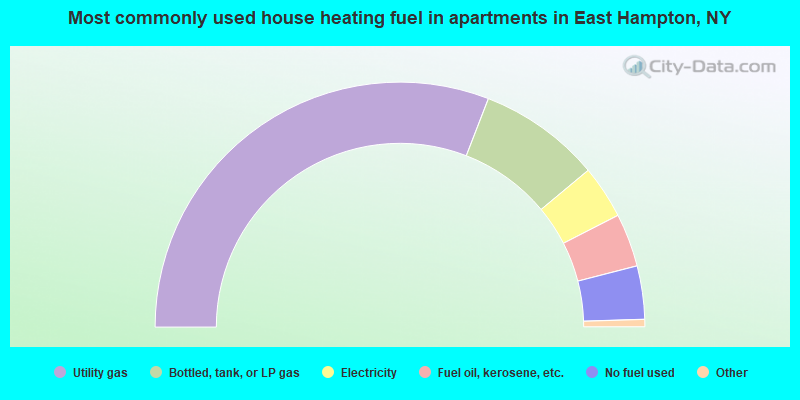
- 62.4%Utility gas
- 16.3%Bottled, tank, or LP gas
- 7.1%Electricity
- 7.1%Fuel oil, kerosene, etc.
- 7.1%No fuel used
East Hampton compared to New York state average:
- Median house value significantly above state average.
- Unemployed percentage significantly below state average.
- Black race population percentage significantly below state average.
- Median age significantly above state average.
- Renting percentage below state average.
- Length of stay since moving in above state average.
- Number of rooms per house significantly above state average.
- Number of college students below state average.
- Percentage of population with a bachelor's degree or higher significantly above state average.
East Hampton on our top lists:
- #8 on the list of "Top 101 cities with the most residents born in Middle Africa (population 500+)"
- #29 on the list of "Top 101 cities with the most residents born in Hungary (population 500+)"
- #29 on the list of "Top 101 cities with the most residents born in Brazil (population 500+)"
- #49 on the list of "Top 101 cities with the most residents born in Ecuador (population 500+)"
- #82 on the list of "Top 101 cities with the most residents born in Iraq (population 500+)"
- #101 on the list of "Top 101 cities with the most residents born in Turkey (population 500+)"
- #42 (11937) on the list of "Top 101 zip codes with the largest percentage of taxpayers reporting profit/loss from business in 2012 (pop 5,000+)"
- #89 (11937) on the list of "Top 101 zip codes with the highest 2012 average net capital gain/loss (pop 5,000+)"
- #3 on the list of "Top 101 counties with the most Catholic adherents"
- #6 on the list of "Top 101 counties with the lowest percentage of residents relocating from other counties between 2010 and 2011"
- #7 on the list of "Top 101 counties with the lowest surface withdrawal of fresh water for public supply (pop. 50,000+)"
- #9 on the list of "Top 101 counties with the lowest percentage of residents relocating to other counties in 2011"
- #19 on the list of "Top 101 counties with the highest ground withdrawal of fresh water for public supply (pop. 50,000+)"

|
|
Total of 80 patent applications in 2008-2024.