East Whatcom, Washington
Submit your own pictures of this place and show them to the world
- OSM Map
- General Map
- Google Map
- MSN Map

| Males: 3,793 | |
| Females: 3,575 |
| Median resident age: | 32.8 years |
| Washington median age: | 35.3 years |
Zip code: 98244
| East Whatcom: | $75,127 |
| WA: | $91,306 |
Estimated per capita income in 2022: $38,002 (it was $17,064 in 2000)
East Whatcom CCD income, earnings, and wages data
Estimated median house or condo value in 2022: $455,223 (it was $113,200 in 2000)
| East Whatcom: | $455,223 |
| WA: | $569,500 |
Mean prices in 2022: all housing units: $618,668; detached houses: $673,947; townhouses or other attached units: $482,237; in 2-unit structures: $597,815; in 3-to-4-unit structures: $424,563; in 5-or-more-unit structures: $322,462; mobile homes: $232,843; occupied boats, rvs, vans, etc.: $243,510
Detailed information about poverty and poor residents in East Whatcom, WA


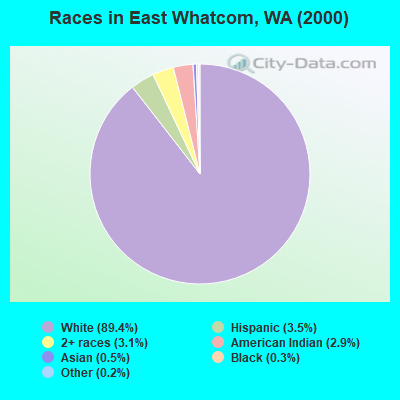
- 5,73289.4%White alone
- 2273.5%Hispanic
- 1983.1%Two or more races
- 1842.9%American Indian alone
- 350.5%Asian alone
- 200.3%Black alone
- 100.2%Other race alone
- 40.06%Native Hawaiian and Other
Pacific Islander alone
Races in East Whatcom detailed stats: ancestries, foreign born residents, place of birth
 Recent articles from our blog. Our writers, many of them Ph.D. graduates or candidates, create easy-to-read articles on a wide variety of topics.

Current Local Time: PST time zone
Land area: 1645.5 square miles.
Population density: 4.5 people per square mile (very low).

| East Whatcom CCD: | 1.0% ($1,187) |
| Washington: | 1.2% ($1,915) |
Nearest city with pop. 50,000+: Bellingham, WA  (25.6 miles , pop. 67,171).
Nearest city with pop. 200,000+: East Seattle, WA (82.8 miles , pop. 480,100).
Nearest city with pop. 1,000,000+: Los Angeles, CA (1034.0 miles , pop. 3,694,820).
Nearest cities:
), ), Latitude: 48.80 N, Longitude: 121.92 W

| Here: | 5.1% |
| Washington: | 4.6% |
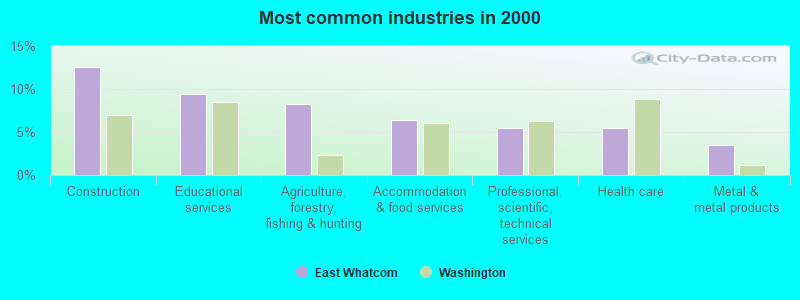
- Construction (12.6%)
- Educational services (9.4%)
- Agriculture, forestry, fishing & hunting (8.3%)
- Accommodation & food services (6.4%)
- Professional, scientific, technical services (5.5%)
- Health care (5.4%)
- Metal & metal products (3.5%)
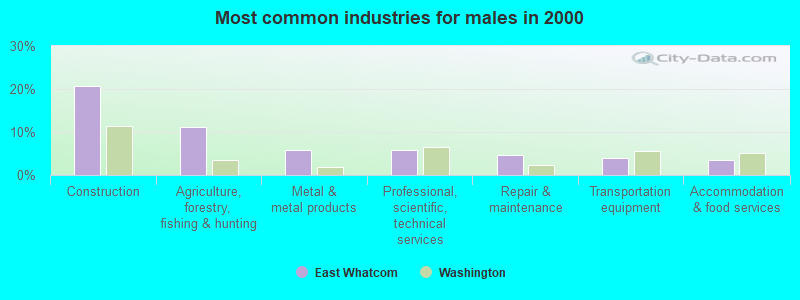
- Construction (20.8%)
- Agriculture, forestry, fishing & hunting (11.1%)
- Metal & metal products (5.9%)
- Professional, scientific, technical services (5.7%)
- Repair & maintenance (4.6%)
- Transportation equipment (4.0%)
- Accommodation & food services (3.5%)
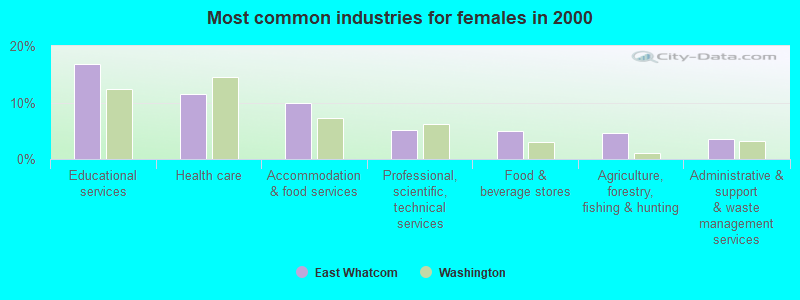
- Educational services (16.8%)
- Health care (11.5%)
- Accommodation & food services (10.0%)
- Professional, scientific, technical services (5.1%)
- Food & beverage stores (4.9%)
- Agriculture, forestry, fishing & hunting (4.7%)
- Administrative & support & waste management services (3.5%)
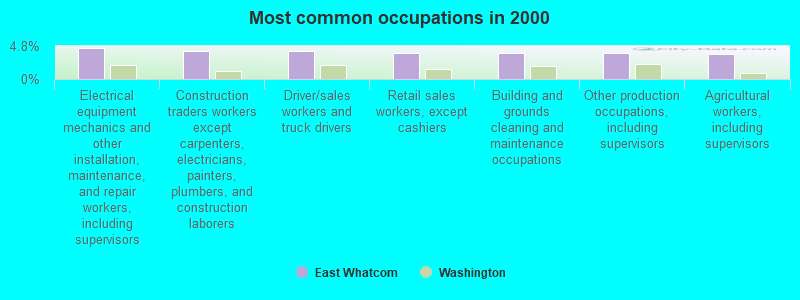
- Electrical equipment mechanics and other installation, maintenance, and repair workers, including supervisors (4.6%)
- Construction traders workers except carpenters, electricians, painters, plumbers, and construction laborers (4.1%)
- Driver/sales workers and truck drivers (4.0%)
- Retail sales workers, except cashiers (3.8%)
- Building and grounds cleaning and maintenance occupations (3.8%)
- Other production occupations, including supervisors (3.8%)
- Agricultural workers, including supervisors (3.6%)
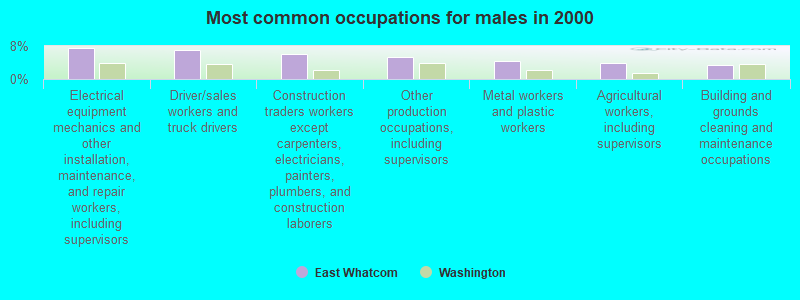
- Electrical equipment mechanics and other installation, maintenance, and repair workers, including supervisors (7.4%)
- Driver/sales workers and truck drivers (7.1%)
- Construction traders workers except carpenters, electricians, painters, plumbers, and construction laborers (6.0%)
- Other production occupations, including supervisors (5.3%)
- Metal workers and plastic workers (4.3%)
- Agricultural workers, including supervisors (4.0%)
- Building and grounds cleaning and maintenance occupations (3.4%)
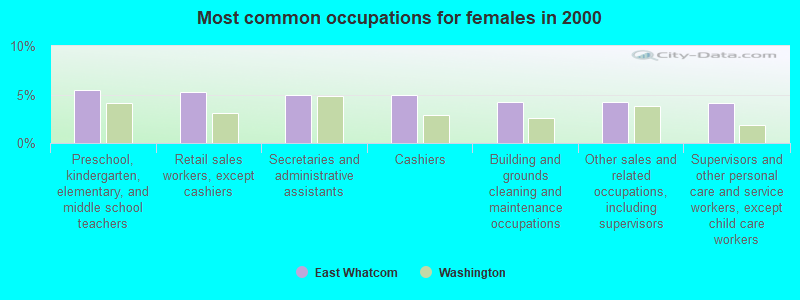
- Preschool, kindergarten, elementary, and middle school teachers (5.5%)
- Retail sales workers, except cashiers (5.2%)
- Secretaries and administrative assistants (5.0%)
- Cashiers (5.0%)
- Building and grounds cleaning and maintenance occupations (4.3%)
- Other sales and related occupations, including supervisors (4.2%)
- Supervisors and other personal care and service workers, except child care workers (4.1%)
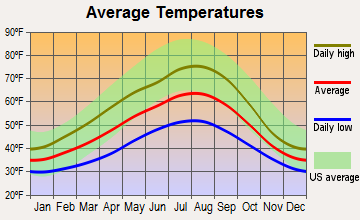
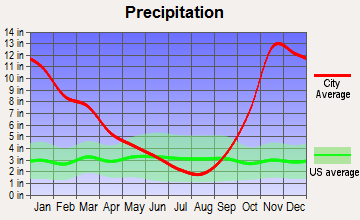
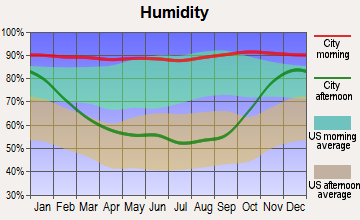
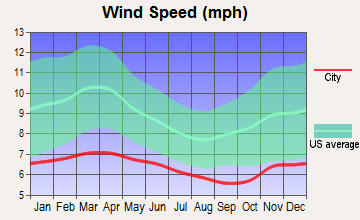
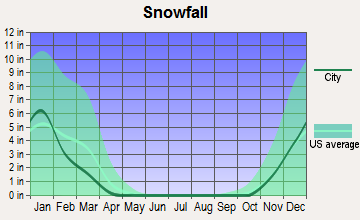
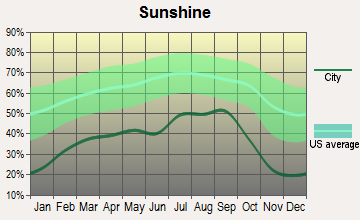
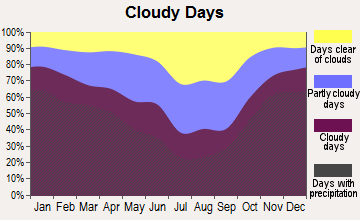
Average climate in East Whatcom, Washington
Based on data reported by over 4,000 weather stations
(lower is better)
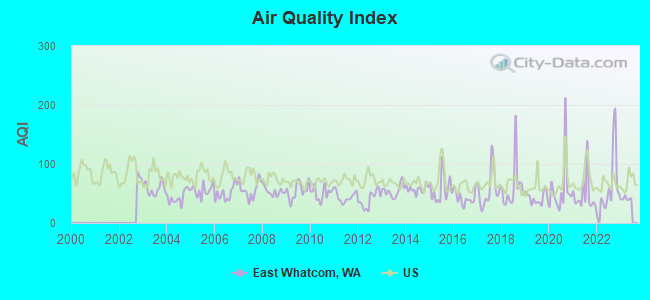
Air Quality Index (AQI) level in 2022 was 63.9. This is about average.
| City: | 63.9 |
| U.S.: | 72.6 |
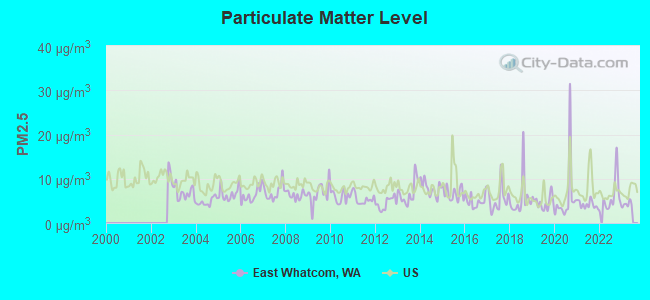
Particulate Matter (PM2.5) [µg/m3] level in 2022 was 6.01. This is better than average. Closest monitor was 24.0 miles away from the city center.
| City: | 6.01 |
| U.S.: | 8.11 |
Earthquake activity:
East Whatcom-area historical earthquake activity is significantly above Washington state average. It is 985% greater than the overall U.S. average.On 4/13/1949 at 19:55:42, a magnitude 7.0 (7.0 UK, Class: Major, Intensity: VIII - XII) earthquake occurred 110.7 miles away from the city center, causing $80,000,000 total damage
On 2/28/2001 at 18:54:32, a magnitude 6.8 (6.8 MD, Depth: 32.2 mi, Class: Strong, Intensity: VII - IX) earthquake occurred 120.3 miles away from East Whatcom center
On 2/28/2001 at 18:54:32, a magnitude 6.8 (6.5 MB, 6.6 MS, 6.8 MW) earthquake occurred 122.3 miles away from East Whatcom center, causing $2,000,000,000 total damage and $305,000,000 insured losses
On 4/29/1965 at 15:28:43, a magnitude 6.6 (6.6 UK) earthquake occurred 104.5 miles away from East Whatcom center, causing $28,000,000 total damage
On 5/3/1996 at 04:04:22, a magnitude 5.5 (5.2 MB, 5.3 MD, 5.5 ML, Depth: 2.5 mi, Class: Moderate, Intensity: VI - VII) earthquake occurred 67.4 miles away from East Whatcom center
On 7/3/1999 at 01:43:54, a magnitude 5.8 (5.4 MB, 5.5 MS, 5.8 MW, 5.3 ME, Depth: 25.2 mi) earthquake occurred 135.0 miles away from the city center
Magnitude types: body-wave magnitude (MB), duration magnitude (MD), energy magnitude (ME), local magnitude (ML), surface-wave magnitude (MS), moment magnitude (MW)
Natural disasters:
The number of natural disasters in Whatcom County (21) is greater than the US average (15).Major Disasters (Presidential) Declared: 17
Emergencies Declared: 1
Causes of natural disasters: Floods: 13, Storms: 10, Mudslides: 7, Winter Storms: 5, Landslides: 4, Winds: 3, Snows: 2, Earthquake: 1, Fire: 1, Heavy Rain: 1, Hurricane: 1, Tornado: 1, Volcanic Eruption: 1, Other: 1 (Note: some incidents may be assigned to more than one category).
Colleges/universities with over 2000 students nearest to East Whatcom:
- Western Washington University (about 27 miles; Bellingham, WA; Full-time enrollment: 13,875)
- Whatcom Community College (about 27 miles; Bellingham, WA; FT enrollment: 3,265)
- Skagit Valley College (about 31 miles; Mount Vernon, WA; FT enrollment: 3,803)
- Everett Community College (about 57 miles; Everett, WA; FT enrollment: 5,818)
- Edmonds Community College (about 71 miles; Lynnwood, WA; FT enrollment: 7,271)
- University of Washington-Bothell Campus (about 74 miles; Bothell, WA; FT enrollment: 3,902)
- Cascadia Community College (about 74 miles; Bothell, WA; FT enrollment: 2,238)
Points of interest:
Notable locations in East Whatcom: Mountain Home Camp (A), Winchester Mountain Lookout (B), Vista Viewpoint (C), Upper Baker Lake Viewpoint (D), Shannon Creek Campground (E), Schriebers Meadow Trailhead (F), Shuksan Campground (G), Shuksan (H), Perry Creek Shelter (I), Tapto Camp (J), Shuksan (K), Diable Vista (L), Desolation Peak Lookout Station (M), Fourmile Camp (N), Colonial Creek Campground (O), Cat Island Campground (P), Gorge Powerhouse (Q), Lookout Number 2 (R), Boulder Creek Campground (S), Baker Lake Resort (T). Display/hide their locations on the map
Churches in East Whatcom include: River of Life Community Church (A), Acme Presbyterian Church (B), Church of the Nazarene (C), Deming Presbyterian Church (D), Saint Peter Catholic Church (E). Display/hide their locations on the map
Cemeteries: Saxon Cemetery (1), Van Zandt Cemetery (2), Kendall Cemetery (3), Saint Peters Cemetery (4), Mount Hope Cemetery (5). Display/hide their locations on the map
Lakes, reservoirs, and swamps: Shull Lake (A), Shuksan Lake (B), Green Lake (C), Noname Lake (D), Tuckway Lake (E), Kidney Lakes (F), Middle Lakes (G), Sourdough Lake (H). Display/hide their locations on the map
Streams, rivers, and creeks: Bagley Creek (A), Baker River (B), Bald Eagle Creek (C), Bar Creek (D), Barometer Creek (E), Barron Creek (F), Bear Creek (G), Beebe Creek (H), Benson Creek (I). Display/hide their locations on the map
Parks in East Whatcom include: North Cascades National Park (1), Ross Lake National Recreation Area (2), Silver Lake Park (3). Display/hide their locations on the map
| This place: | 2.6 people |
| Washington: | 2.5 people |
| This place: | 66.2% |
| Whole state: | 64.4% |
| This place: | 10.3% |
| Whole state: | 7.7% |
Likely homosexual households (counted as self-reported same-sex unmarried-partner households)
- Lesbian couples: 0.4% of all households
- Gay men: 0.3% of all households
| This place: | 20.2% |
| Whole state: | 10.6% |
| This place: | 6.8% |
| Whole state: | 4.6% |
20 people in other noninstitutional group quarters in 2000
For population 15 years and over in East Whatcom:
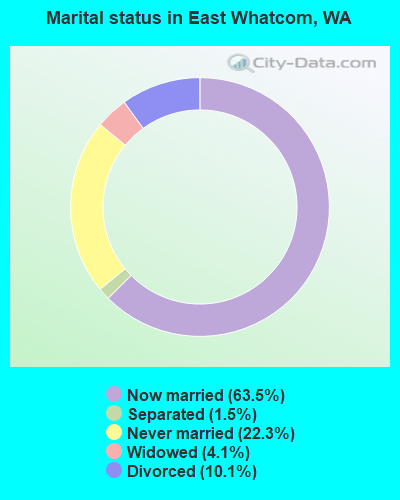
- Never married: 22.3%
- Now married: 63.5%
- Separated: 1.5%
- Widowed: 4.1%
- Divorced: 10.1%
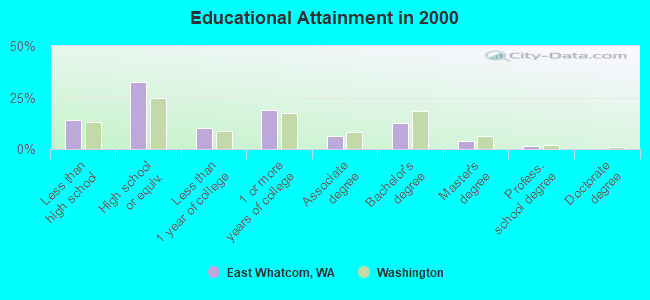
For population 25 years and over in East Whatcom:
- High school or higher: 86.1%
- Bachelor's degree or higher: 17.8%
- Graduate or professional degree: 5.3%
- Unemployed: 6.9%
- Mean travel time to work (commute): 32.9 minutes
| Here: | 9.3 |
| Washington average: | 11.3 |
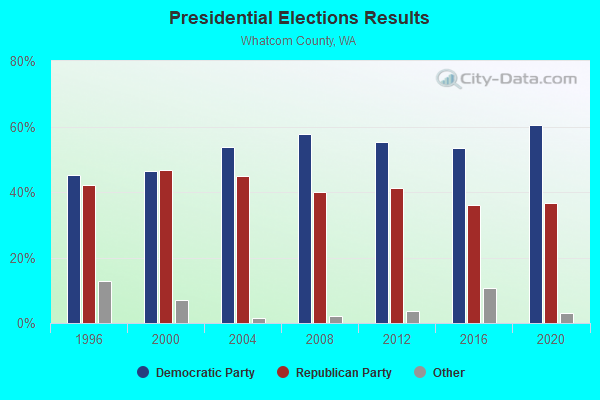

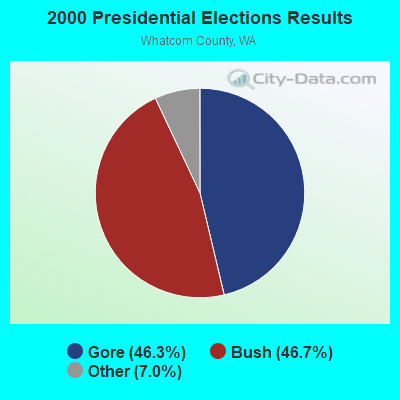

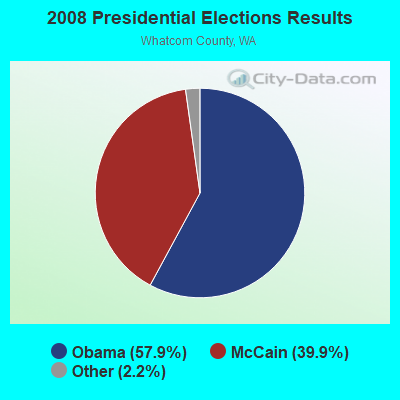
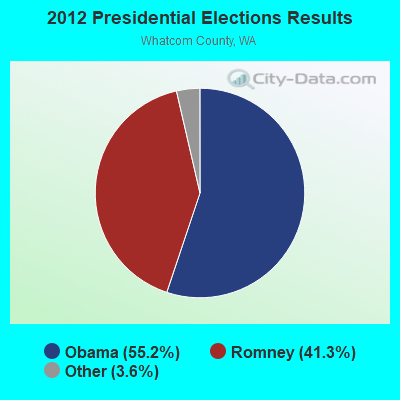
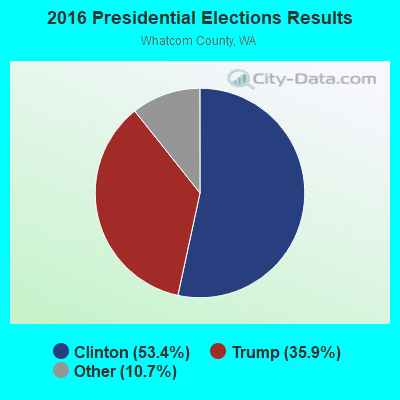
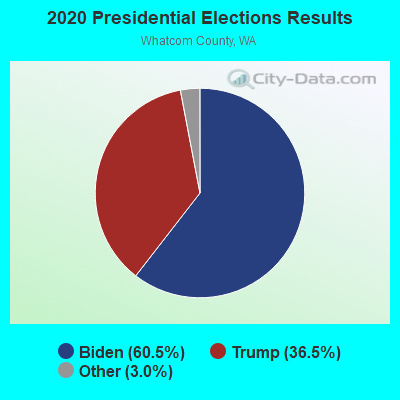
Graphs represent county-level data. Detailed 2008 Election Results
Religion statistics for East Whatcom, WA (based on Whatcom County data)
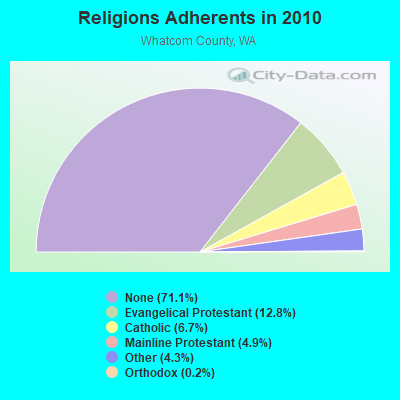
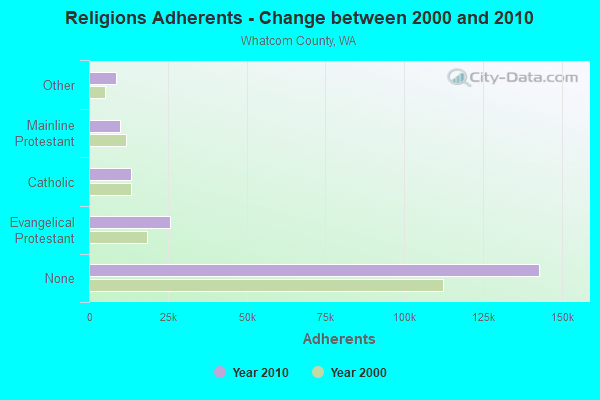
| Religion | Adherents | Congregations |
|---|---|---|
| Evangelical Protestant | 25,842 | 105 |
| Catholic | 13,397 | 6 |
| Mainline Protestant | 9,859 | 39 |
| Other | 8,714 | 33 |
| Orthodox | 370 | 2 |
| None | 142,958 | - |
Food Environment Statistics:
| Here: | 1.77 / 10,000 pop. |
| Washington: | 2.06 / 10,000 pop. |
| This county: | 0.16 / 10,000 pop. |
| Washington: | 0.19 / 10,000 pop. |
| Whatcom County: | 0.83 / 10,000 pop. |
| State: | 1.18 / 10,000 pop. |
| Here: | 3.80 / 10,000 pop. |
| Washington: | 2.67 / 10,000 pop. |
| Whatcom County: | 9.57 / 10,000 pop. |
| Washington: | 8.26 / 10,000 pop. |
| This county: | 6.1% |
| Washington: | 7.7% |
| This county: | 23.1% |
| Washington: | 25.7% |
| This county: | 14.4% |
| Washington: | 13.9% |
Strongest AM radio stations in East Whatcom:
- KRPI (1550 AM; 50 kW; FERNDALE, WA; Owner: BBC BROADCASTING, INC.)
- KARI (550 AM; 25 kW; BLAINE, WA; Owner: WAY BROADCASTING, INC.)
- KPUG (1170 AM; 10 kW; BELLINGHAM, WA; Owner: SAGA BROADCASTING, LLC)
- KAPS (660 AM; 10 kW; MOUNT VERNON, WA; Owner: VALLEY BROADCASTERS, INC.)
- KGMI (790 AM; 5 kW; BELLINGHAM, WA)
- KRKO (1380 AM; 50 kW; EVERETT, WA; Owner: S-R BROADCASTING, CO.)
- KIXI (880 AM; 50 kW; MERCER ISLAND/SEATTL, WA; Owner: BELLEVUE RADIO, INC.)
- KIRO (710 AM; 50 kW; SEATTLE, WA; Owner: ENTERCOM SEATTLE LICENSE, LLC)
- KTTH (770 AM; 50 kW; SEATTLE, WA; Owner: ENTERCOM SEATTLE LICENSE, LLC)
- KGNW (820 AM; 50 kW; BURIEN-SEATTLE, WA; Owner: INSPIRATION MEDIA, INC.)
- KKOL (1300 AM; 50 kW; SEATTLE, WA; Owner: INSPIRATION MEDIA, INC.)
- KOMO (1000 AM; 50 kW; SEATTLE, WA; Owner: FISHER BROADCASTING - SEATTLE RADIO, L.L.C.)
- KYCW (1090 AM; 50 kW; SEATTLE, WA; Owner: INFINITY RADIO SUBSIDIARY OPERATIONS INC.)
Strongest FM radio stations in East Whatcom:
- K201FH (88.1 FM; BELLINGHAM, WA; Owner: CALVARY CHAPEL OF TWIN FALLS, INC.)
- K210CN (89.9 FM; BELLINGHAM, WA; Owner: CALVARY CHAPEL OF TWIN FALLS, INC.)
- KISM (92.9 FM; BELLINGHAM, WA; Owner: SAGA BROADCASTING, LLC)
- KWPZ (106.5 FM; LYNDEN, WA; Owner: CRISTA MINISTRIES, INC.)
- KAFE (104.3 FM; BELLINGHAM, WA; Owner: SAGA BROADCASTING, LLC)
- KSVR (91.7 FM; MOUNT VERNON, WA; Owner: BOARD OF TRUSTEES OF SKAGIT VALLEY COLLEGE)
- K206CU (89.1 FM; MOUNT VERNON, WA; Owner: CALVARY CHAPEL OF TWIN FALLS, INC.)
- KUGS (89.3 FM; BELLINGHAM, WA; Owner: WESTERN WASHINGTON UNIVERSITY)
- KZAZ (91.7 FM; BELLINGHAM, WA; Owner: WASHINGTON STATE UNIVERSITY)
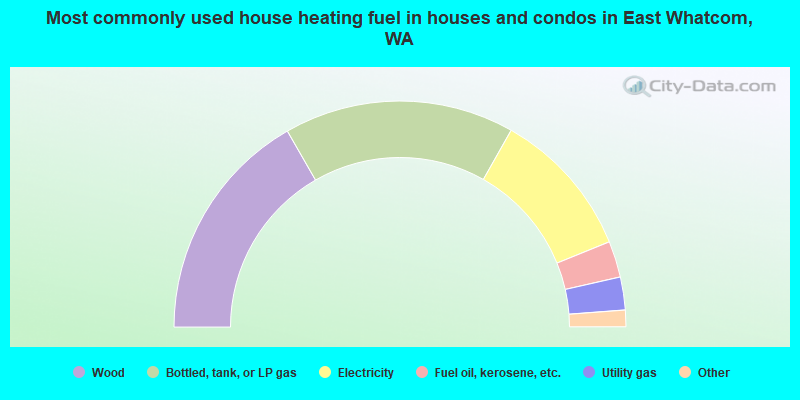
- 33.4%Wood
- 33.0%Bottled, tank, or LP gas
- 21.3%Electricity
- 5.2%Fuel oil, kerosene, etc.
- 4.7%Utility gas
- 1.6%Other fuel
- 0.4%Solar energy
- 0.4%No fuel used
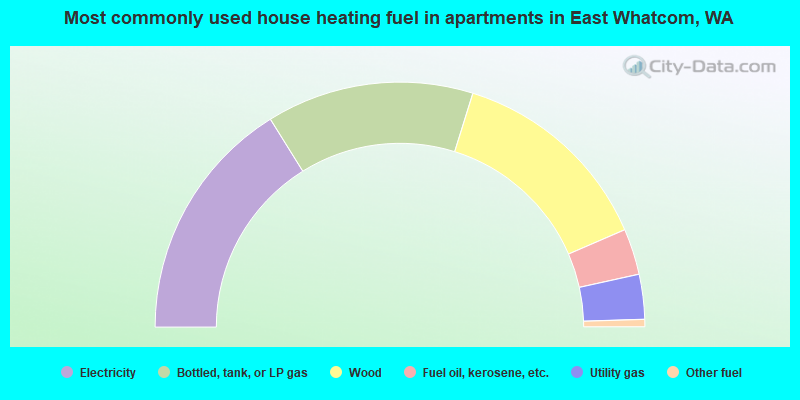
- 32.3%Electricity
- 27.4%Bottled, tank, or LP gas
- 27.4%Wood
- 6.1%Fuel oil, kerosene, etc.
- 5.9%Utility gas
- 1.0%Other fuel
East Whatcom compared to Washington state average:
- Unemployed percentage below state average.
- Black race population percentage significantly below state average.
- Hispanic race population percentage significantly below state average.
- Foreign-born population percentage significantly below state average.
- Length of stay since moving in significantly above state average.
- Number of rooms per house significantly below state average.
- House age significantly below state average.
- Percentage of population with a bachelor's degree or higher below state average.
East Whatcom on our top lists:
- #2 on the list of "Top 101 cities with largest percentage of females in occupations: construction trades workers except carpenters, electricians, painters, plumbers, and construction laborers (population 5,000+)"
- #19 on the list of "Top 101 cities with largest percentage of males in occupations: pipelayers, plumbers, pipefitters, and steamfitters (population 5,000+)"
- #24 on the list of "Top 101 cities with largest percentage of males in occupations: other transportation workers (population 5,000+)"
- #27 on the list of "Top 101 cities with largest percentage of females in industries: sewing, needlework, and piece goods stores (population 5,000+)"
- #28 on the list of "Top 101 cities with largest percentage of females in occupations: farmers and farm managers (population 5,000+)"
- #31 on the list of "Top 101 cities with largest percentage of males in occupations: fishing and hunting, and forest and logging workers (population 5,000+)"
- #31 on the list of "Top 101 cities with largest percentage of males in industries: water transportation (population 5,000+)"
- #32 on the list of "Top 101 cities with largest percentage of females in occupations: agricultural workers including supervisors (population 5,000+)"
- #35 on the list of "Top 101 cities with largest percentage of females in industries: furniture and home furnishings, and household appliance stores (population 5,000+)"
- #42 on the list of "Top 101 cities with largest percentage of males in industries: petroleum and coal products (population 5,000+)"
- #44 on the list of "Top 101 cities with largest percentage of males in industries: book stores and news dealers (population 5,000+)"
- #52 on the list of "Top 101 cities with largest percentage of females in industries: clothing and accessories, including shoe, stores (population 5,000+)"
- #55 on the list of "Top 101 cities with largest percentage of females in industries: lumber and other construction materials merchant wholesalers (population 5,000+)"
- #58 on the list of "Top 101 cities with largest percentage of females in industries: gasoline stations (population 5,000+)"
- #74 on the list of "Top 100 cities with largest land areas"
- #97 on the list of "Top 101 cities with largest percentage of males in industries: wood products (population 5,000+)"
- #98 on the list of "Top 101 cities with largest percentage of males in industries: lumber and other construction materials merchant wholesalers (population 5,000+)"
- #7 on the list of "Top 101 counties with the lowest Ozone (1-hour) air pollution readings in 2012 (ppm)"
- #8 on the list of "Top 101 counties with the lowest Particulate Matter (PM2.5) Annual air pollution readings in 2012 (µg/m3)"
- #42 on the list of "Top 101 counties with highest percentage of residents voting for 3rd party candidates in the 2012 Presidential Election (pop. 50,000+)"