Egremont, Massachusetts
Submit your own pictures of this town and show them to the world
- OSM Map
- Google Map
- MSN Map
Population change since 2000: -8.9%
 |
| Males: 578 | |
| Females: 647 |
| Median resident age: | 53.5 years |
| Massachusetts median age: | 39.2 years |
Zip codes: 01230.
| Egremont: | $94,983 |
| MA: | $94,488 |
Estimated per capita income in 2022: $93,537 (it was $41,702 in 2000)
Egremont town income, earnings, and wages data
Estimated median house or condo value in 2022: $595,009 (it was $222,500 in 2000)
| Egremont: | $595,009 |
| MA: | $534,700 |
Mean prices in 2022: all housing units: $357,971; detached houses: $376,086; townhouses or other attached units: $341,816; in 2-unit structures: $250,940; in 3-to-4-unit structures: $400,871; in 5-or-more-unit structures: $281,990; mobile homes: $80,872
Detailed information about poverty and poor residents in Egremont, MA
Compare current foreclosures near Egremont, MA:
| Photo | Address | Area | Beds / Baths | Price | Details |
|---|---|---|---|---|---|

|
#1
Crystal St
Lenox Dale, MA 01242
|
1,918 sq. feet
|
2 baths 3 beds |
$165,900
|
show details |

|
#2
State Route 22
Copake Falls, NY 12517
|
1,200 sq. feet
|
1 baths 2 beds |
$459,900
|
show details |

|
#3
Washington Mountain Rd
Lee, MA 01238
|
- sq. feet
|
1 baths 3 beds |
$155,000
|
show details |

|
#4
Fairview Dr
Copake, NY 12516
|
1,666 sq. feet
|
2 baths 4 beds |
show details | |

|
#5
Alum Hill Road
Sheffield, MA 01257
|
1,040 sq. feet
|
2 baths 3 beds |
show details | |

|
#6
State Route 9h
Ghent, NY 12075
|
1,728 sq. feet
|
1 baths 3 beds |
show details | |

|
#7
Frisbee St
East Chatham, NY 12060
|
2,400 sq. feet
|
2 baths 4 beds |
show details | |

|
#8
Melville Ct
Lenox, MA 01240
|
3,988 sq. feet
|
6 baths 5 beds |
show details | |

|
#9
Roxbury Rd
Chatham, NY 12037
|
1,820 sq. feet
|
1 baths 3 beds |
show details | |

|
#10
Morgan St
Lenox, MA 01240
|
3,959 sq. feet
|
2 baths 3 beds |
show details |
| Photo | Address | Area | Beds / Baths | Price | Details |
|---|---|---|---|---|---|

|
#11
Chapel St
Lee, MA 01238
|
1,584 sq. feet
|
1 baths 3 beds |
show details | |

|
#12
County Route 7
Ancram, NY 12502
|
1,182 sq. feet
|
4 baths 7 beds |
show details | |

|
#13
Stockbridge Rd
Lee, MA 01238
|
4,695 sq. feet
|
4 baths 5 beds |
show details | |

|
#14
County Route 21
Ghent, NY 12075
|
2,819 sq. feet
|
2 baths 6 beds |
show details | |

|
#15
Sheldon Dr
Pine Plains, NY 12567
|
2,688 sq. feet
|
2 baths 3 beds |
show details | |

|
#16
S Undermountain Rd
Sheffield, MA 01257
|
1,713 sq. feet
|
2 baths 3 beds |
show details | |

|
#17
Taft Rd
Copake, NY 12516
|
1,128 sq. feet
|
1 baths 2 beds |
show details | |

|
#18
Upper Queechy Rd
Canaan, NY 12029
|
912 sq. feet
|
1 baths 2 beds |
show details | |

|
#19
Fish And Game Rd
Hudson, NY 12534
|
2,592 sq. feet
|
2 baths 4 beds |
show details | |

|
#20
S Sandisfield Rd
Great Barrington, MA 01230
|
1,983 sq. feet
|
2 baths 2 beds |
show details |
| Photo | Address | Area | Beds / Baths | Price | Details |
|---|---|---|---|---|---|

|
#21
Route 23
Hillsdale, NY 12529
|
2,762 sq. feet
|
2 baths 4 beds |
show details | |

|
#22
County Rd
Great Barrington, MA 01230
|
1,576 sq. feet
|
1 baths 4 beds |
show details | |

|
#23
Main St
Sheffield, MA 01257
|
3,683 sq. feet
|
5 baths 6 beds |
show details | |

|
#24
Main St
Millerton, NY 12546
|
- sq. feet
|
- baths - beds |
show details | |

|
#25
Us 9
Hudson, NY 12534
|
- sq. feet
|
- baths - beds |
show details | |

|
#26
Maiden Ln # 3
Chatham, NY 12037
|
- sq. feet
|
- baths - beds |
show details | |

|
#27
County Route 5
Canaan, NY 12029
|
- sq. feet
|
- baths - beds |
show details | |

|
#28
Spring St # 1
Chatham, NY 12037
|
- sq. feet
|
- baths - beds |
show details | |

|
#29
Route 9h And 23
Hudson, NY 12534
|
- sq. feet
|
- baths - beds |
show details | |

|
#30
State Route 295 Lot 24
Chatham, NY 12037
|
- sq. feet
|
- baths - beds |
show details |
| Photo | Address | Area | Beds / Baths | Price | Details |
|---|---|---|---|---|---|

|
#31
Norfolk Rd
East Canaan, CT 06024
|
- sq. feet
|
- baths - beds |
show details | |

|
#32
Route 9h
Hudson, NY 12534
|
- sq. feet
|
- baths - beds |
show details | |

|
#33
Hull Rd
Elizaville, NY 12523
|
1,568 sq. feet
|
- baths - beds |
show details | |

|
#34
Blunt Rd
Great Barrington, MA 01230
|
- sq. feet
|
- baths - beds |
show details | |

|
#35
Old Mill Dr
Claverack, NY 12513
|
- sq. feet
|
- baths - beds |
show details | |

|
#36
Hewins St
Ashley Falls, MA 01222
|
- sq. feet
|
- baths - beds |
show details | |

|
#37
Christian Hill Rd Apt 32
Great Barrington, MA 01230
|
- sq. feet
|
- baths - beds |
show details | |

|
#38
Route 23
Hillsdale, NY 12529
|
- sq. feet
|
- baths - beds |
show details | |

|
#39
Root Ln
Sheffield, MA 01257
|
- sq. feet
|
- baths - beds |
show details | |

|
#40
Viewmont Rd
Copake, NY 12516
|
- sq. feet
|
- baths - beds |
show details |
| Photo | Address | Area | Beds / Baths | Price | Details |
|---|---|---|---|---|---|

|
#41
Birch Hill Rd
Craryville, NY 12521
|
- sq. feet
|
- baths - beds |
show details | |

|
#42
State Route 23
Craryville, NY 12521
|
- sq. feet
|
- baths - beds |
show details | |

|
#43
Crescent Dr
Hillsdale, NY 12529
|
- sq. feet
|
- baths - beds |
show details | |

|
#44
Alum Hill Rd
Sheffield, MA 01257
|
- sq. feet
|
- baths - beds |
show details | |

|
#45
Golden Hill Rd
Lee, MA 01238
|
- sq. feet
|
- baths - beds |
show details | |

|
#46
Rhoades And Bailey Rd
Mill River, MA 01244
|
- sq. feet
|
- baths - beds |
show details | |

|
#47
Schoolhouse Rd
Austerlitz, NY 12017
|
- sq. feet
|
- baths - beds |
show details | |

|
#48
High St Apt 1
Lee, MA 01238
|
- sq. feet
|
- baths - beds |
show details | |

|
#49
W Hubbard Rd
Sandisfield, MA 01255
|
- sq. feet
|
- baths - beds |
show details | |

|
Check over 1 million property listings on Foreclosure.com!
|
browse all offers | |||

- 1,17195.6%White alone
- 292.4%Hispanic
- 90.7%Two or more races
- 70.6%Black alone
- 70.6%Asian alone
- 10.08%American Indian alone
- 10.08%Native Hawaiian and Other
Pacific Islander alone

Races in Egremont detailed stats: ancestries, foreign born residents, place of birth
Type |
2009 |
2010 |
2011 |
2012 |
2013 |
2014 |
2015 |
2016 |
2018 |
2021 |
2022 |
|---|---|---|---|---|---|---|---|---|---|---|---|
| Murders (per 100,000) | 0 (0.0) | 0 (0.0) | 0 (0.0) | 0 (0.0) | 0 (0.0) | 0 (0.0) | 0 (0.0) | 0 (0.0) | 0 (0.0) | 0 (0.0) | 0 (0.0) |
| Rapes (per 100,000) | 0 (0.0) | 0 (0.0) | 0 (0.0) | 0 (0.0) | 0 (0.0) | 0 (0.0) | 0 (0.0) | 0 (0.0) | 0 (0.0) | 0 (0.0) | 0 (0.0) |
| Robberies (per 100,000) | 0 (0.0) | 0 (0.0) | 0 (0.0) | 0 (0.0) | 0 (0.0) | 1 (81.7) | 0 (0.0) | 0 (0.0) | 0 (0.0) | 0 (0.0) | 0 (0.0) |
| Assaults (per 100,000) | 2 (146.5) | 0 (0.0) | 3 (243.5) | 3 (244.1) | 1 (81.6) | 1 (81.7) | 1 (82.3) | 1 (82.9) | 2 (166.4) | 3 (250.0) | 2 (145.6) |
| Burglaries (per 100,000) | 3 (219.8) | 6 (489.8) | 4 (324.7) | 4 (325.5) | 2 (163.3) | 6 (490.2) | 4 (329.2) | 3 (248.6) | 0 (0.0) | 0 (0.0) | 1 (72.8) |
| Thefts (per 100,000) | 16 (1,172) | 20 (1,633) | 17 (1,380) | 13 (1,058) | 21 (1,714) | 7 (571.9) | 8 (658.4) | 1 (82.9) | 2 (166.4) | 7 (583.3) | 8 (582.2) |
| Auto thefts (per 100,000) | 0 (0.0) | 0 (0.0) | 0 (0.0) | 1 (81.4) | 0 (0.0) | 0 (0.0) | 0 (0.0) | 0 (0.0) | 0 (0.0) | 0 (0.0) | 0 (0.0) |
| Arson (per 100,000) | 0 (0.0) | 0 (0.0) | 0 (0.0) | 0 (0.0) | 0 (0.0) | 0 (0.0) | 1 (82.3) | 0 (0.0) | 0 (0.0) | 0 (0.0) | 0 (0.0) |
| City-Data.com crime index | 91.6 | 99.6 | 126.6 | 120.4 | 96.3 | 98.0 | 65.8 | 37.3 | 39.9 | 73.3 | 57.5 |
The City-Data.com crime index weighs serious crimes and violent crimes more heavily. Higher means more crime, U.S. average is 246.1. It adjusts for the number of visitors and daily workers commuting into cities.

Crime rate in Egremont detailed stats: murders, rapes, robberies, assaults, burglaries, thefts, arson
Full-time law enforcement employees in 2019, including police officers: 4 (4 officers - 4 male; 0 female).
| Officers per 1,000 residents here: | 3.32 |
| Massachusetts average: | 2.59 |
 Recent articles from our blog. Our writers, many of them Ph.D. graduates or candidates, create easy-to-read articles on a wide variety of topics.

Ancestries: Irish (17.7%), English (17.0%), German (13.8%), Italian (11.2%), Russian (6.4%), Polish (5.9%).
Current Local Time: EST time zone
Incorporated in 1775
Land area: 18.8 square miles.
Population density: 65 people per square mile (very low).
65 residents are foreign born (4.2% Europe).
| This town: | 4.8% |
| Massachusetts: | 12.2% |
| Egremont town: | 0.8% ($1,768) |
| Massachusetts: | 1.3% ($2,336) |
Nearest city with pop. 50,000+: Albany, NY  (37.6 miles , pop. 95,658).
Nearest city with pop. 200,000+: Bronx, NY (94.8 miles , pop. 1,332,650).
Nearest cities:
), ), ), Latitude: 42.18 N, Longitude: 73.44 W
Area code commonly used in this area: 413

Single-family new house construction building permits:
- 2022: 4 buildings, average cost: $2,416,900
- 2021: 9 buildings, average cost: $450,000
- 2020: 5 buildings, average cost: $319,200
- 2019: 5 buildings, average cost: $403,600
- 2018: 5 buildings, average cost: $403,600
- 2017: 7 buildings, average cost: $564,900
- 2016: 7 buildings, average cost: $564,900
- 2015: 6 buildings, average cost: $564,900
- 2014: 4 buildings, average cost: $454,100
- 2013: 2 buildings, average cost: $117,500
- 2012: 2 buildings, average cost: $117,500
- 2011: 3 buildings, average cost: $202,300
- 2010: 7 buildings, average cost: $544,900
- 2009: 4 buildings, average cost: $418,100
- 2007: 7 buildings, average cost: $375,900
- 2006: 4 buildings, average cost: $295,200
- 2005: 13 buildings, average cost: $429,900
- 2004: 13 buildings, average cost: $429,900
- 2003: 11 buildings, average cost: $230,500
- 2002: 9 buildings, average cost: $286,400
- 2001: 7 buildings, average cost: $282,900
- 2000: 7 buildings, average cost: $144,800
- 1999: 7 buildings, average cost: $306,000
- 1998: 9 buildings, average cost: $200,700
- 1997: 8 buildings, average cost: $207,400


| Here: | 1.7% |
| Massachusetts: | 3.5% |


- Educational services (16.5%)
- Accommodation & food services (8.8%)
- Construction (8.5%)
- Health care (8.4%)
- Professional, scientific, technical services (8.4%)
- Used merchandise, gift, novelty, souvenir, other miscellaneous stores (4.1%)
- Arts, entertainment, recreation (4.0%)

- Construction (16.8%)
- Educational services (7.7%)
- Accommodation & food services (7.4%)
- Professional, scientific, technical services (7.2%)
- Arts, entertainment, recreation (6.3%)
- Health care (5.0%)
- Administrative & support & waste management services (4.1%)

- Educational services (25.3%)
- Health care (11.8%)
- Accommodation & food services (10.2%)
- Professional, scientific, technical services (9.6%)
- Used merchandise, gift, novelty, souvenir, other miscellaneous stores (4.7%)
- Real estate & rental & leasing (3.6%)
- Finance & insurance (3.3%)

- Other sales and related occupations, including supervisors (6.5%)
- Building and grounds cleaning and maintenance occupations (6.3%)
- Preschool, kindergarten, elementary, and middle school teachers (6.1%)
- Other management occupations, except farmers and farm managers (4.7%)
- Top executives (4.0%)
- Counselors, social workers, and other community and social service specialists (3.9%)
- Retail sales workers, except cashiers (3.3%)

- Top executives (6.1%)
- Building and grounds cleaning and maintenance occupations (5.8%)
- Other management occupations, except farmers and farm managers (5.5%)
- Other sales and related occupations, including supervisors (5.2%)
- Carpenters (3.6%)
- Cooks and food preparation workers (3.6%)
- Media and communications workers (3.6%)

- Preschool, kindergarten, elementary, and middle school teachers (10.4%)
- Other sales and related occupations, including supervisors (7.7%)
- Building and grounds cleaning and maintenance occupations (6.9%)
- Counselors, social workers, and other community and social service specialists (5.8%)
- Other teachers, instructors, education, training, and library occupations (5.2%)
- Retail sales workers, except cashiers (3.8%)
- Other management occupations, except farmers and farm managers (3.8%)
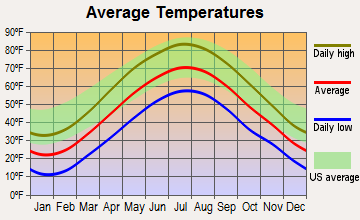
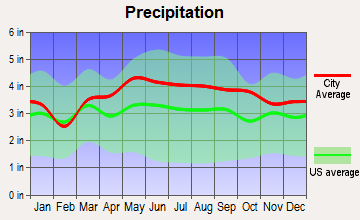
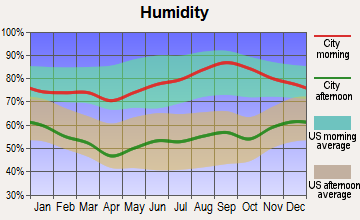
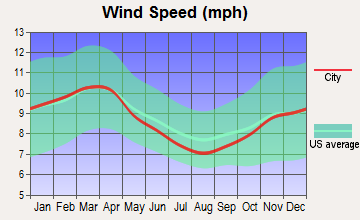
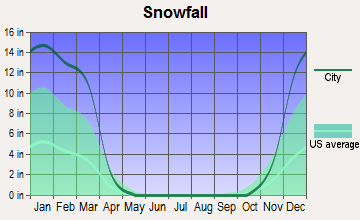
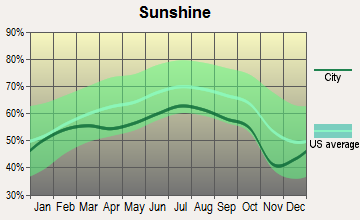
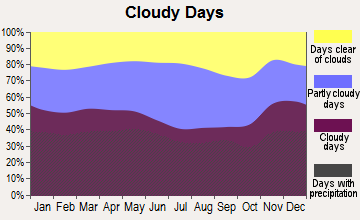
Average climate in Egremont, Massachusetts
Based on data reported by over 4,000 weather stations
(lower is better)

Air Quality Index (AQI) level in 2022 was 63.2. This is about average.
| City: | 63.2 |
| U.S.: | 72.6 |

Ozone [ppb] level in 2022 was 27.5. This is better than average. Closest monitor was 21.5 miles away from the city center.
| City: | 27.5 |
| U.S.: | 33.3 |

Particulate Matter (PM2.5) [µg/m3] level in 2022 was 6.76. This is about average. Closest monitor was 20.9 miles away from the city center.
| City: | 6.76 |
| U.S.: | 8.11 |
Tornado activity:
Egremont-area historical tornado activity is slightly above Massachusetts state average. It is 19% smaller than the overall U.S. average.
On 5/29/1995, a category F4 (max. wind speeds 207-260 mph) tornado 1.6 miles away from the Egremont town center killed 3 people and injured 24 people and caused between $5,000,000 and $50,000,000 in damages.
On 8/28/1973, a category F4 tornado 7.0 miles away from the town center killed 4 people and injured 36 people and caused between $5,000,000 and $50,000,000 in damages.
Earthquake activity:
Egremont-area historical earthquake activity is significantly above Massachusetts state average. It is 68% smaller than the overall U.S. average.On 10/7/1983 at 10:18:46, a magnitude 5.3 (5.1 MB, 5.3 LG, 5.1 ML, Class: Moderate, Intensity: VI - VII) earthquake occurred 130.9 miles away from Egremont center
On 4/20/2002 at 10:50:47, a magnitude 5.3 (5.3 ML, Depth: 3.0 mi) earthquake occurred 161.9 miles away from Egremont center
On 4/20/2002 at 10:50:47, a magnitude 5.2 (5.2 MB, 4.2 MS, 5.2 MW, 5.0 MW) earthquake occurred 160.3 miles away from the city center
On 1/19/1982 at 00:14:42, a magnitude 4.7 (4.5 MB, 4.7 MD, 4.5 LG, Class: Light, Intensity: IV - V) earthquake occurred 130.6 miles away from Egremont center
On 10/16/2012 at 23:12:25, a magnitude 4.7 (4.7 ML, Depth: 10.0 mi) earthquake occurred 171.8 miles away from Egremont center
On 8/23/2011 at 17:51:04, a magnitude 5.8 (5.8 MW, Depth: 3.7 mi) earthquake occurred 379.2 miles away from Egremont center
Magnitude types: regional Lg-wave magnitude (LG), body-wave magnitude (MB), duration magnitude (MD), local magnitude (ML), surface-wave magnitude (MS), moment magnitude (MW)
Natural disasters:
The number of natural disasters in Berkshire County (21) is greater than the US average (15).Major Disasters (Presidential) Declared: 10
Emergencies Declared: 10
Causes of natural disasters: Floods: 5, Snowstorms: 5, Storms: 5, Hurricanes: 4, Winter Storms: 4, Blizzards: 2, Snows: 2, Snowfall: 1, Tropical Storm: 1, Wind: 1, Other: 1 (Note: some incidents may be assigned to more than one category).
Hospitals and medical centers near Egremont:
- KINDRED NRSING AND REHABILITATION-TIMBERLYN HEIGHTS (Nursing Home, about 4 miles away; GREAT BARRINGTON, MA)
- FAIRVIEW HOSPITAL Critical Access Hospitals (about 4 miles away; GREAT BARRINGTON, MA)
- GREAT BARRINGTON REHABILITATION AND NURSING CENTER (Nursing Home, about 4 miles away; GREAT BARRINGTON, MA)
- FAIRVIEW HOSPITAL DIALYSIS CENTER (Dialysis Facility, about 4 miles away; GREAT BARRINGTON, MA)
- NOBLE HORIZONS (Nursing Home, about 14 miles away; SALISBURY, CT)
- LEE REGIONAL VNA INC. (Home Health Center, about 14 miles away; LEE, MA)
- KINDRED NURSING AND REHABILITATION-LAUREL LAKE (Nursing Home, about 14 miles away; LEE, MA)
Amtrak station near Egremont:
Colleges/universities with over 2000 students nearest to Egremont:
- Bard College (about 27 miles; Annandale-On-Hudson, NY; Full-time enrollment: 3,137)
- Westfield State University (about 34 miles; Westfield, MA; FT enrollment: 5,548)
- Hudson Valley Community College (about 38 miles; Troy, NY; FT enrollment: 9,346)
- The College of Saint Rose (about 39 miles; Albany, NY; FT enrollment: 4,085)
- Williams College (about 39 miles; Williamstown, MA; FT enrollment: 2,141)
- Culinary Institute of America (about 40 miles; Hyde Park, NY; FT enrollment: 3,869)
- Dutchess Community College (about 40 miles; Poughkeepsie, NY; FT enrollment: 6,554)
Points of interest:
Notable locations in Egremont: Egremont Fire Department Main Street (A), Egremont Fire Department (B). Display/hide their locations on the map
Church in Egremont: First Congregational Church (A). Display/hide its location on the map
Cemetery: Riverside Cemetery (1). Display/hide its location on the map
Lakes and reservoirs: Marsh Pond (A), Mill Pond (B), Prospect Lake (C). Display/hide their locations on the map
Streams, rivers, and creeks: Karner Brook (A), Fenton Brook (B). Display/hide their locations on the map
Parks in Egremont include: North Egremont Historic District (1), South Egremont Village Historic District (2). Display/hide their locations on the map
Birthplace of: Meg Hutchinson - Female singer.
| This town: | 2.2 people |
| Massachusetts: | 2.5 people |
| This town: | 61.6% |
| Whole state: | 63.0% |
| This town: | 8.5% |
| Whole state: | 7.0% |
Likely homosexual households (counted as self-reported same-sex unmarried-partner households)
- Lesbian couples: 1.1% of all households
- Gay men: 0.9% of all households
| This town: | 5.1% |
| Whole state: | 9.3% |
| This town: | 2.4% |
| Whole state: | 4.4% |
For population 15 years and over in Egremont:

- Never married: 19.0%
- Now married: 60.5%
- Separated: 2.2%
- Widowed: 6.6%
- Divorced: 11.8%
For population 25 years and over in Egremont:
- High school or higher: 93.2%
- Bachelor's degree or higher: 43.2%
- Graduate or professional degree: 21.3%
- Unemployed: 2.8%
- Mean travel time to work (commute): 22.5 minutes


| Here: | 10.7 |
| Massachusetts average: | 13.1 |
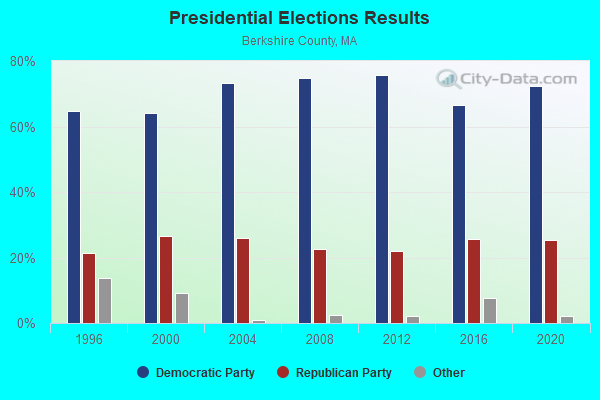
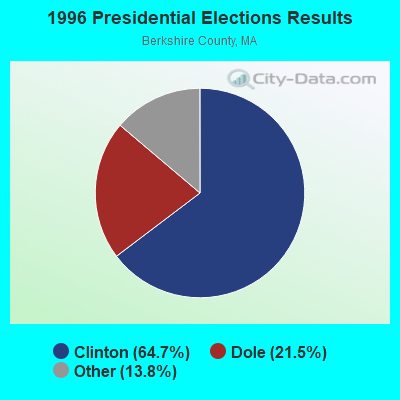

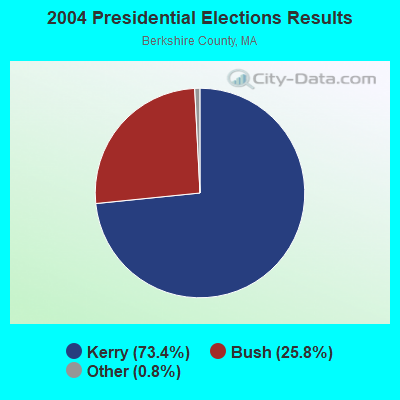
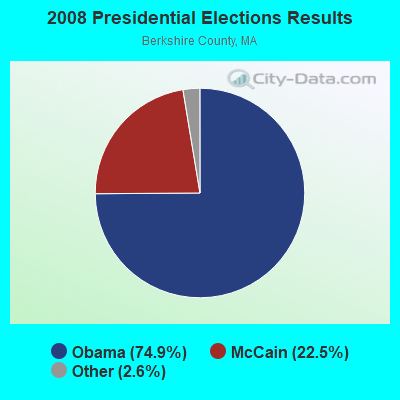

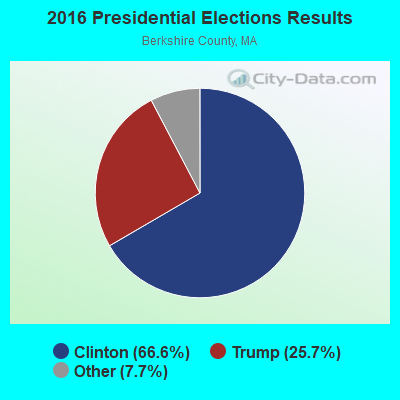

Graphs represent county-level data. Detailed 2008 Election Results
Religion statistics for Egremont, MA (based on Berkshire County data)
| Religion | Adherents | Congregations |
|---|---|---|
| Catholic | 50,187 | 32 |
| Mainline Protestant | 9,895 | 63 |
| Other | 3,647 | 20 |
| Evangelical Protestant | 2,817 | 28 |
| Black Protestant | 233 | 2 |
| Orthodox | 225 | 2 |
| None | 64,215 | - |
Food Environment Statistics:
| Berkshire County: | 2.54 / 10,000 pop. |
| Massachusetts: | 1.98 / 10,000 pop. |
| Berkshire County: | 1.61 / 10,000 pop. |
| State: | 2.22 / 10,000 pop. |
| Here: | 4.08 / 10,000 pop. |
| Massachusetts: | 1.77 / 10,000 pop. |
| This county: | 15.00 / 10,000 pop. |
| Massachusetts: | 8.76 / 10,000 pop. |
| This county: | 8.0% |
| Massachusetts: | 8.1% |
| This county: | 22.8% |
| Massachusetts: | 22.5% |
| Berkshire County: | 9.9% |
| Massachusetts: | 16.5% |
Strongest AM radio stations in Egremont:
- WSBS (860 AM; 3 kW; GREAT BARRINGTON, MA; Owner: BERKSHIRE BROADCASTING CO., INC.)
- WNNZ (640 AM; 50 kW; WESTFIELD, MA; Owner: CLEAR CHANNEL BROADCASTING LICENSES, INC.)
- WTIC (1080 AM; 50 kW; HARTFORD, CT; Owner: INFINITY RADIO OPERATIONS INC.)
- WGY (810 AM; 50 kW; SCHENECTADY, NY; Owner: CLEAR CHANNEL BROADCASTING LICENSES, INC.)
- WPTR (1540 AM; 50 kW; ALBANY, NY; Owner: KIMTRON, INC.)
- WUHN (1110 AM; daytime; 5 kW; PITTSFIELD, MA; Owner: WEINER BROADCASTING, INC.)
- WKZE (1020 AM; daytime; 2 kW; SHARON, CT; Owner: JOHNSON DEVELOPMENT, INC.)
- WCRN (830 AM; 50 kW; WORCESTER, MA; Owner: CARTER BROADCASTING CORPORATION)
- WFAN (660 AM; 50 kW; NEW YORK, NY; Owner: INFINITY BROADCASTING OPERATIONS, INC.)
- WMCA (570 AM; 50 kW; NEW YORK, NY; Owner: SALEM MEDIA OF NEW YORK, LLC)
- WROW (590 AM; 5 kW; ALBANY, NY; Owner: 6 JOHNSON ROAD LICENSES, INC.)
- WABC (770 AM; 50 kW; NEW YORK, NY; Owner: WABC-AM RADIO, INC.)
- WOR (710 AM; 50 kW; NEW YORK, NY; Owner: BUCKLEY BROADCASTING CORPORATION)
Strongest FM radio stations in Egremont:
- WAMQ (105.1 FM; GREAT BARRINGTON, MA; Owner: WAMC)
- WHVP (91.1 FM; HUDSON, NY; Owner: SOUND OF LIFE, INC.)
- WAMC-FM (90.3 FM; ALBANY, NY; Owner: WAMC)
- WAMK (90.9 FM; KINGSTON, NY; Owner: W A M C)
- WFGB (89.7 FM; KINGSTON, NY; Owner: SOUND OF LIFE, INC.)
- WBEC-FM (105.5 FM; PITTSFIELD, MA; Owner: GREAT NORTHERN RADIO, LLC)
- WUPE (95.9 FM; PITTSFIELD, MA; Owner: WEINER BROADCASTING, INC.)
- WKZE-FM (98.1 FM; SALISBURY, CT; Owner: JOHNSON DEVELOPMENT, INC.)
- WPDH (101.5 FM; POUGHKEEPSIE, NY; Owner: CUMULUS LICENSING CORP.)
- WFNP (88.7 FM; ROSENDALE, NY; Owner: STATE UNIVERSITY OF NEW YORK)
- WRHV (88.7 FM; POUGHKEEPSIE, NY; Owner: WMHT EDUCATIONAL TELECOMMUNICATIONS)
- WEQX (102.7 FM; MANCHESTER, VT; Owner: NORTHSHIRE COMMUNICATIONS, INC.)
- WQQQ (103.3 FM; SHARON, CT; Owner: THE RIDGEFIELD BROADCASTING CORPORATION)
- WZEC (97.5 FM; HOOSICK FALLS, NY; Owner: GREAT NORTHERN RADIO, LLC)
- WRCH (100.5 FM; NEW BRITAIN, CT; Owner: INFINITY RADIO OPERATIONS INC.)
- WAJZ (96.3 FM; VOORHEESVILLE, NY; Owner: 6 JOHNSON ROAD LICENSES, INC.)
- WRNQ (92.1 FM; POUGHKEEPSIE, NY; Owner: CLEAR CHANNEL BROADCASTING LICENSES, INC.)
- WZMR (104.9 FM; ALTAMONT, NY; Owner: 6 JOHNSON ROAD LICENSES, INC.)
- WHYN-FM (93.1 FM; SPRINGFIELD, MA; Owner: CLEAR CHANNEL BROADCASTING LICENSES, INC.)
- WCTW (98.5 FM; CATSKILL, NY; Owner: CLEAR CHANNEL BROADCASTING LICENSES, INC.)
TV broadcast stations around Egremont:
- WTIC-TV (Channel 61; HARTFORD, CT; Owner: TRIBUNE TELEVISION COMPANY)
- W11BJ (Channel 11; HARTFORD, CT; Owner: COMMUNICATIONS SITE MANAGEMENT LLC)
- WTXX (Channel 20; WATERBURY, CT; Owner: WTXX INC.)
- WUVN (Channel 18; HARTFORD, CT; Owner: ENTRAVISION HOLDINGS, LLC)
- WVIT (Channel 30; NEW BRITAIN, CT; Owner: OUTLET BROADCASTING, INC)
- WEDH (Channel 24; HARTFORD, CT; Owner: CONNECTICUT PUBLIC BROADCASTING, INC.)
- National Bridge Inventory (NBI) Statistics
- 9Number of bridges
- 33ft / 10.0mTotal length
- $4,885,000Total costs
- 9,127Total average daily traffic
- 535Total average daily truck traffic
- 7,424Total future (year 2031) average daily traffic
FCC Registered Private Land Mobile Towers:
1- 4 Km Sw (Lat: 42.132861 Lon: -73.457333), Type: Tower, Structure height: 27 m, Call Sign: WPHI525, Licensee ID: L01422065,
Assigned Frequencies: 929.962 MHz, Grant Date: 06/05/2000, Expiration Date: 06/05/2010, Cancellation Date: 04/28/2010, Certifier: Shawn E Endsley, Registrant: Usa Mobility Wireless, Inc., 3000 Technology Dr. #400, Plano, TX 75074, Phone: (972) 801-0000, Fax: (972) 801-1699, Email:
FCC Registered Amateur Radio Licenses:
5- Call Sign: KB1GDS, Licensee ID: L00313959, Grant Date: 01/12/2001, Expiration Date: 01/12/2011, Cancellation Date: 02/13/2001, Certifier: Peter D Campbell, Registrant: Peter D Campbell, N Egremont, MA 01252
- Call Sign: KB1YEK, Licensee ID: L01711015, Grant Date: 05/17/2012, Expiration Date: 05/17/2022, Certifier: Sandra B Martin, Registrant: Sandra B Martin, 223 Egremont Plain Rd, Egremont, MA 01230
- Call Sign: KB1YEL, Licensee ID: L01711016, Grant Date: 05/17/2012, Expiration Date: 05/17/2022, Certifier: Daniel W Martin, Registrant: Daniel W Martin, 223 Egremont Plain Rd 25, Egremont, MA 01230
- Call Sign: KC1LVD, Licensee ID: L02287580, Grant Date: 08/23/2019, Expiration Date: 08/23/2029, Certifier: Mark C Rosen, Registrant: Mark C Rosen, 223 Egremont Plain Road, Egremont, MA 01230
- Call Sign: KC1QOW, Licensee ID: L02534867, Grant Date: 03/09/2022, Expiration Date: 03/09/2032, Certifier: Sharon Siter, Registrant: Sharon Siter, S Egremont, MA 01258-0194

- 65.9%Fuel oil, kerosene, etc.
- 12.3%Bottled, tank, or LP gas
- 11.5%Electricity
- 9.4%Wood
- 0.8%Other fuel

- 61.2%Fuel oil, kerosene, etc.
- 17.4%Bottled, tank, or LP gas
- 14.9%Electricity
- 5.0%Wood
- 1.7%Utility gas
Egremont compared to Massachusetts state average:
- Unemployed percentage significantly below state average.
- Black race population percentage significantly below state average.
- Hispanic race population percentage significantly below state average.
- Median age significantly above state average.
- Foreign-born population percentage significantly below state average.
- Renting percentage below state average.
- Length of stay since moving in significantly above state average.
- Number of rooms per house significantly below state average.
- House age significantly below state average.

|
Total of 1 patent application in 2008-2024.