Elizabeth, New Jersey Submit your own pictures of this city and show them to the world
OSM Map
General Map
Google Map
MSN Map
OSM Map
General Map
Google Map
MSN Map
OSM Map
General Map
Google Map
MSN Map
OSM Map
General Map
Google Map
MSN Map
Please wait while loading the map...
Population in 2022: 134,283 (100% urban, 0% rural). Population change since 2000: +11.4%Males: 69,912 Females: 64,371
March 2022 cost of living index in Elizabeth: 118.4 (more than average, U.S. average is 100) Percentage of residents living in poverty in 2022: 16.6%for White Non-Hispanic residents , 17.2% for Black residents , 15.1% for Hispanic or Latino residents , 14.4% for American Indian residents , 15.2% for other race residents , 11.7% for two or more races residents )
Profiles of local businesses
Business Search - 14 Million verified businesses
Data:
Median household income ($)
Median household income (% change since 2000)
Household income diversity
Ratio of average income to average house value (%)
Ratio of average income to average rent
Median household income ($) - White
Median household income ($) - Black or African American
Median household income ($) - Asian
Median household income ($) - Hispanic or Latino
Median household income ($) - American Indian and Alaska Native
Median household income ($) - Multirace
Median household income ($) - Other Race
Median household income for houses/condos with a mortgage ($)
Median household income for apartments without a mortgage ($)
Races - White alone (%)
Races - White alone (% change since 2000)
Races - Black alone (%)
Races - Black alone (% change since 2000)
Races - American Indian alone (%)
Races - American Indian alone (% change since 2000)
Races - Asian alone (%)
Races - Asian alone (% change since 2000)
Races - Hispanic (%)
Races - Hispanic (% change since 2000)
Races - Native Hawaiian and Other Pacific Islander alone (%)
Races - Native Hawaiian and Other Pacific Islander alone (% change since 2000)
Races - Two or more races (%)
Races - Two or more races (% change since 2000)
Races - Other race alone (%)
Races - Other race alone (% change since 2000)
Racial diversity
Unemployment (%)
Unemployment (% change since 2000)
Unemployment (%) - White
Unemployment (%) - Black or African American
Unemployment (%) - Asian
Unemployment (%) - Hispanic or Latino
Unemployment (%) - American Indian and Alaska Native
Unemployment (%) - Multirace
Unemployment (%) - Other Race
Population density (people per square mile)
Population - Males (%)
Population - Females (%)
Population - Males (%) - White
Population - Males (%) - Black or African American
Population - Males (%) - Asian
Population - Males (%) - Hispanic or Latino
Population - Males (%) - American Indian and Alaska Native
Population - Males (%) - Multirace
Population - Males (%) - Other Race
Population - Females (%) - White
Population - Females (%) - Black or African American
Population - Females (%) - Asian
Population - Females (%) - Hispanic or Latino
Population - Females (%) - American Indian and Alaska Native
Population - Females (%) - Multirace
Population - Females (%) - Other Race
Coronavirus confirmed cases (Apr 25, 2024)
Deaths caused by coronavirus (Apr 25, 2024)
Coronavirus confirmed cases (per 100k population) (Apr 25, 2024)
Deaths caused by coronavirus (per 100k population) (Apr 25, 2024)
Daily increase in number of cases (Apr 25, 2024)
Weekly increase in number of cases (Apr 25, 2024)
Cases doubled (in days) (Apr 25, 2024)
Hospitalized patients (Apr 18, 2022)
Negative test results (Apr 18, 2022)
Total test results (Apr 18, 2022)
COVID Vaccine doses distributed (per 100k population) (Sep 19, 2023)
COVID Vaccine doses administered (per 100k population) (Sep 19, 2023)
COVID Vaccine doses distributed (Sep 19, 2023)
COVID Vaccine doses administered (Sep 19, 2023)
Likely homosexual households (%)
Likely homosexual households (% change since 2000)
Likely homosexual households - Lesbian couples (%)
Likely homosexual households - Lesbian couples (% change since 2000)
Likely homosexual households - Gay men (%)
Likely homosexual households - Gay men (% change since 2000)
Cost of living index
Median gross rent ($)
Median contract rent ($)
Median monthly housing costs ($)
Median house or condo value ($)
Median house or condo value ($ change since 2000)
Mean house or condo value by units in structure - 1, detached ($)
Mean house or condo value by units in structure - 1, attached ($)
Mean house or condo value by units in structure - 2 ($)
Mean house or condo value by units in structure by units in structure - 3 or 4 ($)
Mean house or condo value by units in structure - 5 or more ($)
Mean house or condo value by units in structure - Boat, RV, van, etc. ($)
Mean house or condo value by units in structure - Mobile home ($)
Median house or condo value ($) - White
Median house or condo value ($) - Black or African American
Median house or condo value ($) - Asian
Median house or condo value ($) - Hispanic or Latino
Median house or condo value ($) - American Indian and Alaska Native
Median house or condo value ($) - Multirace
Median house or condo value ($) - Other Race
Median resident age
Resident age diversity
Median resident age - Males
Median resident age - Females
Median resident age - White
Median resident age - Black or African American
Median resident age - Asian
Median resident age - Hispanic or Latino
Median resident age - American Indian and Alaska Native
Median resident age - Multirace
Median resident age - Other Race
Median resident age - Males - White
Median resident age - Males - Black or African American
Median resident age - Males - Asian
Median resident age - Males - Hispanic or Latino
Median resident age - Males - American Indian and Alaska Native
Median resident age - Males - Multirace
Median resident age - Males - Other Race
Median resident age - Females - White
Median resident age - Females - Black or African American
Median resident age - Females - Asian
Median resident age - Females - Hispanic or Latino
Median resident age - Females - American Indian and Alaska Native
Median resident age - Females - Multirace
Median resident age - Females - Other Race
Commute - mean travel time to work (minutes)
Travel time to work - Less than 5 minutes (%)
Travel time to work - Less than 5 minutes (% change since 2000)
Travel time to work - 5 to 9 minutes (%)
Travel time to work - 5 to 9 minutes (% change since 2000)
Travel time to work - 10 to 19 minutes (%)
Travel time to work - 10 to 19 minutes (% change since 2000)
Travel time to work - 20 to 29 minutes (%)
Travel time to work - 20 to 29 minutes (% change since 2000)
Travel time to work - 30 to 39 minutes (%)
Travel time to work - 30 to 39 minutes (% change since 2000)
Travel time to work - 40 to 59 minutes (%)
Travel time to work - 40 to 59 minutes (% change since 2000)
Travel time to work - 60 to 89 minutes (%)
Travel time to work - 60 to 89 minutes (% change since 2000)
Travel time to work - 90 or more minutes (%)
Travel time to work - 90 or more minutes (% change since 2000)
Marital status - Never married (%)
Marital status - Now married (%)
Marital status - Separated (%)
Marital status - Widowed (%)
Marital status - Divorced (%)
Median family income ($)
Median family income (% change since 2000)
Median non-family income ($)
Median non-family income (% change since 2000)
Median per capita income ($)
Median per capita income (% change since 2000)
Median family income ($) - White
Median family income ($) - Black or African American
Median family income ($) - Asian
Median family income ($) - Hispanic or Latino
Median family income ($) - American Indian and Alaska Native
Median family income ($) - Multirace
Median family income ($) - Other Race
Median year house/condo built
Median year apartment built
Year house built - Built 2005 or later (%)
Year house built - Built 2000 to 2004 (%)
Year house built - Built 1990 to 1999 (%)
Year house built - Built 1980 to 1989 (%)
Year house built - Built 1970 to 1979 (%)
Year house built - Built 1960 to 1969 (%)
Year house built - Built 1950 to 1959 (%)
Year house built - Built 1940 to 1949 (%)
Year house built - Built 1939 or earlier (%)
Average household size
Household density (households per square mile)
Average household size - White
Average household size - Black or African American
Average household size - Asian
Average household size - Hispanic or Latino
Average household size - American Indian and Alaska Native
Average household size - Multirace
Average household size - Other Race
Occupied housing units (%)
Vacant housing units (%)
Owner occupied housing units (%)
Renter occupied housing units (%)
Vacancy status - For rent (%)
Vacancy status - For sale only (%)
Vacancy status - Rented or sold, not occupied (%)
Vacancy status - For seasonal, recreational, or occasional use (%)
Vacancy status - For migrant workers (%)
Vacancy status - Other vacant (%)
Residents with income below the poverty level (%)
Residents with income below 50% of the poverty level (%)
Children below poverty level (%)
Poor families by family type - Married-couple family (%)
Poor families by family type - Male, no wife present (%)
Poor families by family type - Female, no husband present (%)
Poverty status for native-born residents (%)
Poverty status for foreign-born residents (%)
Poverty among high school graduates not in families (%)
Poverty among people who did not graduate high school not in families (%)
Residents with income below the poverty level (%) - White
Residents with income below the poverty level (%) - Black or African American
Residents with income below the poverty level (%) - Asian
Residents with income below the poverty level (%) - Hispanic or Latino
Residents with income below the poverty level (%) - American Indian and Alaska Native
Residents with income below the poverty level (%) - Multirace
Residents with income below the poverty level (%) - Other Race
Air pollution - Air Quality Index (AQI)
Air pollution - CO
Air pollution - NO2
Air pollution - SO2
Air pollution - Ozone
Air pollution - PM10
Air pollution - PM25
Air pollution - Pb
Crime - Murders per 100,000 population
Crime - Rapes per 100,000 population
Crime - Robberies per 100,000 population
Crime - Assaults per 100,000 population
Crime - Burglaries per 100,000 population
Crime - Thefts per 100,000 population
Crime - Auto thefts per 100,000 population
Crime - Arson per 100,000 population
Crime - City-data.com crime index
Crime - Violent crime index
Crime - Property crime index
Crime - Murders per 100,000 population (5 year average)
Crime - Rapes per 100,000 population (5 year average)
Crime - Robberies per 100,000 population (5 year average)
Crime - Assaults per 100,000 population (5 year average)
Crime - Burglaries per 100,000 population (5 year average)
Crime - Thefts per 100,000 population (5 year average)
Crime - Auto thefts per 100,000 population (5 year average)
Crime - Arson per 100,000 population (5 year average)
Crime - City-data.com crime index (5 year average)
Crime - Violent crime index (5 year average)
Crime - Property crime index (5 year average)
1996 Presidential Elections Results (%) - Democratic Party (Clinton)
1996 Presidential Elections Results (%) - Republican Party (Dole)
1996 Presidential Elections Results (%) - Other
2000 Presidential Elections Results (%) - Democratic Party (Gore)
2000 Presidential Elections Results (%) - Republican Party (Bush)
2000 Presidential Elections Results (%) - Other
2004 Presidential Elections Results (%) - Democratic Party (Kerry)
2004 Presidential Elections Results (%) - Republican Party (Bush)
2004 Presidential Elections Results (%) - Other
2008 Presidential Elections Results (%) - Democratic Party (Obama)
2008 Presidential Elections Results (%) - Republican Party (McCain)
2008 Presidential Elections Results (%) - Other
2012 Presidential Elections Results (%) - Democratic Party (Obama)
2012 Presidential Elections Results (%) - Republican Party (Romney)
2012 Presidential Elections Results (%) - Other
2016 Presidential Elections Results (%) - Democratic Party (Clinton)
2016 Presidential Elections Results (%) - Republican Party (Trump)
2016 Presidential Elections Results (%) - Other
2020 Presidential Elections Results (%) - Democratic Party (Biden)
2020 Presidential Elections Results (%) - Republican Party (Trump)
2020 Presidential Elections Results (%) - Other
Ancestries Reported - Arab (%)
Ancestries Reported - Czech (%)
Ancestries Reported - Danish (%)
Ancestries Reported - Dutch (%)
Ancestries Reported - English (%)
Ancestries Reported - French (%)
Ancestries Reported - French Canadian (%)
Ancestries Reported - German (%)
Ancestries Reported - Greek (%)
Ancestries Reported - Hungarian (%)
Ancestries Reported - Irish (%)
Ancestries Reported - Italian (%)
Ancestries Reported - Lithuanian (%)
Ancestries Reported - Norwegian (%)
Ancestries Reported - Polish (%)
Ancestries Reported - Portuguese (%)
Ancestries Reported - Russian (%)
Ancestries Reported - Scotch-Irish (%)
Ancestries Reported - Scottish (%)
Ancestries Reported - Slovak (%)
Ancestries Reported - Subsaharan African (%)
Ancestries Reported - Swedish (%)
Ancestries Reported - Swiss (%)
Ancestries Reported - Ukrainian (%)
Ancestries Reported - United States (%)
Ancestries Reported - Welsh (%)
Ancestries Reported - West Indian (%)
Ancestries Reported - Other (%)
Educational Attainment - No schooling completed (%)
Educational Attainment - Less than high school (%)
Educational Attainment - High school or equivalent (%)
Educational Attainment - Less than 1 year of college (%)
Educational Attainment - 1 or more years of college (%)
Educational Attainment - Associate degree (%)
Educational Attainment - Bachelor's degree (%)
Educational Attainment - Master's degree (%)
Educational Attainment - Professional school degree (%)
Educational Attainment - Doctorate degree (%)
School Enrollment - Nursery, preschool (%)
School Enrollment - Kindergarten (%)
School Enrollment - Grade 1 to 4 (%)
School Enrollment - Grade 5 to 8 (%)
School Enrollment - Grade 9 to 12 (%)
School Enrollment - College undergrad (%)
School Enrollment - Graduate or professional (%)
School Enrollment - Not enrolled in school (%)
School enrollment - Public schools (%)
School enrollment - Private schools (%)
School enrollment - Not enrolled (%)
Median number of rooms in houses and condos
Median number of rooms in apartments
Housing units lacking complete plumbing facilities (%)
Housing units lacking complete kitchen facilities (%)
Density of houses
Urban houses (%)
Rural houses (%)
Households with people 60 years and over (%)
Households with people 65 years and over (%)
Households with people 75 years and over (%)
Households with one or more nonrelatives (%)
Households with no nonrelatives (%)
Population in households (%)
Family households (%)
Nonfamily households (%)
Population in families (%)
Family households with own children (%)
Median number of bedrooms in owner occupied houses
Mean number of bedrooms in owner occupied houses
Median number of bedrooms in renter occupied houses
Mean number of bedrooms in renter occupied houses
Median number of vehichles in owner occupied houses
Mean number of vehichles in owner occupied houses
Median number of vehichles in renter occupied houses
Mean number of vehichles in renter occupied houses
Mortgage status - with mortgage (%)
Mortgage status - with second mortgage (%)
Mortgage status - with home equity loan (%)
Mortgage status - with both second mortgage and home equity loan (%)
Mortgage status - without a mortgage (%)
Average family size
Average family size - White
Average family size - Black or African American
Average family size - Asian
Average family size - Hispanic or Latino
Average family size - American Indian and Alaska Native
Average family size - Multirace
Average family size - Other Race
Geographical mobility - Same house 1 year ago (%)
Geographical mobility - Moved within same county (%)
Geographical mobility - Moved from different county within same state (%)
Geographical mobility - Moved from different state (%)
Geographical mobility - Moved from abroad (%)
Place of birth - Born in state of residence (%)
Place of birth - Born in other state (%)
Place of birth - Native, outside of US (%)
Place of birth - Foreign born (%)
Housing units in structures - 1, detached (%)
Housing units in structures - 1, attached (%)
Housing units in structures - 2 (%)
Housing units in structures - 3 or 4 (%)
Housing units in structures - 5 to 9 (%)
Housing units in structures - 10 to 19 (%)
Housing units in structures - 20 to 49 (%)
Housing units in structures - 50 or more (%)
Housing units in structures - Mobile home (%)
Housing units in structures - Boat, RV, van, etc. (%)
House/condo owner moved in on average (years ago)
Renter moved in on average (years ago)
Year householder moved into unit - Moved in 1999 to March 2000 (%)
Year householder moved into unit - Moved in 1995 to 1998 (%)
Year householder moved into unit - Moved in 1990 to 1994 (%)
Year householder moved into unit - Moved in 1980 to 1989 (%)
Year householder moved into unit - Moved in 1970 to 1979 (%)
Year householder moved into unit - Moved in 1969 or earlier (%)
Means of transportation to work - Drove car alone (%)
Means of transportation to work - Carpooled (%)
Means of transportation to work - Public transportation (%)
Means of transportation to work - Bus or trolley bus (%)
Means of transportation to work - Streetcar or trolley car (%)
Means of transportation to work - Subway or elevated (%)
Means of transportation to work - Railroad (%)
Means of transportation to work - Ferryboat (%)
Means of transportation to work - Taxicab (%)
Means of transportation to work - Motorcycle (%)
Means of transportation to work - Bicycle (%)
Means of transportation to work - Walked (%)
Means of transportation to work - Other means (%)
Working at home (%)
Industry diversity
Most Common Industries - Agriculture, forestry, fishing and hunting, and mining (%)
Most Common Industries - Agriculture, forestry, fishing and hunting (%)
Most Common Industries - Mining, quarrying, and oil and gas extraction (%)
Most Common Industries - Construction (%)
Most Common Industries - Manufacturing (%)
Most Common Industries - Wholesale trade (%)
Most Common Industries - Retail trade (%)
Most Common Industries - Transportation and warehousing, and utilities (%)
Most Common Industries - Transportation and warehousing (%)
Most Common Industries - Utilities (%)
Most Common Industries - Information (%)
Most Common Industries - Finance and insurance, and real estate and rental and leasing (%)
Most Common Industries - Finance and insurance (%)
Most Common Industries - Real estate and rental and leasing (%)
Most Common Industries - Professional, scientific, and management, and administrative and waste management services (%)
Most Common Industries - Professional, scientific, and technical services (%)
Most Common Industries - Management of companies and enterprises (%)
Most Common Industries - Administrative and support and waste management services (%)
Most Common Industries - Educational services, and health care and social assistance (%)
Most Common Industries - Educational services (%)
Most Common Industries - Health care and social assistance (%)
Most Common Industries - Arts, entertainment, and recreation, and accommodation and food services (%)
Most Common Industries - Arts, entertainment, and recreation (%)
Most Common Industries - Accommodation and food services (%)
Most Common Industries - Other services, except public administration (%)
Most Common Industries - Public administration (%)
Occupation diversity
Most Common Occupations - Management, business, science, and arts occupations (%)
Most Common Occupations - Management, business, and financial occupations (%)
Most Common Occupations - Management occupations (%)
Most Common Occupations - Business and financial operations occupations (%)
Most Common Occupations - Computer, engineering, and science occupations (%)
Most Common Occupations - Computer and mathematical occupations (%)
Most Common Occupations - Architecture and engineering occupations (%)
Most Common Occupations - Life, physical, and social science occupations (%)
Most Common Occupations - Education, legal, community service, arts, and media occupations (%)
Most Common Occupations - Community and social service occupations (%)
Most Common Occupations - Legal occupations (%)
Most Common Occupations - Education, training, and library occupations (%)
Most Common Occupations - Arts, design, entertainment, sports, and media occupations (%)
Most Common Occupations - Healthcare practitioners and technical occupations (%)
Most Common Occupations - Health diagnosing and treating practitioners and other technical occupations (%)
Most Common Occupations - Health technologists and technicians (%)
Most Common Occupations - Service occupations (%)
Most Common Occupations - Healthcare support occupations (%)
Most Common Occupations - Protective service occupations (%)
Most Common Occupations - Fire fighting and prevention, and other protective service workers including supervisors (%)
Most Common Occupations - Law enforcement workers including supervisors (%)
Most Common Occupations - Food preparation and serving related occupations (%)
Most Common Occupations - Building and grounds cleaning and maintenance occupations (%)
Most Common Occupations - Personal care and service occupations (%)
Most Common Occupations - Sales and office occupations (%)
Most Common Occupations - Sales and related occupations (%)
Most Common Occupations - Office and administrative support occupations (%)
Most Common Occupations - Natural resources, construction, and maintenance occupations (%)
Most Common Occupations - Farming, fishing, and forestry occupations (%)
Most Common Occupations - Construction and extraction occupations (%)
Most Common Occupations - Installation, maintenance, and repair occupations (%)
Most Common Occupations - Production, transportation, and material moving occupations (%)
Most Common Occupations - Production occupations (%)
Most Common Occupations - Transportation occupations (%)
Most Common Occupations - Material moving occupations (%)
People in Group quarters - Institutionalized population (%)
People in Group quarters - Correctional institutions (%)
People in Group quarters - Federal prisons and detention centers (%)
People in Group quarters - Halfway houses (%)
People in Group quarters - Local jails and other confinement facilities (including police lockups) (%)
People in Group quarters - Military disciplinary barracks (%)
People in Group quarters - State prisons (%)
People in Group quarters - Other types of correctional institutions (%)
People in Group quarters - Nursing homes (%)
People in Group quarters - Hospitals/wards, hospices, and schools for the handicapped (%)
People in Group quarters - Hospitals/wards and hospices for chronically ill (%)
People in Group quarters - Hospices or homes for chronically ill (%)
People in Group quarters - Military hospitals or wards for chronically ill (%)
People in Group quarters - Other hospitals or wards for chronically ill (%)
People in Group quarters - Hospitals or wards for drug/alcohol abuse (%)
People in Group quarters - Mental (Psychiatric) hospitals or wards (%)
People in Group quarters - Schools, hospitals, or wards for the mentally retarded (%)
People in Group quarters - Schools, hospitals, or wards for the physically handicapped (%)
People in Group quarters - Institutions for the deaf (%)
People in Group quarters - Institutions for the blind (%)
People in Group quarters - Orthopedic wards and institutions for the physically handicapped (%)
People in Group quarters - Wards in general hospitals for patients who have no usual home elsewhere (%)
People in Group quarters - Wards in military hospitals for patients who have no usual home elsewhere (%)
People in Group quarters - Juvenile institutions (%)
People in Group quarters - Long-term care (%)
People in Group quarters - Homes for abused, dependent, and neglected children (%)
People in Group quarters - Residential treatment centers for emotionally disturbed children (%)
People in Group quarters - Training schools for juvenile delinquents (%)
People in Group quarters - Short-term care, detention or diagnostic centers for delinquent children (%)
People in Group quarters - Type of juvenile institution unknown (%)
People in Group quarters - Noninstitutionalized population (%)
People in Group quarters - College dormitories (includes college quarters off campus) (%)
People in Group quarters - Military quarters (%)
People in Group quarters - On base (%)
People in Group quarters - Barracks, unaccompanied personnel housing (UPH), (Enlisted/Officer), ;and similar group living quarters for military personnel (%)
People in Group quarters - Transient quarters for temporary residents (%)
People in Group quarters - Military ships (%)
People in Group quarters - Group homes (%)
People in Group quarters - Homes or halfway houses for drug/alcohol abuse (%)
People in Group quarters - Homes for the mentally ill (%)
People in Group quarters - Homes for the mentally retarded (%)
People in Group quarters - Homes for the physically handicapped (%)
People in Group quarters - Other group homes (%)
People in Group quarters - Religious group quarters (%)
People in Group quarters - Dormitories (%)
People in Group quarters - Agriculture workers' dormitories on farms (%)
People in Group quarters - Job Corps and vocational training facilities (%)
People in Group quarters - Other workers' dormitories (%)
People in Group quarters - Crews of maritime vessels (%)
People in Group quarters - Other nonhousehold living situations (%)
People in Group quarters - Other noninstitutional group quarters (%)
Residents speaking English at home (%)
Residents speaking English at home - Born in the United States (%)
Residents speaking English at home - Native, born elsewhere (%)
Residents speaking English at home - Foreign born (%)
Residents speaking Spanish at home (%)
Residents speaking Spanish at home - Born in the United States (%)
Residents speaking Spanish at home - Native, born elsewhere (%)
Residents speaking Spanish at home - Foreign born (%)
Residents speaking other language at home (%)
Residents speaking other language at home - Born in the United States (%)
Residents speaking other language at home - Native, born elsewhere (%)
Residents speaking other language at home - Foreign born (%)
Class of Workers - Employee of private company (%)
Class of Workers - Self-employed in own incorporated business (%)
Class of Workers - Private not-for-profit wage and salary workers (%)
Class of Workers - Local government workers (%)
Class of Workers - State government workers (%)
Class of Workers - Federal government workers (%)
Class of Workers - Self-employed workers in own not incorporated business and Unpaid family workers (%)
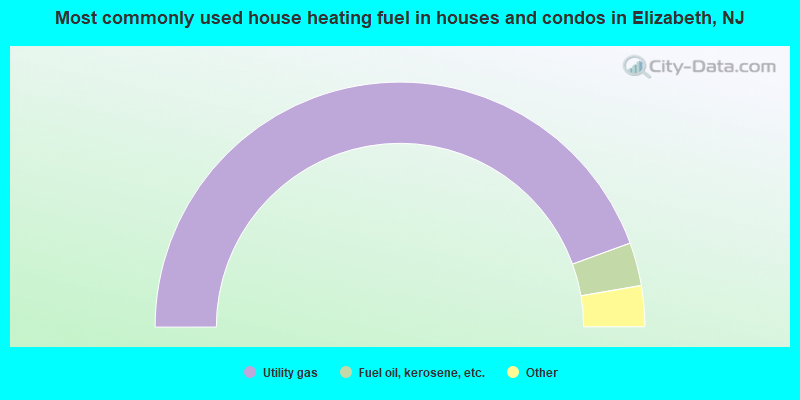
House heating fuel used in houses and condos - Utility gas (%)
House heating fuel used in houses and condos - Bottled, tank, or LP gas (%)
House heating fuel used in houses and condos - Electricity (%)
House heating fuel used in houses and condos - Fuel oil, kerosene, etc. (%)
House heating fuel used in houses and condos - Coal or coke (%)
House heating fuel used in houses and condos - Wood (%)
House heating fuel used in houses and condos - Solar energy (%)
House heating fuel used in houses and condos - Other fuel (%)
House heating fuel used in houses and condos - No fuel used (%)
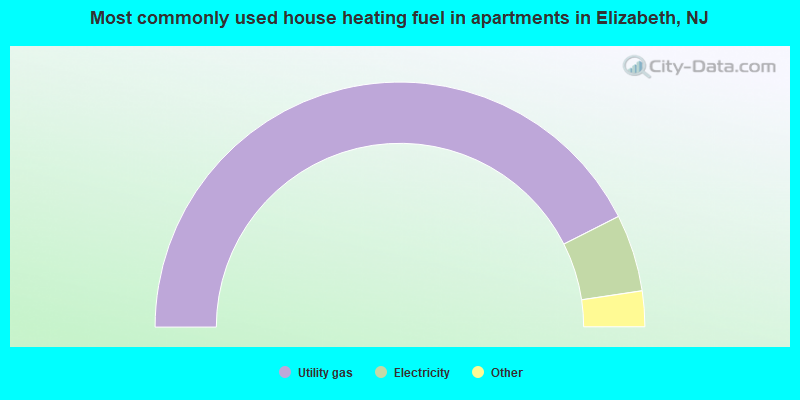
House heating fuel used in apartments - Utility gas (%)
House heating fuel used in apartments - Bottled, tank, or LP gas (%)
House heating fuel used in apartments - Electricity (%)
House heating fuel used in apartments - Fuel oil, kerosene, etc. (%)
House heating fuel used in apartments - Coal or coke (%)
House heating fuel used in apartments - Wood (%)
House heating fuel used in apartments - Solar energy (%)
House heating fuel used in apartments - Other fuel (%)
House heating fuel used in apartments - No fuel used (%)
Armed forces status - In Armed Forces (%)
Armed forces status - Civilian (%)
Armed forces status - Civilian - Veteran (%)
Armed forces status - Civilian - Nonveteran (%)
Fatal accidents locations in years 2005-2021
Fatal accidents locations in 2005
Fatal accidents locations in 2006
Fatal accidents locations in 2007
Fatal accidents locations in 2008
Fatal accidents locations in 2009
Fatal accidents locations in 2010
Fatal accidents locations in 2011
Fatal accidents locations in 2012
Fatal accidents locations in 2013
Fatal accidents locations in 2014
Fatal accidents locations in 2015
Fatal accidents locations in 2016
Fatal accidents locations in 2017
Fatal accidents locations in 2018
Fatal accidents locations in 2019
Fatal accidents locations in 2020
Fatal accidents locations in 2021
Alcohol use - People drinking some alcohol every month (%)
Alcohol use - People not drinking at all (%)
Alcohol use - Average days/month drinking alcohol
Alcohol use - Average drinks/week
Alcohol use - Average days/year people drink much
Audiometry - Average condition of hearing (%)
Audiometry - People that can hear a whisper from across a quiet room (%)
Audiometry - People that can hear normal voice from across a quiet room (%)
Audiometry - Ears ringing, roaring, buzzing (%)
Audiometry - Had a job exposure to loud noise (%)
Audiometry - Had off-work exposure to loud noise (%)
Blood Pressure & Cholesterol - Has high blood pressure (%)
Blood Pressure & Cholesterol - Checking blood pressure at home (%)
Blood Pressure & Cholesterol - Frequently checking blood cholesterol (%)
Blood Pressure & Cholesterol - Has high cholesterol level (%)
Consumer Behavior - Money monthly spent on food at supermarket/grocery store
Consumer Behavior - Money monthly spent on food at other stores
Consumer Behavior - Money monthly spent on eating out
Consumer Behavior - Money monthly spent on carryout/delivered foods
Consumer Behavior - Income spent on food at supermarket/grocery store (%)
Consumer Behavior - Income spent on food at other stores (%)
Consumer Behavior - Income spent on eating out (%)
Consumer Behavior - Income spent on carryout/delivered foods (%)
Current Health Status - General health condition (%)
Current Health Status - Blood donors (%)
Current Health Status - Has blood ever tested for HIV virus (%)
Current Health Status - Left-handed people (%)
Dermatology - People using sunscreen (%)
Diabetes - Diabetics (%)
Diabetes - Had a blood test for high blood sugar (%)
Diabetes - People taking insulin (%)
Diet Behavior & Nutrition - Diet health (%)
Diet Behavior & Nutrition - Milk product consumption (# of products/month)
Diet Behavior & Nutrition - Meals not home prepared (#/week)
Diet Behavior & Nutrition - Meals from fast food or pizza place (#/week)
Diet Behavior & Nutrition - Ready-to-eat foods (#/month)
Diet Behavior & Nutrition - Frozen meals/pizza (#/month)
Drug Use - People that ever used marijuana or hashish (%)
Drug Use - Ever used hard drugs (%)
Drug Use - Ever used any form of cocaine (%)
Drug Use - Ever used heroin (%)
Drug Use - Ever used methamphetamine (%)
Health Insurance - People covered by health insurance (%)
Kidney Conditions-Urology - Avg. # of times urinating at night
Medical Conditions - People with asthma (%)
Medical Conditions - People with anemia (%)
Medical Conditions - People with psoriasis (%)
Medical Conditions - People with overweight (%)
Medical Conditions - Elderly people having difficulties in thinking or remembering (%)
Medical Conditions - People who ever received blood transfusion (%)
Medical Conditions - People having trouble seeing even with glass/contacts (%)
Medical Conditions - People with arthritis (%)
Medical Conditions - People with gout (%)
Medical Conditions - People with congestive heart failure (%)
Medical Conditions - People with coronary heart disease (%)
Medical Conditions - People with angina pectoris (%)
Medical Conditions - People who ever had heart attack (%)
Medical Conditions - People who ever had stroke (%)
Medical Conditions - People with emphysema (%)
Medical Conditions - People with thyroid problem (%)
Medical Conditions - People with chronic bronchitis (%)
Medical Conditions - People with any liver condition (%)
Medical Conditions - People who ever had cancer or malignancy (%)
Mental Health - People who have little interest in doing things (%)
Mental Health - People feeling down, depressed, or hopeless (%)
Mental Health - People who have trouble sleeping or sleeping too much (%)
Mental Health - People feeling tired or having little energy (%)
Mental Health - People with poor appetite or overeating (%)
Mental Health - People feeling bad about themself (%)
Mental Health - People who have trouble concentrating on things (%)
Mental Health - People moving or speaking slowly or too fast (%)
Mental Health - People having thoughts they would be better off dead (%)
Oral Health - Average years since last visit a dentist
Oral Health - People embarrassed because of mouth (%)
Oral Health - People with gum disease (%)
Oral Health - General health of teeth and gums (%)
Oral Health - Average days a week using dental floss/device
Oral Health - Average days a week using mouthwash for dental problem
Oral Health - Average number of teeth
Pesticide Use - Households using pesticides to control insects (%)
Pesticide Use - Households using pesticides to kill weeds (%)
Physical Activity - People doing vigorous-intensity work activities (%)
Physical Activity - People doing moderate-intensity work activities (%)
Physical Activity - People walking or bicycling (%)
Physical Activity - People doing vigorous-intensity recreational activities (%)
Physical Activity - People doing moderate-intensity recreational activities (%)
Physical Activity - Average hours a day doing sedentary activities
Physical Activity - Average hours a day watching TV or videos
Physical Activity - Average hours a day using computer
Physical Functioning - People having limitations keeping them from working (%)
Physical Functioning - People limited in amount of work they can do (%)
Physical Functioning - People that need special equipment to walk (%)
Physical Functioning - People experiencing confusion/memory problems (%)
Physical Functioning - People requiring special healthcare equipment (%)
Prescription Medications - Average number of prescription medicines taking
Preventive Aspirin Use - Adults 40+ taking low-dose aspirin (%)
Reproductive Health - Vaginal deliveries (%)
Reproductive Health - Cesarean deliveries (%)
Reproductive Health - Deliveries resulted in a live birth (%)
Reproductive Health - Pregnancies resulted in a delivery (%)
Reproductive Health - Women breastfeeding newborns (%)
Reproductive Health - Women that had a hysterectomy (%)
Reproductive Health - Women that had both ovaries removed (%)
Reproductive Health - Women that have ever taken birth control pills (%)
Reproductive Health - Women taking birth control pills (%)
Reproductive Health - Women that have ever used Depo-Provera or injectables (%)
Reproductive Health - Women that have ever used female hormones (%)
Sexual Behavior - People 18+ that ever had sex (vaginal, anal, or oral) (%)
Sexual Behavior - Males 18+ that ever had vaginal sex with a woman (%)
Sexual Behavior - Males 18+ that ever performed oral sex on a woman (%)
Sexual Behavior - Males 18+ that ever had anal sex with a woman (%)
Sexual Behavior - Males 18+ that ever had any sex with a man (%)
Sexual Behavior - Females 18+ that ever had vaginal sex with a man (%)
Sexual Behavior - Females 18+ that ever performed oral sex on a man (%)
Sexual Behavior - Females 18+ that ever had anal sex with a man (%)
Sexual Behavior - Females 18+ that ever had any kind of sex with a woman (%)
Sexual Behavior - Average age people first had sex
Sexual Behavior - Average number of female sex partners in lifetime (males 18+)
Sexual Behavior - Average number of female vaginal sex partners in lifetime (males 18+)
Sexual Behavior - Average age people first performed oral sex on a woman (18+)
Sexual Behavior - Average number of woman performed oral sex on in lifetime (18+)
Sexual Behavior - Average number of male sex partners in lifetime (males 18+)
Sexual Behavior - Average number of male anal sex partners in lifetime (males 18+)
Sexual Behavior - Average age people first performed oral sex on a man (18+)
Sexual Behavior - Average number of male oral sex partners in lifetime (18+)
Sexual Behavior - People using protection when performing oral sex (%)
Sexual Behavior - Average number of times people have vaginal or anal sex a year
Sexual Behavior - People having sex without condom (%)
Sexual Behavior - Average number of male sex partners in lifetime (females 18+)
Sexual Behavior - Average number of male vaginal sex partners in lifetime (females 18+)
Sexual Behavior - Average number of female sex partners in lifetime (females 18+)
Sexual Behavior - Circumcised males 18+ (%)
Sleep Disorders - Average hours sleeping at night
Sleep Disorders - People that has trouble sleeping (%)
Smoking-Cigarette Use - People smoking cigarettes (%)
Taste & Smell - People 40+ having problems with smell (%)
Taste & Smell - People 40+ having problems with taste (%)
Taste & Smell - People 40+ that ever had wisdom teeth removed (%)
Taste & Smell - People 40+ that ever had tonsils teeth removed (%)
Taste & Smell - People 40+ that ever had a loss of consciousness because of a head injury (%)
Taste & Smell - People 40+ that ever had a broken nose or other serious injury to face or skull (%)
Taste & Smell - People 40+ that ever had two or more sinus infections (%)
Weight - Average height (inches)
Weight - Average weight (pounds)
Weight - Average BMI
Weight - People that are obese (%)
Weight - People that ever were obese (%)
Weight - People trying to lose weight (%)
The City-Data.com crime index weighs serious crimes and violent crimes more heavily. Higher means more crime, U.S. average is 246.1. It adjusts for the number of visitors and daily workers commuting into cities.
- means the value is smaller than the state average.
- means the value is about the same as the state average.
- means the value is bigger than the state average.
- means the value is much bigger than the state average.
Crime rate in Elizabeth detailed stats: murders, rapes, robberies, assaults, burglaries, thefts, arson Officers per 1,000 residents here:
2.47New Jersey average:
5.53
Latest news from Elizabeth, NJ collected exclusively by city-data.com from local newspapers, TV, and radio stations
Ancestries: Portuguese (4.0%), Haitian (3.3%), Brazilian (2.5%), Italian (1.6%), American (1.4%).
Current Local Time:
Land area: 12.2 square miles.
Population density: 10,988 people per square mile (high).
67,916 residents are foreign born (42.7% Latin America ).
This city:
50.3%New Jersey:
23.2%
Median real estate property taxes paid for housing units with mortgages in 2022: $10,001 (2.1%)Median real estate property taxes paid for housing units with no mortgage in 2022: $9,550 (2.3%)
Nearest city with pop. 200,000+: Newark, NJ
Nearest city with pop. 1,000,000+: Brooklyn, NY
Nearest cities:
Latitude: 40.66 N, Longitude: 74.21 W
Daytime population change due to commuting: -10,495 (-7.8%)Workers who live and work in this city: 24,809 (40.0%)
Single-family new house construction building permits:
2021: 4 buildings , average cost: $163,3002020: 26 buildings , average cost: $44,0002019: 14 buildings , average cost: $93,9002018: 4 buildings , average cost: $117,8002017: 25 buildings , average cost: $182,4002016: 1 building , cost: $153,1002015: 2 buildings , average cost: $86,8002014: 1 building , cost: $151,8002013: 2 buildings , average cost: $168,5002012: 3 buildings , average cost: $147,2002011: 2 buildings , average cost: $189,9002010: 4 buildings , average cost: $208,7002009: 17 buildings , average cost: $171,1002008: 8 buildings , average cost: $321,4002007: 6 buildings , average cost: $67,8002006: 16 buildings , average cost: $176,7002005: 2 buildings , average cost: $78,4002004: 8 buildings , average cost: $112,8002003: 5 buildings , average cost: $73,2002002: 88 buildings , average cost: $58,7002001: 35 buildings , average cost: $94,8002000: 108 buildings , average cost: $98,6001999: 14 buildings , average cost: $113,0001998: 5 buildings , average cost: $62,7001997: 15 buildings , average cost: $42,100Unemployment in December 2023:
Population change in the 1990s: +10,488 (+9.5%).
Most common occupations in Elizabeth, NJ (%)
Both Males Females
Other production occupations, including supervisors (7.4%)
Laborers and material movers, hand (5.6%)
Driver/sales workers and truck drivers (5.4%)
Building and grounds cleaning and maintenance occupations (5.4%)
Other office and administrative support workers, including supervisors (4.0%)
Material recording, scheduling, dispatching, and distributing workers (3.4%)
Secretaries and administrative assistants (3.3%)
Driver/sales workers and truck drivers (9.6%)
Other production occupations, including supervisors (7.6%)
Laborers and material movers, hand (6.6%)
Building and grounds cleaning and maintenance occupations (5.6%)
Material recording, scheduling, dispatching, and distributing workers (4.5%)
Vehicle and mobile equipment mechanics, installers, and repairers (3.8%)
Metal workers and plastic workers (3.8%)
Other production occupations, including supervisors (7.0%)
Secretaries and administrative assistants (6.9%)
Other office and administrative support workers, including supervisors (5.7%)
Building and grounds cleaning and maintenance occupations (5.1%)
Laborers and material movers, hand (4.4%)
Nursing, psychiatric, and home health aides (4.2%)
Cashiers (4.1%)
Tornado activity:
Elizabeth-area historical tornado activity is near New Jersey state average. It is 36% smaller than the overall U.S. average.
On 5/28/1973, a category F3 (max. wind speeds 158-206 mph) tornado 18.0 miles away from the Elizabeth city center caused between $50,000 and $500,000 in damages.
On 5/28/1973, a category F3 tornado 29.8 miles away from the city center injured 12 people and caused between $50,000 and $500,000 in damages.
Earthquake activity:
Elizabeth-area historical earthquake activity is significantly above New Jersey state average. It is 68% smaller than the overall U.S. average. On 8/23/2011 at 17:51:04, a magnitude 5.8 (5.8 MW, Depth: 3.7 mi, Class: Moderate, Intensity: VI - VII) earthquake occurred 275.7 miles away from the city center On 10/7/1983 at 10:18:46, a magnitude 5.3 (5.1 MB, 5.3 LG, 5.1 ML) earthquake occurred 227.7 miles away from the city center On 1/16/1994 at 01:49:16, a magnitude 4.6 (4.6 MB, 4.6 LG, Depth: 3.1 mi, Class: Light, Intensity: IV - V) earthquake occurred 98.9 miles away from the city center On 4/20/2002 at 10:50:47, a magnitude 5.3 (5.3 ML, Depth: 3.0 mi) earthquake occurred 267.6 miles away from the city center On 4/20/2002 at 10:50:47, a magnitude 5.2 (5.2 MB, 4.2 MS, 5.2 MW, 5.0 MW) earthquake occurred 265.7 miles away from the city center On 1/16/1994 at 00:42:43, a magnitude 4.2 (4.2 MB, 4.0 LG, Depth: 3.1 mi) earthquake occurred 97.4 miles away from Elizabeth center Magnitude types: regional Lg-wave magnitude (LG), body-wave magnitude (MB), local magnitude (ML), surface-wave magnitude (MS), moment magnitude (MW) Natural disasters: The number of natural disasters in Union County (27) is a lot greater than the US average (15).Major Disasters (Presidential) Declared: 17Emergencies Declared: 10Floods: 7, Hurricanes: 7, Storms: 6, Heavy Rains: 4, Snowstorms: 3, Blizzards: 2, Water Shortages: 2, Winter Storms: 2, Power Outage: 1, Tornado: 1, Wind: 1, Other: 3 (Note: some incidents may be assigned to more than one category). Hospitals in Elizabeth: ELIZABETH GEN MED CTR EAST (provides emergency services, 655 EAST JERSEY ST) TRINITAS REGIONAL MEDICAL CENTER (Voluntary non-profit - Private, 225 WILLIAMSON STREET) VN AND HEALTH SERVICES HOSPICE (354 UNION AVENUE) Nursing Homes in Elizabeth: EGMC BROTHER BONAVENTURE ECF (655 E JERSEY STREET) ELIZABETH NURSING AND REHAB (1048 GROVE STREET) ELMORA HILLS HEALTH AND REHABILITATION CENTER (225 W JERSEY STREET) PLAZA HEALTHCARE AND REHABILITATION CENTER (456 RAHWAY AVENUE) ST ELIZABETH HOSPITAL SUB ACUTE CARE (225 WILLIAMSON ST) TRINITAS HOSPITAL (655 EAST JERSEY STREET) WORKMANS CIRCLE (225 WEST JERSEY STREET) Dialysis Facilities in Elizabeth: RCG ELIZABETH DC (595 DIVISION STREET) TRINITAS HOSPITAL (DIALYSIS UNIT) TRINITAS LIVINGSTON ST (DIALYSIS UNIT) Home Health Centers in Elizabeth: HOLY REDEEMER HOME CARE NJ NORTH (354 UNION AVENUE) Heliports located in Elizabeth: Amtrak stations near Elizabeth: 3 miles: NEWARK INTERNATIONAL AIRPORT (NEWARK, ) Services: ticket office, enclosed waiting area, public restrooms, public payphones.
6 miles: NEWARK (RAYMOND PLAZA WEST) Services: ticket office, fully wheelchair accessible, enclosed waiting area, public restrooms, public payphones, snack bar, ATM, paid short-term parking, paid long-term parking, call for car rental service, taxi stand, intercity bus service, public transit connection.
10 miles: METROPARK (ISELIN, 100 MIDDLESEX-ESSEX TPK.) Services: ticket office, fully wheelchair accessible, enclosed waiting area, public restrooms, public payphones, paid short-term parking, call for car rental service, taxi stand, public transit connection.
Colleges/Universities in Elizabeth: Drake College of Business-Elizabeth Full-time enrollment: 950; Location: 125 Broad St; Private, for-profit; Website: www.drakecollege.edu)
Yeshivas Be'er Yitzchok Full-time enrollment: 64; Location: 1391 North Ave; Private, not-for-profit; Website: www.elizabethkollel.org/)
Colleges/universities with over 2000 students nearest to Elizabeth:
Kean University (about 2 miles; Union, NJ ; Full-time enrollment: 12,648)
College of Staten Island CUNY (about 6 miles; Staten Island, NY ; FT enrollment: 11,684)
Essex County College (about 6 miles; Newark, NJ ; FT enrollment: 9,595)
University of Medicine and Dentistry of New Jersey (about 6 miles; Newark, NJ ; FT enrollment: 3,210)
Rutgers University-Newark (about 6 miles; Newark, NJ ; FT enrollment: 9,869)
New Jersey Institute of Technology (about 6 miles; Newark, NJ ; FT enrollment: 8,212)
Union County College (about 6 miles; Cranford, NJ ; FT enrollment: 9,148)
Public high schools in Elizabeth: ELIZABETH HIGH SCHOOL Students: 5,279, Location: 447 RICHMOND ST., Grades: 9-12)GEORGE W HERLICH JUV DET CTR Location: UNION CO COURTHOUSE GARAGE 2N, Grades: 7-12)
ADMIRAL WILLIAM F. HALSEY JR. LEADERSHIP ACADEMY Location: 641 SOUTH STREET, Grades: 9-12)
ALEXANDER HAMILTON PREPARATORY ACADEMY Location: 310 CHERRY ST, Grades: 9-12)
THOMAS A. EDISON CAREER AND TECHNICAL ACADEMY Location: 625 SUMMER ST, Grades: 9-12)
THOMAS JEFFERSON ARTS ACADEMY Location: 27 MARTIN LUTHER KING JR PLAZA, Grades: 9-12)
JOHN E. DWYER TECHNOLOGY ACADEMY Location: 123 PEARL ST, Grades: 9-12)
Private high schools in Elizabeth: BRURIAH HIGH SCHOOL FOR GIRLS Students: 357, Location: 35 NORTH AVE, Grades: 7-12, Girls only )
RAV TEITZ MESIVTA ACADEMY Students: 222, Location: 330 ELMORA AVE, Grades: 6-12, Boys only )
ST MARY OF THE ASSUMPTION HIGH SCHOOL Students: 200, Location: 237 S BROAD ST, Grades: 9-12)
ST PATRICK HIGH SCHOOL & ACADEMY Students: 181, Location: 227 COURT ST, Grades: 5-12)
BENEDICTINE ACADEMY Students: 168, Location: 840 N BROAD ST, Grades: 9-12, Girls only )
Biggest public elementary/middle schools in Elizabeth: WOODROW WILSON SCHOOL NO. 19 Students: 683, Location: 529 EDGAR RD, Grades: PK-8)WINFIELD SCOTT SCHOOL NO. 2 Students: 528, Location: 125 MADISON AVE, Grades: PK-8)MADISON MONROE SCHOOL NO. 16 Students: 466, Location: 1091 NORTH AVE, Grades: PK-8)BENJAMIN FRANKLIN SCHOOL NO. 13 Students: 413, Location: 248 RIPLEY PL, Grades: KG-8)ROBERT MORRIS SCHOOL NO. 18 Students: 412, Location: 860 CROSS AVE, Grades: KG-8)WILLIAM F. HALLORAN SCHOOL NO.22 Students: 373, Location: 1014 SOUTH ELMORA AVENUE, Grades: 2-8)VICTOR MRAVLAG SCHOOL NO. 21 Students: 234, Location: 132 SHELLEY AVENUE, Grades: PK-8)DR. ANTONIA PANTOJA SCHOOL NO. 27 Location: 505 -517 MORRIS AVENUE, Grades: PK-8)
IPREP ACADEMY SCHOOL NO 8 Location: 221-227 COURT STREET, Grades: KG-8)
JEROME DUNN ACADEMY NO 9 Location: 201 LIVINGSTON STREET, Grades: KG-8)
Private elementary/middle schools in Elizabeth: YESHIVA OF ELIZABETH Students: 254, Location: 330 ELMORA AVE, Grades: PK-6)
ST GENEVIEVE SCHOOL Students: 228, Location: 209 PRINCETON RD, Grades: PK-8)
OUR LADY OF GUADALUPE ACADEMY Students: 184, Location: 227 CENTER ST, Grades: PK-8)
See full list of schools located in Elizabeth Library in Elizabeth: ELIZABETH FREE PUBLIC LIBRARY Operating income: $3,997,890; Location: 11 SOUTH BROAD ST.; 355,593 books ; 5,587 audio materials ; 21,489 video materials ; 8 local licensed databases ; 22 state licensed databases ; 253 print serial subscriptions ; 3 electronic serial subscriptions )
User-submitted facts and corrections:
Amtrak train stations near Elizabeth also include: -- Midtown Elizabeth Broad Street NJT train stations near Elizabeth additionally include: -- North Elizabeth -- Union
Notable locations in Elizabeth: (A) , North Elizabeth Station (B) , Elizabeth Port Authority Terminal (C) , Bayway Circle (D) , Elizabeth Station (E) , Elizabeth-Port Authority Piers (F) , Elizabethport Station (G) , Julian Station (H) , Elmora Station (I) , South Station (J) , Boxwood Hall (K) , Elizabeth Engine Company Number 7 (L) , Elizabeth Engine Company Number 5 (M) , Elizabeth Engine Company Number 4 (N) , Alexian Plaza (O) , Elizabeth Engine Company Number 2 (P) , Bay Way Community House (Q) , James E Kirk Community Center (R) , Mickey Walker Community Center (S) , Elizabeth Police Headquarters (T) . Display/hide their locations on the map
Shopping Center: (1) . Display/hide its location on the map
Churches in Elizabeth include: (A) , Alliance International Fellowship Church (B) , Shiloh Baptist Church (C) , Congregation Adath Yeshuren (D) , Saint Mary of the Assumption Church (E) , Saint Vladimir's Catholic Church (F) , Serbian Orthodox Church of the Holy Ascension (G) , Congragation Bais Yitzchok (H) , Iglesia Cristiana Hosanna (I) . Display/hide their locations on the map
Cemeteries: (1) , Rosemont Memorial Park (2) , Saint Marys Cemetery (3) . Display/hide their locations on the map
River: (A) . Display/hide its location on the map
Parks in Elizabeth include: (1) , Fairmount Park (2) , Walker Park (3) , O'Brien Park (4) , Green Acres Park (5) , Wilson Park (6) , Williams Field (7) , Kellogg Park (8) , Drotar Field (9) . Display/hide their locations on the map
Tourist attractions: (1) , Historical Society (Cultural Attractions- Events- & Facilities; 1045 East Jersey Street) (2) , Libreria Cristiana El Salmista (Cultural Attractions- Events- & Facilities; 425 Elizabeth Av) (3) , Hillside Historical Society (111 Conant Av) (4) . Display/hide their approximate locations on the map
Hotels: (1) , Centro America Express (206 2nd Street) (2) , Hilton Newark Airport (1170 Spring St) (3) , Econo Lodge Newark International Airport (853 Spring Street (US 1 & 9)) (4) , Country Inn-Stes Newark Air (100 Glimcher Realty Way) (5) , Flora Motel (815 Flora Street) (6) , Econo Lodge Motel (853 Spring Street) (7) , Four Points By Sheraton Newark Airport (901 Spring Street) (8) , Hampton Inn Airport (1128-1138 Spring) (9) . Display/hide their approximate locations on the map
Court: (1) . Display/hide its approximate location on the map
Birthplace of: Rob Strauss - Professional wrestler, Jay Lethal - Professional wrestler, William Halsey, Jr. - Admiral, Bob Ward (American football) - Football player and coach, Nicholas Murray Butler - Nobel laureate, William H. Tunner - Air Force general, Stanton T. Friedman - Scientist, Rick Barry - (born 1944), basketball star, James Manning (minister) - University president, Jay Blakesberg - Photographer.
Union County has a predicted average indoor radon screening level between 2 and 4 pCi/L (pico curies per liter) - Moderate Potential Drinking water stations with addresses in Elizabeth that have no violations reported:
JOHN V MARA CYO CAMPS (Address: 715 Newark Ave. #4-18 Serves NY, Population served: 25, Primary Water Source Type: Groundwater)
Average household size: This city:
2.9 peopleNew Jersey:
2.7 people
Percentage of family households: This city:
70.5%Whole state:
69.3%
Percentage of households with unmarried partners: This city:
9.3%Whole state:
5.9%
Likely homosexual households (counted as self-reported same-sex unmarried-partner households)
Lesbian couples: 0.3% of all households Gay men: 0.3% of all households
People in group quarters in Elizabeth in 2010:
866 people in local jails and other municipal confinement facilities
398 people in nursing facilities/skilled-nursing facilities
308 people in other noninstitutional facilities
291 people in emergency and transitional shelters (with sleeping facilities) for people experiencing homelessness
267 people in hospitals with patients who have no usual home elsewhere
231 people in federal detention centers
95 people in group homes intended for adults
50 people in mental (psychiatric) hospitals and psychiatric units in other hospitals
15 people in residential treatment centers for juveniles (non-correctional)
14 people in workers' group living quarters and job corps centers
4 people in group homes for juveniles (non-correctional)
4 people in maritime/merchant vessels
People in group quarters in Elizabeth in 2000:
1,445 people in local jails and other confinement facilities (including police lockups)
497 people in nursing homes
272 people in other types of correctional institutions
246 people in other noninstitutional group quarters
147 people in other nonhousehold living situations
120 people in religious group quarters
60 people in short-term care, detention or diagnostic centers for delinquent children
60 people in homes or halfway houses for drug/alcohol abuse
32 people in hospitals/wards and hospices for chronically ill
28 people in hospices or homes for chronically ill
21 people in homes for the mentally ill
7 people in homes for abused, dependent, and neglected children
5 people in other group homes
4 people in other hospitals or wards for chronically ill
3 people in homes for the mentally retarded
Banks with most branches in Elizabeth (2011 data):
Bank of America, National Association: Elizabeth Branch, Latin American Banking Center Branch, Newark Avenue Branch, United Jersey Plaza Branch, Elomora-Pathmark Branch, Elizabeth - 1st St Branch. Info updated 2009/11/18: Bank assets: $1,451,969.3 mil, Deposits: $1,077,176.8 mil, headquarters in Charlotte, NC, positive income , 5782 total offices , Holding Company: Bank Of America Corporation
Wells Fargo Bank, National Association: Elizabeth Branch, North Elizabeth Branch, Elizabeth Elmora, Elizabeth Rahway Ave, Elizabeth Westminster Ave, Elmora Drive-In Branch. Info updated 2011/04/05: Bank assets: $1,161,490.0 mil, Deposits: $905,653.0 mil, headquarters in Sioux Falls, SD, positive income , 6395 total offices , Holding Company: Wells Fargo & Company
Sovereign Bank, National Association: Harmonia Branch, 314 Elizabeth Ave Branch, North Broad Street Branch, Elmora And Lidgerwood Branch, Morris Avenue Branch. Info updated 2012/01/31: Bank assets: $78,146.9 mil, Deposits: $48,042.9 mil, headquarters in Wilmington, DE, positive income , Commercial Lending Specialization, 718 total offices , Holding Company: Banco Santander, S.A.
Crown Bank: at 27 Prince Street, Westminster Branch, Elizabeth Branch. Info updated 2011/12/21: Bank assets: $566.3 mil, Deposits: $472.6 mil, local headquarters , positive income , Commercial Lending Specialization, 16 total offices , Holding Company: Jjr Holding Company, Inc.
PNC Bank, National Association: Elizabeth @ Stop & Shop Branch at 801 Newark Avenue, branch established on 2006/11/29; Coin Depot Corp. Branch at 1130 Chestnut Street, branch established on 1987/09/18. Info updated 2012/03/20: Bank assets: $263,309.6 mil, Deposits: $197,343.0 mil, headquarters in Wilmington, DE, positive income , Commercial Lending Specialization, 3085 total offices , Holding Company: Pnc Financial Services Group, Inc., The
Union County Savings Bank: Broad Street Branch at 61 Broad Street, branch established on 1958/04/07; at 320 North Broad Street, branch established on 1883/10/01. Info updated 2006/11/03: Bank assets: $1,477.4 mil, Deposits: $1,280.4 mil, local headquarters , positive income , 4 total offices
New York Community Bank: Elizabeth Branch at 142 Broad Street, branch established on 2005/04/22; Elizabeth Avenue Branch at 715 Elizabeth Avenue, branch established on 1931/08/31. Info updated 2010/03/29: Bank assets: $39,468.7 mil, Deposits: $20,709.8 mil, headquarters in Westbury, NY, positive income , Commercial Lending Specialization, 247 total offices , Holding Company: New York Community Bancorp, Inc.
Spencer Savings Bank, SLA: 618 Bayway Ave Branch at 618 Bayway Ave, branch established on 1910/01/01. Info updated 2011/07/21: Bank assets: $1,819.5 mil, Deposits: $1,338.8 mil, headquarters in Elmwood Park, NJ, positive income , Commercial Lending Specialization, 20 total offices
JPMorgan Chase Bank, National Association: Elizabeth Branch at 125 Broad Street, branch established on 2004/12/30. Info updated 2011/11/10: Bank assets: $1,811,678.0 mil, Deposits: $1,190,738.0 mil, headquarters in Columbus, OH, positive income , International Specialization, 5577 total offices , Holding Company: Jpmorgan Chase & Co.
3 other banks with 3 local branches
For population 15 years and over in Elizabeth:
Never married: 43.4%Now married: 42.2%Separated: 2.7%Widowed: 4.1%Divorced: 7.6% For population 25 years and over in Elizabeth:
High school or higher: 68.6%Bachelor's degree or higher: 12.7%Graduate or professional degree: 3.6%Unemployed: 4.7%Mean travel time to work (commute): 26.3 minutes
Education Gini index (Inequality in education) Here:
17.8New Jersey average:
12.8
Religion statistics for Elizabeth, NJ (based on Union County data)
Religion Adherents Congregations Catholic 247,240 44 Mainline Protestant 35,313 109 Evangelical Protestant 30,123 129 Other 28,707 52 Black Protestant 7,858 38 Orthodox 5,717 10 None 181,541 -
Source: Clifford Grammich, Kirk Hadaway, Richard Houseal, Dale E.Jones, Alexei Krindatch, Richie Stanley and Richard H.Taylor. 2012. 2010 U.S.Religion Census: Religious Congregations & Membership Study. Association of Statisticians of American Religious Bodies. Jones, Dale E., et al. 2002. Congregations and Membership in the United States 2000. Nashville, TN: Glenmary Research Center. Graphs represent county-level data
Food Environment Statistics: Number of grocery stores : 155This county :
2.97 / 10,000 pop.New Jersey :
2.90 / 10,000 pop.
Number of supercenters and club stores : 2Here :
0.04 / 10,000 pop.New Jersey :
0.06 / 10,000 pop.
Number of convenience stores (no gas) : 94This county :
1.80 / 10,000 pop.New Jersey :
1.76 / 10,000 pop.
Number of convenience stores (with gas) : 39Here :
0.75 / 10,000 pop.New Jersey :
0.81 / 10,000 pop.
Number of full-service restaurants : 385Here :
7.38 / 10,000 pop.State :
7.15 / 10,000 pop.
Adult diabetes rate : Union County :
8.3%State :
8.3%
Adult obesity rate : This county :
21.1%State :
23.3%
Low-income preschool obesity rate : This county :
21.4%New Jersey :
18.0%
Health and Nutrition: Healthy diet rate : Here:
47.0%New Jersey:
50.6%
Average overall health of teeth and gums : Elizabeth:
45.4%New Jersey:
48.5%
People feeling badly about themselves : Elizabeth:
21.2%State:
20.0%
People not drinking alcohol at all : Here:
12.1%New Jersey:
11.1%
Average hours sleeping at night : Elizabeth:
6.8New Jersey:
6.8
Overweight people : Here:
33.0%New Jersey:
33.6%
General health condition : Elizabeth:
53.8%State:
56.9%
Average condition of hearing : This city:
81.3%State:
80.0%
More about Health and Nutrition of Elizabeth, NJ Residents
Local government employment and payroll (March 2022)
Function
Full-time employees
Monthly full-time payroll
Average yearly full-time wage
Part-time employees
Monthly part-time payroll
Police Protection - Officers
344 $3,293,712 $114,897 0 $0 Firefighters
273 $2,612,487 $114,835 0 $0 Streets and Highways
121 $729,193 $72,317 5 $13,053 Other and Unallocable
98 $554,696 $67,922 43 $66,825 Police - Other
90 $454,507 $60,601 77 $53,838 Housing and Community Development (Local)
74 $420,869 $68,249 6 $9,159 Fire - Other
63 $392,132 $74,692 0 $0 Financial Administration
61 $452,682 $89,052 1 $2,121 Judicial and Legal
59 $343,602 $69,885 1 $846 Health
47 $291,032 $74,306 10 $15,245 Parks and Recreation
46 $239,648 $62,517 50 $71,927 Local Libraries
37 $164,858 $53,467 24 $29,793 Welfare
31 $174,391 $67,506 4 $5,031 Other Government Administration
27 $177,181 $78,747 0 $0 Solid Waste Management
3 $17,849 $71,396 0 $0
Totals for Government
1,374 $10,318,840 $90,121 221 $267,839
Elizabeth government finances - Expenditure in 2021 (per resident):
Construction - Sewerage: $5,000,000 ($37.23)
Housing and Community Development: $2,406,000 ($17.92)Parking Facilities: $2,341,000 ($17.43)Current Operations - General - Other: $67,523,000 ($502.84)
Police Protection: $46,892,000 ($349.20)Local Fire Protection: $31,399,000 ($233.83)Sewerage: $15,100,000 ($112.45)Solid Waste Management: $11,500,000 ($85.64)Parks and Recreation: $10,296,000 ($76.67)Health - Other: $7,459,000 ($55.55)Housing and Community Development: $7,114,000 ($52.98)General Public Buildings: $6,830,000 ($50.86)Central Staff Services: $6,089,000 ($45.34)Financial Administration: $5,930,000 ($44.16)Judicial and Legal Services: $4,349,000 ($32.39)Libraries: $4,300,000 ($32.02)Parking Facilities: $4,063,000 ($30.26)Protective Inspection and Regulation - Other: $2,357,000 ($17.55)Regular Highways: $1,751,000 ($13.04)General - Interest on Debt: $3,188,000 ($23.74)
Other Capital Outlay - Police Protection: $2,167,000 ($16.14)
General Public Building: $2,167,000 ($16.14)Parks and Recreation: $1,905,000 ($14.19)Housing and Community Development: $261,000 ($1.94)Total Salaries and Wages: $114,641,000 ($853.73)
Water Utilities - Interest on Debt: $2,029,000 ($15.11)
Elizabeth government finances - Revenue in 2021 (per resident):
Charges - Sewerage: $27,558,000 ($205.22)
Parking Facilities: $3,380,000 ($25.17)Solid Waste Management: $435,000 ($3.24)Parks and Recreation: $100,000 ($0.74)Miscellaneous - General Revenue - Other: $22,907,000 ($170.59)
Fines and Forfeits: $3,454,000 ($25.72)Interest Earnings: $2,544,000 ($18.95)Sale of Property: $542,000 ($4.04)Rents: $1,000 ($0.01)Revenue - Water Utilities: $29,487,000 ($219.59)
State Intergovernmental - General Local Government Support: $29,191,000 ($217.38)
Public Welfare: $7,566,000 ($56.34)Other: $7,545,000 ($56.19)Highways: $5,464,000 ($40.69)Health and Hospitals: $4,185,000 ($31.17)Housing and Community Development: $396,000 ($2.95)Tax - Property: $188,833,000 ($1406.23)
Public Utilities Sales: $6,768,000 ($50.40)Other Selective Sales: $2,014,000 ($15.00)Other License: $1,554,000 ($11.57)Alcoholic Beverage License: $331,000 ($2.46)
Elizabeth government finances - Debt in 2021 (per resident):
Long Term Debt - Beginning Outstanding - Unspecified Public Purpose: $145,699,000 ($1085.01)
Outstanding Unspecified Public Purpose: $136,517,000 ($1016.64)Retired Unspecified Public Purpose: $15,607,000 ($116.22)Issue, Unspecified Public Purpose: $6,425,000 ($47.85)Short Term Debt Outstanding - Beginning: $5,200,000 ($38.72)
End of Fiscal Year: $3,000,000 ($22.34)
Elizabeth government finances - Cash and Securities in 2021 (per resident):
Other Funds - Cash and Securities: $308,710,000 ($2298.95)
6.55% of this county's 2021 resident taxpayers lived in other counties in 2020 ($90,395 average adjusted gross income )
Here:
6.55%New Jersey average:
6.70%
0.02% of residents moved from foreign countries ($49 average AGI )Union County:
0.02%New Jersey average:
0.01%
Top counties from which taxpayers relocated into this county between 2020 and 2021:
7.45% of this county's 2020 resident taxpayers moved to other counties in 2021 ($103,155 average adjusted gross income )
Here:
7.45%New Jersey average:
7.02%
0.01% of residents moved to foreign countries ($81 average AGI )Union County:
0.01%New Jersey average:
0.02%
Top counties to which taxpayers relocated from this county between 2020 and 2021:
Businesses in Elizabeth, NJ
Name Count Name Count
7-Eleven 4 IHOP 2 ALDO 1 IKEA 1 AT&T 1 Johnny Rockets 1 Advance Auto Parts 1 Jones New York 1 Aeropostale 1 Journeys 1 Aerosoles 1 Juicy Couture 1 American Eagle Outfitters 1 Justice 1 Ann Taylor 1 KFC 2 AutoZone 1 Knights Inn 2 Banana Republic 1 Lane Bryant 1 Baskin-Robbins 1 Levi Strauss & Co. 1 Bath & Body Works 1 Marriott 3 Bed Bath & Beyond 1 Marshalls 1 Blockbuster 1 MasterBrand Cabinets 1 Brooks Brothers 2 McDonald's 3 Burger King 4 Motherhood Maternity 2 Burlington Coat Factory 2 New Balance 1 CVS 3 New York & Co 1 Charlotte Russe 1 Nike 7 Cinnabon 1 Old Navy 1 Circle K 1 Pac Sun 1 Clarks 1 Pathmark 1 Cold Stone Creamery 1 Payless 2 DHL 1 Pizza Hut 1 Deb 1 Popeyes 1 Domino's Pizza 2 RadioShack 2 DressBarn 1 Rite Aid 1 Dressbarn 1 Ruby Tuesday 1 Dunkin Donuts 9 Ryder Rental & Truck Leasing 1 Econo Lodge 1 SONIC Drive-In 1 Extended Stay America 1 Skechers USA 1 Famous Footwear 1 Sprint Nextel 3 FedEx 10 Starbucks 1 Finish Line 1 Stop & Shop 1 Foot Locker 1 Subway 4 Forever 21 1 Toys"R"Us 1 GNC 2 True Value 1 GameStop 3 U-Haul 5 Gap 1 UPS 9 Gymboree 1 Vans 4 H&M 1 Verizon Wireless 1 H&R Block 4 Victoria's Secret 1 Haagen-Dazs 1 Walgreens 1 Hilton 3 Wendy's 2 Holiday Inn 1 White Castle 1 Home Depot 1 YMCA 2 Hot Topic 1
Strongest AM radio stations in Elizabeth:
WJDM (1530 AM; 10 kW; ELIZABETH, NJ; Owner: RADIO UNICA OF NEW YORK LICENSE CORP)
WMCA (570 AM; 50 kW; NEW YORK, NY; Owner: SALEM MEDIA OF NEW YORK, LLC)
WOR (710 AM; 50 kW; NEW YORK, NY; Owner: BUCKLEY BROADCASTING CORPORATION)
WINS (1010 AM; 50 kW; NEW YORK, NY; Owner: INFINITY BROADCASTING OPERATIONS, INC.)
WEPN (1050 AM; 50 kW; NEW YORK, NY; Owner: NEW YORK AM RADIO, LLC)
WNSW (1430 AM; 5 kW; NEWARK, NJ; Owner: MULTICULTURAL RADIO BROADCASTING INC)
WBBR (1130 AM; 50 kW; NEW YORK, NY; Owner: BLOOMBERG COMMUNICATIONS INC.)
WABC (770 AM; 50 kW; NEW YORK, NY; Owner: WABC-AM RADIO, INC.)
WADO (1280 AM; 50 kW; NEW YORK, NY; Owner: WADO-AM LICENSE CORP.)
WLIB (1190 AM; 30 kW; NEW YORK, NY; Owner: ICBC BROADCAST HOLDINGS-NY, INC.)
WNYC (820 AM; 10 kW; NEW YORK, NY; Owner: WNYC RADIO)
WQEW (1560 AM; 50 kW; NEW YORK, NY; Owner: THE NEW YORK TIMES ELECTRONIC MEDIA COMPANY)
WWRL (1600 AM; 25 kW; NEW YORK, NY; Owner: ACCESS.1 COMMUNICATIONS CORP.-NY)
Strongest FM radio stations in Elizabeth:
WKNJ-FM (90.3 FM; UNION TOWNSHIP, NJ; Owner: KEAN UNIVERSITY)
WRKS (98.7 FM; NEW YORK, NY; Owner: EMMIS RADIO LICENSE CORP OF NEW YORK)
WNYC-FM (93.9 FM; NEW YORK, NY; Owner: WNYC RADIO)
WPAT-FM (93.1 FM; PATERSON, NJ; Owner: WPAT LICENSING, INC.)
WNEW (102.7 FM; NEW YORK, NY; Owner: INFINITY BROADCASTING OPERATIONS, INC.)
WSIA (88.9 FM; STATEN ISLAND, NY; Owner: THE COLLEGE OF STATEN ISLAND)
WQCD (101.9 FM; NEW YORK, NY; Owner: EMMIS RADIO LICENSE CORPORATION)
WBGO (88.3 FM; NEWARK, NJ; Owner: NEWARK PUBLIC RADIO INC.)
WCAA (105.9 FM; NEWARK, NJ; Owner: WADO-AM LICENSE CORP. ("WADO"))
WBAI (99.5 FM; NEW YORK, NY; Owner: PACIFICA FOUNDATION, INC.)
WBLS (107.5 FM; NEW YORK, NY; Owner: ICBC BROADCAST HOLDINGS-NY, INC.)
WLTW (106.7 FM; NEW YORK, NY; Owner: AMFM NEW YORK LICENSES, LLC)
WQXR-FM (96.3 FM; NEW YORK, NY; Owner: THE NEW YORK TIMES ELECTRONIC MEDIA COMPANY)
WSKQ-FM (97.9 FM; NEW YORK, NY; Owner: WSKQ LICENSING, INC.)
WXRK (92.3 FM; NEW YORK, NY; Owner: INFINITY BROADCASTING OPERATIONS, INC.)
WQHT (97.1 FM; NEW YORK, NY; Owner: EMMIS LICENSE CORPORATION OF NEW YORK)
WAXQ (104.3 FM; NEW YORK, NY; Owner: AMFM NEW YORK LICENSES, LLC)
WHTZ (100.3 FM; NEWARK, NJ; Owner: AMFM RADIO LICENSES, L.L.C.)
WWPR-FM (105.1 FM; NEW YORK, NY; Owner: AMFM RADIO LICENSES, L.L.C.)
WKTU (103.5 FM; LAKE SUCCESS, NY; Owner: AMFM RADIO LICENSES, LLC)
TV broadcast stations around Elizabeth:
WCBS-TV (Channel 2; NEW YORK, NY; Owner: CBS BROADCASTING INC.)
WABC-TV (Channel 7; NEW YORK, NY; Owner: AMERICAN BROADCASTING COMPANIES, INC)
WPIX (Channel 11; NEW YORK, NY; Owner: WPIX, INC.)
WWOR-TV (Channel 9; SECAUCUS, NJ; Owner: FOX TELEVISION STATIONS, INC.)
WNYW (Channel 5; NEW YORK, NY; Owner: FOX TELEVISION STATIONS, INC.)
WPXN-TV (Channel 31; NEW YORK, NY; Owner: PAXSON COMMUNICATIONS LICENSE COMPANY, LLC)
WNBC (Channel 4; NEW YORK, NY; Owner: NATIONAL BROADCASTING COMPANY, INC.)
WNET (Channel 13; NEWARK, NJ; Owner: EDUCATIONAL BROADCASTING CORPORATION)
WXTV (Channel 41; PATERSON, NJ; Owner: WXTV LICENSE PARTNERSHIP, G.P.)
WPXO-LP (Channel 34; EAST ORANGE, NJ; Owner: PAXSON COMMUNICATIONS LPTV, INC.)
WNJU (Channel 47; LINDEN, NJ; Owner: WNJU LICENSE CORPORATION)
WFUT (Channel 68; NEWARK, NJ; Owner: UNIVISION NEW YORK LLC)
WNYE-TV (Channel 25; NEW YORK, NY; Owner: NEW YORK CITY BOARD OF EDUCATION)
WXNY-LP (Channel 32; NEW YORK, NY; Owner: ISLAND BROADCASTING COMPANY)
WKOB-LP (Channel 53; NEW YORK, NY; Owner: WKOB COMMUNICATIONS, INC.)
WEBR-CA (Channel 17; MANHATTAN, NY; Owner: K LICENSEE INC.)
WRNN-LP (Channel 57; NYACK, NY; Owner: LP NYACK LIMITED PARTNERSHIP)
WLBX-LP (Channel 22; CRANFORD, NJ; Owner: RENARD COMMUNICATIONS CORP.)
W60AI (Channel 60; NEW YORK, NY; Owner: VENTANA TELEVISION, INC.)
WNXY-LP (Channel 26; NEW YORK, NY; Owner: ISLAND BROADCASTING COMPANY)
W33BS (Channel 33; DARIEN, CT; Owner: CT&T BROADCASTING, INC.)
WNYN-LP (Channel 39; NEW YORK, NY; Owner: ISLAND BROADCASTING COMPANY)
WNYX-LP (Channel 35; NEW YORK, NY; Owner: ISLAND BROADCASTING COMPANY)
W68DN (Channel 68; CHERRY HILL, ETC., NJ; Owner: MARCIA COHEN)
WNJB (Channel 58; NEW BRUNSWICK, NJ; Owner: NEW JERSEY PUBLIC BROADCASTING AUTHORITY)
National Bridge Inventory (NBI) Statistics 223 Number of bridges4,787ft / 1,459m Total length $51,256,000 Total costs10,329,553 Total average daily traffic1,737,277 Total average daily truck traffic
New bridges - historical statistics
1 1910-1919 2 1920-1929 4 1930-1939 38 1950-1959 45 1960-1969 52 1970-1979 33 1980-1989 16 1990-1999 8 2000-2009 24 2010-2019
See full National Bridge Inventory statistics for Elizabeth, NJ
Home Mortgage Disclosure Act Aggregated Statistics For Year 2009(Based on 24 full tracts) A) FHA, FSA/RHS & VA B) Conventional C) Refinancings D) Home Improvement Loans E) Loans on Dwellings For 5+ Families F) Non-occupant Loans on G) Loans On Manufactured Number Average Value Number Average Value Number Average Value Number Average Value Number Average Value Number Average Value Number Average Value
LOANS ORIGINATED 341 $257,856 139 $189,676 443 $240,077 23 $99,696 16 $748,562 79 $165,304 1 $165,000 APPLICATIONS APPROVED, NOT ACCEPTED 49 $264,898 28 $207,821 78 $227,449 8 $95,625 2 $2,925,000 11 $141,091 0 $0 APPLICATIONS DENIED 139 $264,647 104 $224,827 423 $256,402 85 $63,118 2 $97,500 76 $174,895 2 $50,000 APPLICATIONS WITHDRAWN 109 $255,239 38 $217,237 175 $256,629 8 $92,500 3 $483,333 19 $213,211 0 $0 FILES CLOSED FOR INCOMPLETENESS 76 $267,579 17 $259,000 89 $279,079 2 $42,500 0 $0 8 $204,125 0 $0
Aggregated Statistics For Year 2008(Based on 24 full tracts) A) FHA, FSA/RHS & VA B) Conventional C) Refinancings D) Home Improvement Loans E) Loans on Dwellings For 5+ Families F) Non-occupant Loans on G) Loans On Manufactured Number Average Value Number Average Value Number Average Value Number Average Value Number Average Value Number Average Value Number Average Value
LOANS ORIGINATED 168 $313,333 284 $267,408 551 $250,882 86 $55,116 47 $1,061,872 75 $234,427 1 $117,000 APPLICATIONS APPROVED, NOT ACCEPTED 22 $316,500 103 $276,379 220 $259,545 42 $62,762 3 $1,643,333 39 $229,923 0 $0 APPLICATIONS DENIED 121 $312,471 251 $293,777 752 $288,916 197 $77,563 10 $334,500 110 $259,173 3 $20,000 APPLICATIONS WITHDRAWN 75 $304,107 100 $271,600 199 $276,668 16 $105,438 4 $308,750 32 $229,312 1 $123,000 FILES CLOSED FOR INCOMPLETENESS 25 $318,840 52 $310,577 63 $298,492 6 $161,833 1 $1,385,000 23 $213,783 0 $0
Aggregated Statistics For Year 2007(Based on 24 full tracts) A) FHA, FSA/RHS & VA B) Conventional C) Refinancings D) Home Improvement Loans E) Loans on Dwellings For 5+ Families F) Non-occupant Loans on G) Loans On Manufactured Number Average Value Number Average Value Number Average Value Number Average Value Number Average Value Number Average Value Number Average Value
LOANS ORIGINATED 45 $363,756 917 $273,646 1,392 $273,241 233 $84,395 58 $911,431 228 $264,671 1 $29,000 APPLICATIONS APPROVED, NOT ACCEPTED 9 $346,778 254 $269,815 432 $275,414 60 $93,300 6 $833,333 52 $245,327 2 $86,000 APPLICATIONS DENIED 19 $350,632 823 $307,354 1,391 $292,403 324 $86,565 12 $400,333 213 $263,648 7 $74,286 APPLICATIONS WITHDRAWN 18 $371,833 215 $282,991 473 $296,926 27 $94,519 3 $295,333 54 $258,704 0 $0 FILES CLOSED FOR INCOMPLETENESS 4 $369,500 81 $314,111 165 $330,267 7 $231,714 0 $0 15 $275,200 0 $0
Aggregated Statistics For Year 2006(Based on 24 full tracts) A) FHA, FSA/RHS & VA B) Conventional C) Refinancings D) Home Improvement Loans E) Loans on Dwellings For 5+ Families F) Non-occupant Loans on G) Loans On Manufactured Number Average Value Number Average Value Number Average Value Number Average Value Number Average Value Number Average Value Number Average Value
LOANS ORIGINATED 22 $310,273 2,202 $234,751 2,001 $266,537 322 $97,270 90 $700,533 357 $251,801 1 $28,000 APPLICATIONS APPROVED, NOT ACCEPTED 9 $327,667 335 $249,788 532 $247,124 91 $79,516 4 $366,000 78 $260,679 1 $18,000 APPLICATIONS DENIED 7 $355,857 1,156 $245,541 1,464 $268,170 404 $98,045 18 $353,722 248 $248,766 10 $169,600 APPLICATIONS WITHDRAWN 11 $334,091 539 $251,232 743 $269,262 46 $168,478 12 $375,333 155 $242,935 3 $91,667 FILES CLOSED FOR INCOMPLETENESS 2 $263,000 127 $248,102 228 $284,697 4 $84,500 2 $730,000 24 $246,375 2 $285,500
Aggregated Statistics For Year 2005(Based on 24 full tracts) A) FHA, FSA/RHS & VA B) Conventional C) Refinancings D) Home Improvement Loans E) Loans on Dwellings For 5+ Families F) Non-occupant Loans on G) Loans On Manufactured Number Average Value Number Average Value Number Average Value Number Average Value Number Average Value Number Average Value Number Average Value
LOANS ORIGINATED 74 $314,392 2,183 $231,918 2,028 $236,445 311 $114,743 50 $1,818,140 440 $239,295 4 $108,000 APPLICATIONS APPROVED, NOT ACCEPTED 7 $257,286 379 $239,533 440 $221,068 86 $90,233 7 $434,714 69 $236,783 3 $91,333 APPLICATIONS DENIED 14 $369,000 955 $231,038 1,311 $242,088 400 $86,985 9 $277,667 239 $247,414 14 $101,643 APPLICATIONS WITHDRAWN 29 $344,276 798 $236,246 983 $249,368 102 $161,510 3 $440,000 175 $236,429 0 $0 FILES CLOSED FOR INCOMPLETENESS 7 $322,000 118 $242,746 164 $259,634 13 $149,692 2 $500,000 26 $233,154 3 $194,000
Aggregated Statistics For Year 2004(Based on 24 full tracts) A) FHA, FSA/RHS & VA B) Conventional C) Refinancings D) Home Improvement Loans E) Loans on Dwellings For 5+ Families F) Non-occupant Loans on G) Loans On Manufactured Number Average Value Number Average Value Number Average Value Number Average Value Number Average Value Number Average Value Number Average Value
LOANS ORIGINATED 176 $291,966 1,435 $240,922 1,834 $204,616 297 $93,121 55 $735,927 319 $214,420 14 $63,643 APPLICATIONS APPROVED, NOT ACCEPTED 37 $258,568 285 $250,168 415 $192,559 63 $78,111 10 $350,100 61 $217,180 5 $58,000 APPLICATIONS DENIED 36 $293,667 438 $242,059 1,078 $205,427 314 $72,137 14 $403,786 160 $214,125 19 $46,000 APPLICATIONS WITHDRAWN 63 $281,778 329 $252,055 602 $204,141 55 $126,655 8 $214,000 72 $232,139 0 $0 FILES CLOSED FOR INCOMPLETENESS 4 $340,500 58 $262,776 119 $223,933 3 $118,333 2 $158,000 19 $234,842 0 $0
Aggregated Statistics For Year 2003(Based on 24 full tracts) A) FHA, FSA/RHS & VA B) Conventional C) Refinancings D) Home Improvement Loans E) Loans on Dwellings For 5+ Families F) Non-occupant Loans on Number Average Value Number Average Value Number Average Value Number Average Value Number Average Value Number Average Value
LOANS ORIGINATED 348 $253,741 847 $215,888 2,597 $168,646 167 $55,629 66 $902,652 319 $177,774 APPLICATIONS APPROVED, NOT ACCEPTED 25 $221,600 157 $224,554 578 $165,374 64 $58,016 8 $1,244,625 60 $189,100 APPLICATIONS DENIED 61 $231,344 261 $206,870 1,273 $173,218 296 $44,892 8 $215,750 159 $166,289 APPLICATIONS WITHDRAWN 64 $246,312 141 $239,780 687 $177,923 33 $52,848 6 $304,333 55 $167,255 FILES CLOSED FOR INCOMPLETENESS 16 $254,875 35 $241,657 177 $181,395 4 $32,250 0 $0 11 $194,545
Aggregated Statistics For Year 2002(Based on 22 full tracts) A) FHA, FSA/RHS & VA B) Conventional C) Refinancings D) Home Improvement Loans E) Loans on Dwellings For 5+ Families F) Non-occupant Loans on Number Average Value Number Average Value Number Average Value Number Average Value Number Average Value Number Average Value
LOANS ORIGINATED 321 $205,231 572 $184,217 1,439 $145,657 250 $33,812 39 $821,974 166 $132,946 APPLICATIONS APPROVED, NOT ACCEPTED 44 $186,068 97 $171,000 394 $127,520 113 $27,009 3 $160,000 38 $124,395 APPLICATIONS DENIED 33 $196,424 156 $163,731 794 $132,911 329 $31,456 13 $578,769 84 $112,964 APPLICATIONS WITHDRAWN 44 $208,727 124 $184,403 471 $149,707 55 $35,691 6 $746,333 46 $167,609 FILES CLOSED FOR INCOMPLETENESS 15 $179,467 31 $156,774 124 $150,734 6 $29,167 0 $0 8 $145,000
Aggregated Statistics For Year 2001(Based on 22 full tracts) A) FHA, FSA/RHS & VA B) Conventional C) Refinancings D) Home Improvement Loans E) Loans on Dwellings For 5+ Families F) Non-occupant Loans on Number Average Value Number Average Value Number Average Value Number Average Value Number Average Value Number Average Value
LOANS ORIGINATED 328 $176,165 477 $152,210 880 $131,828 148 $33,392 35 $677,343 121 $126,107 APPLICATIONS APPROVED, NOT ACCEPTED 38 $176,895 84 $149,583 261 $110,307 81 $28,321 4 $155,750 24 $87,375 APPLICATIONS DENIED 58 $161,466 141 $145,411 730 $98,895 305 $25,367 5 $214,000 57 $120,018 APPLICATIONS WITHDRAWN 58 $190,086 79 $155,658 354 $109,915 73 $37,411 4 $152,750 28 $118,571 FILES CLOSED FOR INCOMPLETENESS 17 $178,294 20 $147,800 132 $117,492 5 $31,000 1 $455,000 10 $121,000
Aggregated Statistics For Year 2000(Based on 22 full tracts) A) FHA, FSA/RHS & VA B) Conventional C) Refinancings D) Home Improvement Loans E) Loans on Dwellings For 5+ Families F) Non-occupant Loans on Number Average Value Number Average Value Number Average Value Number Average Value Number Average Value Number Average Value
LOANS ORIGINATED 347 $149,363 480 $135,529 298 $94,856 151 $24,205 26 $672,038 85 $95,988 APPLICATIONS APPROVED, NOT ACCEPTED 43 $152,535 74 $134,203 155 $105,974 91 $26,198 1 $140,000 24 $73,875 APPLICATIONS DENIED 58 $149,328 200 $126,365 547 $74,569 280 $25,868 6 $183,000 67 $102,761 APPLICATIONS WITHDRAWN 62 $153,194 70 $124,800 329 $75,371 29 $20,345 6 $150,667 37 $99,216 FILES CLOSED FOR INCOMPLETENESS 12 $165,000 34 $131,971 119 $116,479 3 $30,000 0 $0 5 $116,400
Aggregated Statistics For Year 1999(Based on 19 full and 4 partial tracts) A) FHA, FSA/RHS & VA B) Conventional C) Refinancings D) Home Improvement Loans E) Loans on Dwellings For 5+ Families F) Non-occupant Loans on Number Average Value Number Average Value Number Average Value Number Average Value Number Average Value Number Average Value
LOANS ORIGINATED 340 $137,225 458 $124,880 683 $102,523 193 $20,503 44 $685,398 125 $96,823 APPLICATIONS APPROVED, NOT ACCEPTED 13 $120,488 71 $108,733 230 $95,008 78 $27,710 2 $1,205,645 32 $92,272 APPLICATIONS DENIED 64 $132,580 124 $116,441 617 $87,822 249 $24,174 5 $521,432 71 $98,167 APPLICATIONS WITHDRAWN 47 $141,634 77 $116,715 421 $83,052 41 $31,165 8 $793,955 31 $118,994 FILES CLOSED FOR INCOMPLETENESS 10 $148,033 23 $125,919 146 $102,928 3 $91,940 0 $0 13 $89,087
Detailed mortgage data for all 24 tracts in Elizabeth, NJ
Private Mortgage Insurance Companies Aggregated Statistics For Year 2009(Based on 19 full tracts) A) Conventional B) Refinancings C) Non-occupant Loans on Number Average Value Number Average Value Number Average Value
LOANS ORIGINATED 13 $225,462 8 $274,750 0 $0 APPLICATIONS APPROVED, NOT ACCEPTED 23 $306,826 4 $296,250 1 $158,000 APPLICATIONS DENIED 10 $277,400 4 $252,500 0 $0 APPLICATIONS WITHDRAWN 2 $349,000 0 $0 0 $0 FILES CLOSED FOR INCOMPLETENESS 3 $290,667 1 $217,000 1 $203,000
Aggregated Statistics For Year 2008(Based on 22 full tracts) A) Conventional B) Refinancings C) Non-occupant Loans on Number Average Value Number Average Value Number Average Value
LOANS ORIGINATED 143 $299,692 34 $340,176 12 $257,167 APPLICATIONS APPROVED, NOT ACCEPTED 94 $357,734 38 $344,526 4 $307,500 APPLICATIONS DENIED 48 $312,417 5 $312,600 15 $318,533 APPLICATIONS WITHDRAWN 20 $314,000 2 $355,500 4 $293,500 FILES CLOSED FOR INCOMPLETENESS 7 $312,429 1 $338,000 3 $367,333
Aggregated Statistics For Year 2007(Based on 23 full tracts) A) Conventional B) Refinancings C) Non-occupant Loans on Number Average Value Number Average Value Number Average Value
LOANS ORIGINATED 195 $326,395 124 $385,145 16 $281,375 APPLICATIONS APPROVED, NOT ACCEPTED 43 $365,581 44 $390,409 6 $362,500 APPLICATIONS DENIED 21 $407,952 5 $413,400 4 $416,500 APPLICATIONS WITHDRAWN 22 $393,955 17 $407,647 2 $419,000 FILES CLOSED FOR INCOMPLETENESS 2 $383,000 2 $437,500 1 $252,000
Aggregated Statistics For Year 2006(Based on 24 full tracts) A) Conventional B) Refinancings C) Non-occupant Loans on Number Average Value Number Average Value Number Average Value
LOANS ORIGINATED 93 $309,602 65 $393,538 14 $269,929 APPLICATIONS APPROVED, NOT ACCEPTED 25 $346,280 29 $371,379 2 $183,000 APPLICATIONS DENIED 5 $340,400 12 $428,833 5 $337,000 APPLICATIONS WITHDRAWN 4 $274,000 17 $381,176 3 $276,333 FILES CLOSED FOR INCOMPLETENESS 0 $0 2 $406,000 0 $0
Aggregated Statistics For Year 2005(Based on 21 full tracts) A) Conventional B) Refinancings C) Non-occupant Loans on Number Average Value Number Average Value Number Average Value
LOANS ORIGINATED 182 $297,819 57 $298,316 21 $244,095 APPLICATIONS APPROVED, NOT ACCEPTED 79 $313,924 29 $318,724 12 $288,500 APPLICATIONS DENIED 15 $359,000 2 $217,000 3 $218,667 APPLICATIONS WITHDRAWN 22 $297,182 9 $310,222 6 $189,333 FILES CLOSED FOR INCOMPLETENESS 5 $325,200 0 $0 0 $0
Aggregated Statistics For Year 2004(Based on 23 full tracts) A) Conventional B) Refinancings C) Non-occupant Loans on Number Average Value Number Average Value Number Average Value
LOANS ORIGINATED 329 $278,453 58 $277,017 41 $266,415 APPLICATIONS APPROVED, NOT ACCEPTED 140 $290,407 24 $229,875 21 $242,095 APPLICATIONS DENIED 38 $318,500 5 $263,800 14 $269,929 APPLICATIONS WITHDRAWN 26 $296,615 7 $322,571 3 $284,333 FILES CLOSED FOR INCOMPLETENESS 9 $290,333 1 $180,000 1 $221,000
Aggregated Statistics For Year 2003(Based on 22 full tracts) A) Conventional B) Refinancings C) Non-occupant Loans on Number Average Value Number Average Value Number Average Value
LOANS ORIGINATED 406 $251,219 102 $209,951 35 $212,943 APPLICATIONS APPROVED, NOT ACCEPTED 143 $237,664 58 $218,897 17 $201,353 APPLICATIONS DENIED 10 $199,300 3 $211,333 4 $167,000 APPLICATIONS WITHDRAWN 48 $260,417 5 $216,600 7 $227,143 FILES CLOSED FOR INCOMPLETENESS 0 $0 1 $210,000 0 $0
Aggregated Statistics For Year 2002(Based on 21 full tracts) A) Conventional B) Refinancings C) Non-occupant Loans on Number Average Value Number Average Value Number Average Value
LOANS ORIGINATED 291 $196,117 57 $182,351 35 $158,943 APPLICATIONS APPROVED, NOT ACCEPTED 88 $189,864 22 $195,909 7 $177,286 APPLICATIONS DENIED 14 $210,000 4 $247,000 2 $234,500 APPLICATIONS WITHDRAWN 24 $198,750 5 $187,600 4 $261,000 FILES CLOSED FOR INCOMPLETENESS 1 $281,000 2 $259,500 0 $0
Aggregated Statistics For Year 2001(Based on 21 full tracts) A) Conventional B) Refinancings C) Non-occupant Loans on Number Average Value Number Average Value Number Average Value
LOANS ORIGINATED 238 $173,214 47 $153,255 19 $153,632 APPLICATIONS APPROVED, NOT ACCEPTED 60 $164,983 15 $157,800 7 $123,714 APPLICATIONS DENIED 17 $194,765 6 $203,500 2 $207,500 APPLICATIONS WITHDRAWN 7 $173,286 0 $0 0 $0 FILES CLOSED FOR INCOMPLETENESS 1 $121,000 1 $103,000 0 $0
Aggregated Statistics For Year 2000(Based on 22 full tracts) A) Conventional B) Refinancings C) Non-occupant Loans on Number Average Value Number Average Value Number Average Value
LOANS ORIGINATED 194 $145,866 37 $136,027 27 $107,704 APPLICATIONS APPROVED, NOT ACCEPTED 33 $130,000 4 $138,500 4 $107,000 APPLICATIONS DENIED 8 $144,375 2 $110,000 1 $63,000 APPLICATIONS WITHDRAWN 6 $149,000 2 $142,000 0 $0 FILES CLOSED FOR INCOMPLETENESS 1 $123,000 0 $0 0 $0
Aggregated Statistics For Year 1999(Based on 18 full and 4 partial tracts) A) Conventional B) Refinancings C) Non-occupant Loans on Number Average Value Number Average Value Number Average Value
LOANS ORIGINATED 160 $133,743 46 $124,936 22 $115,032 APPLICATIONS APPROVED, NOT ACCEPTED 29 $136,419 16 $143,388 4 $117,440 APPLICATIONS DENIED 11 $139,101 4 $147,292 3 $113,000 APPLICATIONS WITHDRAWN 7 $136,417 0 $0 3 $118,467 FILES CLOSED FOR INCOMPLETENESS 4 $139,228 1 $137,090 1 $113,000
Fire-safe hotels and motels in Elizabeth, New Jersey:
Crowne Plaza Newark Airport, 901 Spring St, Elizabeth, New Jersey 07201 Phone: (908) 527-1600, Fax: (908) 527-1327
Renaissance Newark Airport Hotel, 1000 Spring St, Elizabeth, New Jersey 07201 Phone: (908) 436-4600, Fax: (908) 527-0238
Extended Stay America - Elizabeth - Newark Airport, 45 Glimcher Realty Way, Elizabeth, New Jersey 07201 Phone: (908) 355-4300, Fax: (908) 355-5181
Country Inn & Suites Newark Airport, 100 Glimcher Realty Way, Elizabeth, New Jersey 07201 Phone: (800) 456-4000, Fax: (908) 965-0954
Days Inn, 853 Spring St, Elizabeth, New Jersey 07201 Phone: (908) 353-1365, Fax: (908) 353-2927
Embassy Suites Elizabeth - Newark Airport, 95 Glimcher Realty Way, Elizabeth, New Jersey 07201 Phone: (908) 558-0752, Fax: (908) 558-0631
All 6 fire-safe hotels and motels in Elizabeth, New Jersey
Most common first names in Elizabeth, NJ among deceased individuals Name Count Lived (average)
John 1,052 73.7 years Mary 1,025 79.4 years Joseph 887 74.4 years Anna 625 81.2 years William 614 72.7 years Helen 474 77.6 years Frank 449 73.8 years James 448 69.7 years Charles 370 73.1 years Edward 361 71.7 years
Most common last names in Elizabeth, NJ among deceased individuals Last name Count Lived (average)
Smith 148 73.5 years Brown 144 70.0 years Williams 117 66.4 years Rodriguez 113 72.8 years Jones 109 71.3 years Miller 108 73.8 years Davis 101 71.2 years Johnson 93 67.8 years Gonzalez 89 71.6 years Perez 78 70.3 years
Elizabeth compared to New Jersey state average:
Median household income below state average. Unemployed percentage significantly below state average. Hispanic race population percentage significantly above state average. Median age significantly below state average. Foreign-born population percentage significantly above state average. Renting percentage above state average. Number of rooms per house below state average. Percentage of population with a bachelor's degree or higher significantly below state average. Elizabeth, NJ compared to other similar cities:
#1 on the list of "Top 101 cities with largest percentage of males in industries: transportation and warehousing (population 50,000+)"
#2 on the list of "Top 101 cities with largest percentage of males in occupations: transportation occupations (population 50,000+)"
#11 on the list of "Top 101 cities with largest percentage of females in occupations: building and grounds cleaning and maintenance occupations (population 50,000+)"
#11 on the list of "Top 100 cities with highest percentage of renters (pop. 50,000+)"
#13 on the list of "Top 101 cities with largest percentage of females in occupations: transportation occupations (population 50,000+)"
#15 on the list of "Top 101 cities with the largest city-data.com crime index decrease from 2011 to 2012 (population 50,000+)"
#17 on the list of "Top 101 cities with largest percentage of females in industries: transportation and warehousing (population 50,000+)"
#18 on the list of "Top 101 cities with largest percentage of males in occupations: material moving occupations (population 50,000+)"
#19 on the list of "Top 101 cities with the lowest percentage of workers working at home, population 50,000+"
#23 on the list of "Top 101 cities with largest percentage of females in industries: administrative and support and waste management services (population 50,000+)"
#25 on the list of "Top 100 cities with smallest houses (pop. 50,000+)"
#25 on the list of "Top 100 cities with highest percentage of foreign-born residents (pop. 50,000+)"
#27 on the list of "Top 101 cities with largest percentage of females in occupations: material moving occupations (population 50,000+)"
#27 on the list of "Top 101 cities with fewest building permits per 10,000 residents (population 50,000+)"
#27 on the list of "Top 101 cities with the lowest percentage of English-only speaking households, population 50,000+"
#27 on the list of "Top 101 cities with the highest number of auto thefts per 100,000 residents, excludes tourist destinations and others with a lot of outsiders visiting based on city industries data (population 50,000+)"
#28 on the list of "Top 101 cities with the most residents born in Portugal (population 500+)"
#31 on the list of "Top 101 cities with the most residents born in Dominican Republic (population 500+)"
#32 on the list of "Top 101 cities with the smallest percentage of one, detached housing units in structures (20,000+ housing units)"
#33 on the list of "Top 101 cities with the most residents born in Colombia (population 500+)"
#23 (07206) on the list of "Top 101 zip codes with the largest percentage of Portuguese first ancestries"
#15 on the list of "Top 101 counties with the lowest percentage of residents that keep firearms around their homes"
#17 on the list of "Top 101 counties with the largest decrease in the number of deaths per 1000 residents 2000-2006 to 2007-2013 (pop. 50,000+)"
#47 on the list of "Top 101 counties with the most Orthodox adherents"
#53 on the list of "Top 101 counties with the most Catholic adherents"
#58 on the list of "Top 101 counties with the lowest percentage of residents that drank alcohol in the past 30 days"
Top Patent Applicants
Noah Weisleder (13)
Yehuda Koren (8)
Richard W. Flynn (5)
Nader Bolourchi (3)
Hylsa Garcia (3)
Maria Figueroa (3)
Pawan Dhondi (2)
Pawan K. Dhondi (2)
Hayward Industries, Inc. (2)
Vitor Oliveira (2)
Total of 83 patent applications in 2008-2024.


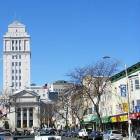
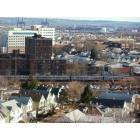
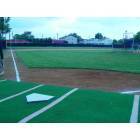
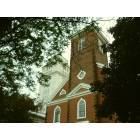

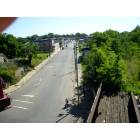
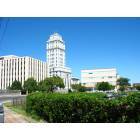
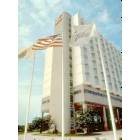


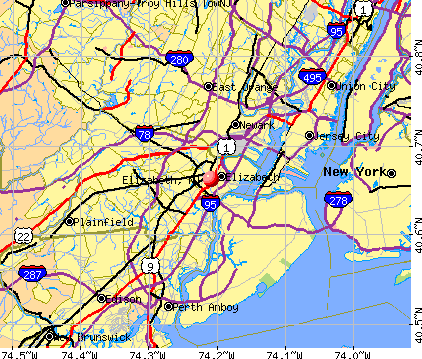


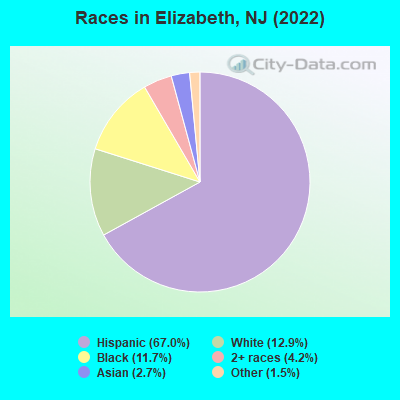
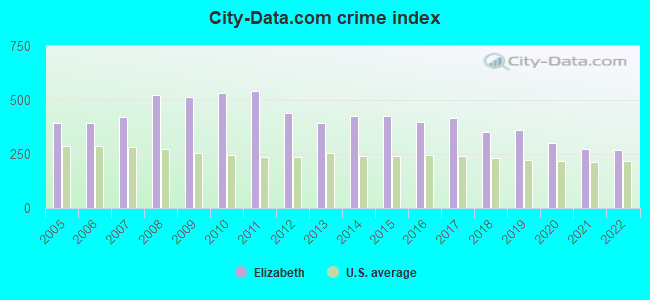
 Recent articles from our blog. Our writers, many of them Ph.D. graduates or candidates, create easy-to-read articles on a wide variety of topics.


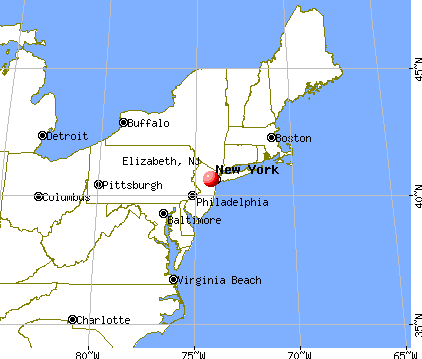
 (5.2 miles
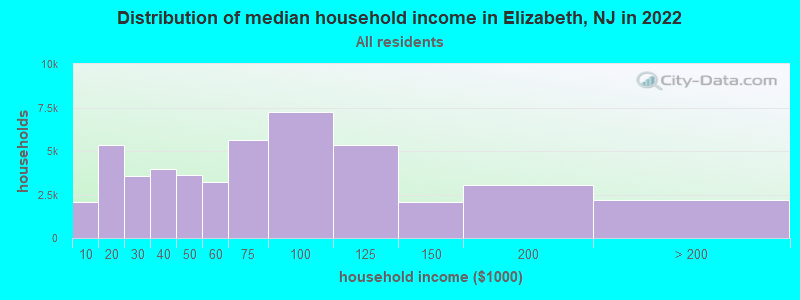
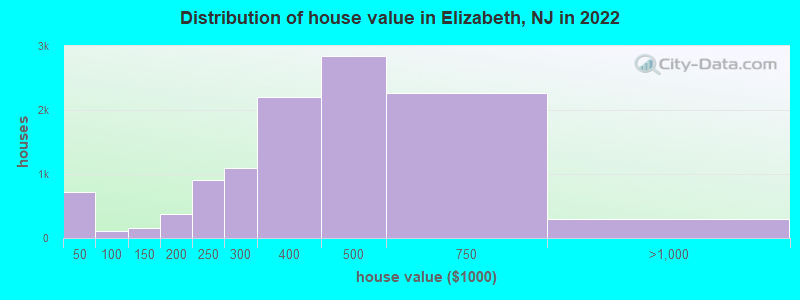
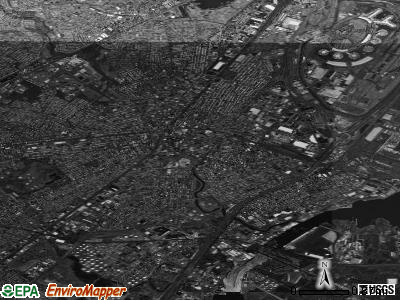
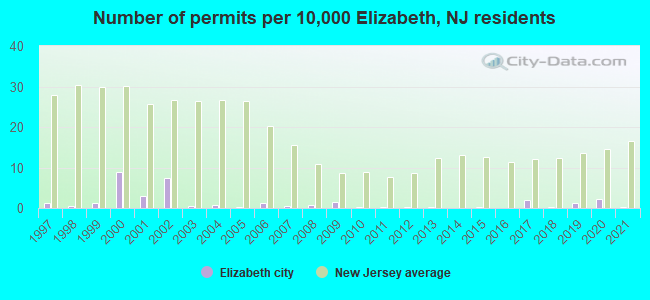
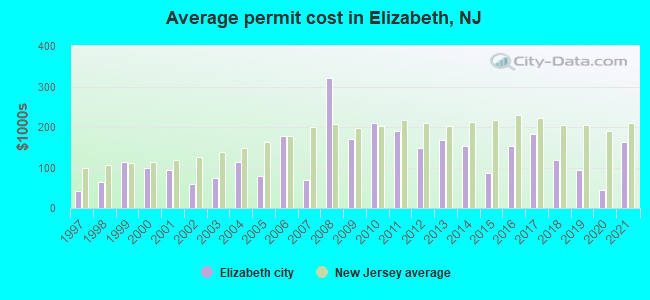
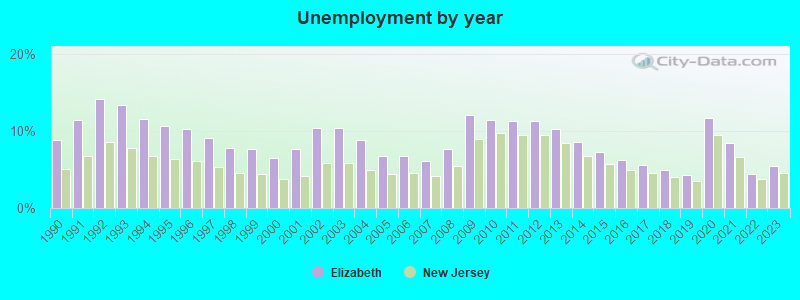
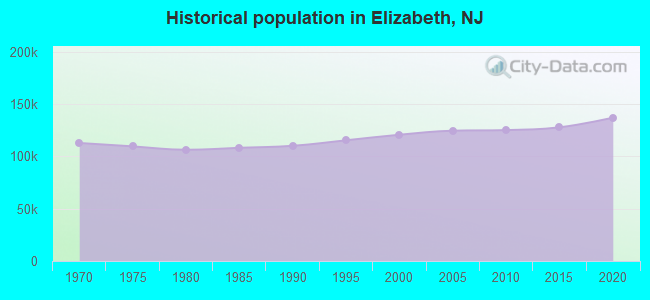
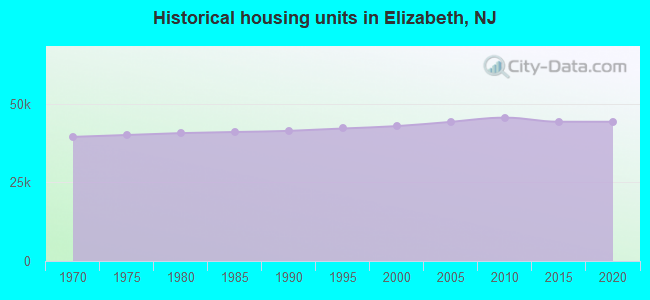
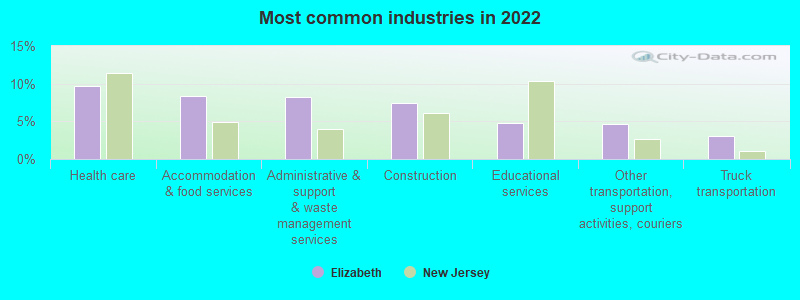
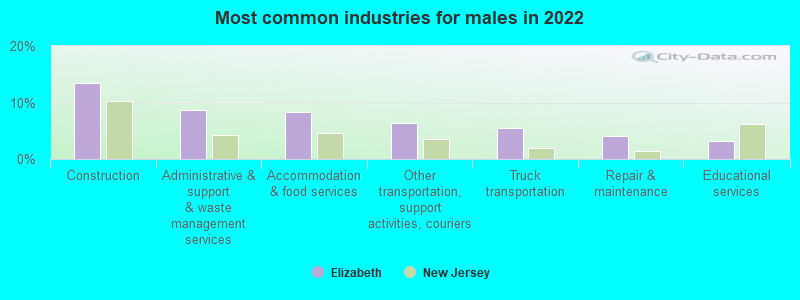
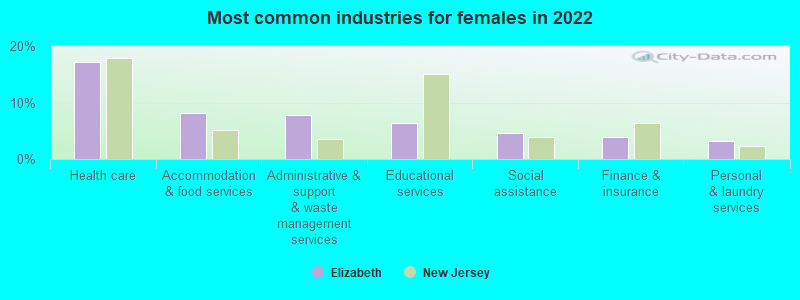
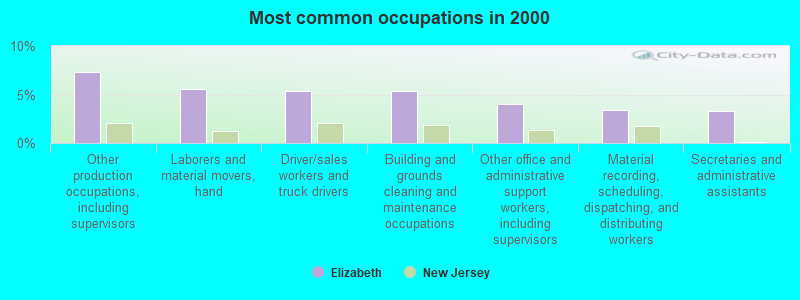
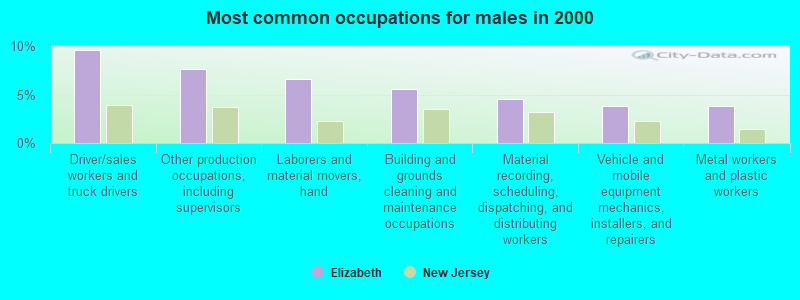
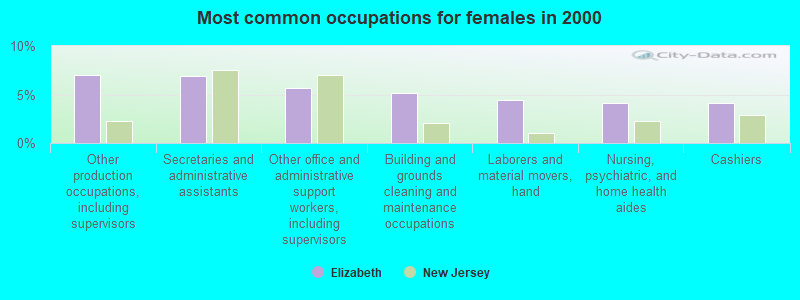
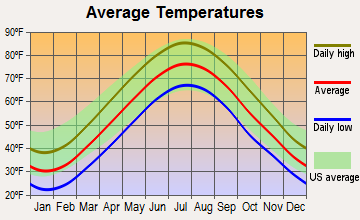
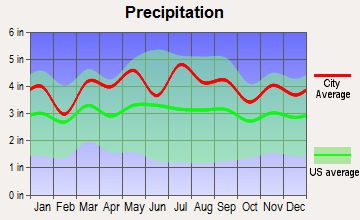
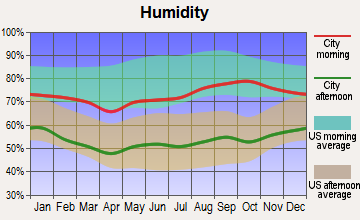
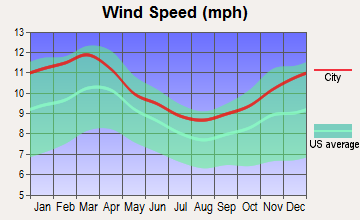
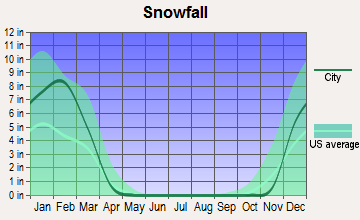

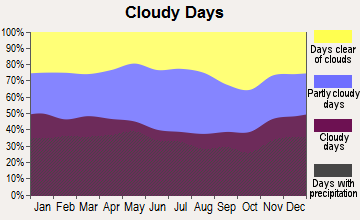


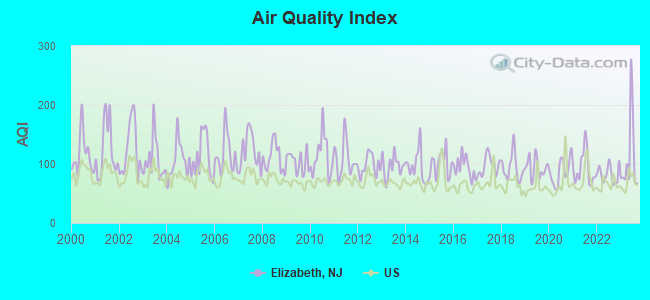
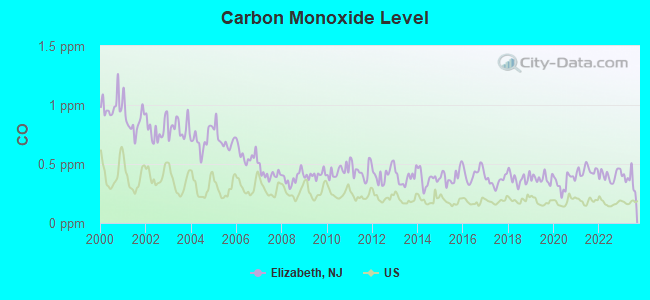
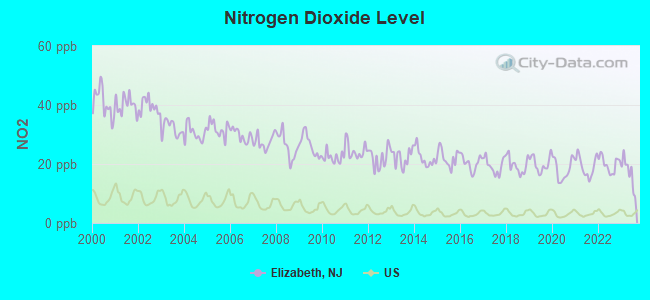
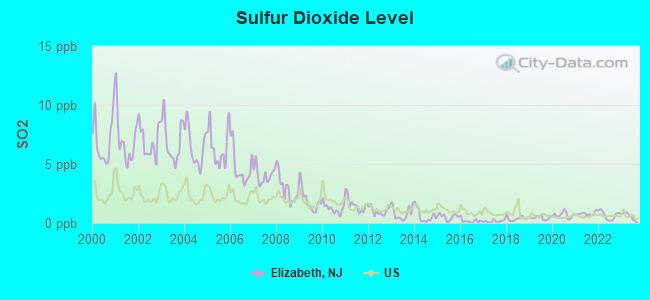
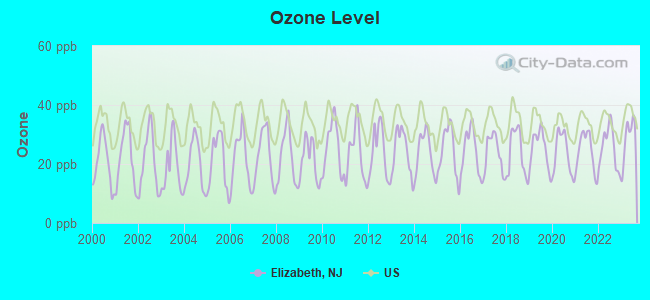
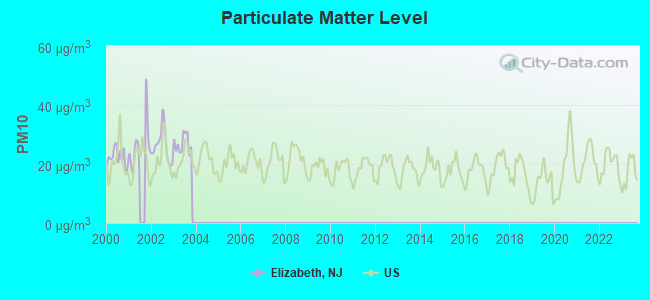
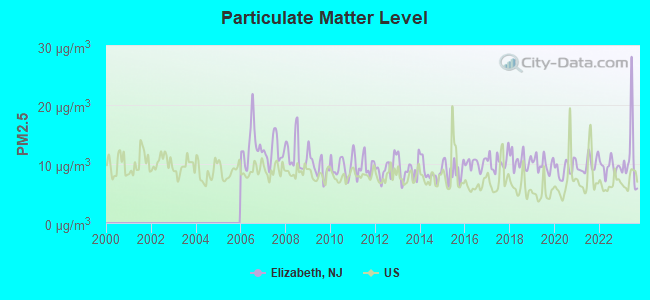
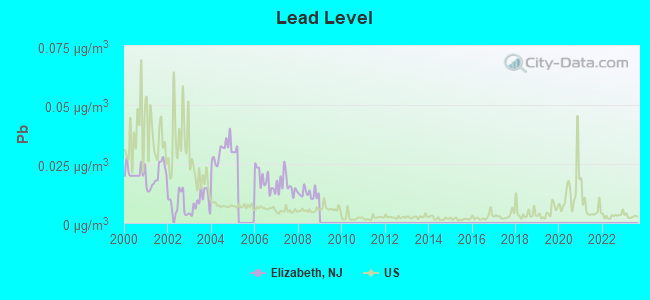
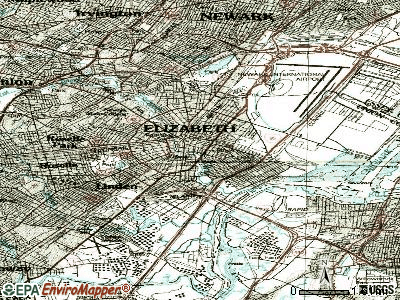
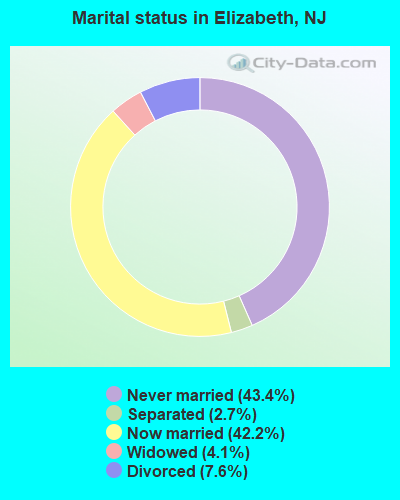
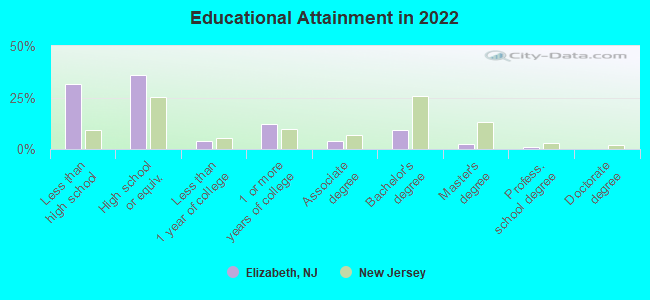
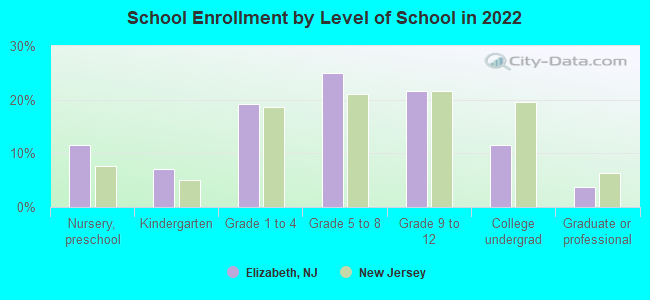
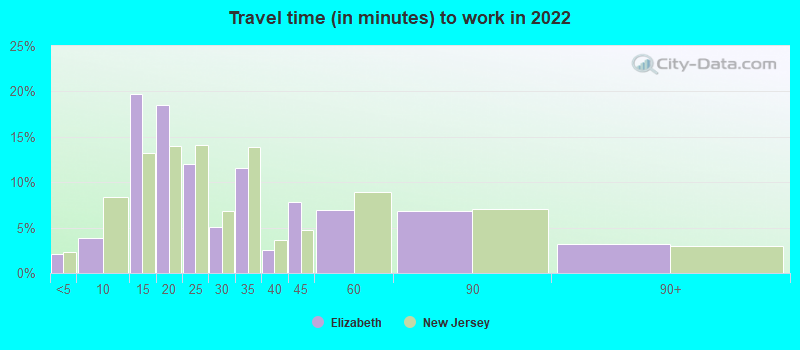
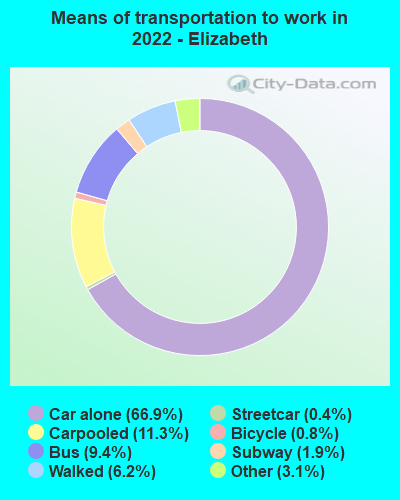
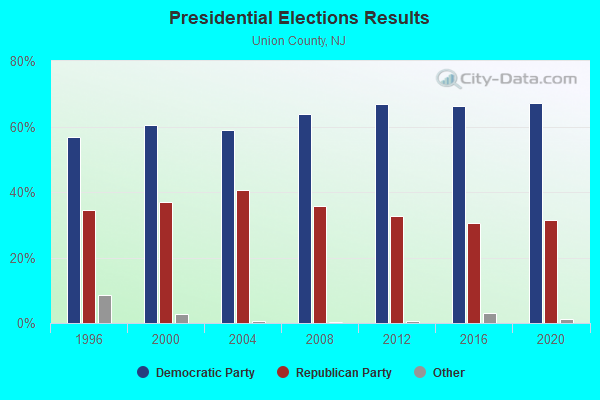
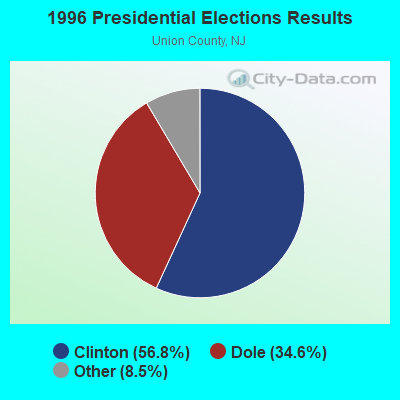
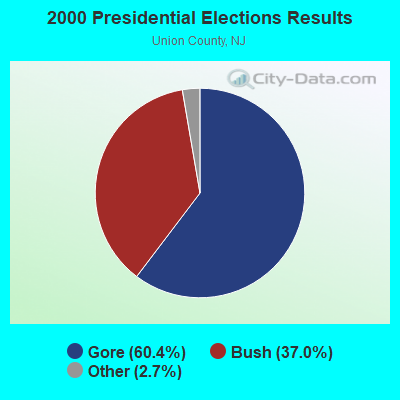
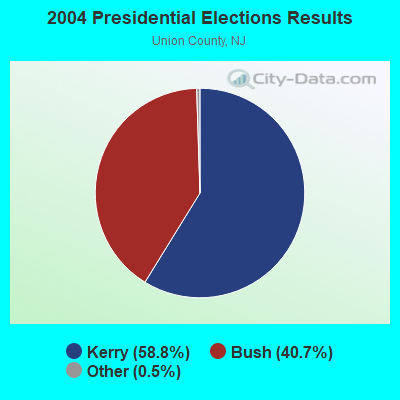
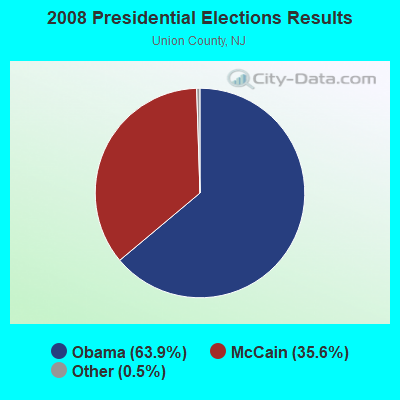
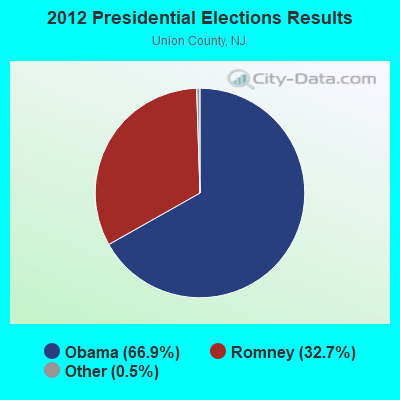
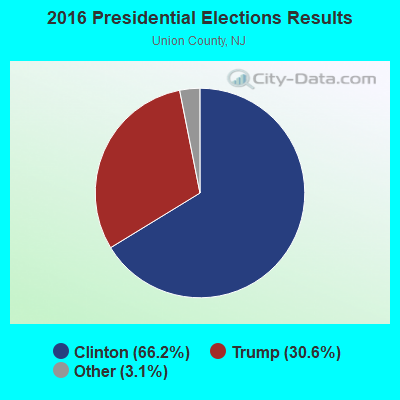

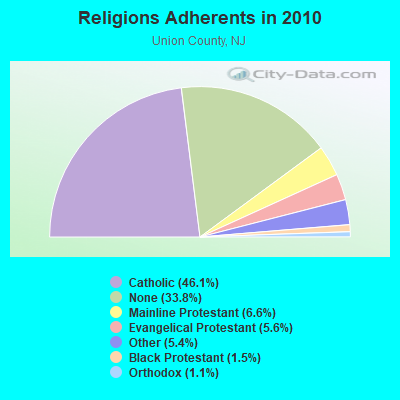
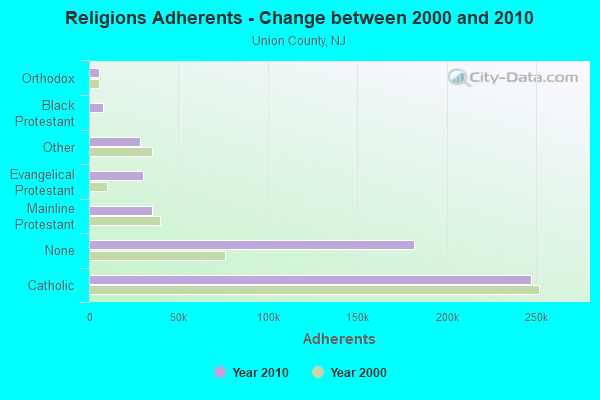
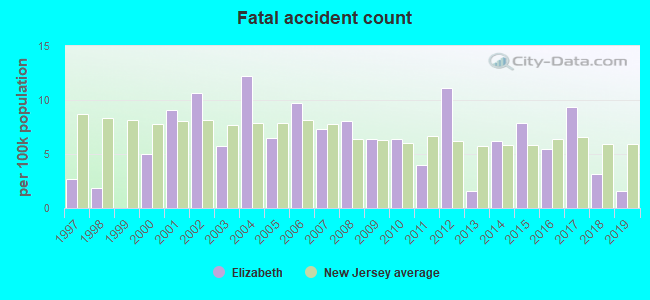
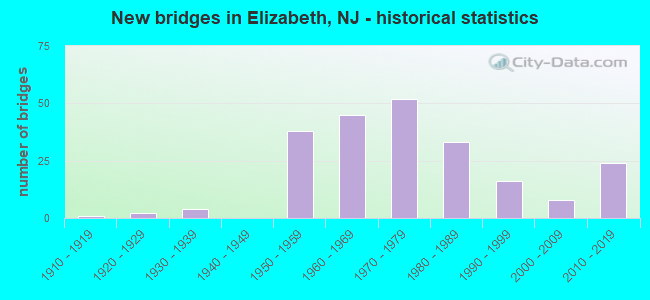
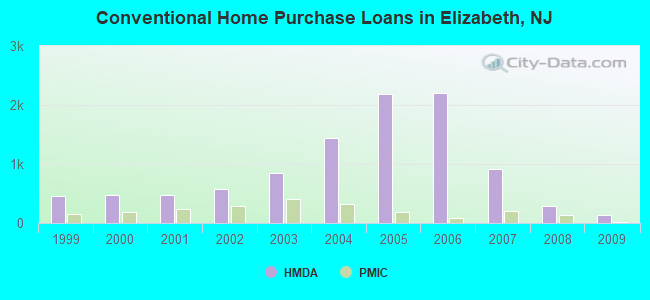
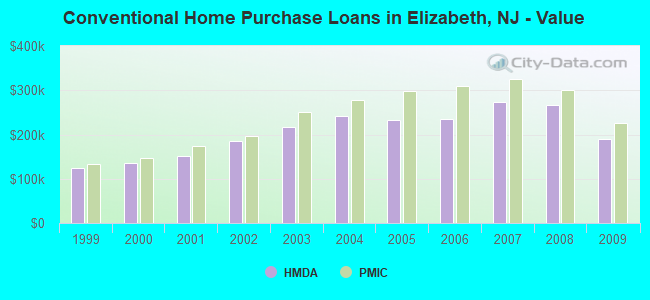
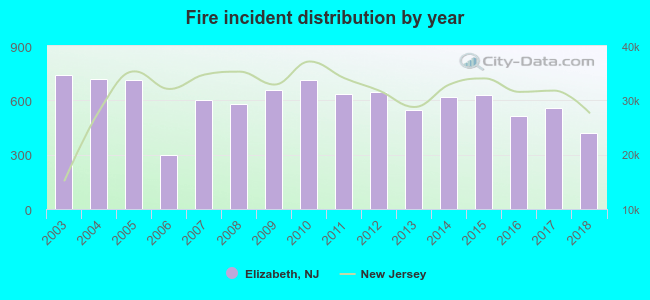 Based on the data from the years 2003 - 2018 the average number of fires per year is 599. The highest number of fire incidents - 738 took place in 2003, and the least - 296 in 2006. The data has a decreasing trend.
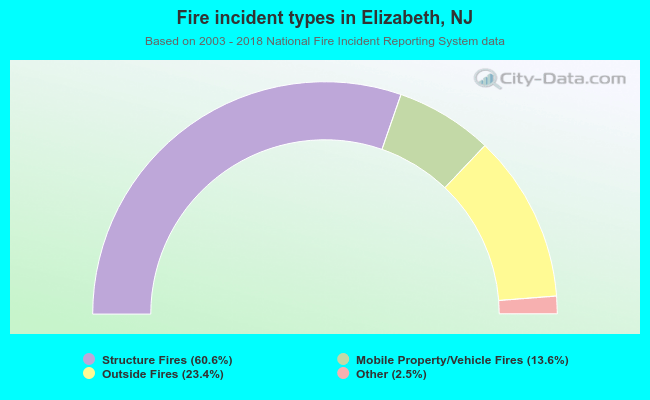 When looking into fire subcategories, the most reports belonged to: Structure Fires (60.6%), and Outside Fires (23.4%).