Farragut, Tennessee Submit your own pictures of this town and show them to the world
OSM Map
General Map
Google Map
MSN Map
OSM Map
General Map
Google Map
MSN Map
OSM Map
General Map
Google Map
MSN Map
OSM Map
General Map
Google Map
MSN Map
Please wait while loading the map...
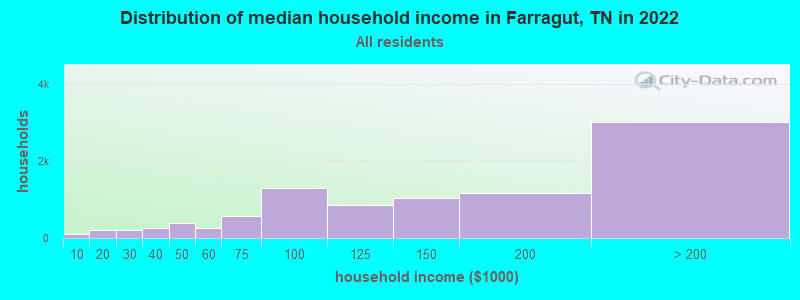
Population in 2022: 24,817 (98% urban, 2% rural). Population change since 2000: +40.1%Males: 11,916 Females: 12,901
March 2022 cost of living index in Farragut: 87.8 (less than average, U.S. average is 100) Percentage of residents living in poverty in 2022: 2.4%
Profiles of local businesses
Business Search - 14 Million verified businesses
Data:
Median household income ($)
Median household income (% change since 2000)
Household income diversity
Ratio of average income to average house value (%)
Ratio of average income to average rent
Median household income ($) - White
Median household income ($) - Black or African American
Median household income ($) - Asian
Median household income ($) - Hispanic or Latino
Median household income ($) - American Indian and Alaska Native
Median household income ($) - Multirace
Median household income ($) - Other Race
Median household income for houses/condos with a mortgage ($)
Median household income for apartments without a mortgage ($)
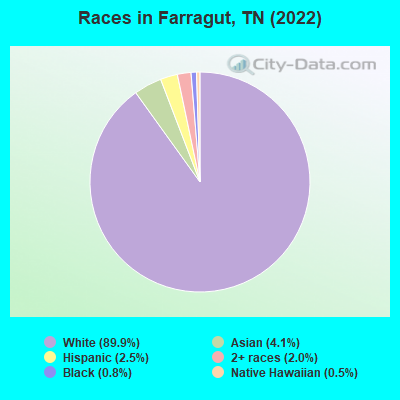
Races - White alone (%)
Races - White alone (% change since 2000)
Races - Black alone (%)
Races - Black alone (% change since 2000)
Races - American Indian alone (%)
Races - American Indian alone (% change since 2000)
Races - Asian alone (%)
Races - Asian alone (% change since 2000)
Races - Hispanic (%)
Races - Hispanic (% change since 2000)
Races - Native Hawaiian and Other Pacific Islander alone (%)
Races - Native Hawaiian and Other Pacific Islander alone (% change since 2000)
Races - Two or more races (%)
Races - Two or more races (% change since 2000)
Races - Other race alone (%)
Races - Other race alone (% change since 2000)
Racial diversity
Unemployment (%)
Unemployment (% change since 2000)
Unemployment (%) - White
Unemployment (%) - Black or African American
Unemployment (%) - Asian
Unemployment (%) - Hispanic or Latino
Unemployment (%) - American Indian and Alaska Native
Unemployment (%) - Multirace
Unemployment (%) - Other Race
Population density (people per square mile)
Population - Males (%)
Population - Females (%)
Population - Males (%) - White
Population - Males (%) - Black or African American
Population - Males (%) - Asian
Population - Males (%) - Hispanic or Latino
Population - Males (%) - American Indian and Alaska Native
Population - Males (%) - Multirace
Population - Males (%) - Other Race
Population - Females (%) - White
Population - Females (%) - Black or African American
Population - Females (%) - Asian
Population - Females (%) - Hispanic or Latino
Population - Females (%) - American Indian and Alaska Native
Population - Females (%) - Multirace
Population - Females (%) - Other Race
Coronavirus confirmed cases (Apr 23, 2024)
Deaths caused by coronavirus (Apr 23, 2024)
Coronavirus confirmed cases (per 100k population) (Apr 23, 2024)
Deaths caused by coronavirus (per 100k population) (Apr 23, 2024)
Daily increase in number of cases (Apr 23, 2024)
Weekly increase in number of cases (Apr 23, 2024)
Cases doubled (in days) (Apr 23, 2024)
Hospitalized patients (Apr 18, 2022)
Negative test results (Apr 18, 2022)
Total test results (Apr 18, 2022)
COVID Vaccine doses distributed (per 100k population) (Sep 19, 2023)
COVID Vaccine doses administered (per 100k population) (Sep 19, 2023)
COVID Vaccine doses distributed (Sep 19, 2023)
COVID Vaccine doses administered (Sep 19, 2023)
Likely homosexual households (%)
Likely homosexual households (% change since 2000)
Likely homosexual households - Lesbian couples (%)
Likely homosexual households - Lesbian couples (% change since 2000)
Likely homosexual households - Gay men (%)
Likely homosexual households - Gay men (% change since 2000)
Cost of living index
Median gross rent ($)
Median contract rent ($)
Median monthly housing costs ($)
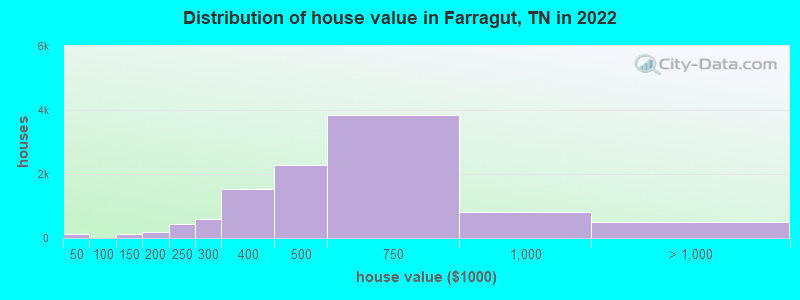
Median house or condo value ($)
Median house or condo value ($ change since 2000)
Mean house or condo value by units in structure - 1, detached ($)
Mean house or condo value by units in structure - 1, attached ($)
Mean house or condo value by units in structure - 2 ($)
Mean house or condo value by units in structure by units in structure - 3 or 4 ($)
Mean house or condo value by units in structure - 5 or more ($)
Mean house or condo value by units in structure - Boat, RV, van, etc. ($)
Mean house or condo value by units in structure - Mobile home ($)
Median house or condo value ($) - White
Median house or condo value ($) - Black or African American
Median house or condo value ($) - Asian
Median house or condo value ($) - Hispanic or Latino
Median house or condo value ($) - American Indian and Alaska Native
Median house or condo value ($) - Multirace
Median house or condo value ($) - Other Race
Median resident age
Resident age diversity
Median resident age - Males
Median resident age - Females
Median resident age - White
Median resident age - Black or African American
Median resident age - Asian
Median resident age - Hispanic or Latino
Median resident age - American Indian and Alaska Native
Median resident age - Multirace
Median resident age - Other Race
Median resident age - Males - White
Median resident age - Males - Black or African American
Median resident age - Males - Asian
Median resident age - Males - Hispanic or Latino
Median resident age - Males - American Indian and Alaska Native
Median resident age - Males - Multirace
Median resident age - Males - Other Race
Median resident age - Females - White
Median resident age - Females - Black or African American
Median resident age - Females - Asian
Median resident age - Females - Hispanic or Latino
Median resident age - Females - American Indian and Alaska Native
Median resident age - Females - Multirace
Median resident age - Females - Other Race
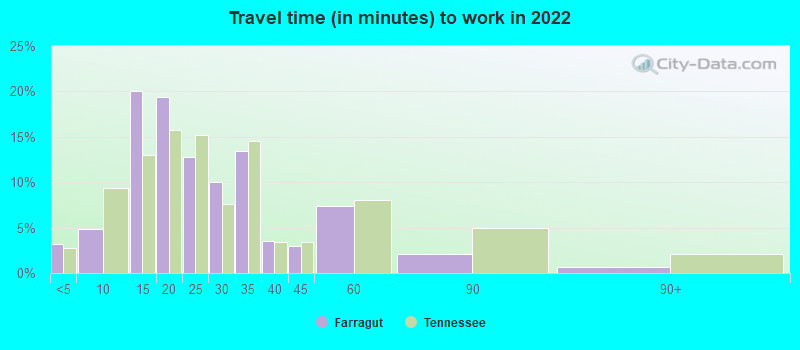
Commute - mean travel time to work (minutes)
Travel time to work - Less than 5 minutes (%)
Travel time to work - Less than 5 minutes (% change since 2000)
Travel time to work - 5 to 9 minutes (%)
Travel time to work - 5 to 9 minutes (% change since 2000)
Travel time to work - 10 to 19 minutes (%)
Travel time to work - 10 to 19 minutes (% change since 2000)
Travel time to work - 20 to 29 minutes (%)
Travel time to work - 20 to 29 minutes (% change since 2000)
Travel time to work - 30 to 39 minutes (%)
Travel time to work - 30 to 39 minutes (% change since 2000)
Travel time to work - 40 to 59 minutes (%)
Travel time to work - 40 to 59 minutes (% change since 2000)
Travel time to work - 60 to 89 minutes (%)
Travel time to work - 60 to 89 minutes (% change since 2000)
Travel time to work - 90 or more minutes (%)
Travel time to work - 90 or more minutes (% change since 2000)
Marital status - Never married (%)
Marital status - Now married (%)
Marital status - Separated (%)
Marital status - Widowed (%)
Marital status - Divorced (%)
Median family income ($)
Median family income (% change since 2000)
Median non-family income ($)
Median non-family income (% change since 2000)
Median per capita income ($)
Median per capita income (% change since 2000)
Median family income ($) - White
Median family income ($) - Black or African American
Median family income ($) - Asian
Median family income ($) - Hispanic or Latino
Median family income ($) - American Indian and Alaska Native
Median family income ($) - Multirace
Median family income ($) - Other Race
Median year house/condo built
Median year apartment built
Year house built - Built 2005 or later (%)
Year house built - Built 2000 to 2004 (%)
Year house built - Built 1990 to 1999 (%)
Year house built - Built 1980 to 1989 (%)
Year house built - Built 1970 to 1979 (%)
Year house built - Built 1960 to 1969 (%)
Year house built - Built 1950 to 1959 (%)
Year house built - Built 1940 to 1949 (%)
Year house built - Built 1939 or earlier (%)
Average household size
Household density (households per square mile)
Average household size - White
Average household size - Black or African American
Average household size - Asian
Average household size - Hispanic or Latino
Average household size - American Indian and Alaska Native
Average household size - Multirace
Average household size - Other Race
Occupied housing units (%)
Vacant housing units (%)
Owner occupied housing units (%)
Renter occupied housing units (%)
Vacancy status - For rent (%)
Vacancy status - For sale only (%)
Vacancy status - Rented or sold, not occupied (%)
Vacancy status - For seasonal, recreational, or occasional use (%)
Vacancy status - For migrant workers (%)
Vacancy status - Other vacant (%)
Residents with income below the poverty level (%)
Residents with income below 50% of the poverty level (%)
Children below poverty level (%)
Poor families by family type - Married-couple family (%)
Poor families by family type - Male, no wife present (%)
Poor families by family type - Female, no husband present (%)
Poverty status for native-born residents (%)
Poverty status for foreign-born residents (%)
Poverty among high school graduates not in families (%)
Poverty among people who did not graduate high school not in families (%)
Residents with income below the poverty level (%) - White
Residents with income below the poverty level (%) - Black or African American
Residents with income below the poverty level (%) - Asian
Residents with income below the poverty level (%) - Hispanic or Latino
Residents with income below the poverty level (%) - American Indian and Alaska Native
Residents with income below the poverty level (%) - Multirace
Residents with income below the poverty level (%) - Other Race
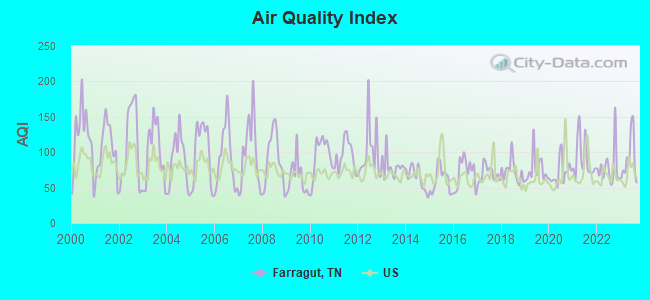
Air pollution - Air Quality Index (AQI)
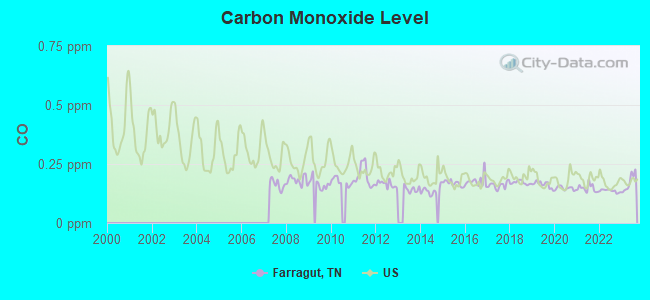
Air pollution - CO
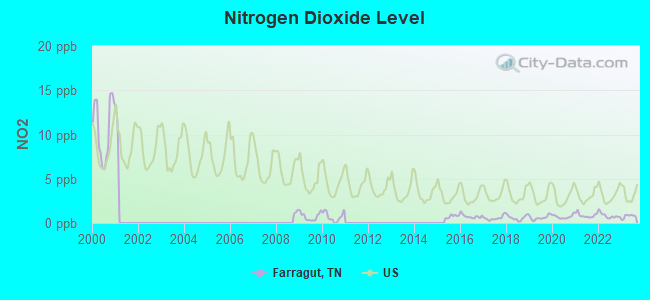
Air pollution - NO2
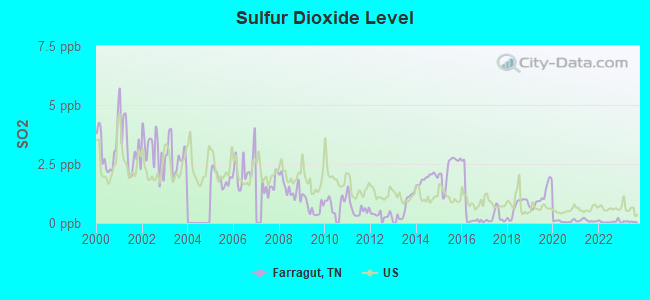
Air pollution - SO2
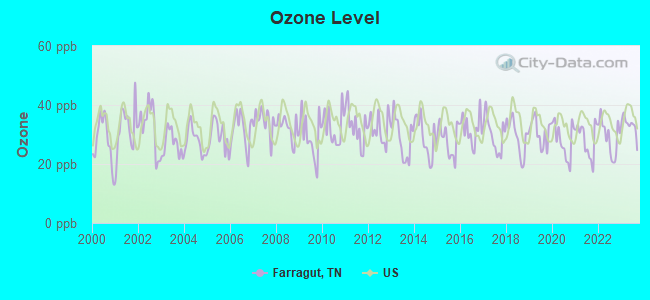
Air pollution - Ozone
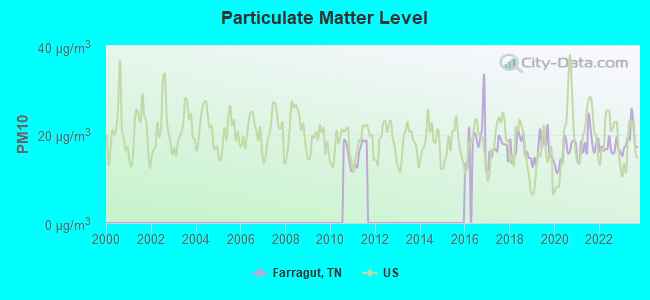
Air pollution - PM10
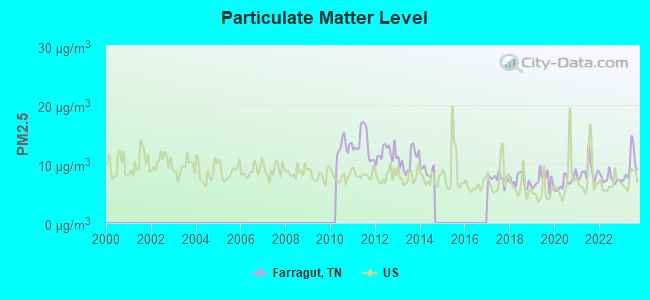
Air pollution - PM25
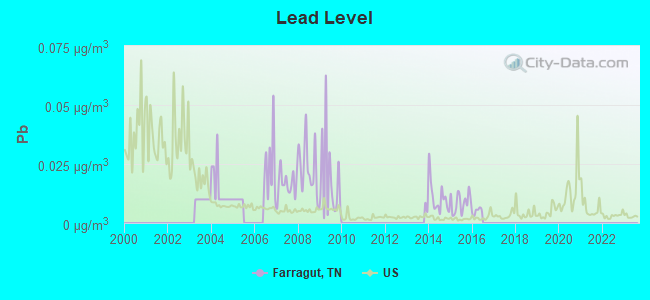
Air pollution - Pb
Crime - Murders per 100,000 population
Crime - Rapes per 100,000 population
Crime - Robberies per 100,000 population
Crime - Assaults per 100,000 population
Crime - Burglaries per 100,000 population
Crime - Thefts per 100,000 population
Crime - Auto thefts per 100,000 population
Crime - Arson per 100,000 population
Crime - City-data.com crime index
Crime - Violent crime index
Crime - Property crime index
Crime - Murders per 100,000 population (5 year average)
Crime - Rapes per 100,000 population (5 year average)
Crime - Robberies per 100,000 population (5 year average)
Crime - Assaults per 100,000 population (5 year average)
Crime - Burglaries per 100,000 population (5 year average)
Crime - Thefts per 100,000 population (5 year average)
Crime - Auto thefts per 100,000 population (5 year average)
Crime - Arson per 100,000 population (5 year average)
Crime - City-data.com crime index (5 year average)
Crime - Violent crime index (5 year average)
Crime - Property crime index (5 year average)
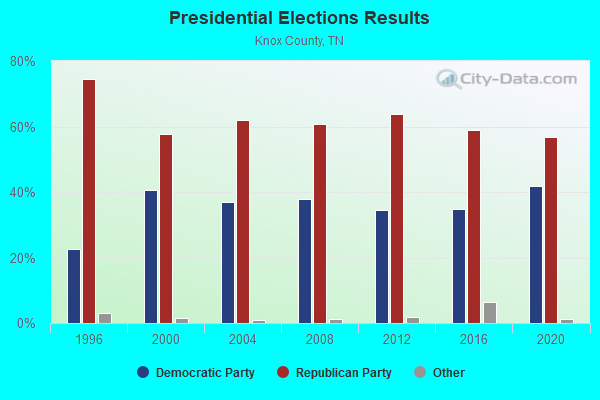
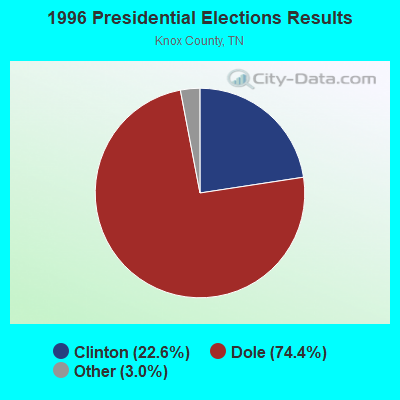
1996 Presidential Elections Results (%) - Democratic Party (Clinton)
1996 Presidential Elections Results (%) - Republican Party (Dole)
1996 Presidential Elections Results (%) - Other
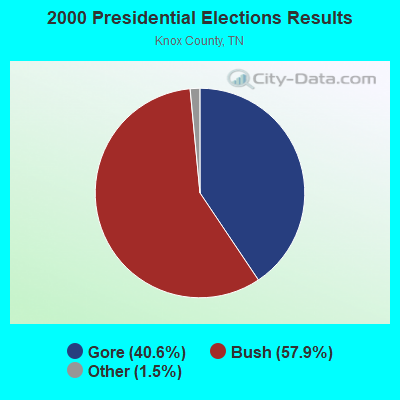
2000 Presidential Elections Results (%) - Democratic Party (Gore)
2000 Presidential Elections Results (%) - Republican Party (Bush)
2000 Presidential Elections Results (%) - Other
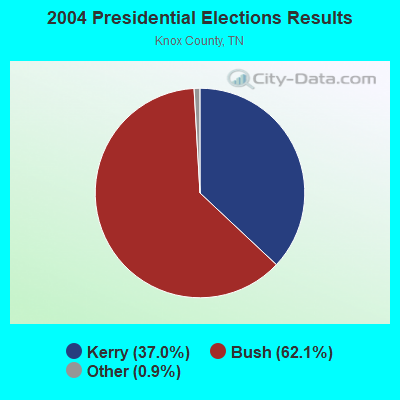
2004 Presidential Elections Results (%) - Democratic Party (Kerry)
2004 Presidential Elections Results (%) - Republican Party (Bush)
2004 Presidential Elections Results (%) - Other
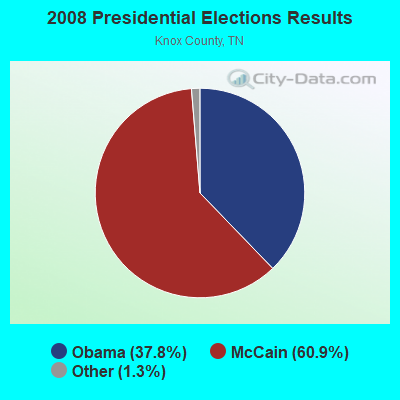
2008 Presidential Elections Results (%) - Democratic Party (Obama)
2008 Presidential Elections Results (%) - Republican Party (McCain)
2008 Presidential Elections Results (%) - Other
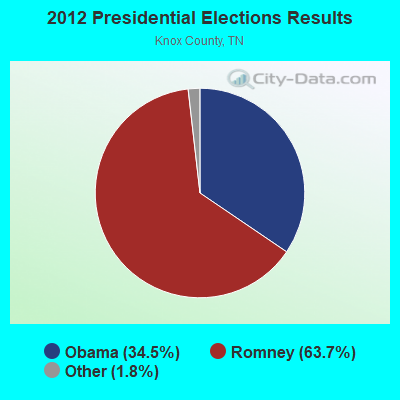
2012 Presidential Elections Results (%) - Democratic Party (Obama)
2012 Presidential Elections Results (%) - Republican Party (Romney)
2012 Presidential Elections Results (%) - Other
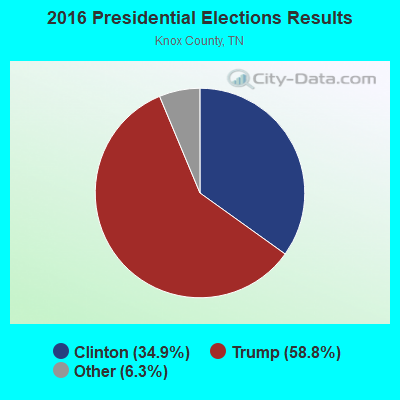
2016 Presidential Elections Results (%) - Democratic Party (Clinton)
2016 Presidential Elections Results (%) - Republican Party (Trump)
2016 Presidential Elections Results (%) - Other
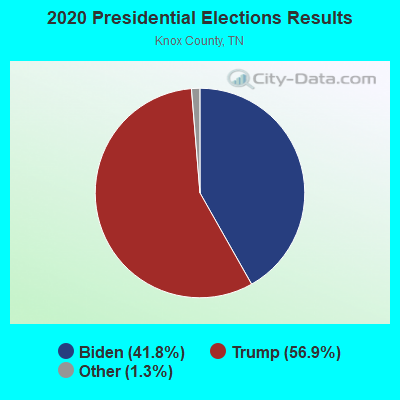
2020 Presidential Elections Results (%) - Democratic Party (Biden)
2020 Presidential Elections Results (%) - Republican Party (Trump)
2020 Presidential Elections Results (%) - Other
Ancestries Reported - Arab (%)
Ancestries Reported - Czech (%)
Ancestries Reported - Danish (%)
Ancestries Reported - Dutch (%)
Ancestries Reported - English (%)
Ancestries Reported - French (%)
Ancestries Reported - French Canadian (%)
Ancestries Reported - German (%)
Ancestries Reported - Greek (%)
Ancestries Reported - Hungarian (%)
Ancestries Reported - Irish (%)
Ancestries Reported - Italian (%)
Ancestries Reported - Lithuanian (%)
Ancestries Reported - Norwegian (%)
Ancestries Reported - Polish (%)
Ancestries Reported - Portuguese (%)
Ancestries Reported - Russian (%)
Ancestries Reported - Scotch-Irish (%)
Ancestries Reported - Scottish (%)
Ancestries Reported - Slovak (%)
Ancestries Reported - Subsaharan African (%)
Ancestries Reported - Swedish (%)
Ancestries Reported - Swiss (%)
Ancestries Reported - Ukrainian (%)
Ancestries Reported - United States (%)
Ancestries Reported - Welsh (%)
Ancestries Reported - West Indian (%)
Ancestries Reported - Other (%)
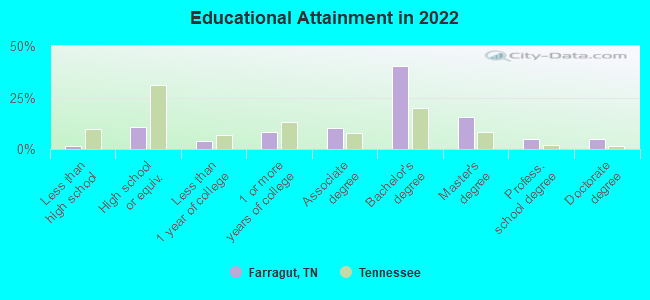
Educational Attainment - No schooling completed (%)
Educational Attainment - Less than high school (%)
Educational Attainment - High school or equivalent (%)
Educational Attainment - Less than 1 year of college (%)
Educational Attainment - 1 or more years of college (%)
Educational Attainment - Associate degree (%)
Educational Attainment - Bachelor's degree (%)
Educational Attainment - Master's degree (%)
Educational Attainment - Professional school degree (%)
Educational Attainment - Doctorate degree (%)
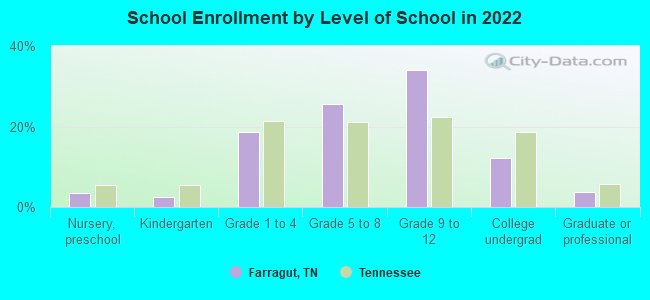
School Enrollment - Nursery, preschool (%)
School Enrollment - Kindergarten (%)
School Enrollment - Grade 1 to 4 (%)
School Enrollment - Grade 5 to 8 (%)
School Enrollment - Grade 9 to 12 (%)
School Enrollment - College undergrad (%)
School Enrollment - Graduate or professional (%)
School Enrollment - Not enrolled in school (%)
School enrollment - Public schools (%)
School enrollment - Private schools (%)
School enrollment - Not enrolled (%)
Median number of rooms in houses and condos
Median number of rooms in apartments
Housing units lacking complete plumbing facilities (%)
Housing units lacking complete kitchen facilities (%)
Density of houses
Urban houses (%)
Rural houses (%)
Households with people 60 years and over (%)
Households with people 65 years and over (%)
Households with people 75 years and over (%)
Households with one or more nonrelatives (%)
Households with no nonrelatives (%)
Population in households (%)
Family households (%)
Nonfamily households (%)
Population in families (%)
Family households with own children (%)
Median number of bedrooms in owner occupied houses
Mean number of bedrooms in owner occupied houses
Median number of bedrooms in renter occupied houses
Mean number of bedrooms in renter occupied houses
Median number of vehichles in owner occupied houses
Mean number of vehichles in owner occupied houses
Median number of vehichles in renter occupied houses
Mean number of vehichles in renter occupied houses
Mortgage status - with mortgage (%)
Mortgage status - with second mortgage (%)
Mortgage status - with home equity loan (%)
Mortgage status - with both second mortgage and home equity loan (%)
Mortgage status - without a mortgage (%)
Average family size
Average family size - White
Average family size - Black or African American
Average family size - Asian
Average family size - Hispanic or Latino
Average family size - American Indian and Alaska Native
Average family size - Multirace
Average family size - Other Race
Geographical mobility - Same house 1 year ago (%)
Geographical mobility - Moved within same county (%)
Geographical mobility - Moved from different county within same state (%)
Geographical mobility - Moved from different state (%)
Geographical mobility - Moved from abroad (%)
Place of birth - Born in state of residence (%)
Place of birth - Born in other state (%)
Place of birth - Native, outside of US (%)
Place of birth - Foreign born (%)
Housing units in structures - 1, detached (%)
Housing units in structures - 1, attached (%)
Housing units in structures - 2 (%)
Housing units in structures - 3 or 4 (%)
Housing units in structures - 5 to 9 (%)
Housing units in structures - 10 to 19 (%)
Housing units in structures - 20 to 49 (%)
Housing units in structures - 50 or more (%)
Housing units in structures - Mobile home (%)
Housing units in structures - Boat, RV, van, etc. (%)
House/condo owner moved in on average (years ago)
Renter moved in on average (years ago)
Year householder moved into unit - Moved in 1999 to March 2000 (%)
Year householder moved into unit - Moved in 1995 to 1998 (%)
Year householder moved into unit - Moved in 1990 to 1994 (%)
Year householder moved into unit - Moved in 1980 to 1989 (%)
Year householder moved into unit - Moved in 1970 to 1979 (%)
Year householder moved into unit - Moved in 1969 or earlier (%)
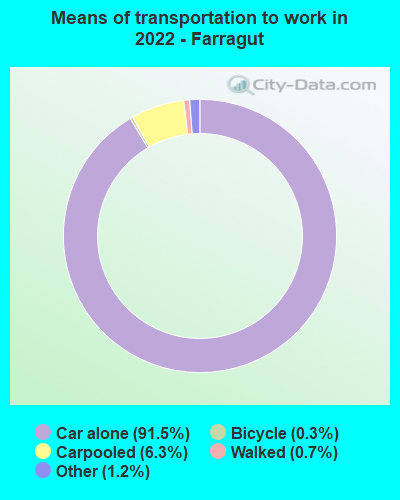
Means of transportation to work - Drove car alone (%)
Means of transportation to work - Carpooled (%)
Means of transportation to work - Public transportation (%)
Means of transportation to work - Bus or trolley bus (%)
Means of transportation to work - Streetcar or trolley car (%)
Means of transportation to work - Subway or elevated (%)
Means of transportation to work - Railroad (%)
Means of transportation to work - Ferryboat (%)
Means of transportation to work - Taxicab (%)
Means of transportation to work - Motorcycle (%)
Means of transportation to work - Bicycle (%)
Means of transportation to work - Walked (%)
Means of transportation to work - Other means (%)
Working at home (%)
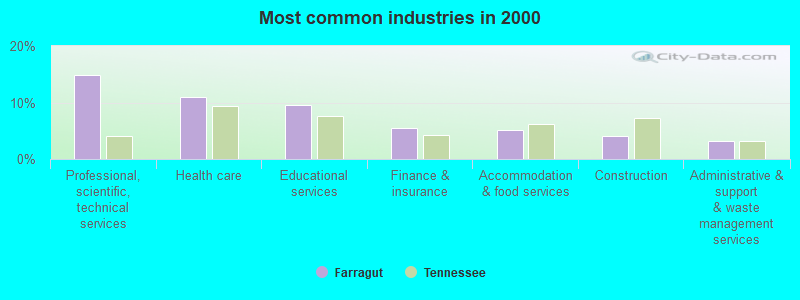
Industry diversity
Most Common Industries - Agriculture, forestry, fishing and hunting, and mining (%)
Most Common Industries - Agriculture, forestry, fishing and hunting (%)
Most Common Industries - Mining, quarrying, and oil and gas extraction (%)
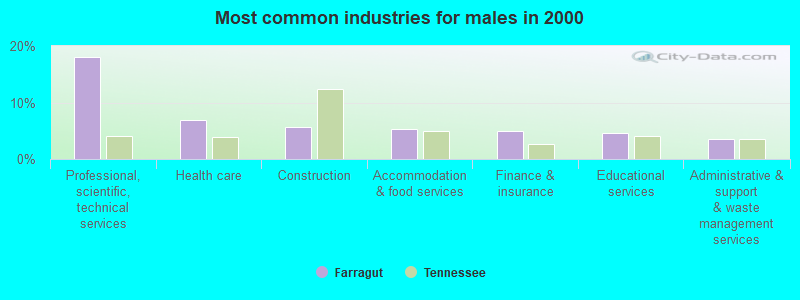
Most Common Industries - Construction (%)
Most Common Industries - Manufacturing (%)
Most Common Industries - Wholesale trade (%)
Most Common Industries - Retail trade (%)
Most Common Industries - Transportation and warehousing, and utilities (%)
Most Common Industries - Transportation and warehousing (%)
Most Common Industries - Utilities (%)
Most Common Industries - Information (%)
Most Common Industries - Finance and insurance, and real estate and rental and leasing (%)
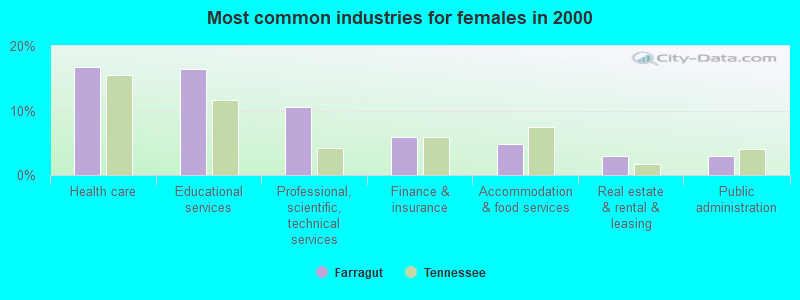
Most Common Industries - Finance and insurance (%)
Most Common Industries - Real estate and rental and leasing (%)
Most Common Industries - Professional, scientific, and management, and administrative and waste management services (%)
Most Common Industries - Professional, scientific, and technical services (%)
Most Common Industries - Management of companies and enterprises (%)
Most Common Industries - Administrative and support and waste management services (%)
Most Common Industries - Educational services, and health care and social assistance (%)
Most Common Industries - Educational services (%)
Most Common Industries - Health care and social assistance (%)
Most Common Industries - Arts, entertainment, and recreation, and accommodation and food services (%)
Most Common Industries - Arts, entertainment, and recreation (%)
Most Common Industries - Accommodation and food services (%)
Most Common Industries - Other services, except public administration (%)
Most Common Industries - Public administration (%)
Occupation diversity
Most Common Occupations - Management, business, science, and arts occupations (%)
Most Common Occupations - Management, business, and financial occupations (%)
Most Common Occupations - Management occupations (%)
Most Common Occupations - Business and financial operations occupations (%)
Most Common Occupations - Computer, engineering, and science occupations (%)
Most Common Occupations - Computer and mathematical occupations (%)
Most Common Occupations - Architecture and engineering occupations (%)
Most Common Occupations - Life, physical, and social science occupations (%)
Most Common Occupations - Education, legal, community service, arts, and media occupations (%)
Most Common Occupations - Community and social service occupations (%)
Most Common Occupations - Legal occupations (%)
Most Common Occupations - Education, training, and library occupations (%)
Most Common Occupations - Arts, design, entertainment, sports, and media occupations (%)
Most Common Occupations - Healthcare practitioners and technical occupations (%)
Most Common Occupations - Health diagnosing and treating practitioners and other technical occupations (%)
Most Common Occupations - Health technologists and technicians (%)
Most Common Occupations - Service occupations (%)
Most Common Occupations - Healthcare support occupations (%)
Most Common Occupations - Protective service occupations (%)
Most Common Occupations - Fire fighting and prevention, and other protective service workers including supervisors (%)
Most Common Occupations - Law enforcement workers including supervisors (%)
Most Common Occupations - Food preparation and serving related occupations (%)
Most Common Occupations - Building and grounds cleaning and maintenance occupations (%)
Most Common Occupations - Personal care and service occupations (%)
Most Common Occupations - Sales and office occupations (%)
Most Common Occupations - Sales and related occupations (%)
Most Common Occupations - Office and administrative support occupations (%)
Most Common Occupations - Natural resources, construction, and maintenance occupations (%)
Most Common Occupations - Farming, fishing, and forestry occupations (%)
Most Common Occupations - Construction and extraction occupations (%)
Most Common Occupations - Installation, maintenance, and repair occupations (%)
Most Common Occupations - Production, transportation, and material moving occupations (%)
Most Common Occupations - Production occupations (%)
Most Common Occupations - Transportation occupations (%)
Most Common Occupations - Material moving occupations (%)
People in Group quarters - Institutionalized population (%)
People in Group quarters - Correctional institutions (%)
People in Group quarters - Federal prisons and detention centers (%)
People in Group quarters - Halfway houses (%)
People in Group quarters - Local jails and other confinement facilities (including police lockups) (%)
People in Group quarters - Military disciplinary barracks (%)
People in Group quarters - State prisons (%)
People in Group quarters - Other types of correctional institutions (%)
People in Group quarters - Nursing homes (%)
People in Group quarters - Hospitals/wards, hospices, and schools for the handicapped (%)
People in Group quarters - Hospitals/wards and hospices for chronically ill (%)
People in Group quarters - Hospices or homes for chronically ill (%)
People in Group quarters - Military hospitals or wards for chronically ill (%)
People in Group quarters - Other hospitals or wards for chronically ill (%)
People in Group quarters - Hospitals or wards for drug/alcohol abuse (%)
People in Group quarters - Mental (Psychiatric) hospitals or wards (%)
People in Group quarters - Schools, hospitals, or wards for the mentally retarded (%)
People in Group quarters - Schools, hospitals, or wards for the physically handicapped (%)
People in Group quarters - Institutions for the deaf (%)
People in Group quarters - Institutions for the blind (%)
People in Group quarters - Orthopedic wards and institutions for the physically handicapped (%)
People in Group quarters - Wards in general hospitals for patients who have no usual home elsewhere (%)
People in Group quarters - Wards in military hospitals for patients who have no usual home elsewhere (%)
People in Group quarters - Juvenile institutions (%)
People in Group quarters - Long-term care (%)
People in Group quarters - Homes for abused, dependent, and neglected children (%)
People in Group quarters - Residential treatment centers for emotionally disturbed children (%)
People in Group quarters - Training schools for juvenile delinquents (%)
People in Group quarters - Short-term care, detention or diagnostic centers for delinquent children (%)
People in Group quarters - Type of juvenile institution unknown (%)
People in Group quarters - Noninstitutionalized population (%)
People in Group quarters - College dormitories (includes college quarters off campus) (%)
People in Group quarters - Military quarters (%)
People in Group quarters - On base (%)
People in Group quarters - Barracks, unaccompanied personnel housing (UPH), (Enlisted/Officer), ;and similar group living quarters for military personnel (%)
People in Group quarters - Transient quarters for temporary residents (%)
People in Group quarters - Military ships (%)
People in Group quarters - Group homes (%)
People in Group quarters - Homes or halfway houses for drug/alcohol abuse (%)
People in Group quarters - Homes for the mentally ill (%)
People in Group quarters - Homes for the mentally retarded (%)
People in Group quarters - Homes for the physically handicapped (%)
People in Group quarters - Other group homes (%)
People in Group quarters - Religious group quarters (%)
People in Group quarters - Dormitories (%)
People in Group quarters - Agriculture workers' dormitories on farms (%)
People in Group quarters - Job Corps and vocational training facilities (%)
People in Group quarters - Other workers' dormitories (%)
People in Group quarters - Crews of maritime vessels (%)
People in Group quarters - Other nonhousehold living situations (%)
People in Group quarters - Other noninstitutional group quarters (%)
Residents speaking English at home (%)
Residents speaking English at home - Born in the United States (%)
Residents speaking English at home - Native, born elsewhere (%)
Residents speaking English at home - Foreign born (%)
Residents speaking Spanish at home (%)
Residents speaking Spanish at home - Born in the United States (%)
Residents speaking Spanish at home - Native, born elsewhere (%)
Residents speaking Spanish at home - Foreign born (%)
Residents speaking other language at home (%)
Residents speaking other language at home - Born in the United States (%)
Residents speaking other language at home - Native, born elsewhere (%)
Residents speaking other language at home - Foreign born (%)
Class of Workers - Employee of private company (%)
Class of Workers - Self-employed in own incorporated business (%)
Class of Workers - Private not-for-profit wage and salary workers (%)
Class of Workers - Local government workers (%)
Class of Workers - State government workers (%)
Class of Workers - Federal government workers (%)
Class of Workers - Self-employed workers in own not incorporated business and Unpaid family workers (%)
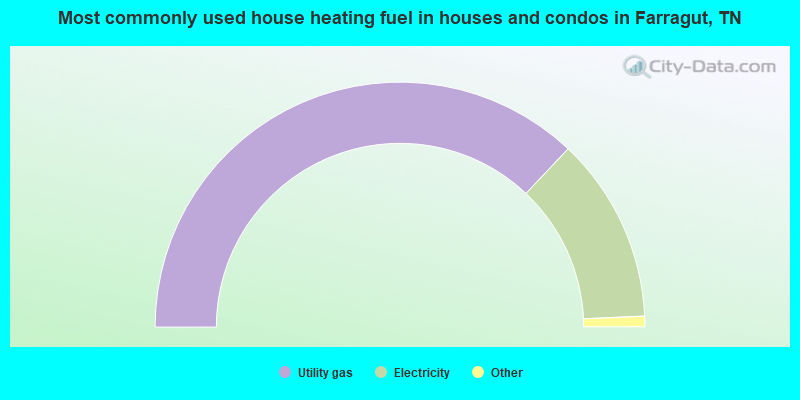
House heating fuel used in houses and condos - Utility gas (%)
House heating fuel used in houses and condos - Bottled, tank, or LP gas (%)
House heating fuel used in houses and condos - Electricity (%)
House heating fuel used in houses and condos - Fuel oil, kerosene, etc. (%)
House heating fuel used in houses and condos - Coal or coke (%)
House heating fuel used in houses and condos - Wood (%)
House heating fuel used in houses and condos - Solar energy (%)
House heating fuel used in houses and condos - Other fuel (%)
House heating fuel used in houses and condos - No fuel used (%)
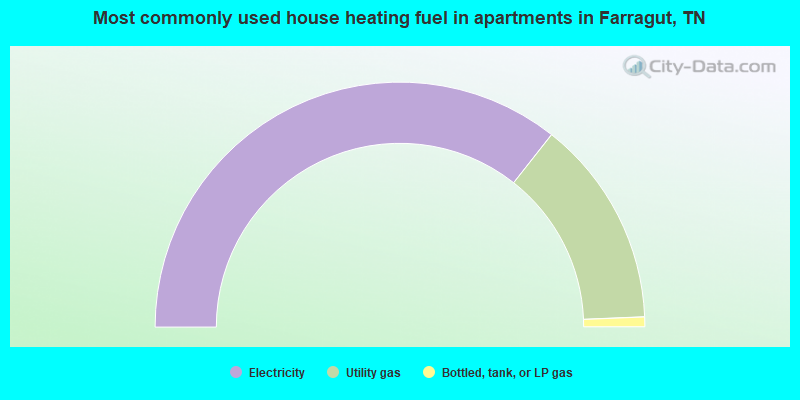
House heating fuel used in apartments - Utility gas (%)
House heating fuel used in apartments - Bottled, tank, or LP gas (%)
House heating fuel used in apartments - Electricity (%)
House heating fuel used in apartments - Fuel oil, kerosene, etc. (%)
House heating fuel used in apartments - Coal or coke (%)
House heating fuel used in apartments - Wood (%)
House heating fuel used in apartments - Solar energy (%)
House heating fuel used in apartments - Other fuel (%)
House heating fuel used in apartments - No fuel used (%)
Armed forces status - In Armed Forces (%)
Armed forces status - Civilian (%)
Armed forces status - Civilian - Veteran (%)
Armed forces status - Civilian - Nonveteran (%)
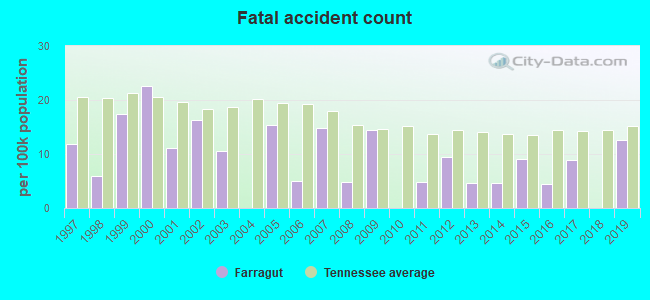
Fatal accidents locations in years 2005-2021
Fatal accidents locations in 2005
Fatal accidents locations in 2006
Fatal accidents locations in 2007
Fatal accidents locations in 2008
Fatal accidents locations in 2009
Fatal accidents locations in 2010
Fatal accidents locations in 2011
Fatal accidents locations in 2012
Fatal accidents locations in 2013
Fatal accidents locations in 2014
Fatal accidents locations in 2015
Fatal accidents locations in 2016
Fatal accidents locations in 2017
Fatal accidents locations in 2018
Fatal accidents locations in 2019
Fatal accidents locations in 2020
Fatal accidents locations in 2021
Alcohol use - People drinking some alcohol every month (%)
Alcohol use - People not drinking at all (%)
Alcohol use - Average days/month drinking alcohol
Alcohol use - Average drinks/week
Alcohol use - Average days/year people drink much
Audiometry - Average condition of hearing (%)
Audiometry - People that can hear a whisper from across a quiet room (%)
Audiometry - People that can hear normal voice from across a quiet room (%)
Audiometry - Ears ringing, roaring, buzzing (%)
Audiometry - Had a job exposure to loud noise (%)
Audiometry - Had off-work exposure to loud noise (%)
Blood Pressure & Cholesterol - Has high blood pressure (%)
Blood Pressure & Cholesterol - Checking blood pressure at home (%)
Blood Pressure & Cholesterol - Frequently checking blood cholesterol (%)
Blood Pressure & Cholesterol - Has high cholesterol level (%)
Consumer Behavior - Money monthly spent on food at supermarket/grocery store
Consumer Behavior - Money monthly spent on food at other stores
Consumer Behavior - Money monthly spent on eating out
Consumer Behavior - Money monthly spent on carryout/delivered foods
Consumer Behavior - Income spent on food at supermarket/grocery store (%)
Consumer Behavior - Income spent on food at other stores (%)
Consumer Behavior - Income spent on eating out (%)
Consumer Behavior - Income spent on carryout/delivered foods (%)
Current Health Status - General health condition (%)
Current Health Status - Blood donors (%)
Current Health Status - Has blood ever tested for HIV virus (%)
Current Health Status - Left-handed people (%)
Dermatology - People using sunscreen (%)
Diabetes - Diabetics (%)
Diabetes - Had a blood test for high blood sugar (%)
Diabetes - People taking insulin (%)
Diet Behavior & Nutrition - Diet health (%)
Diet Behavior & Nutrition - Milk product consumption (# of products/month)
Diet Behavior & Nutrition - Meals not home prepared (#/week)
Diet Behavior & Nutrition - Meals from fast food or pizza place (#/week)
Diet Behavior & Nutrition - Ready-to-eat foods (#/month)
Diet Behavior & Nutrition - Frozen meals/pizza (#/month)
Drug Use - People that ever used marijuana or hashish (%)
Drug Use - Ever used hard drugs (%)
Drug Use - Ever used any form of cocaine (%)
Drug Use - Ever used heroin (%)
Drug Use - Ever used methamphetamine (%)
Health Insurance - People covered by health insurance (%)
Kidney Conditions-Urology - Avg. # of times urinating at night
Medical Conditions - People with asthma (%)
Medical Conditions - People with anemia (%)
Medical Conditions - People with psoriasis (%)
Medical Conditions - People with overweight (%)
Medical Conditions - Elderly people having difficulties in thinking or remembering (%)
Medical Conditions - People who ever received blood transfusion (%)
Medical Conditions - People having trouble seeing even with glass/contacts (%)
Medical Conditions - People with arthritis (%)
Medical Conditions - People with gout (%)
Medical Conditions - People with congestive heart failure (%)
Medical Conditions - People with coronary heart disease (%)
Medical Conditions - People with angina pectoris (%)
Medical Conditions - People who ever had heart attack (%)
Medical Conditions - People who ever had stroke (%)
Medical Conditions - People with emphysema (%)
Medical Conditions - People with thyroid problem (%)
Medical Conditions - People with chronic bronchitis (%)
Medical Conditions - People with any liver condition (%)
Medical Conditions - People who ever had cancer or malignancy (%)
Mental Health - People who have little interest in doing things (%)
Mental Health - People feeling down, depressed, or hopeless (%)
Mental Health - People who have trouble sleeping or sleeping too much (%)
Mental Health - People feeling tired or having little energy (%)
Mental Health - People with poor appetite or overeating (%)
Mental Health - People feeling bad about themself (%)
Mental Health - People who have trouble concentrating on things (%)
Mental Health - People moving or speaking slowly or too fast (%)
Mental Health - People having thoughts they would be better off dead (%)
Oral Health - Average years since last visit a dentist
Oral Health - People embarrassed because of mouth (%)
Oral Health - People with gum disease (%)
Oral Health - General health of teeth and gums (%)
Oral Health - Average days a week using dental floss/device
Oral Health - Average days a week using mouthwash for dental problem
Oral Health - Average number of teeth
Pesticide Use - Households using pesticides to control insects (%)
Pesticide Use - Households using pesticides to kill weeds (%)
Physical Activity - People doing vigorous-intensity work activities (%)
Physical Activity - People doing moderate-intensity work activities (%)
Physical Activity - People walking or bicycling (%)
Physical Activity - People doing vigorous-intensity recreational activities (%)
Physical Activity - People doing moderate-intensity recreational activities (%)
Physical Activity - Average hours a day doing sedentary activities
Physical Activity - Average hours a day watching TV or videos
Physical Activity - Average hours a day using computer
Physical Functioning - People having limitations keeping them from working (%)
Physical Functioning - People limited in amount of work they can do (%)
Physical Functioning - People that need special equipment to walk (%)
Physical Functioning - People experiencing confusion/memory problems (%)
Physical Functioning - People requiring special healthcare equipment (%)
Prescription Medications - Average number of prescription medicines taking
Preventive Aspirin Use - Adults 40+ taking low-dose aspirin (%)
Reproductive Health - Vaginal deliveries (%)
Reproductive Health - Cesarean deliveries (%)
Reproductive Health - Deliveries resulted in a live birth (%)
Reproductive Health - Pregnancies resulted in a delivery (%)
Reproductive Health - Women breastfeeding newborns (%)
Reproductive Health - Women that had a hysterectomy (%)
Reproductive Health - Women that had both ovaries removed (%)
Reproductive Health - Women that have ever taken birth control pills (%)
Reproductive Health - Women taking birth control pills (%)
Reproductive Health - Women that have ever used Depo-Provera or injectables (%)
Reproductive Health - Women that have ever used female hormones (%)
Sexual Behavior - People 18+ that ever had sex (vaginal, anal, or oral) (%)
Sexual Behavior - Males 18+ that ever had vaginal sex with a woman (%)
Sexual Behavior - Males 18+ that ever performed oral sex on a woman (%)
Sexual Behavior - Males 18+ that ever had anal sex with a woman (%)
Sexual Behavior - Males 18+ that ever had any sex with a man (%)
Sexual Behavior - Females 18+ that ever had vaginal sex with a man (%)
Sexual Behavior - Females 18+ that ever performed oral sex on a man (%)
Sexual Behavior - Females 18+ that ever had anal sex with a man (%)
Sexual Behavior - Females 18+ that ever had any kind of sex with a woman (%)
Sexual Behavior - Average age people first had sex
Sexual Behavior - Average number of female sex partners in lifetime (males 18+)
Sexual Behavior - Average number of female vaginal sex partners in lifetime (males 18+)
Sexual Behavior - Average age people first performed oral sex on a woman (18+)
Sexual Behavior - Average number of woman performed oral sex on in lifetime (18+)
Sexual Behavior - Average number of male sex partners in lifetime (males 18+)
Sexual Behavior - Average number of male anal sex partners in lifetime (males 18+)
Sexual Behavior - Average age people first performed oral sex on a man (18+)
Sexual Behavior - Average number of male oral sex partners in lifetime (18+)
Sexual Behavior - People using protection when performing oral sex (%)
Sexual Behavior - Average number of times people have vaginal or anal sex a year
Sexual Behavior - People having sex without condom (%)
Sexual Behavior - Average number of male sex partners in lifetime (females 18+)
Sexual Behavior - Average number of male vaginal sex partners in lifetime (females 18+)
Sexual Behavior - Average number of female sex partners in lifetime (females 18+)
Sexual Behavior - Circumcised males 18+ (%)
Sleep Disorders - Average hours sleeping at night
Sleep Disorders - People that has trouble sleeping (%)
Smoking-Cigarette Use - People smoking cigarettes (%)
Taste & Smell - People 40+ having problems with smell (%)
Taste & Smell - People 40+ having problems with taste (%)
Taste & Smell - People 40+ that ever had wisdom teeth removed (%)
Taste & Smell - People 40+ that ever had tonsils teeth removed (%)
Taste & Smell - People 40+ that ever had a loss of consciousness because of a head injury (%)
Taste & Smell - People 40+ that ever had a broken nose or other serious injury to face or skull (%)
Taste & Smell - People 40+ that ever had two or more sinus infections (%)
Weight - Average height (inches)
Weight - Average weight (pounds)
Weight - Average BMI
Weight - People that are obese (%)
Weight - People that ever were obese (%)
Weight - People trying to lose weight (%)
Latest news from Farragut, TN collected exclusively by city-data.com from local newspapers, TV, and radio stations
Ancestries: English (13.5%), American (13.0%), European (10.0%), German (10.0%), Irish (7.2%), Scotch-Irish (5.5%).
Current Local Time:
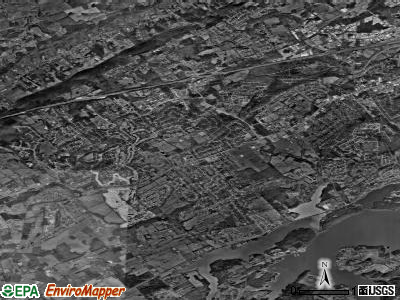
Land area: 16.1 square miles.
Population density: 1,543 people per square mile (low).
1,570 residents are foreign born (3.7% Asia , 1.4% Europe ).
This town:
6.4%Tennessee:
5.4%
Median real estate property taxes paid for housing units with mortgages in 2022: $2,128 (0.4%)Median real estate property taxes paid for housing units with no mortgage in 2022: $1,855 (0.4%)
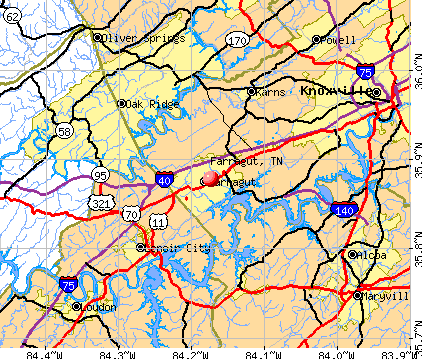
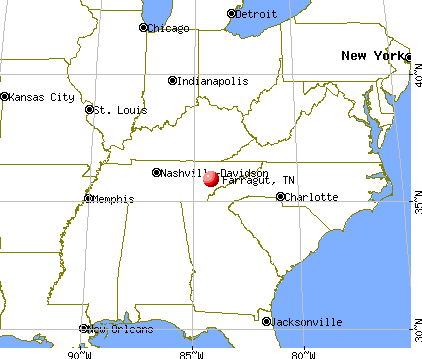
Nearest city with pop. 50,000+: Knoxville, TN
Nearest city with pop. 200,000+: Nashville-Davidson, TN
Nearest city with pop. 1,000,000+: Chicago, IL
Nearest cities:
Latitude: 35.88 N, Longitude: 84.17 W
Daytime population change due to commuting: -1,323 (-5.4%)Workers who live and work in this town: 3,996 (32.5%)
Area code commonly used in this area: 865
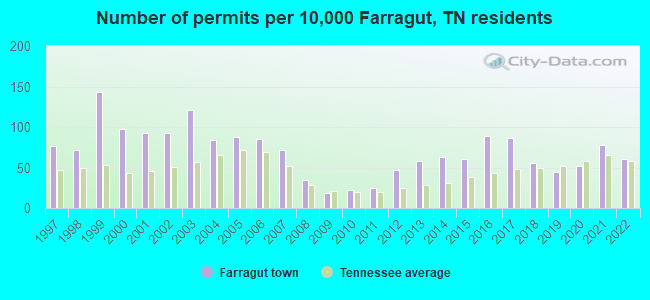
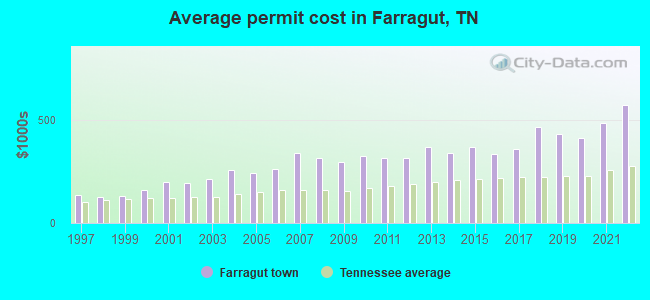
Single-family new house construction building permits:
2022: 108 buildings , average cost: $575,1002021: 138 buildings , average cost: $484,8002020: 93 buildings , average cost: $412,3002019: 78 buildings , average cost: $433,7002018: 99 buildings , average cost: $468,3002017: 154 buildings , average cost: $363,0002016: 157 buildings , average cost: $336,9002015: 106 buildings , average cost: $371,9002014: 111 buildings , average cost: $341,2002013: 103 buildings , average cost: $372,4002012: 83 buildings , average cost: $319,3002011: 45 buildings , average cost: $315,9002010: 39 buildings , average cost: $324,5002009: 34 buildings , average cost: $298,6002008: 61 buildings , average cost: $317,9002007: 127 buildings , average cost: $342,2002006: 150 buildings , average cost: $261,3002005: 156 buildings , average cost: $243,0002004: 149 buildings , average cost: $258,0002003: 214 buildings , average cost: $213,2002002: 164 buildings , average cost: $195,2002001: 165 buildings , average cost: $198,2002000: 171 buildings , average cost: $161,2001999: 254 buildings , average cost: $131,1001998: 126 buildings , average cost: $128,2001997: 136 buildings , average cost: $135,200Unemployment in December 2023: Population change in the 1990s: +4,641 (+35.5%).
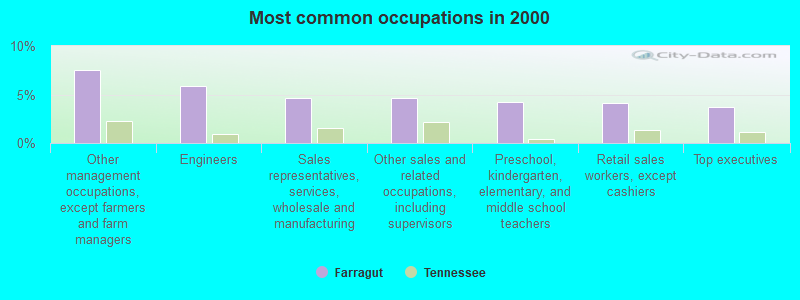
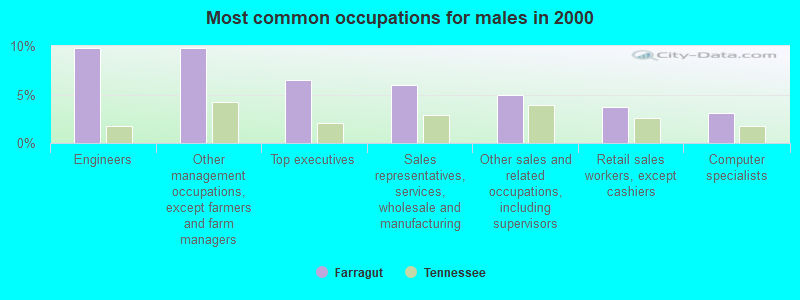
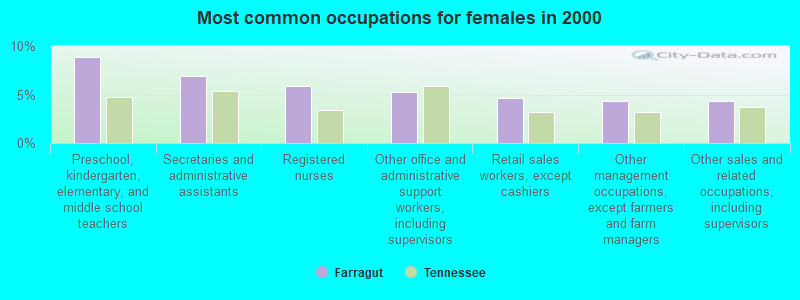
Most common occupations in Farragut, TN (%)
Both Males Females
Other management occupations, except farmers and farm managers (7.5%)
Engineers (5.9%)
Sales representatives, services, wholesale and manufacturing (4.7%)
Other sales and related occupations, including supervisors (4.7%)
Preschool, kindergarten, elementary, and middle school teachers (4.2%)
Retail sales workers, except cashiers (4.1%)
Top executives (3.7%)
Engineers (9.8%)
Other management occupations, except farmers and farm managers (9.8%)
Top executives (6.5%)
Sales representatives, services, wholesale and manufacturing (6.0%)
Other sales and related occupations, including supervisors (5.0%)
Retail sales workers, except cashiers (3.7%)
Computer specialists (3.1%)
Preschool, kindergarten, elementary, and middle school teachers (8.8%)
Secretaries and administrative assistants (7.0%)
Registered nurses (5.8%)
Other office and administrative support workers, including supervisors (5.3%)
Retail sales workers, except cashiers (4.6%)
Other management occupations, except farmers and farm managers (4.3%)
Other sales and related occupations, including supervisors (4.3%)
Tornado activity:
Farragut-area historical tornado activity is below Tennessee state average. It is 26% smaller than the overall U.S. average.
On 2/21/1993, a category F3 (max. wind speeds 158-206 mph) tornado 10.7 miles away from the Farragut town center injured 3 people and caused between $500,000 and $5,000,000 in damages.
On 2/21/1993, a category F3 tornado 13.1 miles away from the town center killed one person and injured 55 people and caused between $5000 and $50,000 in damages.
Earthquake activity:
Farragut-area historical earthquake activity is significantly above Tennessee state average. It is 86% greater than the overall U.S. average. On 11/30/1973 at 07:48:41, a magnitude 4.7 (4.7 MB, 4.6 ML, Class: Light, Intensity: IV - V) earthquake occurred 13.0 miles away from the city center On 7/27/1980 at 18:52:21, a magnitude 5.2 (5.1 MB, 4.7 MS, 5.0 UK, 5.2 UK, Class: Moderate, Intensity: VI - VII) earthquake occurred 161.5 miles away from Farragut center On 4/29/2003 at 08:59:39, a magnitude 4.9 (4.4 MB, 4.6 MW, 4.9 LG) earthquake occurred 126.2 miles away from the city center On 8/9/2020 at 12:07:37, a magnitude 5.1 (5.1 MW, Depth: 4.7 mi) earthquake occurred 176.9 miles away from Farragut center On 12/12/2018 at 09:14:43, a magnitude 4.4 (4.4 MW, Depth: 4.9 mi) earthquake occurred 36.3 miles away from the city center On 8/2/1974 at 08:52:09, a magnitude 4.9 (4.3 MB, 4.9 LG) earthquake occurred 168.5 miles away from the city center Magnitude types: regional Lg-wave magnitude (LG), body-wave magnitude (MB), local magnitude (ML), surface-wave magnitude (MS), moment magnitude (MW) Natural disasters: The number of natural disasters in Knox County (13) is near the US average (15).Major Disasters (Presidential) Declared: 8Emergencies Declared: 2Floods: 9, Storms: 7, Tornadoes: 6, Winds: 3, Winter Storms: 2, Heavy Rain: 1, Hurricane: 1, Landslide: 1, Mudslide: 1, Snowfall: 1, Other: 1 (Note: some incidents may be assigned to more than one category). Hospitals and medical centers near Farragut: EAST TN CHILDRENS HOSP HOME HEALTH (Home Health Center, about 2 miles away; KNOXVILLE, TN)
FMC WEST KNOXVILLE (Dialysis Facility, about 2 miles away; KNOXVILLE, TN)
BAPTIST HOSPITAL FOR WOMEN (Hospital, about 4 miles away; KNOXVILLE, TN)
BAPTIST HOSPITAL WEST (Hospital, about 4 miles away; KNOXVILLE, TN)
FARRAGUT HEALTH CARE CENTER LTD (Nursing Home, about 6 miles away; KNOXVILLE, TN)
SUMMIT VIEW OF FARRAGUT, LLC (Nursing Home, about 6 miles away; KNOXVILLE, TN)
SYMPHONY HOME CARE SVS KNOXVILLE PEC (Home Health Center, about 6 miles away; KNOXVILLE, TN)
Airports located in Farragut: Colleges/universities with over 2000 students nearest to Farragut:
Pellissippi State Community College (about 5 miles; Knoxville, TN ; Full-time enrollment: 7,271)
The University of Tennessee-Knoxville (about 15 miles; Knoxville, TN ; FT enrollment: 25,483)
Roane State Community College (about 26 miles; Harriman, TN ; FT enrollment: 4,302)
Walters State Community College (about 57 miles; Morristown, TN ; FT enrollment: 4,359)
Lincoln Memorial University (about 57 miles; Harrogate, TN ; FT enrollment: 3,706)
University of the Cumberlands (about 60 miles; Williamsburg, KY ; FT enrollment: 3,585)
Cleveland State Community College (about 62 miles; Cleveland, TN ; FT enrollment: 2,500)
User-submitted facts and corrections:
Correction: Concord Christian School comprises grades K-8, not K-7
Birthplace of: David Farragut - Navy admiral.
Knox County has a predicted average indoor radon screening level greater than 4 pCi/L (pico curies per liter) - Highest Potential Average household size: This town:
2.7 peopleTennessee:
2.5 people
Percentage of family households: This town:
80.3%Whole state:
67.3%
Percentage of households with unmarried partners: This town:
2.0%Whole state:
5.8%
Likely homosexual households (counted as self-reported same-sex unmarried-partner households)
Lesbian couples: 0.4% of all households Gay men: 0.3% of all households
169 people in nursing facilities/skilled-nursing facilities in 2010people in nursing homes in 2000people in religious group quarters in 2000
Banks with branches in Farragut (2011 data):
Jefferson Federal Bank: Farragut Branch at 11916 Kingston Pike, branch established on 2006/07/03. Info updated 2008/12/04: Bank assets: $530.9 mil, Deposits: $432.6 mil, headquarters in Morristown, TN, negative income in the last year , Commercial Lending Specialization, 13 total offices , Holding Company: Jefferson Bancshares, Inc.
Tennessee State Bank: Turkey Creek Branch at 11470 Parkside Drive, branch established on 2009/01/16. Info updated 2006/11/03: Bank assets: $720.6 mil, Deposits: $626.7 mil, headquarters in Pigeon Forge, TN, positive income , Commercial Lending Specialization, 16 total offices , Holding Company: Tennessee State Bancshares, Inc.
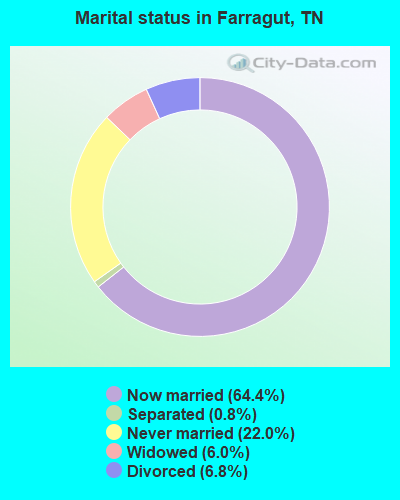
For population 15 years and over in Farragut:
Never married: 22.0%Now married: 64.4%Separated: 0.8%Widowed: 6.0%Divorced: 6.8% For population 25 years and over in Farragut:
High school or higher: 98.5%Bachelor's degree or higher: 65.4%Graduate or professional degree: 26.8%Unemployed: 3.1%Mean travel time to work (commute): 16.8 minutes
Education Gini index (Inequality in education) Here:
8.6Tennessee average:
11.4
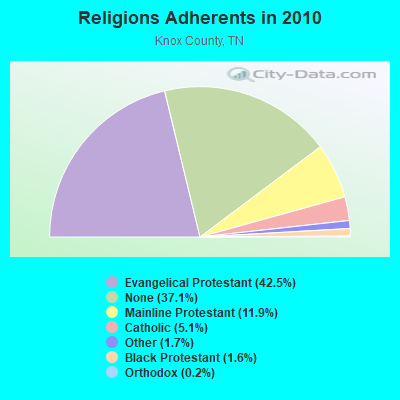
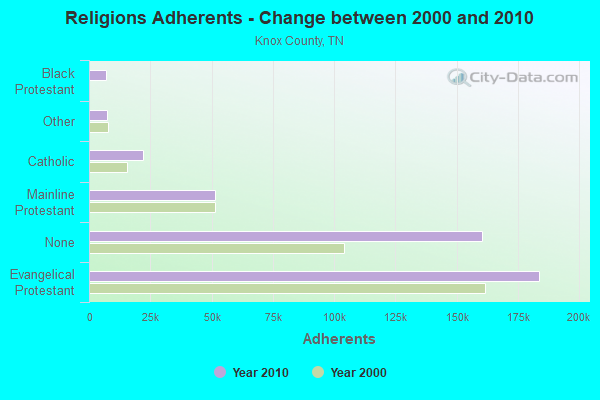
Religion statistics for Farragut, TN (based on Knox County data)
Religion Adherents Congregations Evangelical Protestant 183,754 365 Mainline Protestant 51,345 116 Catholic 21,988 7 Other 7,178 34 Black Protestant 6,897 29 Orthodox 818 2 None 160,246 -
Source: Clifford Grammich, Kirk Hadaway, Richard Houseal, Dale E.Jones, Alexei Krindatch, Richie Stanley and Richard H.Taylor. 2012. 2010 U.S.Religion Census: Religious Congregations & Membership Study. Association of Statisticians of American Religious Bodies. Jones, Dale E., et al. 2002. Congregations and Membership in the United States 2000. Nashville, TN: Glenmary Research Center. Graphs represent county-level data
Food Environment Statistics: Number of grocery stores : 74Knox County :
1.75 / 10,000 pop.Tennessee :
1.99 / 10,000 pop.
Number of supercenters and club stores : 5Here :
0.12 / 10,000 pop.State :
0.17 / 10,000 pop.
Number of convenience stores (no gas) : 58This county :
1.37 / 10,000 pop.State :
0.65 / 10,000 pop.
Number of convenience stores (with gas) : 162Knox County :
3.82 / 10,000 pop.Tennessee :
5.16 / 10,000 pop.
Number of full-service restaurants : 313This county :
7.39 / 10,000 pop.State :
6.56 / 10,000 pop.
Adult diabetes rate : Knox County :
12.0%Tennessee :
11.4%
Adult obesity rate : This county :
27.5%Tennessee :
30.2%
Low-income preschool obesity rate : Knox County :
13.7%State :
13.5%
Health and Nutrition:
Average overall health of teeth and gums : Farragut:
61.5%Tennessee:
46.1%
People feeling badly about themselves : Here:
18.1%Tennessee:
21.0%
People not drinking alcohol at all : Average hours sleeping at night : Overweight people : Farragut:
34.6%Tennessee:
33.9%
General health condition : This city:
65.3%State:
55.9%
Average condition of hearing : Farragut:
81.9%Tennessee:
79.1%
More about Health and Nutrition of Farragut, TN Residents
Local government employment and payroll (March 2022)
Function
Full-time employees
Monthly full-time payroll
Average yearly full-time wage
Part-time employees
Monthly part-time payroll
Streets and Highways
23 $74,306 $38,768 0 $0 Parks and Recreation
15 $52,887 $42,310 20 $7,286 Housing and Community Development (Local)
9 $39,215 $52,287 0 $0 Other Government Administration
5 $26,434 $63,442 2 $1,065 Financial Administration
3 $16,005 $64,020 0 $0 Other and Unallocable
2 $6,858 $41,148 3 $3,128 Judicial and Legal
0 $0 3 $515
Totals for Government
57 $215,704 $45,411 28 $11,994
Farragut government finances - Expenditure in 2017 (per resident):
Construction - Regular Highways: $1,938,000 ($78.09)
General - Other: $539,000 ($21.72)General Public Buildings: $45,000 ($1.81)Parks and Recreation: $32,000 ($1.29)
Farragut government finances - Revenue in 2017 (per resident):
Charges - Miscellaneous Commercial Activities: $385,000 ($15.51)
Parks and Recreation: $176,000 ($7.09)Miscellaneous - Rents: $89,000 ($3.59)
Interest Earnings: $44,000 ($1.77)State Intergovernmental - Highways: $715,000 ($28.81)
Other: $318,000 ($12.81)Tax - General Sales and Gross Receipts: $6,083,000 ($245.11)
Alcoholic Beverage Sales: $1,183,000 ($47.67)Alcoholic Beverage License: $8,000 ($0.32)Occupation and Business License - Other: $1,000 ($0.04)
Farragut government finances - Cash and Securities in 2017 (per resident):
Other Funds - Cash and Securities: $14,475,000 ($583.27)
8.03% of this county's 2021 resident taxpayers lived in other counties in 2020 ($70,106 average adjusted gross income )
Here:
8.03%Tennessee average:
8.49%
0.02% of residents moved from foreign countries ($141 average AGI )Knox County:
0.02%Tennessee average:
0.02%
Top counties from which taxpayers relocated into this county between 2020 and 2021:
Businesses in Farragut, TN
Name Count Name Count
AT&T 1 Kroger 2 Blockbuster 1 McDonald's 1 CVS 1 Nike 2 Cracker Barrel 1 Red Robin 1 DressBarn 1 Sephora 1 Dressbarn 1 Starbucks 1 FedEx 1 Vans 1 H&R Block 1 Walgreens 2 JCPenney 1 Wendy's 1 Kohl's 1
Strongest AM radio stations in Farragut:
WMTY (670 AM; daytime; 2 kW; FARRAGUT, TN; Owner: HORNE RADIO, LLC)
WKVL (850 AM; daytime; 50 kW; KNOXVILLE, TN; Owner: HORNE RADIO, LLC)
WQBB (1040 AM; daytime; 10 kW; POWELL, TN; Owner: JOURNAL BROADCAST CORPORATION)
WNOX (990 AM; 10 kW; KNOXVILLE, TN)
WATO (1290 AM; 5 kW; OAK RIDGE, TN)
WVLZ (1180 AM; daytime; 10 kW; KNOXVILLE, TN; Owner: KIRKLAND WIRELESS BROADCASTERS, INC.)
WRJZ (620 AM; 5 kW; KNOXVILLE, TN; Owner: TENNESSEE MEDIA ASSOCIATES, INC)
WLIL (730 AM; 1 kW; LENOIR CITY, TN; Owner: BP BROADCASTERS, LLC)
WBLC (1360 AM; 1 kW; LENOIR CITY, TN; Owner: THREE ANGELS BROADCASTING NETWORK, INC.)
WMEN (760 AM; daytime; 2 kW; KNOXVILLE, TN; Owner: THOMAS MOFFIT JR.)
WKXV (900 AM; 1 kW; KNOXVILLE, TN; Owner: RA-TEL BROADCASTING COMPANY, INC.)
WECO (940 AM; 5 kW; WARTBURG, TN; Owner: MORGAN COUNTY B/CASTING CO.)
WWAM (820 AM; daytime; 50 kW; JASPER, TN; Owner: SHELTON BROADCASTING SYSTEM)
Strongest FM radio stations in Farragut:
WNFZ (94.3 FM; OAK RIDGE, TN; Owner: JOHN W. PIRKLE)
WOKI-FM (100.3 FM; OAK RIDGE, TN; Owner: OAK RIDGE FM, INC.)
WUOT (91.9 FM; KNOXVILLE, TN; Owner: UNIVERSITY OF TENNESSEE)
WMYU (93.1 FM; KARNS, TN; Owner: JOURNAL BROADCAST CORPORATION)
WJXB-FM (97.5 FM; KNOXVILLE, TN; Owner: SOUTH CENTRAL COMMUNICATIONS CORP.)
WDVX (89.9 FM; CLINTON, TN; Owner: CUMBERLAND COMMUNITIES COMMUNI CORP.)
WKZX-FM (93.5 FM; LENOIR CITY, TN; Owner: BP BROADCASTERS, LLC)
WYLV (89.1 FM; ALCOA, TN; Owner: FOOTHILLS BROADCASTING, INC.)
WKVL-FM (105.3 FM; LOUDON, TN; Owner: HORNE RADIO, LLC)
WIVK-FM (107.7 FM; KNOXVILLE, TN; Owner: CITADEL BROADCASTING COMPANY)
WWST (102.1 FM; SEVIERVILLE, TN; Owner: JOURNAL BROADCAST CORPORATION)
WYIL-FM (98.7 FM; OLIVER SPRINGS, TN; Owner: CITADEL BROADCASTING COMPANY)
WTXM-FM (95.7 FM; MARYVILLE, TN; Owner: SOUTH CENTRAL COMMUNICATIONS CORP.)
WIMZ-FM (103.5 FM; KNOXVILLE, TN; Owner: SOUTH CENTRAL COMM., CORP.)
WNOX-FM (99.1 FM; LOUDON, TN; Owner: CITADEL BROADCASTING COMPANY)
WYFC (95.3 FM; CLINTON, TN; Owner: BIBLE BROADCASTING NETWORK, INC.)
WKHT (104.5 FM; KNOXVILLE, TN; Owner: JOURNAL BROADCAST CORPORATION)
WRMX-FM (106.7 FM; NORRIS, TN; Owner: SOUTH CENTRAL COMMUNICATIONS CORPORATION)
WWSR (105.7 FM; ROCKWOOD, TN; Owner: SOUTHERN MEDIA GROUP, INC.)
WCVP-FM (95.9 FM; ROBBINSVILLE, NC; Owner: CHEROKEE BROADCASTING COMPANY, INC.)
TV broadcast stations around Farragut:
W46DC (Channel 46; KNOXVILLE, TN; Owner: TRINITY BROADCASTING NETWORK)
WDTT-LP (Channel 38; LENOIR CITY, TN; Owner: WORD OF GOD FELLOWSHIP, INC.)
WVLT-TV (Channel 8; KNOXVILLE, TN; Owner: WVLT LICENSEE CORP.)
WKOP-TV (Channel 15; KNOXVILLE, TN; Owner: EAST TENNESSEE PUBLIC COMMUNICATIONS CORP.)
WBIR-TV (Channel 10; KNOXVILLE, TN; Owner: GANNETT PACIFIC CORPORATION)
WATE-TV (Channel 6; KNOXVILLE, TN; Owner: WATE, G.P.)
WTNZ (Channel 43; KNOXVILLE, TN; Owner: RAYCOM AMERICA, INC.)
WEEE-LP (Channel 32; KNOXVILLE, TN; Owner: TIGER EYE BROADCASTING CORPORATION)
WEZK-LP (Channel 28; KNOXVILLE, TN; Owner: SOUTH CENTRAL COMMUNICATIONS CORP.)
W50AB (Channel 50; HIAWASSEE, GA; Owner: GEORGIA PUBLIC TELECOMMUNICATIONS COMMISSION)
W50CG (Channel 50; KNOXVILLE, TN; Owner: THREE ANGELS BROADCASTING NETWORK, INC.)
W56CM (Channel 56; KNOXVILLE, TN; Owner: VENTANA TELEVISION, INC.)
WFEM-LP (Channel 12; HEISKELL, ETC., TN; Owner: H. EARL MARLAR)
National Bridge Inventory (NBI) Statistics 27 Number of bridges285ft / 87.0m Total length $14,926,000 Total costs457,756 Total average daily traffic82,844 Total average daily truck traffic
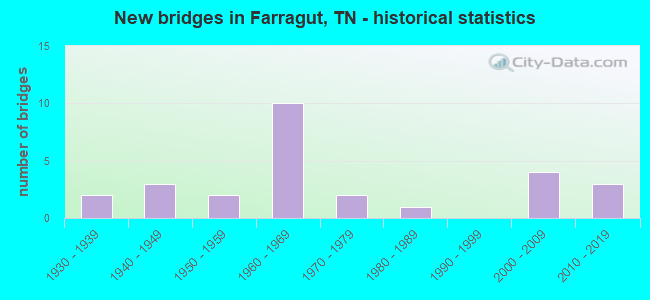
New bridges - historical statistics
2 1930-1939 3 1940-1949 2 1950-1959 10 1960-1969 2 1970-1979 1 1980-1989 4 2000-2009 3 2010-2019
See full National Bridge Inventory statistics for Farragut, TN
FCC Registered Antenna Towers: 29 (
See the full list of FCC Registered Antenna Towers in Farragut )
FCC Registered Private Land Mobile Towers: 1
11928 Black Rd (Lat: 35.904528 Lon: -84.187139), Type: Tower, Structure height: 79 m, Call Sign: KNNG365, Assigned Frequencies: 929.962 MHz, Grant Date: 12/12/2000, Expiration Date: 12/15/2010, Cancellation Date: 06/10/2002, Certifier: Paul H Kuzia, Registrant: Wilkinson Barker Knauer, LLP, 2300 N Street, N.W., Suite 700, Washington, DC 20037-1128, Phone: (202) 783-4141, Fax: (202) 783-5851, Email:
FCC Registered Broadcast Land Mobile Towers: 3
11501 Parkside Dr (Lat: 35.901944 Lon: -84.139722), Call Sign: WQFI556, Assigned Frequencies: 462.187 MHz, 462.262 MHz, 462.362 MHz, 462.412 MHz, 467.762 MHz, Grant Date: 07/25/2006, Expiration Date: 07/25/2016, Cancellation Date: 09/24/2016, Certifier: Brian Sword, Registrant: Advanced Wireless Communications, 20809 Kensington Blvd., Lakeville, MN 55044, Phone: (952) 469-5400, Email:
Lat: 35.898139 Lon: -84.167806, Call Sign: WQJS811, Assigned Frequencies: 461.587 MHz, 467.225 MHz, 461.125 MHz, 468.862 MHz, 466.437 MHz, Grant Date: 10/24/2018, Expiration Date: 12/17/2028, Certifier: Luann Perryman, Registrant: Bearcom Operating LLC, ., Dallas, TX 75355-9001, Phone: (800) 458-9887, Email:
Lat: 35.873944 Lon: -84.190361, Call Sign: WQTP781, Assigned Frequencies: 461.862 MHz, 466.862 MHz, Grant Date: 03/20/2014, Expiration Date: 03/20/2024, Certifier: Scott Severance, Registrant: Cara Enterprises Inc, Las Vegas, NV 89140-0124, Phone: (702) 838-9728, Fax: (702) 363-4607, Email:
FCC Registered Microwave Towers: 5
Campbell Station, 11936 Black Road (Lat: 35.904778 Lon: -84.188333), Type: Tower, Structure height: 77.1 m, Overall height: 82.3 m, Call Sign: WQIK507, Assigned Frequencies: 11485.0 MHz, 11445.0 MHz, 6197.24 MHz, Grant Date: 03/04/2008, Expiration Date: 03/04/2018, Cancellation Date: 09/04/2009, Certifier: William Chastain, Registrant: Radio Dynamics Corporation, 774 Mays Blvd., #10-465, Silver Spring, MD 20914, Phone: (301) 493-5171, Fax: (301) 576-4553, Email:
KX23XC003, 731 Fretz Rd (Lat: 35.894778 Lon: -84.188556), Type: Mtower, Structure height: 45.7 m, Call Sign: WQRP753, Assigned Frequencies: 23125.0 MHz, 23125.0 MHz, 23125.0 MHz, 23125.0 MHz, 23125.0 MHz, 23125.0 MHz, Grant Date: 07/02/2013, Expiration Date: 07/02/2023, Cancellation Date: 05/09/2023, Certifier: Jenny Knopf, Registrant: T-Mobile Usa, Inc., 12920 Se 38th Street, Bellevue, WA 98006, Phone: (425) 383-8401, Email:
KNTYS00133A, 731 Fretz Rd (Lat: 35.894667 Lon: -84.188528), Type: Mtower, Structure height: 48.8 m, Call Sign: WRTQ225, Assigned Frequencies: 11245.0 MHz, 11245.0 MHz, 11245.0 MHz, 11245.0 MHz, 11245.0 MHz, 11245.0 MHz, 11245.0 MHz, 11245.0 MHz, 11245.0 MHz, 11245.0 MHz, 11245.0 MHz, 11245.0 MHz, Grant Date: 07/12/2022, Expiration Date: 07/12/2032, Certifier: Alison A Minea, Registrant: Dish Wireless L.L.C., 9601 S Meridan Blvd, Englewood, CO 80112, Phone: (202) 463-3709, Email:
KNTYS00430A, 521 Virtue Road (Lat: 35.857111 Lon: -84.179611), Type: Mtower, Structure height: 55 m, Overall height: 55.2 m, Call Sign: WRTQ537, Assigned Frequencies: 11565.0 MHz, 11565.0 MHz, 11565.0 MHz, 11565.0 MHz, 11565.0 MHz, 11565.0 MHz, 11565.0 MHz, 11565.0 MHz, 11565.0 MHz, 11565.0 MHz, 11565.0 MHz, 11565.0 MHz, Grant Date: 07/13/2022, Expiration Date: 07/13/2032, Certifier: Alison A Minea, Registrant: Dish Wireless L.L.C., 9601 S Meridan Blvd, Englewood, CO 80112, Phone: (202) 463-3709, Email:
Farragut Hills Blvd. (Lat: 35.885889 Lon: -84.137389), Overall height: 42.7 m, Call Sign: WGX208, Licensee ID: L00156377, Assigned Frequencies: 947.375 MHz, Grant Date: 03/21/1988, Expiration Date: 08/01/2028, Registrant: Inc. Midwest Communications, 904 Grand Ave., Wausau, WI 54403, Phone: (715) 842-1437, Email:
FCC Registered Amateur Radio Licenses: 30 (
See the full list of FCC Registered Amateur Radio Licenses in Farragut )
FAA Registered Aircraft: 3
Aircraft: CIRRUS DESIGN CORP SR22 (Category: Land, Seats: 4, Weight: Up to 12,499 Pounds), Engine: CONT MOTOR IO-550-N (310 HP) (Reciprocating)N-Number: 274SR, N274SR, N-274SR, Serial Number: 2732, Year manufactured: 2007, Airworthiness Date: 10/05/2007, Certificate Issue Date: 11/05/2016Registrant (LLC): Tn Sr22 LLC, 12215 S Fox Den Dr, Farragut, TN 37934Aircraft: BEECH A36 (Category: Land, Seats: 6, Weight: Up to 12,499 Pounds, Speed: 138 mph), Engine: CONT MOTOR IO 520 SERIES (285 HP) (Reciprocating)N-Number: 37091, N37091, N-37091, Serial Number: E-1761, Year manufactured: 1980, Airworthiness Date: 09/22/1980, Certificate Issue Date: 03/23/2020Registrant (LLC): Aeroboys LLC, 421 Dixon Rd, Farragut, TN 37934Aircraft: CIRRUS DESIGN CORP SR22 (Category: Land, Seats: 4, Weight: Up to 12,499 Pounds), Engine: CONT MOTOR IO-550 SERIES (300 HP) (Reciprocating)N-Number: 75VK, N75VK, N-75VK, Serial Number: 0153, Year manufactured: 2002, Airworthiness Date: 02/12/2002, Certificate Issue Date: 04/25/2008Registrant (Corporation): Tn Sr22 LLC, 12215 S Fox Den Dr, Farragut, TN 37934
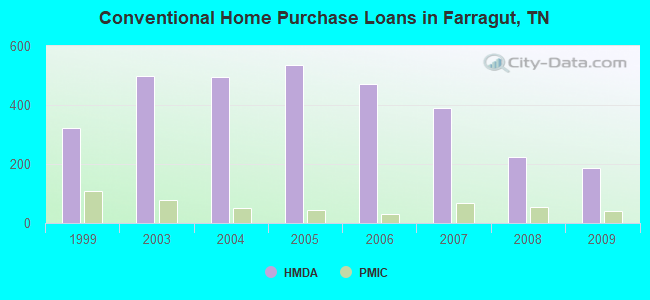
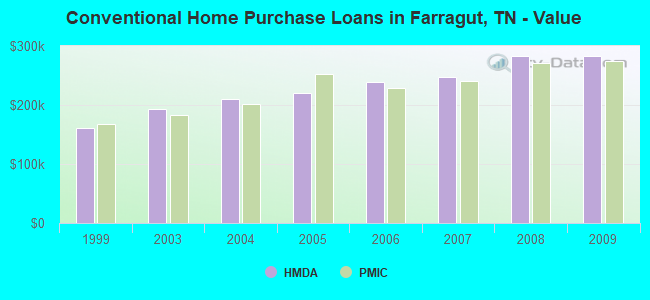
Home Mortgage Disclosure Act Aggregated Statistics For Year 2009(Based on 4 partial tracts) A) FHA, FSA/RHS & VA B) Conventional C) Refinancings D) Home Improvement Loans F) Non-occupant Loans on G) Loans On Manufactured Number Average Value Number Average Value Number Average Value Number Average Value Number Average Value Number Average Value
LOANS ORIGINATED 43 $208,835 187 $283,268 705 $238,704 26 $133,017 26 $214,418 1 $196,310 APPLICATIONS APPROVED, NOT ACCEPTED 4 $189,595 18 $342,608 53 $265,479 4 $95,995 2 $153,505 0 $0 APPLICATIONS DENIED 6 $233,758 12 $254,183 109 $241,585 6 $127,187 4 $213,455 1 $82,200 APPLICATIONS WITHDRAWN 3 $267,483 24 $285,240 91 $251,436 4 $152,128 3 $122,617 0 $0 FILES CLOSED FOR INCOMPLETENESS 0 $0 5 $248,620 35 $261,211 4 $49,138 0 $0 0 $0
Aggregated Statistics For Year 2008(Based on 4 partial tracts) A) FHA, FSA/RHS & VA B) Conventional C) Refinancings D) Home Improvement Loans F) Non-occupant Loans on Number Average Value Number Average Value Number Average Value Number Average Value Number Average Value
LOANS ORIGINATED 27 $222,976 225 $283,451 281 $237,874 35 $98,906 19 $239,971 APPLICATIONS APPROVED, NOT ACCEPTED 2 $208,015 27 $239,066 44 $254,046 3 $91,243 4 $86,312 APPLICATIONS DENIED 4 $213,762 19 $281,101 103 $250,346 9 $110,199 4 $197,855 APPLICATIONS WITHDRAWN 3 $198,877 23 $290,058 65 $239,485 3 $132,630 2 $100,405 FILES CLOSED FOR INCOMPLETENESS 0 $0 7 $381,003 17 $255,736 0 $0 2 $122,005
Aggregated Statistics For Year 2007(Based on 4 partial tracts) A) FHA, FSA/RHS & VA B) Conventional C) Refinancings D) Home Improvement Loans F) Non-occupant Loans on G) Loans On Manufactured Number Average Value Number Average Value Number Average Value Number Average Value Number Average Value Number Average Value
LOANS ORIGINATED 10 $232,715 389 $247,800 286 $219,431 56 $82,039 43 $193,586 1 $44,750 APPLICATIONS APPROVED, NOT ACCEPTED 0 $0 35 $261,847 38 $228,607 9 $93,000 3 $233,517 1 $120,950 APPLICATIONS DENIED 3 $153,320 34 $232,475 106 $235,645 13 $142,425 4 $236,738 2 $30,050 APPLICATIONS WITHDRAWN 2 $216,855 27 $232,460 66 $228,558 11 $135,522 1 $208,810 0 $0 FILES CLOSED FOR INCOMPLETENESS 0 $0 9 $243,028 20 $270,538 2 $159,310 0 $0 0 $0
Aggregated Statistics For Year 2006(Based on 4 partial tracts) A) FHA, FSA/RHS & VA B) Conventional C) Refinancings D) Home Improvement Loans E) Loans on Dwellings For 5+ Families F) Non-occupant Loans on G) Loans On Manufactured Number Average Value Number Average Value Number Average Value Number Average Value Number Average Value Number Average Value Number Average Value
LOANS ORIGINATED 7 $201,319 470 $238,904 309 $213,888 38 $90,038 1 $1,335,870 65 $239,278 2 $57,855 APPLICATIONS APPROVED, NOT ACCEPTED 1 $450,350 51 $238,399 71 $203,575 5 $92,728 0 $0 12 $185,035 5 $60,332 APPLICATIONS DENIED 0 $0 45 $181,124 92 $208,430 14 $77,587 0 $0 12 $164,222 7 $52,667 APPLICATIONS WITHDRAWN 1 $249,410 30 $229,586 88 $190,298 4 $103,052 0 $0 8 $217,864 0 $0 FILES CLOSED FOR INCOMPLETENESS 0 $0 7 $214,137 22 $216,626 2 $351,165 0 $0 2 $234,640 0 $0
Aggregated Statistics For Year 2005(Based on 4 partial tracts) A) FHA, FSA/RHS & VA B) Conventional C) Refinancings D) Home Improvement Loans F) Non-occupant Loans on G) Loans On Manufactured Number Average Value Number Average Value Number Average Value Number Average Value Number Average Value Number Average Value
LOANS ORIGINATED 8 $177,028 535 $221,153 366 $192,152 38 $96,499 59 $169,801 1 $44,380 APPLICATIONS APPROVED, NOT ACCEPTED 1 $80,300 50 $221,625 53 $163,580 8 $81,828 7 $179,669 3 $44,337 APPLICATIONS DENIED 1 $195,800 41 $138,457 91 $167,934 17 $42,722 3 $157,527 9 $39,793 APPLICATIONS WITHDRAWN 0 $0 31 $186,764 119 $200,032 13 $254,550 5 $105,542 0 $0 FILES CLOSED FOR INCOMPLETENESS 1 $216,450 13 $230,704 21 $201,260 3 $26,580 0 $0 0 $0
Aggregated Statistics For Year 2004(Based on 4 partial tracts) A) FHA, FSA/RHS & VA B) Conventional C) Refinancings D) Home Improvement Loans F) Non-occupant Loans on G) Loans On Manufactured Number Average Value Number Average Value Number Average Value Number Average Value Number Average Value Number Average Value
LOANS ORIGINATED 16 $143,594 494 $210,205 382 $188,604 41 $79,166 39 $122,291 1 $13,600 APPLICATIONS APPROVED, NOT ACCEPTED 2 $217,585 41 $199,528 62 $161,728 4 $41,010 3 $94,557 4 $44,772 APPLICATIONS DENIED 2 $199,780 43 $165,405 97 $164,445 16 $41,919 4 $100,170 7 $57,721 APPLICATIONS WITHDRAWN 3 $129,917 35 $185,433 109 $178,970 4 $63,832 4 $171,540 0 $0 FILES CLOSED FOR INCOMPLETENESS 0 $0 7 $188,969 11 $175,089 2 $48,315 2 $130,410 0 $0
Aggregated Statistics For Year 2003(Based on 4 partial tracts) A) FHA, FSA/RHS & VA B) Conventional C) Refinancings D) Home Improvement Loans E) Loans on Dwellings For 5+ Families F) Non-occupant Loans on Number Average Value Number Average Value Number Average Value Number Average Value Number Average Value Number Average Value
LOANS ORIGINATED 24 $150,186 497 $193,566 1,126 $171,178 30 $54,401 1 $198,870 48 $120,342 APPLICATIONS APPROVED, NOT ACCEPTED 2 $96,770 22 $153,212 105 $161,649 7 $21,300 0 $0 4 $145,435 APPLICATIONS DENIED 0 $0 27 $159,173 128 $153,583 9 $48,503 0 $0 6 $61,982 APPLICATIONS WITHDRAWN 5 $155,202 45 $205,297 133 $176,593 4 $92,492 0 $0 4 $161,592 FILES CLOSED FOR INCOMPLETENESS 0 $0 6 $221,423 21 $154,350 0 $0 0 $0 1 $60,840
Aggregated Statistics For Year 1999(Based on 2 partial tracts) A) FHA, FSA/RHS & VA B) Conventional C) Refinancings D) Home Improvement Loans F) Non-occupant Loans on Number Average Value Number Average Value Number Average Value Number Average Value Number Average Value
LOANS ORIGINATED 49 $107,982 321 $160,971 187 $135,047 46 $21,745 19 $88,202 APPLICATIONS APPROVED, NOT ACCEPTED 2 $110,775 22 $122,818 26 $128,757 9 $27,382 1 $100,280 APPLICATIONS DENIED 2 $113,330 48 $79,253 56 $154,886 16 $27,687 2 $105,855 APPLICATIONS WITHDRAWN 2 $91,585 31 $161,101 50 $140,143 5 $88,714 3 $141,923 FILES CLOSED FOR INCOMPLETENESS 0 $0 5 $113,192 12 $172,240 0 $0 0 $0
Detailed HMDA statistics for the following Tracts:
0058.03
, 0058.04 , 0058.05 , 0058.06
Private Mortgage Insurance Companies Aggregated Statistics For Year 2009(Based on 4 partial tracts) A) Conventional B) Refinancings Number Average Value Number Average Value
LOANS ORIGINATED 40 $275,122 24 $287,332 APPLICATIONS APPROVED, NOT ACCEPTED 5 $305,664 8 $311,245 APPLICATIONS DENIED 5 $287,772 4 $291,385 APPLICATIONS WITHDRAWN 3 $367,877 0 $0 FILES CLOSED FOR INCOMPLETENESS 1 $421,870 0 $0
Aggregated Statistics For Year 2008(Based on 4 partial tracts) A) Conventional B) Refinancings C) Non-occupant Loans on Number Average Value Number Average Value Number Average Value
LOANS ORIGINATED 55 $270,699 20 $271,334 2 $209,845 APPLICATIONS APPROVED, NOT ACCEPTED 10 $360,254 7 $264,561 1 $168,790 APPLICATIONS DENIED 2 $310,985 0 $0 0 $0 APPLICATIONS WITHDRAWN 1 $331,870 2 $182,595 0 $0 FILES CLOSED FOR INCOMPLETENESS 1 $1,540,290 1 $191,840 0 $0
Aggregated Statistics For Year 2007(Based on 4 partial tracts) A) Conventional B) Refinancings C) Non-occupant Loans on Number Average Value Number Average Value Number Average Value
LOANS ORIGINATED 68 $240,537 33 $249,347 4 $193,582 APPLICATIONS APPROVED, NOT ACCEPTED 5 $239,436 5 $232,236 0 $0 APPLICATIONS DENIED 1 $99,160 0 $0 0 $0 APPLICATIONS WITHDRAWN 3 $303,193 0 $0 0 $0 FILES CLOSED FOR INCOMPLETENESS 0 $0 0 $0 0 $0
Aggregated Statistics For Year 2006(Based on 4 partial tracts) A) Conventional B) Refinancings C) Non-occupant Loans on Number Average Value Number Average Value Number Average Value
LOANS ORIGINATED 31 $229,552 19 $244,353 3 $163,180 APPLICATIONS APPROVED, NOT ACCEPTED 7 $288,490 6 $261,578 1 $204,780 APPLICATIONS DENIED 1 $847,190 0 $0 0 $0 APPLICATIONS WITHDRAWN 0 $0 0 $0 0 $0 FILES CLOSED FOR INCOMPLETENESS 0 $0 0 $0 0 $0
Aggregated Statistics For Year 2005(Based on 4 partial tracts) A) Conventional B) Refinancings C) Non-occupant Loans on Number Average Value Number Average Value Number Average Value
LOANS ORIGINATED 44 $252,769 16 $200,363 6 $178,480 APPLICATIONS APPROVED, NOT ACCEPTED 5 $191,710 7 $219,137 0 $0 APPLICATIONS DENIED 1 $213,710 0 $0 0 $0 APPLICATIONS WITHDRAWN 1 $250,190 1 $104,780 0 $0 FILES CLOSED FOR INCOMPLETENESS 0 $0 1 $57,290 0 $0
Aggregated Statistics For Year 2004(Based on 4 partial tracts) A) Conventional B) Refinancings C) Non-occupant Loans on Number Average Value Number Average Value Number Average Value
LOANS ORIGINATED 52 $201,226 27 $219,287 4 $142,968 APPLICATIONS APPROVED, NOT ACCEPTED 10 $246,819 11 $187,577 1 $88,140 APPLICATIONS DENIED 0 $0 0 $0 0 $0 APPLICATIONS WITHDRAWN 2 $115,165 4 $183,988 0 $0 FILES CLOSED FOR INCOMPLETENESS 0 $0 0 $0 0 $0
Aggregated Statistics For Year 2003(Based on 4 partial tracts) A) Conventional B) Refinancings C) Non-occupant Loans on Number Average Value Number Average Value Number Average Value
LOANS ORIGINATED 79 $182,880 83 $186,632 5 $122,886 APPLICATIONS APPROVED, NOT ACCEPTED 12 $161,879 14 $174,204 1 $59,960 APPLICATIONS DENIED 0 $0 0 $0 0 $0 APPLICATIONS WITHDRAWN 3 $257,973 3 $172,960 1 $36,910 FILES CLOSED FOR INCOMPLETENESS 1 $70,520 0 $0 1 $70,520
Aggregated Statistics For Year 1999(Based on 2 partial tracts) A) Conventional B) Refinancings C) Non-occupant Loans on Number Average Value Number Average Value Number Average Value
LOANS ORIGINATED 109 $167,560 15 $162,684 2 $90,115 APPLICATIONS APPROVED, NOT ACCEPTED 7 $167,893 4 $168,555 0 $0 APPLICATIONS DENIED 2 $154,940 0 $0 0 $0 APPLICATIONS WITHDRAWN 0 $0 0 $0 0 $0 FILES CLOSED FOR INCOMPLETENESS 1 $74,270 0 $0 0 $0
Detailed PMIC statistics for the following Tracts:
0058.03
, 0058.04 , 0058.05 , 0058.06 Farragut compared to Tennessee state average:
Median household income above state average. Median house value above state average. Unemployed percentage significantly below state average. Black race population percentage significantly below state average. Hispanic race population percentage below state average. Median age above state average. Foreign-born population percentage above state average. Renting percentage significantly below state average. Length of stay since moving in significantly above state average. Number of rooms per house significantly above state average. House age below state average. Percentage of population with a bachelor's degree or higher significantly above state average.
Top Patent Applicants
Timothy J. Mcintyre (4)
Georges A. Guiochon (3)
Larry R. Baylor (2)
James A. Mullens (2)
Jonathan S. Morrell (2)
Roger Kisner (1)
Timothy Mcintyre (1)
Kai Li (1)
Douglas A. Mann (1)
Ken Campbell (1)
Total of 19 patent applications in 2008-2024.


 Recent articles from our blog. Our writers, many of them Ph.D. graduates or candidates, create easy-to-read articles on a wide variety of topics.


 (14.5 miles