Florissant, Missouri Submit your own pictures of this city and show them to the world
OSM Map
General Map
Google Map
MSN Map
OSM Map
General Map
Google Map
MSN Map
OSM Map
General Map
Google Map
MSN Map
OSM Map
General Map
Google Map
MSN Map
Please wait while loading the map...
Population in 2022: 51,506 (100% urban, 0% rural). Population change since 2000: +2.0%Males: 24,747 Females: 26,759
March 2022 cost of living index in Florissant: 95.6 (near average, U.S. average is 100) Percentage of residents living in poverty in 2022: 9.2%for White Non-Hispanic residents , 12.2% for Black residents , 4.5% for Hispanic or Latino residents , 100.0% for Native Hawaiian and other Pacific Islander residents , 5.0% for other race residents , 11.9% for two or more races residents )
Profiles of local businesses
Business Search - 14 Million verified businesses
Data:
Median household income ($)
Median household income (% change since 2000)
Household income diversity
Ratio of average income to average house value (%)
Ratio of average income to average rent
Median household income ($) - White
Median household income ($) - Black or African American
Median household income ($) - Asian
Median household income ($) - Hispanic or Latino
Median household income ($) - American Indian and Alaska Native
Median household income ($) - Multirace
Median household income ($) - Other Race
Median household income for houses/condos with a mortgage ($)
Median household income for apartments without a mortgage ($)
Races - White alone (%)
Races - White alone (% change since 2000)
Races - Black alone (%)
Races - Black alone (% change since 2000)
Races - American Indian alone (%)
Races - American Indian alone (% change since 2000)
Races - Asian alone (%)
Races - Asian alone (% change since 2000)
Races - Hispanic (%)
Races - Hispanic (% change since 2000)
Races - Native Hawaiian and Other Pacific Islander alone (%)
Races - Native Hawaiian and Other Pacific Islander alone (% change since 2000)
Races - Two or more races (%)
Races - Two or more races (% change since 2000)
Races - Other race alone (%)
Races - Other race alone (% change since 2000)
Racial diversity
Unemployment (%)
Unemployment (% change since 2000)
Unemployment (%) - White
Unemployment (%) - Black or African American
Unemployment (%) - Asian
Unemployment (%) - Hispanic or Latino
Unemployment (%) - American Indian and Alaska Native
Unemployment (%) - Multirace
Unemployment (%) - Other Race
Population density (people per square mile)
Population - Males (%)
Population - Females (%)
Population - Males (%) - White
Population - Males (%) - Black or African American
Population - Males (%) - Asian
Population - Males (%) - Hispanic or Latino
Population - Males (%) - American Indian and Alaska Native
Population - Males (%) - Multirace
Population - Males (%) - Other Race
Population - Females (%) - White
Population - Females (%) - Black or African American
Population - Females (%) - Asian
Population - Females (%) - Hispanic or Latino
Population - Females (%) - American Indian and Alaska Native
Population - Females (%) - Multirace
Population - Females (%) - Other Race
Coronavirus confirmed cases (Apr 23, 2024)
Deaths caused by coronavirus (Apr 23, 2024)
Coronavirus confirmed cases (per 100k population) (Apr 23, 2024)
Deaths caused by coronavirus (per 100k population) (Apr 23, 2024)
Daily increase in number of cases (Apr 23, 2024)
Weekly increase in number of cases (Apr 23, 2024)
Cases doubled (in days) (Apr 23, 2024)
Hospitalized patients (Apr 18, 2022)
Negative test results (Apr 18, 2022)
Total test results (Apr 18, 2022)
COVID Vaccine doses distributed (per 100k population) (Sep 19, 2023)
COVID Vaccine doses administered (per 100k population) (Sep 19, 2023)
COVID Vaccine doses distributed (Sep 19, 2023)
COVID Vaccine doses administered (Sep 19, 2023)
Likely homosexual households (%)
Likely homosexual households (% change since 2000)
Likely homosexual households - Lesbian couples (%)
Likely homosexual households - Lesbian couples (% change since 2000)
Likely homosexual households - Gay men (%)
Likely homosexual households - Gay men (% change since 2000)
Cost of living index
Median gross rent ($)
Median contract rent ($)
Median monthly housing costs ($)
Median house or condo value ($)
Median house or condo value ($ change since 2000)
Mean house or condo value by units in structure - 1, detached ($)
Mean house or condo value by units in structure - 1, attached ($)
Mean house or condo value by units in structure - 2 ($)
Mean house or condo value by units in structure by units in structure - 3 or 4 ($)
Mean house or condo value by units in structure - 5 or more ($)
Mean house or condo value by units in structure - Boat, RV, van, etc. ($)
Mean house or condo value by units in structure - Mobile home ($)
Median house or condo value ($) - White
Median house or condo value ($) - Black or African American
Median house or condo value ($) - Asian
Median house or condo value ($) - Hispanic or Latino
Median house or condo value ($) - American Indian and Alaska Native
Median house or condo value ($) - Multirace
Median house or condo value ($) - Other Race
Median resident age
Resident age diversity
Median resident age - Males
Median resident age - Females
Median resident age - White
Median resident age - Black or African American
Median resident age - Asian
Median resident age - Hispanic or Latino
Median resident age - American Indian and Alaska Native
Median resident age - Multirace
Median resident age - Other Race
Median resident age - Males - White
Median resident age - Males - Black or African American
Median resident age - Males - Asian
Median resident age - Males - Hispanic or Latino
Median resident age - Males - American Indian and Alaska Native
Median resident age - Males - Multirace
Median resident age - Males - Other Race
Median resident age - Females - White
Median resident age - Females - Black or African American
Median resident age - Females - Asian
Median resident age - Females - Hispanic or Latino
Median resident age - Females - American Indian and Alaska Native
Median resident age - Females - Multirace
Median resident age - Females - Other Race
Commute - mean travel time to work (minutes)
Travel time to work - Less than 5 minutes (%)
Travel time to work - Less than 5 minutes (% change since 2000)
Travel time to work - 5 to 9 minutes (%)
Travel time to work - 5 to 9 minutes (% change since 2000)
Travel time to work - 10 to 19 minutes (%)
Travel time to work - 10 to 19 minutes (% change since 2000)
Travel time to work - 20 to 29 minutes (%)
Travel time to work - 20 to 29 minutes (% change since 2000)
Travel time to work - 30 to 39 minutes (%)
Travel time to work - 30 to 39 minutes (% change since 2000)
Travel time to work - 40 to 59 minutes (%)
Travel time to work - 40 to 59 minutes (% change since 2000)
Travel time to work - 60 to 89 minutes (%)
Travel time to work - 60 to 89 minutes (% change since 2000)
Travel time to work - 90 or more minutes (%)
Travel time to work - 90 or more minutes (% change since 2000)
Marital status - Never married (%)
Marital status - Now married (%)
Marital status - Separated (%)
Marital status - Widowed (%)
Marital status - Divorced (%)
Median family income ($)
Median family income (% change since 2000)
Median non-family income ($)
Median non-family income (% change since 2000)
Median per capita income ($)
Median per capita income (% change since 2000)
Median family income ($) - White
Median family income ($) - Black or African American
Median family income ($) - Asian
Median family income ($) - Hispanic or Latino
Median family income ($) - American Indian and Alaska Native
Median family income ($) - Multirace
Median family income ($) - Other Race
Median year house/condo built
Median year apartment built
Year house built - Built 2005 or later (%)
Year house built - Built 2000 to 2004 (%)
Year house built - Built 1990 to 1999 (%)
Year house built - Built 1980 to 1989 (%)
Year house built - Built 1970 to 1979 (%)
Year house built - Built 1960 to 1969 (%)
Year house built - Built 1950 to 1959 (%)
Year house built - Built 1940 to 1949 (%)
Year house built - Built 1939 or earlier (%)
Average household size
Household density (households per square mile)
Average household size - White
Average household size - Black or African American
Average household size - Asian
Average household size - Hispanic or Latino
Average household size - American Indian and Alaska Native
Average household size - Multirace
Average household size - Other Race
Occupied housing units (%)
Vacant housing units (%)
Owner occupied housing units (%)
Renter occupied housing units (%)
Vacancy status - For rent (%)
Vacancy status - For sale only (%)
Vacancy status - Rented or sold, not occupied (%)
Vacancy status - For seasonal, recreational, or occasional use (%)
Vacancy status - For migrant workers (%)
Vacancy status - Other vacant (%)
Residents with income below the poverty level (%)
Residents with income below 50% of the poverty level (%)
Children below poverty level (%)
Poor families by family type - Married-couple family (%)
Poor families by family type - Male, no wife present (%)
Poor families by family type - Female, no husband present (%)
Poverty status for native-born residents (%)
Poverty status for foreign-born residents (%)
Poverty among high school graduates not in families (%)
Poverty among people who did not graduate high school not in families (%)
Residents with income below the poverty level (%) - White
Residents with income below the poverty level (%) - Black or African American
Residents with income below the poverty level (%) - Asian
Residents with income below the poverty level (%) - Hispanic or Latino
Residents with income below the poverty level (%) - American Indian and Alaska Native
Residents with income below the poverty level (%) - Multirace
Residents with income below the poverty level (%) - Other Race
Air pollution - Air Quality Index (AQI)
Air pollution - CO
Air pollution - NO2
Air pollution - SO2
Air pollution - Ozone
Air pollution - PM10
Air pollution - PM25
Air pollution - Pb
Crime - Murders per 100,000 population
Crime - Rapes per 100,000 population
Crime - Robberies per 100,000 population
Crime - Assaults per 100,000 population
Crime - Burglaries per 100,000 population
Crime - Thefts per 100,000 population
Crime - Auto thefts per 100,000 population
Crime - Arson per 100,000 population
Crime - City-data.com crime index
Crime - Violent crime index
Crime - Property crime index
Crime - Murders per 100,000 population (5 year average)
Crime - Rapes per 100,000 population (5 year average)
Crime - Robberies per 100,000 population (5 year average)
Crime - Assaults per 100,000 population (5 year average)
Crime - Burglaries per 100,000 population (5 year average)
Crime - Thefts per 100,000 population (5 year average)
Crime - Auto thefts per 100,000 population (5 year average)
Crime - Arson per 100,000 population (5 year average)
Crime - City-data.com crime index (5 year average)
Crime - Violent crime index (5 year average)
Crime - Property crime index (5 year average)
1996 Presidential Elections Results (%) - Democratic Party (Clinton)
1996 Presidential Elections Results (%) - Republican Party (Dole)
1996 Presidential Elections Results (%) - Other
2000 Presidential Elections Results (%) - Democratic Party (Gore)
2000 Presidential Elections Results (%) - Republican Party (Bush)
2000 Presidential Elections Results (%) - Other
2004 Presidential Elections Results (%) - Democratic Party (Kerry)
2004 Presidential Elections Results (%) - Republican Party (Bush)
2004 Presidential Elections Results (%) - Other
2008 Presidential Elections Results (%) - Democratic Party (Obama)
2008 Presidential Elections Results (%) - Republican Party (McCain)
2008 Presidential Elections Results (%) - Other
2012 Presidential Elections Results (%) - Democratic Party (Obama)
2012 Presidential Elections Results (%) - Republican Party (Romney)
2012 Presidential Elections Results (%) - Other
2016 Presidential Elections Results (%) - Democratic Party (Clinton)
2016 Presidential Elections Results (%) - Republican Party (Trump)
2016 Presidential Elections Results (%) - Other
2020 Presidential Elections Results (%) - Democratic Party (Biden)
2020 Presidential Elections Results (%) - Republican Party (Trump)
2020 Presidential Elections Results (%) - Other
Ancestries Reported - Arab (%)
Ancestries Reported - Czech (%)
Ancestries Reported - Danish (%)
Ancestries Reported - Dutch (%)
Ancestries Reported - English (%)
Ancestries Reported - French (%)
Ancestries Reported - French Canadian (%)
Ancestries Reported - German (%)
Ancestries Reported - Greek (%)
Ancestries Reported - Hungarian (%)
Ancestries Reported - Irish (%)
Ancestries Reported - Italian (%)
Ancestries Reported - Lithuanian (%)
Ancestries Reported - Norwegian (%)
Ancestries Reported - Polish (%)
Ancestries Reported - Portuguese (%)
Ancestries Reported - Russian (%)
Ancestries Reported - Scotch-Irish (%)
Ancestries Reported - Scottish (%)
Ancestries Reported - Slovak (%)
Ancestries Reported - Subsaharan African (%)
Ancestries Reported - Swedish (%)
Ancestries Reported - Swiss (%)
Ancestries Reported - Ukrainian (%)
Ancestries Reported - United States (%)
Ancestries Reported - Welsh (%)
Ancestries Reported - West Indian (%)
Ancestries Reported - Other (%)
Educational Attainment - No schooling completed (%)
Educational Attainment - Less than high school (%)
Educational Attainment - High school or equivalent (%)
Educational Attainment - Less than 1 year of college (%)
Educational Attainment - 1 or more years of college (%)
Educational Attainment - Associate degree (%)
Educational Attainment - Bachelor's degree (%)
Educational Attainment - Master's degree (%)
Educational Attainment - Professional school degree (%)
Educational Attainment - Doctorate degree (%)
School Enrollment - Nursery, preschool (%)
School Enrollment - Kindergarten (%)
School Enrollment - Grade 1 to 4 (%)
School Enrollment - Grade 5 to 8 (%)
School Enrollment - Grade 9 to 12 (%)
School Enrollment - College undergrad (%)
School Enrollment - Graduate or professional (%)
School Enrollment - Not enrolled in school (%)
School enrollment - Public schools (%)
School enrollment - Private schools (%)
School enrollment - Not enrolled (%)
Median number of rooms in houses and condos
Median number of rooms in apartments
Housing units lacking complete plumbing facilities (%)
Housing units lacking complete kitchen facilities (%)
Density of houses
Urban houses (%)
Rural houses (%)
Households with people 60 years and over (%)
Households with people 65 years and over (%)
Households with people 75 years and over (%)
Households with one or more nonrelatives (%)
Households with no nonrelatives (%)
Population in households (%)
Family households (%)
Nonfamily households (%)
Population in families (%)
Family households with own children (%)
Median number of bedrooms in owner occupied houses
Mean number of bedrooms in owner occupied houses
Median number of bedrooms in renter occupied houses
Mean number of bedrooms in renter occupied houses
Median number of vehichles in owner occupied houses
Mean number of vehichles in owner occupied houses
Median number of vehichles in renter occupied houses
Mean number of vehichles in renter occupied houses
Mortgage status - with mortgage (%)
Mortgage status - with second mortgage (%)
Mortgage status - with home equity loan (%)
Mortgage status - with both second mortgage and home equity loan (%)
Mortgage status - without a mortgage (%)
Average family size
Average family size - White
Average family size - Black or African American
Average family size - Asian
Average family size - Hispanic or Latino
Average family size - American Indian and Alaska Native
Average family size - Multirace
Average family size - Other Race
Geographical mobility - Same house 1 year ago (%)
Geographical mobility - Moved within same county (%)
Geographical mobility - Moved from different county within same state (%)
Geographical mobility - Moved from different state (%)
Geographical mobility - Moved from abroad (%)
Place of birth - Born in state of residence (%)
Place of birth - Born in other state (%)
Place of birth - Native, outside of US (%)
Place of birth - Foreign born (%)
Housing units in structures - 1, detached (%)
Housing units in structures - 1, attached (%)
Housing units in structures - 2 (%)
Housing units in structures - 3 or 4 (%)
Housing units in structures - 5 to 9 (%)
Housing units in structures - 10 to 19 (%)
Housing units in structures - 20 to 49 (%)
Housing units in structures - 50 or more (%)
Housing units in structures - Mobile home (%)
Housing units in structures - Boat, RV, van, etc. (%)
House/condo owner moved in on average (years ago)
Renter moved in on average (years ago)
Year householder moved into unit - Moved in 1999 to March 2000 (%)
Year householder moved into unit - Moved in 1995 to 1998 (%)
Year householder moved into unit - Moved in 1990 to 1994 (%)
Year householder moved into unit - Moved in 1980 to 1989 (%)
Year householder moved into unit - Moved in 1970 to 1979 (%)
Year householder moved into unit - Moved in 1969 or earlier (%)
Means of transportation to work - Drove car alone (%)
Means of transportation to work - Carpooled (%)
Means of transportation to work - Public transportation (%)
Means of transportation to work - Bus or trolley bus (%)
Means of transportation to work - Streetcar or trolley car (%)
Means of transportation to work - Subway or elevated (%)
Means of transportation to work - Railroad (%)
Means of transportation to work - Ferryboat (%)
Means of transportation to work - Taxicab (%)
Means of transportation to work - Motorcycle (%)
Means of transportation to work - Bicycle (%)
Means of transportation to work - Walked (%)
Means of transportation to work - Other means (%)
Working at home (%)
Industry diversity
Most Common Industries - Agriculture, forestry, fishing and hunting, and mining (%)
Most Common Industries - Agriculture, forestry, fishing and hunting (%)
Most Common Industries - Mining, quarrying, and oil and gas extraction (%)
Most Common Industries - Construction (%)
Most Common Industries - Manufacturing (%)
Most Common Industries - Wholesale trade (%)
Most Common Industries - Retail trade (%)
Most Common Industries - Transportation and warehousing, and utilities (%)
Most Common Industries - Transportation and warehousing (%)
Most Common Industries - Utilities (%)
Most Common Industries - Information (%)
Most Common Industries - Finance and insurance, and real estate and rental and leasing (%)
Most Common Industries - Finance and insurance (%)
Most Common Industries - Real estate and rental and leasing (%)
Most Common Industries - Professional, scientific, and management, and administrative and waste management services (%)
Most Common Industries - Professional, scientific, and technical services (%)
Most Common Industries - Management of companies and enterprises (%)
Most Common Industries - Administrative and support and waste management services (%)
Most Common Industries - Educational services, and health care and social assistance (%)
Most Common Industries - Educational services (%)
Most Common Industries - Health care and social assistance (%)
Most Common Industries - Arts, entertainment, and recreation, and accommodation and food services (%)
Most Common Industries - Arts, entertainment, and recreation (%)
Most Common Industries - Accommodation and food services (%)
Most Common Industries - Other services, except public administration (%)
Most Common Industries - Public administration (%)
Occupation diversity
Most Common Occupations - Management, business, science, and arts occupations (%)
Most Common Occupations - Management, business, and financial occupations (%)
Most Common Occupations - Management occupations (%)
Most Common Occupations - Business and financial operations occupations (%)
Most Common Occupations - Computer, engineering, and science occupations (%)
Most Common Occupations - Computer and mathematical occupations (%)
Most Common Occupations - Architecture and engineering occupations (%)
Most Common Occupations - Life, physical, and social science occupations (%)
Most Common Occupations - Education, legal, community service, arts, and media occupations (%)
Most Common Occupations - Community and social service occupations (%)
Most Common Occupations - Legal occupations (%)
Most Common Occupations - Education, training, and library occupations (%)
Most Common Occupations - Arts, design, entertainment, sports, and media occupations (%)
Most Common Occupations - Healthcare practitioners and technical occupations (%)
Most Common Occupations - Health diagnosing and treating practitioners and other technical occupations (%)
Most Common Occupations - Health technologists and technicians (%)
Most Common Occupations - Service occupations (%)
Most Common Occupations - Healthcare support occupations (%)
Most Common Occupations - Protective service occupations (%)
Most Common Occupations - Fire fighting and prevention, and other protective service workers including supervisors (%)
Most Common Occupations - Law enforcement workers including supervisors (%)
Most Common Occupations - Food preparation and serving related occupations (%)
Most Common Occupations - Building and grounds cleaning and maintenance occupations (%)
Most Common Occupations - Personal care and service occupations (%)
Most Common Occupations - Sales and office occupations (%)
Most Common Occupations - Sales and related occupations (%)
Most Common Occupations - Office and administrative support occupations (%)
Most Common Occupations - Natural resources, construction, and maintenance occupations (%)
Most Common Occupations - Farming, fishing, and forestry occupations (%)
Most Common Occupations - Construction and extraction occupations (%)
Most Common Occupations - Installation, maintenance, and repair occupations (%)
Most Common Occupations - Production, transportation, and material moving occupations (%)
Most Common Occupations - Production occupations (%)
Most Common Occupations - Transportation occupations (%)
Most Common Occupations - Material moving occupations (%)
People in Group quarters - Institutionalized population (%)
People in Group quarters - Correctional institutions (%)
People in Group quarters - Federal prisons and detention centers (%)
People in Group quarters - Halfway houses (%)
People in Group quarters - Local jails and other confinement facilities (including police lockups) (%)
People in Group quarters - Military disciplinary barracks (%)
People in Group quarters - State prisons (%)
People in Group quarters - Other types of correctional institutions (%)
People in Group quarters - Nursing homes (%)
People in Group quarters - Hospitals/wards, hospices, and schools for the handicapped (%)
People in Group quarters - Hospitals/wards and hospices for chronically ill (%)
People in Group quarters - Hospices or homes for chronically ill (%)
People in Group quarters - Military hospitals or wards for chronically ill (%)
People in Group quarters - Other hospitals or wards for chronically ill (%)
People in Group quarters - Hospitals or wards for drug/alcohol abuse (%)
People in Group quarters - Mental (Psychiatric) hospitals or wards (%)
People in Group quarters - Schools, hospitals, or wards for the mentally retarded (%)
People in Group quarters - Schools, hospitals, or wards for the physically handicapped (%)
People in Group quarters - Institutions for the deaf (%)
People in Group quarters - Institutions for the blind (%)
People in Group quarters - Orthopedic wards and institutions for the physically handicapped (%)
People in Group quarters - Wards in general hospitals for patients who have no usual home elsewhere (%)
People in Group quarters - Wards in military hospitals for patients who have no usual home elsewhere (%)
People in Group quarters - Juvenile institutions (%)
People in Group quarters - Long-term care (%)
People in Group quarters - Homes for abused, dependent, and neglected children (%)
People in Group quarters - Residential treatment centers for emotionally disturbed children (%)
People in Group quarters - Training schools for juvenile delinquents (%)
People in Group quarters - Short-term care, detention or diagnostic centers for delinquent children (%)
People in Group quarters - Type of juvenile institution unknown (%)
People in Group quarters - Noninstitutionalized population (%)
People in Group quarters - College dormitories (includes college quarters off campus) (%)
People in Group quarters - Military quarters (%)
People in Group quarters - On base (%)
People in Group quarters - Barracks, unaccompanied personnel housing (UPH), (Enlisted/Officer), ;and similar group living quarters for military personnel (%)
People in Group quarters - Transient quarters for temporary residents (%)
People in Group quarters - Military ships (%)
People in Group quarters - Group homes (%)
People in Group quarters - Homes or halfway houses for drug/alcohol abuse (%)
People in Group quarters - Homes for the mentally ill (%)
People in Group quarters - Homes for the mentally retarded (%)
People in Group quarters - Homes for the physically handicapped (%)
People in Group quarters - Other group homes (%)
People in Group quarters - Religious group quarters (%)
People in Group quarters - Dormitories (%)
People in Group quarters - Agriculture workers' dormitories on farms (%)
People in Group quarters - Job Corps and vocational training facilities (%)
People in Group quarters - Other workers' dormitories (%)
People in Group quarters - Crews of maritime vessels (%)
People in Group quarters - Other nonhousehold living situations (%)
People in Group quarters - Other noninstitutional group quarters (%)
Residents speaking English at home (%)
Residents speaking English at home - Born in the United States (%)
Residents speaking English at home - Native, born elsewhere (%)
Residents speaking English at home - Foreign born (%)
Residents speaking Spanish at home (%)
Residents speaking Spanish at home - Born in the United States (%)
Residents speaking Spanish at home - Native, born elsewhere (%)
Residents speaking Spanish at home - Foreign born (%)
Residents speaking other language at home (%)
Residents speaking other language at home - Born in the United States (%)
Residents speaking other language at home - Native, born elsewhere (%)
Residents speaking other language at home - Foreign born (%)
Class of Workers - Employee of private company (%)
Class of Workers - Self-employed in own incorporated business (%)
Class of Workers - Private not-for-profit wage and salary workers (%)
Class of Workers - Local government workers (%)
Class of Workers - State government workers (%)
Class of Workers - Federal government workers (%)
Class of Workers - Self-employed workers in own not incorporated business and Unpaid family workers (%)
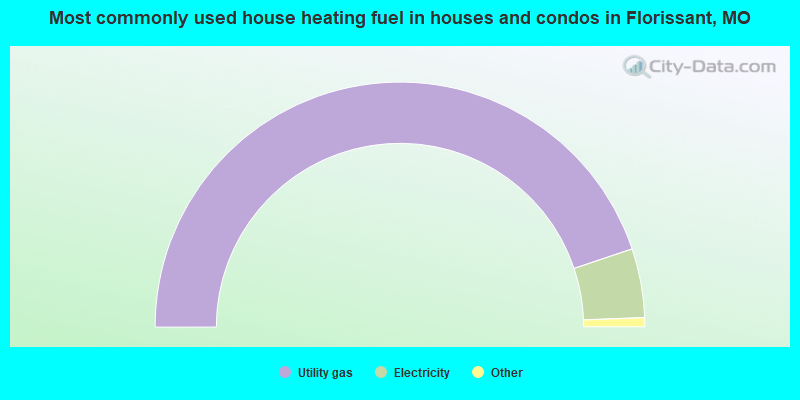
House heating fuel used in houses and condos - Utility gas (%)
House heating fuel used in houses and condos - Bottled, tank, or LP gas (%)
House heating fuel used in houses and condos - Electricity (%)
House heating fuel used in houses and condos - Fuel oil, kerosene, etc. (%)
House heating fuel used in houses and condos - Coal or coke (%)
House heating fuel used in houses and condos - Wood (%)
House heating fuel used in houses and condos - Solar energy (%)
House heating fuel used in houses and condos - Other fuel (%)
House heating fuel used in houses and condos - No fuel used (%)
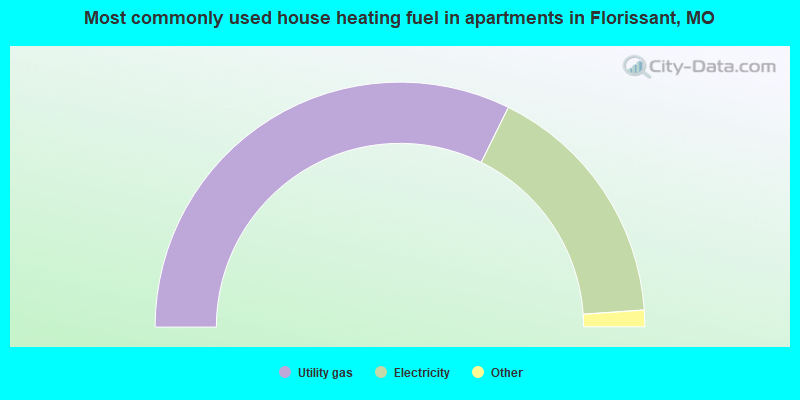
House heating fuel used in apartments - Utility gas (%)
House heating fuel used in apartments - Bottled, tank, or LP gas (%)
House heating fuel used in apartments - Electricity (%)
House heating fuel used in apartments - Fuel oil, kerosene, etc. (%)
House heating fuel used in apartments - Coal or coke (%)
House heating fuel used in apartments - Wood (%)
House heating fuel used in apartments - Solar energy (%)
House heating fuel used in apartments - Other fuel (%)
House heating fuel used in apartments - No fuel used (%)
Armed forces status - In Armed Forces (%)
Armed forces status - Civilian (%)
Armed forces status - Civilian - Veteran (%)
Armed forces status - Civilian - Nonveteran (%)
Fatal accidents locations in years 2005-2021
Fatal accidents locations in 2005
Fatal accidents locations in 2006
Fatal accidents locations in 2007
Fatal accidents locations in 2008
Fatal accidents locations in 2009
Fatal accidents locations in 2010
Fatal accidents locations in 2011
Fatal accidents locations in 2012
Fatal accidents locations in 2013
Fatal accidents locations in 2014
Fatal accidents locations in 2015
Fatal accidents locations in 2016
Fatal accidents locations in 2017
Fatal accidents locations in 2018
Fatal accidents locations in 2019
Fatal accidents locations in 2020
Fatal accidents locations in 2021
Alcohol use - People drinking some alcohol every month (%)
Alcohol use - People not drinking at all (%)
Alcohol use - Average days/month drinking alcohol
Alcohol use - Average drinks/week
Alcohol use - Average days/year people drink much
Audiometry - Average condition of hearing (%)
Audiometry - People that can hear a whisper from across a quiet room (%)
Audiometry - People that can hear normal voice from across a quiet room (%)
Audiometry - Ears ringing, roaring, buzzing (%)
Audiometry - Had a job exposure to loud noise (%)
Audiometry - Had off-work exposure to loud noise (%)
Blood Pressure & Cholesterol - Has high blood pressure (%)
Blood Pressure & Cholesterol - Checking blood pressure at home (%)
Blood Pressure & Cholesterol - Frequently checking blood cholesterol (%)
Blood Pressure & Cholesterol - Has high cholesterol level (%)
Consumer Behavior - Money monthly spent on food at supermarket/grocery store
Consumer Behavior - Money monthly spent on food at other stores
Consumer Behavior - Money monthly spent on eating out
Consumer Behavior - Money monthly spent on carryout/delivered foods
Consumer Behavior - Income spent on food at supermarket/grocery store (%)
Consumer Behavior - Income spent on food at other stores (%)
Consumer Behavior - Income spent on eating out (%)
Consumer Behavior - Income spent on carryout/delivered foods (%)
Current Health Status - General health condition (%)
Current Health Status - Blood donors (%)
Current Health Status - Has blood ever tested for HIV virus (%)
Current Health Status - Left-handed people (%)
Dermatology - People using sunscreen (%)
Diabetes - Diabetics (%)
Diabetes - Had a blood test for high blood sugar (%)
Diabetes - People taking insulin (%)
Diet Behavior & Nutrition - Diet health (%)
Diet Behavior & Nutrition - Milk product consumption (# of products/month)
Diet Behavior & Nutrition - Meals not home prepared (#/week)
Diet Behavior & Nutrition - Meals from fast food or pizza place (#/week)
Diet Behavior & Nutrition - Ready-to-eat foods (#/month)
Diet Behavior & Nutrition - Frozen meals/pizza (#/month)
Drug Use - People that ever used marijuana or hashish (%)
Drug Use - Ever used hard drugs (%)
Drug Use - Ever used any form of cocaine (%)
Drug Use - Ever used heroin (%)
Drug Use - Ever used methamphetamine (%)
Health Insurance - People covered by health insurance (%)
Kidney Conditions-Urology - Avg. # of times urinating at night
Medical Conditions - People with asthma (%)
Medical Conditions - People with anemia (%)
Medical Conditions - People with psoriasis (%)
Medical Conditions - People with overweight (%)
Medical Conditions - Elderly people having difficulties in thinking or remembering (%)
Medical Conditions - People who ever received blood transfusion (%)
Medical Conditions - People having trouble seeing even with glass/contacts (%)
Medical Conditions - People with arthritis (%)
Medical Conditions - People with gout (%)
Medical Conditions - People with congestive heart failure (%)
Medical Conditions - People with coronary heart disease (%)
Medical Conditions - People with angina pectoris (%)
Medical Conditions - People who ever had heart attack (%)
Medical Conditions - People who ever had stroke (%)
Medical Conditions - People with emphysema (%)
Medical Conditions - People with thyroid problem (%)
Medical Conditions - People with chronic bronchitis (%)
Medical Conditions - People with any liver condition (%)
Medical Conditions - People who ever had cancer or malignancy (%)
Mental Health - People who have little interest in doing things (%)
Mental Health - People feeling down, depressed, or hopeless (%)
Mental Health - People who have trouble sleeping or sleeping too much (%)
Mental Health - People feeling tired or having little energy (%)
Mental Health - People with poor appetite or overeating (%)
Mental Health - People feeling bad about themself (%)
Mental Health - People who have trouble concentrating on things (%)
Mental Health - People moving or speaking slowly or too fast (%)
Mental Health - People having thoughts they would be better off dead (%)
Oral Health - Average years since last visit a dentist
Oral Health - People embarrassed because of mouth (%)
Oral Health - People with gum disease (%)
Oral Health - General health of teeth and gums (%)
Oral Health - Average days a week using dental floss/device
Oral Health - Average days a week using mouthwash for dental problem
Oral Health - Average number of teeth
Pesticide Use - Households using pesticides to control insects (%)
Pesticide Use - Households using pesticides to kill weeds (%)
Physical Activity - People doing vigorous-intensity work activities (%)
Physical Activity - People doing moderate-intensity work activities (%)
Physical Activity - People walking or bicycling (%)
Physical Activity - People doing vigorous-intensity recreational activities (%)
Physical Activity - People doing moderate-intensity recreational activities (%)
Physical Activity - Average hours a day doing sedentary activities
Physical Activity - Average hours a day watching TV or videos
Physical Activity - Average hours a day using computer
Physical Functioning - People having limitations keeping them from working (%)
Physical Functioning - People limited in amount of work they can do (%)
Physical Functioning - People that need special equipment to walk (%)
Physical Functioning - People experiencing confusion/memory problems (%)
Physical Functioning - People requiring special healthcare equipment (%)
Prescription Medications - Average number of prescription medicines taking
Preventive Aspirin Use - Adults 40+ taking low-dose aspirin (%)
Reproductive Health - Vaginal deliveries (%)
Reproductive Health - Cesarean deliveries (%)
Reproductive Health - Deliveries resulted in a live birth (%)
Reproductive Health - Pregnancies resulted in a delivery (%)
Reproductive Health - Women breastfeeding newborns (%)
Reproductive Health - Women that had a hysterectomy (%)
Reproductive Health - Women that had both ovaries removed (%)
Reproductive Health - Women that have ever taken birth control pills (%)
Reproductive Health - Women taking birth control pills (%)
Reproductive Health - Women that have ever used Depo-Provera or injectables (%)
Reproductive Health - Women that have ever used female hormones (%)
Sexual Behavior - People 18+ that ever had sex (vaginal, anal, or oral) (%)
Sexual Behavior - Males 18+ that ever had vaginal sex with a woman (%)
Sexual Behavior - Males 18+ that ever performed oral sex on a woman (%)
Sexual Behavior - Males 18+ that ever had anal sex with a woman (%)
Sexual Behavior - Males 18+ that ever had any sex with a man (%)
Sexual Behavior - Females 18+ that ever had vaginal sex with a man (%)
Sexual Behavior - Females 18+ that ever performed oral sex on a man (%)
Sexual Behavior - Females 18+ that ever had anal sex with a man (%)
Sexual Behavior - Females 18+ that ever had any kind of sex with a woman (%)
Sexual Behavior - Average age people first had sex
Sexual Behavior - Average number of female sex partners in lifetime (males 18+)
Sexual Behavior - Average number of female vaginal sex partners in lifetime (males 18+)
Sexual Behavior - Average age people first performed oral sex on a woman (18+)
Sexual Behavior - Average number of woman performed oral sex on in lifetime (18+)
Sexual Behavior - Average number of male sex partners in lifetime (males 18+)
Sexual Behavior - Average number of male anal sex partners in lifetime (males 18+)
Sexual Behavior - Average age people first performed oral sex on a man (18+)
Sexual Behavior - Average number of male oral sex partners in lifetime (18+)
Sexual Behavior - People using protection when performing oral sex (%)
Sexual Behavior - Average number of times people have vaginal or anal sex a year
Sexual Behavior - People having sex without condom (%)
Sexual Behavior - Average number of male sex partners in lifetime (females 18+)
Sexual Behavior - Average number of male vaginal sex partners in lifetime (females 18+)
Sexual Behavior - Average number of female sex partners in lifetime (females 18+)
Sexual Behavior - Circumcised males 18+ (%)
Sleep Disorders - Average hours sleeping at night
Sleep Disorders - People that has trouble sleeping (%)
Smoking-Cigarette Use - People smoking cigarettes (%)
Taste & Smell - People 40+ having problems with smell (%)
Taste & Smell - People 40+ having problems with taste (%)
Taste & Smell - People 40+ that ever had wisdom teeth removed (%)
Taste & Smell - People 40+ that ever had tonsils teeth removed (%)
Taste & Smell - People 40+ that ever had a loss of consciousness because of a head injury (%)
Taste & Smell - People 40+ that ever had a broken nose or other serious injury to face or skull (%)
Taste & Smell - People 40+ that ever had two or more sinus infections (%)
Weight - Average height (inches)
Weight - Average weight (pounds)
Weight - Average BMI
Weight - People that are obese (%)
Weight - People that ever were obese (%)
Weight - People trying to lose weight (%)
The City-Data.com crime index weighs serious crimes and violent crimes more heavily. Higher means more crime, U.S. average is 246.1. It adjusts for the number of visitors and daily workers commuting into cities.
- means the value is smaller than the state average.
- means the value is about the same as the state average.
- means the value is bigger than the state average.
- means the value is much bigger than the state average.
Crime rate in Florissant detailed stats: murders, rapes, robberies, assaults, burglaries, thefts, arson Officers per 1,000 residents here:
1.76Missouri average:
2.54
Latest news from Florissant, MO collected exclusively by city-data.com from local newspapers, TV, and radio stations
Ancestries: German (11.1%), American (6.8%), Irish (5.8%), English (3.8%), Italian (2.0%), African (2.0%).
Current Local Time:
Land area: 11.4 square miles.
Population density: 4,531 people per square mile (average).
2,007 residents are foreign born (1.4% Africa , 1.2% Latin America , 1.1% Asia ).
This city:
3.9%Missouri:
4.2%
Median real estate property taxes paid for housing units with mortgages in 2022: $1,806 (1.3%)Median real estate property taxes paid for housing units with no mortgage in 2022: $1,922 (1.5%)
Nearest city with pop. 200,000+: St. Louis, MO
Nearest city with pop. 1,000,000+: Chicago, IL
Nearest cities:
Latitude: 38.80 N, Longitude: 90.33 W
Daytime population change due to commuting: -12,315 (-23.8%)Workers who live and work in this city: 6,082 (23.3%)
Property values in Florissant, MO
Single-family new house construction building permits:
2021: 1 building , cost: $75,0002020: 2 buildings , average cost: $75,0002016: 2 buildings , average cost: $200,0002015: 1 building , cost: $200,0002014: 1 building , cost: $140,0002013: 1 building , cost: $120,0002011: 2 buildings , average cost: $122,5002010: 1 building , cost: $100,0002007: 1 building , cost: $150,0002006: 6 buildings , average cost: $208,3002005: 24 buildings , average cost: $162,0002004: 1 building , cost: $175,0002002: 7 buildings , average cost: $112,4002001: 6 buildings , average cost: $201,7002000: 2 buildings , average cost: $245,0001999: 1 building , cost: $124,0001998: 2 buildings , average cost: $175,0001997: 2 buildings , average cost: $132,500Unemployment in December 2023:
Most common occupations in Florissant, MO (%)
Both Males Females
Other office and administrative support workers, including supervisors (4.9%)
Material recording, scheduling, dispatching, and distributing workers (4.0%)
Other sales and related occupations, including supervisors (3.6%)
Secretaries and administrative assistants (3.4%)
Retail sales workers, except cashiers (3.1%)
Other management occupations, except farmers and farm managers (3.1%)
Preschool, kindergarten, elementary, and middle school teachers (3.0%)
Driver/sales workers and truck drivers (5.8%)
Material recording, scheduling, dispatching, and distributing workers (5.4%)
Electrical equipment mechanics and other installation, maintenance, and repair workers, including supervisors (5.3%)
Other production occupations, including supervisors (4.3%)
Vehicle and mobile equipment mechanics, installers, and repairers (4.0%)
Other sales and related occupations, including supervisors (4.0%)
Other management occupations, except farmers and farm managers (3.6%)
Other office and administrative support workers, including supervisors (7.9%)
Secretaries and administrative assistants (6.8%)
Preschool, kindergarten, elementary, and middle school teachers (4.9%)
Information and record clerks, except customer service representatives (4.1%)
Retail sales workers, except cashiers (4.1%)
Registered nurses (4.0%)
Customer service representatives (3.9%)
Tornado activity:
Florissant-area historical tornado activity is near Missouri state average. It is 76% greater than the overall U.S. average.
On 1/24/1967, a category F4 (max. wind speeds 207-260 mph) tornado 11.2 miles away from the Florissant city center killed 3 people and injured 216 people and caused between $5,000,000 and $50,000,000 in damages.
On 4/3/1981, a category F4 tornado 11.8 miles away from the city center injured 32 people and caused between $5,000,000 and $50,000,000 in damages.
Earthquake activity:
Florissant-area historical earthquake activity is significantly above Missouri state average. It is 306% greater than the overall U.S. average. On 4/18/2008 at 09:36:59, a magnitude 5.4 (5.1 MB, 4.8 MS, 5.4 MW, 5.2 MW, Class: Moderate, Intensity: VI - VII) earthquake occurred 134.0 miles away from Florissant center On 4/18/2008 at 09:36:59, a magnitude 5.2 (5.2 MW, Depth: 8.9 mi) earthquake occurred 134.0 miles away from the city center On 6/10/1987 at 23:48:54, a magnitude 5.1 (4.9 MB, 4.4 MS, 4.6 MS, 5.1 LG) earthquake occurred 131.5 miles away from the city center On 9/26/1990 at 13:18:51, a magnitude 5.0 (4.7 MB, 4.8 LG, 5.0 LG, Depth: 7.7 mi) earthquake occurred 120.8 miles away from Florissant center On 6/18/2002 at 17:37:15, a magnitude 5.0 (4.3 MB, 4.6 MW, 5.0 LG) earthquake occurred 149.0 miles away from the city center On 5/4/1991 at 01:18:54, a magnitude 5.0 (4.4 MB, 4.6 LG, 5.0 LG, Depth: 3.1 mi) earthquake occurred 156.9 miles away from the city center Magnitude types: regional Lg-wave magnitude (LG), body-wave magnitude (MB), surface-wave magnitude (MS), moment magnitude (MW) Natural disasters: The number of natural disasters in St. Louis County (2) is a lot smaller than the US average (15).Flood: 1, Storm: 1, Tornado: 1, Wind: 1, Other: 1 (Note: some incidents may be assigned to more than one category). Hospitals in Florissant: CHRISTIAN HOSPITAL NORTHWEST (provides emergency services, 1225 GRAHAM ROAD) Nursing Homes in Florissant: BENTWOOD NURSING AND REHAB (1501 CHARBONIER ROAD) CRESTWOOD HEALTH CARE CENTER, LLC (11400 MEHL AVENUE) CRYSTAL CREEK HEALTH AND REHABILITATION CENTER (250 NEW FLORISSANT ROAD SOUTH) DELMAR GARDENS NORTH (4401 PARKER ROAD) LIFE CARE CENTER OF FLORISSANT (1201 GARDEN PLAZA DRIVE) PILLARS OF NORTH COUNTY HEALTH AND REHAB CENTER, THE (13700 OLD HALLS FERRY ROAD) RANCHO MANOR HEALTHCARE AND REHABILITATION CENTER (615 RANCHO LANE) SPANISH LAKE NURSING CENTER (13700 OLD HALLS FERRY ROAD) ST ELIZABETH MANOR, INC (11400 MEHL AVE) ST SOPHIA HEALTH AND REHABILITATION CENTER (936 CHARBONIER ROAD) VALLEY-A STONEBRIDGE COMMUNITY, THE (6768 NORTH HIGHWAY 67) Dialysis Facilities in Florissant: FMC - FLORISSANT (577 HODERSHELL ROAD) METRO DIALYSIS CENTER - NORTH (2 GRANDVIEW PLAZA) NORTH SAINT LOUIS COUNTY DIALYSIS (13119 NEW HALLS FERRY ROAD) QUALITY CARE DIALYSIS CENTERS - NORTH COUNTY (6865 PARKER RD.) Home Health Centers in Florissant: ANGELS OF MERCY HEALTHCARE, INC (456 HOWDERSHELL) Heliports located in Florissant: Amtrak stations near Florissant: 13 miles: ALTON (3400 COLLEGE AVE.) Services: ticket office, fully wheelchair accessible, public payphones, vending machines, free short-term parking, free long-term parking, call for taxi service.
14 miles: ST. LOUIS (550 S. 16TH ST.) Services: ticket office, partially wheelchair accessible, enclosed waiting area, public restrooms, public payphones, vending machines, free short-term parking, free long-term parking, call for car rental service, taxi stand.
16 miles: KIRKWOOD (110 W. ARGONNE RD.) Services: ticket office, partially wheelchair accessible, enclosed waiting area, public restrooms, public payphones, free short-term parking, free long-term parking, taxi stand, intercity bus service, public transit connection.
Colleges/Universities in Florissant: Saint Louis Christian College Full-time enrollment: 202; Location: 1360 Grandview Dr; Private, not-for-profit; Website: www.slcconline.edu)
Urshan Graduate School of Theology Full-time enrollment: 37; Location: 704 Howdershell Rd; Private, not-for-profit; Website: www.ugst.edu; Offers Master's degree )
Missouri School of Barbering & Hairstyling Full-time enrollment: 33; Location: 1125 North Highway 67; Private, for-profit; Website: americancollegeofhair.com)
Colleges/universities with over 2000 students nearest to Florissant:
University of Missouri-St Louis (about 7 miles; Saint Louis, MO ; Full-time enrollment: 10,322)
Lindenwood University (about 10 miles; Saint Charles, MO ; FT enrollment: 11,117)
Washington University in St Louis (about 11 miles; Saint Louis, MO ; FT enrollment: 10,823)
Ranken Technical College (about 11 miles; Saint Louis, MO ; FT enrollment: 2,134)
Saint Louis University (about 13 miles; Saint Louis, MO ; FT enrollment: 11,606)
Lewis and Clark Community College (about 13 miles; Godfrey, IL ; FT enrollment: 4,189)
Missouri Baptist University (about 14 miles; Saint Louis, MO ; FT enrollment: 2,898)
Public high schools in Florissant: HAZELWOOD CENTRAL HIGH Students: 2,882, Location: 15875 NEW HALLS FERRY RD, Grades: 9-12)MCCLUER NORTH HIGH Students: 1,805, Location: 705 WATERFORD DR, Grades: 9-12)MCCLUER HIGH Students: 1,528, Location: 1896 S FLORISSANT RD, Grades: 9-12)NORTH TECHNICAL Students: 491, Location: 1700 DERHAKE RD, Grades: 9-12)NORTHVIEW Students: 205, Location: 1520 DERHAKE RD., Grades: 9-12)Private high schools in Florissant: ACE LEARNING CENTERS Students: 703, Location: 209 SAINT LOUIS ST, Grades: 6-12)
NORTH COUNTY CHRISTIAN SCHOOL Students: 345, Location: 845 DUNN RD, Grades: PK-12)
CHILD CENTER - MARYGROVE Students: 6, Location: 2705 MULLANPHY LN, Grades: 5-12)
Biggest public elementary/middle schools in Florissant: NORTHWEST MIDDLE Students: 1,233, Location: 1605 SHACKELFORD RD, Grades: 6-8)CROSS KEYS MIDDLE Students: 986, Location: 14205 COUGAR DR, Grades: 7-8)WEDGWOOD ELEM. Students: 591, Location: 14275 NEW HALLS FERRY RD, Grades: KG-6)COLD WATER ELEM. Students: 495, Location: 1105 WIETHAUPT RD, Grades: KG-5)BARRINGTON ELEM. Students: 470, Location: 15600 OLD HALLS FERRY RD, Grades: KG-5)LUSHER ELEM. Students: 448, Location: 2015 MULLANPHY RD, Grades: KG-5)COMMONS LANE ELEM. Students: 439, Location: 2700 DERHAKE RD, Grades: KG-6)MCCURDY ELEM. Students: 435, Location: 975 LINDSAY LN, Grades: KG-5)DUCHESNE ELEM. Students: 401, Location: 100 S FLORISSANT RD, Grades: KG-6)TOWNSEND ELEM. Students: 401, Location: 6645 PARKER RD, Grades: PK-5)Private elementary/middle schools in Florissant: ST NORBERT SCHOOL Students: 466, Location: 16475 NEW HALLS FERRY RD, Grades: PK-8)
SACRED HEART CATHOLIC SCHOOL Students: 329, Location: 501 SAINT LOUIS ST, Grades: 1-8)
ST ANGELA MERICI ELEMENTARY SCHOOL Students: 306, Location: 3860 N US HIGHWAY 67, Grades: PK-8)
ST ROSE PHILIPPINE DUCHESNE SCHOOL Students: 271, Location: 3500 SAINT CATHERINE ST, Grades: PK-8)
ATONEMENT LUTHERAN SCHOOL Students: 261, Location: 1285 N NEW FLORISSANT RD, Grades: PK-8)
ST FERDINAND SCHOOL Students: 245, Location: 1735 CHARBONIER RD, Grades: KG-8)
SALEM LUTHERAN SCHOOL Students: 144, Location: 5190 PARKER RD, Grades: PK-8)
See full list of schools located in Florissant User-submitted facts and corrections:
What about the grear golf course? Where is it?
Miss USA 2004, Shandi Finnessey, was born in Florissant.
Notable locations in Florissant: (A) , Florissant Valley Fire Protection District Station 1 (B) , Florissant Valley Fire Protection District Station 2 (C) . Display/hide their locations on the map
Shopping Centers: (1) , Cross Keys Shopping Center (2) , Duchense Hills Shopping Center (3) , Florissant Meadows Shopping Center (4) , Florissant Oaks Shopping Center (5) , Grandview Plaza Shopping Center (6) , Paddock Hills Shopping Center (7) . Display/hide their locations on the map
Church in Florissant: (A) . Display/hide its location on the map
Cemetery: (1) . Display/hide its location on the map
Creek: (A) . Display/hide its location on the map
Parks in Florissant include: (1) , Kock Park (2) . Display/hide their locations on the map
Tourist attractions: (1) , R Ebeverage.Com (Botanical Gardens; Po Box 91) (2) , Libraries Public - St Louis County- Branches- Jamestown Bluffs Branch (Cultural Attractions- Events- & Facilities; 4153 North US Highway 67) (3) , Libraries Public - St Louis County- Branches- Florissant Valley Branch (Cultural Attractions- Events- & Facilities; 195 South New Florissant Road) (4) , Historic Florissant Inc (Cultural Attractions- Events- & Facilities; 1067 Dunn Road) (5) , Old St Ferdinand Shrine (Cultural Attractions- Events- & Facilities; 1 Saint Francois Street) (6) , Amf Dick Weber Lanes (Amusement & Theme Parks; 4575 Washington Street) (7) , Arcades-N-More (Amusement & Theme Parks; 6 Patterson Plaza) (8) , A Regal Tours (Tours & Charters; 160 Saint Catherine Street) (9) . Display/hide their approximate locations on the map
Hotels: (1) , Hampton Inn St.Louis-NW-I-270-Florissant (55 Dunn Road) (2) . Display/hide their approximate locations on the map
Courts: (1) , Desmet Court (1425 North New Florissant Road Ofc) (2) . Display/hide their approximate locations on the map
Birthplace of: Jon Vaughn - Football player, Shandi Finnessey - Beauty queen, Jeremy Lucido - Photographer, Mike Sorber - Soccer player-coach, Perry Van der Beck - Soccer player-coach, Rita Meyer (baseball) - Baseball player, Jason F. Wright - Writer, Kathleen Madigan - Comedian, Kyle McClellan - Baseball player, Bob Christian - Football player.
St. Louis County has a predicted average indoor radon screening level between 2 and 4 pCi/L (pico curies per liter) - Moderate Potential Drinking water stations with addresses in Florissant and their reported violations in the past:
ANNA MEADOWS (Population served: 25, Groundwater):
Past monitoring violations:
Initial Tap Sampling for Pb and Cu - In JUL-01-2013, Contaminant: Lead and Copper Rule. Follow-up actions: St Formal NOV issued (AUG-13-2013), St Public Notif requested (AUG-13-2013)
Average household size: This city:
2.4 peopleMissouri:
2.5 people
Percentage of family households: This city:
65.0%Whole state:
65.3%
Percentage of households with unmarried partners: This city:
6.3%Whole state:
6.7%
Likely homosexual households (counted as self-reported same-sex unmarried-partner households)
Lesbian couples: 0.3% of all households Gay men: 0.1% of all households
People in group quarters in Florissant in 2010:
542 people in nursing facilities/skilled-nursing facilities
122 people in group homes for juveniles (non-correctional)
107 people in college/university student housing
10 people in other noninstitutional facilities
4 people in correctional residential facilities
3 people in workers' group living quarters and job corps centers
People in group quarters in Florissant in 2000:
557 people in nursing homes
95 people in homes for the mentally ill
68 people in college dormitories (includes college quarters off campus)
32 people in religious group quarters
29 people in other noninstitutional group quarters
Banks with most branches in Florissant (2011 data):
Bank of America, National Association: Florissant Branch, Mayfair Branch, Howdershell Facility, New Halls Ferry Branch. Info updated 2009/11/18: Bank assets: $1,451,969.3 mil, Deposits: $1,077,176.8 mil, headquarters in Charlotte, NC, positive income , 5782 total offices , Holding Company: Bank Of America Corporation
U.S. Bank National Association: Florissant Office, Waterford Branch, Cross Keys Schnucks Branch. Info updated 2012/01/30: Bank assets: $330,470.8 mil, Deposits: $236,091.5 mil, headquarters in Cincinnati, OH, positive income , 3121 total offices , Holding Company: U.S. Bancorp
First Bank: Graham Road Branch, Halls Ferry Branch, Florissant - Dierberg's. Info updated 2007/12/04: Bank assets: $6,579.8 mil, Deposits: $5,800.6 mil, headquarters in Creve Coeur, MO, negative income in the last year , Commercial Lending Specialization, 148 total offices , Holding Company: First Banks, Inc.
Regions Bank: Florissant Branch at 11920 New Halls Ferry Road, branch established on 1989/07/06; Shackelford Facility at 1100 Shackelford Road, branch established on 1986/12/19. Info updated 2011/02/24: Bank assets: $123,368.2 mil, Deposits: $98,301.3 mil, headquarters in Birmingham, AL, positive income , Commercial Lending Specialization, 1778 total offices , Holding Company: Regions Financial Corporation
Commerce Bank: Florissant Branch at 8190 N Lindbergh Blvd, branch established on 1965/09/07; Cross Keys Branch at 2900 N Highway 67, branch established on 1972/06/28. Info updated 2011/07/07: Bank assets: $20,493.6 mil, Deposits: $16,805.3 mil, headquarters in Kansas City, MO, positive income , 206 total offices , Holding Company: Commerce Bancshares, Inc.
Citizens National Bank of Greater St. Louis: Florissant Banking Center Branch at 430 St. Ferdinand, branch established on 1996/11/25. Info updated 2006/11/03: Bank assets: $455.0 mil, Deposits: $377.0 mil, headquarters in Maplewood, MO, positive income , Commercial Lending Specialization, 6 total offices , Holding Company: Cardinal Bancorp, Inc.
Pulaski Bank: Florissant Office Branch at 11550 New Halls Ferry Rd, branch established on 1998/10/01. Info updated 2011/07/21: Bank assets: $1,331.7 mil, Deposits: $1,129.9 mil, headquarters in Saint Louis, MO, positive income , Commercial Lending Specialization, 13 total offices
Commercial Bank: Florissant Branch at 400 West Washington, branch established on 1997/11/14. Info updated 2006/11/03: Bank assets: $163.1 mil, Deposits: $143.8 mil, headquarters in Saint Louis, MO, negative income in the last year , Commercial Lending Specialization, 3 total offices , Holding Company: Commercial Bancshares, Inc.
Eagle Bank and Trust Company of Missouri: Garden Villas North Branch at 4505 Parker Road, branch established on 2001/02/07. Info updated 2012/02/21: Bank assets: $836.9 mil, Deposits: $681.2 mil, headquarters in Hillsboro, MO, positive income , Commercial Lending Specialization, 17 total offices , Holding Company: Jefferson County Bancshares, Incorporated
For population 15 years and over in Florissant:
Never married: 39.4%Now married: 41.8%Separated: 1.9%Widowed: 5.6%Divorced: 11.3% For population 25 years and over in Florissant:
High school or higher: 92.0%Bachelor's degree or higher: 23.1%Graduate or professional degree: 7.6%Unemployed: 4.3%Mean travel time to work (commute): 22.1 minutes
Education Gini index (Inequality in education) Here:
10.3Missouri average:
11.1
Religion statistics for Florissant, MO (based on St. Louis County data)
Religion Adherents Congregations Catholic 230,488 74 Evangelical Protestant 162,614 384 Mainline Protestant 74,404 130 Other 37,156 87 Black Protestant 9,369 48 Orthodox 2,042 7 None 482,881 -
Source: Clifford Grammich, Kirk Hadaway, Richard Houseal, Dale E.Jones, Alexei Krindatch, Richie Stanley and Richard H.Taylor. 2012. 2010 U.S.Religion Census: Religious Congregations & Membership Study. Association of Statisticians of American Religious Bodies. Jones, Dale E., et al. 2002. Congregations and Membership in the United States 2000. Nashville, TN: Glenmary Research Center. Graphs represent county-level data
Food Environment Statistics: Number of grocery stores : 176This county :
1.77 / 10,000 pop.State :
1.88 / 10,000 pop.
Number of supercenters and club stores : 9St. Louis County :
0.09 / 10,000 pop.Missouri :
0.18 / 10,000 pop.
Number of convenience stores (no gas) : 50St. Louis County :
0.50 / 10,000 pop.Missouri :
0.60 / 10,000 pop.
Number of convenience stores (with gas) : 293This county :
2.95 / 10,000 pop.State :
4.34 / 10,000 pop.
Number of full-service restaurants : 683St. Louis County :
6.87 / 10,000 pop.Missouri :
7.37 / 10,000 pop.
Adult obesity rate : This county :
28.0%State :
29.6%
Low-income preschool obesity rate : Health and Nutrition:
Average overall health of teeth and gums : This city:
49.1%Missouri:
48.6%
People feeling badly about themselves : Florissant:
21.0%State:
20.6%
People not drinking alcohol at all : This city:
10.7%Missouri:
10.1%
Average hours sleeping at night : Florissant:
6.9Missouri:
6.8
General health condition : Florissant:
57.4%State:
57.5%
Average condition of hearing : Florissant:
78.6%Missouri:
79.3%
More about Health and Nutrition of Florissant, MO Residents
Local government employment and payroll (March 2022)
Function
Full-time employees
Monthly full-time payroll
Average yearly full-time wage
Part-time employees
Monthly part-time payroll
Police Protection - Officers
80 $445,317 $66,798 1 $16,127 Sewerage
43 $201,053 $56,108 0 $0 Parks and Recreation
38 $170,715 $53,910 108 $112,516 Police - Other
30 $118,416 $47,366 8 $26,413 Health
28 $132,958 $56,982 0 $0 Streets and Highways
27 $164,175 $72,967 1 $10,226 Financial Administration
15 $83,921 $67,137 0 $0 Housing and Community Development (Local)
14 $77,045 $66,039 0 $0 Solid Waste Management
13 $51,945 $47,949 0 $0 Other Government Administration
10 $62,985 $75,582 1 $10,649 Judicial and Legal
8 $38,346 $57,519 11 $27,320 Natural Resources
4 $21,688 $65,064 0 $0 Airports
4 $21,477 $64,431 0 $0 Other and Unallocable
1 $5,717 $68,604 0 $0 Fire - Other
1 $7,072 $84,864 0 $0
Totals for Government
316 $1,602,830 $60,867 130 $203,251
Florissant government finances - Expenditure in 2021 (per resident):
Construction - General - Other: $2,334,000 ($45.32)
Parks and Recreation: $673,000 ($13.07)Current Operations - Police Protection: $13,168,000 ($255.66)
Parks and Recreation: $5,025,000 ($97.56)Regular Highways: $4,664,000 ($90.55)Central Staff Services: $3,294,000 ($63.95)General - Other: $2,985,000 ($57.95)Judicial and Legal Services: $1,265,000 ($24.56)Housing and Community Development: $1,141,000 ($22.15)Health - Other: $844,000 ($16.39)Sewerage: $231,000 ($4.48)Financial Administration: $176,000 ($3.42)General - Interest on Debt: $184,000 ($3.57)
Other Capital Outlay - Central Staff Services: $32,000 ($0.62)
Sewerage: $27,000 ($0.52)Total Salaries and Wages: $16,154,000 ($313.63)
Florissant government finances - Revenue in 2021 (per resident):
Charges - Parks and Recreation: $1,727,000 ($33.53)
Miscellaneous Commercial Activities: $382,000 ($7.42)Local Intergovernmental - General Local Government Support: $14,616,000 ($283.77)
Miscellaneous - Fines and Forfeits: $2,981,000 ($57.88)
General Revenue - Other: $1,193,000 ($23.16)Interest Earnings: $541,000 ($10.50)State Intergovernmental - General Local Government Support: $495,000 ($9.61)
Other: $327,000 ($6.35)Tax - Public Utilities Sales: $8,657,000 ($168.08)
Other: $4,263,000 ($82.77)Occupation and Business License - Other: $1,040,000 ($20.19)Property: $760,000 ($14.76)Other License: $693,000 ($13.45)Alcoholic Beverage License: $84,000 ($1.63)
Florissant government finances - Debt in 2021 (per resident):
Long Term Debt - Outstanding Nonguaranteed - Industrial Revenue: $13,645,000 ($264.92)
Beginning Outstanding - Public Debt for Private Purpose: $13,645,000 ($264.92)
Florissant government finances - Cash and Securities in 2021 (per resident):
Other Funds - Cash and Securities: $20,356,000 ($395.22)
Sinking Funds - Cash and Securities: $20,359,000 ($395.27)
5.97% of this county's 2021 resident taxpayers lived in other counties in 2020 ($70,859 average adjusted gross income )
Here:
5.97%Missouri average:
7.67%
0.01% of residents moved from foreign countries ($97 average AGI )St. Louis County:
0.01%Missouri average:
0.02%
Top counties from which taxpayers relocated into this county between 2020 and 2021:
6.59% of this county's 2020 resident taxpayers moved to other counties in 2021 ($77,630 average adjusted gross income )
Here:
6.59%Missouri average:
7.51%
0.01% of residents moved to foreign countries ($63 average AGI )St. Louis County:
0.01%Missouri average:
0.01%
Top counties to which taxpayers relocated from this county between 2020 and 2021:
Businesses in Florissant, MO
Name Count Name Count
7-Eleven 2 LensCrafters 1 ALDI 2 Little Caesars Pizza 3 AMF Bowling 1 Long John Silver's 1 AT&T 2 Lowe's 1 Advance Auto Parts 2 Macy's 1 Applebee's 2 Marshalls 1 Arby's 2 MasterBrand Cabinets 2 AutoZone 1 McDonald's 4 Barnes & Noble 1 Men's Wearhouse 1 Baskin-Robbins 1 Motherhood Maternity 1 Blockbuster 3 New Balance 3 Burger King 2 Nike 6 Chevrolet 1 Office Depot 1 Church's Chicken 2 OfficeMax 1 Circle K 2 Panera Bread 1 Cold Stone Creamery 1 Papa John's Pizza 2 Cricket Wireless 4 Payless 2 Curves 3 PetSmart 1 Dairy Queen 2 Pier 1 Imports 1 Dennys 1 Pizza Hut 3 Domino's Pizza 3 Plato's Closet 1 DressBarn 1 Qdoba Mexican Grill 1 Dressbarn 1 Quiznos 1 Fashion Bug 1 RadioShack 2 FedEx 5 SONIC Drive-In 2 Finish Line 1 Sears 1 Firestone Complete Auto Care 3 Shoe Carnival 1 Foot Locker 1 Sprint Nextel 1 Ford 1 Starbucks 1 GNC 2 Steak 'n Shake 1 GameStop 1 Subway 4 H&R Block 3 T-Mobile 5 Hilton 1 Taco Bell 2 Home Depot 1 Target 1 HomeTown Buffet 1 True Value 2 IHOP 1 U-Haul 3 JCPenney 1 UPS 9 Jack In The Box 4 Verizon Wireless 1 Jones New York 1 Waffle House 1 KFC 1 Walgreens 6 Kmart 2 Wendy's 1 Lane Bryant 1 White Castle 2
Strongest AM radio stations in Florissant:
KXEN (1010 AM; 50 kW; FESTUS-ST. LOUIS, MO; Owner: BDJ RADIO ENTERPRISES, LLC)
KMOX (1120 AM; 50 kW; ST. LOUIS, MO; Owner: INFINITY BROADCASTING OPERATIONS, INC.)
KIRL (1460 AM; 5 kW; ST. CHARLES, MO; Owner: BRONCO BROADCASTING CO., INC.)
KFUO (850 AM; 5 kW; CLAYTON, MO; Owner: LUTHERAN CHURCH-MISSOURI SYNOD)
KTRS (550 AM; 5 kW; ST. LOUIS, MO; Owner: KTRS-AM LICENSE, L.L.C.)
KJSL (630 AM; 5 kW; ST. LOUIS, MO; Owner: WMUZ RADIO, INC.)
KRFT (1190 AM; 10 kW; DE SOTO, MO; Owner: ALL SPORTS RADIO, LLC)
KSIV (1320 AM; 5 kW; CLAYTON, MO; Owner: BOTT COMMUNICATIONS, INC.)
WSDZ (1260 AM; 20 kW; BELLEVILLE, IL)
KATZ (1600 AM; 5 kW; ST. LOUIS, MO; Owner: CITICASTERS LICENSES, L.P.)
KSLG (1380 AM; 5 kW; ST. LOUIS, MO; Owner: NEW HORIZON 7TH-DAY CHRISTIAN CHURCH, INC.)
WRTH (1430 AM; 5 kW; ST. LOUIS, MO)
KFNS (590 AM; 1 kW; WOOD RIVER, IL; Owner: MISSOURI SPORTS RADIO, LLC)
Strongest FM radio stations in Florissant:
WFUN-FM (95.5 FM; BETHALTO, IL; Owner: RADIO ONE LICENSES, LLC)
WMLL (104.1 FM; JERSEYVILLE, IL; Owner: EMMIS RADIO LICENSE CORPORATION)
KCFV (89.5 FM; FERGUSON, MO; Owner: ST. LOUIS COMMUNITY COLLEGE)
KEZK-FM (102.5 FM; ST. LOUIS, MO; Owner: INFINITY RADIO SUBSIDIARY OPERATIONS INC.)
KIHT (96.3 FM; ST. LOUIS, MO; Owner: EMMIS RADIO LICENSE CORPORATION)
KSIV-FM (91.5 FM; ST. LOUIS, MO; Owner: COMMUNITY BROADCASTING, INC.)
KWMU (90.7 FM; ST. LOUIS, MO; Owner: THE CURATORS OF THE UNIVERSITY OF MISSOURI)
KSLZ (107.7 FM; ST. LOUIS, MO; Owner: CITICASTERS LICENSES, L.P.)
KFUO-FM (99.1 FM; CLAYTON, MO; Owner: THE LUTHERAN CHURCH-MISSOURI SYNOD)
KYKY (98.1 FM; ST. LOUIS, MO; Owner: INFINITY RADIO SUBSIDIARY OPERATIONS INC.)
WSSM (106.5 FM; GRANITE CITY, IL; Owner: BONNEVILLE HOLDING COMPANY)
KSHE (94.7 FM; CRESTWOOD, MO; Owner: EMMIS RADIO LICENSE CORPORATION)
KSD (93.7 FM; ST. LOUIS, MO; Owner: CITICASTERS LICENSES, L.P.)
WSIE (88.7 FM; EDWARDSVILLE, IL; Owner: BOARD OF TRUSTEES, S. ILLINOIS UNIV.)
KATZ-FM (100.3 FM; ALTON, IL; Owner: CITICASTERS LICENSES, L.P.)
WVRV (101.1 FM; EAST ST. LOUIS, IL; Owner: BONNEVILLE HOLDING COMPANY)
KLOU (103.3 FM; ST. LOUIS, MO; Owner: CITICASTERS LICENSES, L.P.)
WIL-FM (92.3 FM; ST. LOUIS, MO; Owner: BONNEVILLE HOLDING COMPANY)
KFTK-FM1 (97.1 FM; ST. LOUIS, MO; Owner: EMMIS RADIO LICENSE CORPORATION)
WLCA (89.9 FM; GODFREY, IL; Owner: LEWIS & CLARK COMMUNITY COLLEGE)
TV broadcast stations around Florissant:
KSDK (Channel 5; ST. LOUIS, MO; Owner: MULTIMEDIA KSDK, INC.)
KPLR-TV (Channel 11; ST. LOUIS, MO; Owner: KPLR, INC.)
KDNL-TV (Channel 30; ST. LOUIS, MO; Owner: KDNL LICENSEE, LLC)
KTVI (Channel 2; ST. LOUIS, MO; Owner: KTVI LICENSE, INC.)
KPTN-LP (Channel 58; ST. LOUIS, MO; Owner: KURT J. PETERSEN)
K40FF (Channel 40; ST. LOUIS, MO; Owner: EBC ST. LOUIS, INC.)
KMOV (Channel 4; ST. LOUIS, MO; Owner: KMOV-TV, INC.)
KETC (Channel 9; ST. LOUIS, MO; Owner: ST. LOUIS REGIONAL & EDUCATIONAL PUBLIC TV COMMISSION)
K49FC (Channel 49; ST. LOUIS, MO; Owner: THREE ANGELS BROADCASTING NETWORK)
K64DT (Channel 64; ST. LOUIS, MO; Owner: WORD OF GOD FELLOWSHIP, INC.)
K18BT (Channel 18; ST. LOUIS, MO; Owner: TRINITY BROADCASTING NETWORK)
K65FN (Channel 65; BATESVILLE, AR; Owner: MS COMMUNICATIONS, LLC)
WRBU (Channel 46; EAST ST. LOUIS, IL; Owner: ROBERTS BROADCASTING COMPANY)
K59GP (Channel 59; ST. CHARLES, MO; Owner: TRINITY BROADCASTING NETWORK)
KNLC (Channel 24; ST. LOUIS, MO; Owner: NEW LIFE EVANGELISTIC CENTER, INC.)
K63FW (Channel 63; JAMESTOWN, MO; Owner: ROGER E. HARDERS)
K38HD (Channel 38; ST. LOUIS, MO; Owner: VENTANA TELEVISION, INC.)
K62EG (Channel 62; ST. LOUIS, MO; Owner: ETERNAL FAMILY NETWORK)
W50CH (Channel 50; ALTON, IL; Owner: LIBERTY CHRISTIAN CENTER)
National Bridge Inventory (NBI) Statistics 48 Number of bridges338ft / 103m Total length $6,665,000 Total costs948,983 Total average daily traffic112,205 Total average daily truck traffic
New bridges - historical statistics
2 1930-1939 3 1950-1959 11 1960-1969 1 1970-1979 4 1980-1989 11 1990-1999 7 2000-2009 4 2010-2019 5 2020-2022
See full National Bridge Inventory statistics for Florissant, MO
Home Mortgage Disclosure Act Aggregated Statistics For Year 2009(Based on 2 full and 9 partial tracts) A) FHA, FSA/RHS & VA B) Conventional C) Refinancings D) Home Improvement Loans E) Loans on Dwellings For 5+ Families F) Non-occupant Loans on G) Loans On Manufactured Number Average Value Number Average Value Number Average Value Number Average Value Number Average Value Number Average Value Number Average Value
LOANS ORIGINATED 329 $103,295 155 $67,246 917 $109,066 39 $32,423 2 $233,780 99 $75,953 1 $78,100 APPLICATIONS APPROVED, NOT ACCEPTED 15 $107,915 5 $88,770 104 $114,805 9 $32,219 0 $0 4 $71,125 0 $0 APPLICATIONS DENIED 49 $107,590 28 $71,778 372 $113,672 46 $23,441 0 $0 23 $67,960 1 $13,520 APPLICATIONS WITHDRAWN 32 $95,843 12 $86,847 224 $116,356 11 $40,922 0 $0 9 $73,416 0 $0 FILES CLOSED FOR INCOMPLETENESS 6 $92,362 3 $62,540 68 $114,949 4 $101,458 0 $0 4 $65,695 0 $0
Aggregated Statistics For Year 2008(Based on 2 full and 9 partial tracts) A) FHA, FSA/RHS & VA B) Conventional C) Refinancings D) Home Improvement Loans E) Loans on Dwellings For 5+ Families F) Non-occupant Loans on G) Loans On Manufactured Number Average Value Number Average Value Number Average Value Number Average Value Number Average Value Number Average Value Number Average Value
LOANS ORIGINATED 274 $112,864 225 $88,226 787 $110,030 82 $37,197 4 $732,148 164 $79,025 1 $15,470 APPLICATIONS APPROVED, NOT ACCEPTED 15 $141,078 20 $92,504 125 $109,662 16 $32,701 0 $0 10 $74,424 0 $0 APPLICATIONS DENIED 48 $123,842 65 $98,058 538 $121,337 147 $34,612 1 $790,450 37 $94,290 5 $47,212 APPLICATIONS WITHDRAWN 18 $118,999 27 $112,662 243 $116,949 22 $67,809 0 $0 20 $80,364 1 $83,800 FILES CLOSED FOR INCOMPLETENESS 6 $144,222 11 $109,895 71 $115,141 7 $68,980 0 $0 6 $93,353 0 $0
Aggregated Statistics For Year 2007(Based on 2 full and 9 partial tracts) A) FHA, FSA/RHS & VA B) Conventional C) Refinancings D) Home Improvement Loans E) Loans on Dwellings For 5+ Families F) Non-occupant Loans on G) Loans On Manufactured Number Average Value Number Average Value Number Average Value Number Average Value Number Average Value Number Average Value Number Average Value
LOANS ORIGINATED 99 $121,644 710 $103,322 1,089 $104,885 150 $39,010 1 $732,870 205 $87,630 2 $31,275 APPLICATIONS APPROVED, NOT ACCEPTED 5 $144,910 81 $104,649 224 $109,805 39 $36,275 0 $0 15 $79,213 1 $58,480 APPLICATIONS DENIED 20 $119,277 175 $109,988 778 $114,666 213 $46,703 0 $0 56 $84,926 12 $46,046 APPLICATIONS WITHDRAWN 10 $122,835 72 $92,453 298 $115,062 43 $82,028 0 $0 15 $120,320 1 $98,590 FILES CLOSED FOR INCOMPLETENESS 3 $121,037 30 $110,970 102 $121,950 8 $70,218 0 $0 6 $88,910 0 $0
Aggregated Statistics For Year 2006(Based on 2 full and 9 partial tracts) A) FHA, FSA/RHS & VA B) Conventional C) Refinancings D) Home Improvement Loans E) Loans on Dwellings For 5+ Families F) Non-occupant Loans on G) Loans On Manufactured Number Average Value Number Average Value Number Average Value Number Average Value Number Average Value Number Average Value Number Average Value
LOANS ORIGINATED 137 $118,501 1,011 $91,646 1,290 $97,454 171 $45,070 5 $4,112,504 252 $85,614 3 $79,527 APPLICATIONS APPROVED, NOT ACCEPTED 6 $129,372 159 $93,160 293 $101,547 38 $25,795 0 $0 42 $84,643 3 $34,100 APPLICATIONS DENIED 15 $124,121 278 $99,735 838 $107,483 186 $42,342 0 $0 47 $86,017 2 $75,800 APPLICATIONS WITHDRAWN 12 $104,968 146 $96,797 493 $104,051 43 $80,221 0 $0 27 $83,692 0 $0 FILES CLOSED FOR INCOMPLETENESS 4 $119,002 50 $99,414 176 $110,399 4 $19,078 0 $0 12 $84,623 0 $0
Aggregated Statistics For Year 2005(Based on 2 full and 9 partial tracts) A) FHA, FSA/RHS & VA B) Conventional C) Refinancings D) Home Improvement Loans E) Loans on Dwellings For 5+ Families F) Non-occupant Loans on G) Loans On Manufactured Number Average Value Number Average Value Number Average Value Number Average Value Number Average Value Number Average Value Number Average Value
LOANS ORIGINATED 169 $112,502 1,040 $86,881 1,568 $94,110 157 $46,482 1 $5,346,650 225 $82,257 2 $78,095 APPLICATIONS APPROVED, NOT ACCEPTED 6 $101,557 138 $86,420 270 $96,543 40 $32,442 0 $0 22 $86,774 5 $59,570 APPLICATIONS DENIED 13 $125,080 302 $88,018 872 $100,437 165 $32,203 0 $0 59 $85,915 5 $49,356 APPLICATIONS WITHDRAWN 9 $108,709 172 $99,034 731 $105,355 67 $117,873 1 $1,162,070 48 $89,426 1 $98,580 FILES CLOSED FOR INCOMPLETENESS 1 $84,550 39 $87,975 155 $109,055 11 $73,869 0 $0 10 $97,052 0 $0
Aggregated Statistics For Year 2004(Based on 2 full and 9 partial tracts) A) FHA, FSA/RHS & VA B) Conventional C) Refinancings D) Home Improvement Loans E) Loans on Dwellings For 5+ Families F) Non-occupant Loans on G) Loans On Manufactured Number Average Value Number Average Value Number Average Value Number Average Value Number Average Value Number Average Value Number Average Value
LOANS ORIGINATED 235 $107,890 830 $89,647 1,628 $89,141 106 $36,331 2 $2,297,835 163 $77,784 1 $36,460 APPLICATIONS APPROVED, NOT ACCEPTED 6 $111,033 148 $84,425 299 $89,649 28 $37,822 0 $0 20 $57,429 3 $63,213 APPLICATIONS DENIED 15 $99,937 180 $93,833 738 $91,565 116 $30,688 0 $0 33 $79,604 10 $38,871 APPLICATIONS WITHDRAWN 13 $111,550 81 $95,088 559 $95,946 31 $58,560 0 $0 14 $76,859 0 $0 FILES CLOSED FOR INCOMPLETENESS 3 $90,973 27 $90,303 99 $99,067 5 $39,544 0 $0 8 $79,418 0 $0
Aggregated Statistics For Year 2003(Based on 2 full and 9 partial tracts) A) FHA, FSA/RHS & VA B) Conventional C) Refinancings D) Home Improvement Loans F) Non-occupant Loans on Number Average Value Number Average Value Number Average Value Number Average Value Number Average Value
LOANS ORIGINATED 289 $98,905 652 $88,525 3,112 $82,433 87 $15,148 166 $65,346 APPLICATIONS APPROVED, NOT ACCEPTED 11 $97,414 93 $86,202 393 $86,029 25 $34,930 16 $74,583 APPLICATIONS DENIED 33 $96,714 136 $82,474 828 $86,065 94 $21,119 29 $61,691 APPLICATIONS WITHDRAWN 22 $98,444 83 $96,417 593 $87,505 11 $24,900 24 $74,440 FILES CLOSED FOR INCOMPLETENESS 4 $84,298 29 $89,375 148 $85,962 2 $42,750 6 $68,453
Detailed mortgage data for all 11 tracts in Florissant, MO
Private Mortgage Insurance Companies Aggregated Statistics For Year 2009(Based on 2 full and 9 partial tracts) A) Conventional B) Refinancings C) Non-occupant Loans on Number Average Value Number Average Value Number Average Value
LOANS ORIGINATED 21 $96,527 29 $117,130 0 $0 APPLICATIONS APPROVED, NOT ACCEPTED 13 $93,425 14 $131,900 1 $78,130 APPLICATIONS DENIED 2 $57,245 4 $114,722 1 $42,000 APPLICATIONS WITHDRAWN 1 $134,000 2 $175,345 0 $0 FILES CLOSED FOR INCOMPLETENESS 1 $164,790 1 $112,760 0 $0
Aggregated Statistics For Year 2008(Based on 2 full and 9 partial tracts) A) Conventional B) Refinancings C) Non-occupant Loans on Number Average Value Number Average Value Number Average Value
LOANS ORIGINATED 103 $98,356 66 $127,150 19 $78,068 APPLICATIONS APPROVED, NOT ACCEPTED 40 $118,608 34 $137,358 5 $77,910 APPLICATIONS DENIED 9 $99,432 4 $134,770 4 $81,532 APPLICATIONS WITHDRAWN 5 $107,610 1 $104,370 0 $0 FILES CLOSED FOR INCOMPLETENESS 5 $90,076 2 $101,735 4 $95,968
Aggregated Statistics For Year 2007(Based on 2 full and 9 partial tracts) A) Conventional B) Refinancings C) Non-occupant Loans on Number Average Value Number Average Value Number Average Value
LOANS ORIGINATED 332 $115,216 161 $124,580 33 $85,957 APPLICATIONS APPROVED, NOT ACCEPTED 39 $118,499 36 $119,322 5 $87,184 APPLICATIONS DENIED 5 $122,534 9 $119,020 6 $116,060 APPLICATIONS WITHDRAWN 12 $112,297 15 $123,846 4 $75,008 FILES CLOSED FOR INCOMPLETENESS 3 $110,200 3 $82,617 1 $90,000
Aggregated Statistics For Year 2006(Based on 2 full and 9 partial tracts) A) Conventional B) Refinancings C) Non-occupant Loans on Number Average Value Number Average Value Number Average Value
LOANS ORIGINATED 226 $116,137 104 $116,834 19 $87,535 APPLICATIONS APPROVED, NOT ACCEPTED 24 $122,393 33 $108,071 4 $87,370 APPLICATIONS DENIED 1 $125,940 2 $120,455 0 $0 APPLICATIONS WITHDRAWN 11 $128,075 6 $112,105 2 $55,610 FILES CLOSED FOR INCOMPLETENESS 1 $185,710 0 $0 1 $174,960
Aggregated Statistics For Year 2005(Based on 2 full and 9 partial tracts) A) Conventional B) Refinancings C) Non-occupant Loans on Number Average Value Number Average Value Number Average Value
LOANS ORIGINATED 194 $107,137 143 $116,513 24 $82,695 APPLICATIONS APPROVED, NOT ACCEPTED 31 $98,495 34 $110,871 4 $65,990 APPLICATIONS DENIED 2 $106,530 1 $84,390 1 $72,780 APPLICATIONS WITHDRAWN 7 $112,334 12 $111,510 0 $0 FILES CLOSED FOR INCOMPLETENESS 2 $103,860 2 $108,355 1 $106,060
Aggregated Statistics For Year 2004(Based on 2 full and 9 partial tracts) A) Conventional B) Refinancings C) Non-occupant Loans on Number Average Value Number Average Value Number Average Value
LOANS ORIGINATED 210 $103,792 184 $102,204 32 $72,922 APPLICATIONS APPROVED, NOT ACCEPTED 25 $105,466 47 $106,309 3 $62,327 APPLICATIONS DENIED 1 $166,970 3 $89,410 1 $71,830 APPLICATIONS WITHDRAWN 11 $97,193 30 $99,774 4 $83,618 FILES CLOSED FOR INCOMPLETENESS 5 $122,804 3 $75,703 0 $0
Aggregated Statistics For Year 2003(Based on 2 full and 9 partial tracts) A) Conventional B) Refinancings C) Non-occupant Loans on Number Average Value Number Average Value Number Average Value
LOANS ORIGINATED 256 $91,909 371 $95,830 26 $64,106 APPLICATIONS APPROVED, NOT ACCEPTED 30 $85,484 89 $97,063 7 $54,556 APPLICATIONS DENIED 1 $55,990 3 $82,090 1 $26,350 APPLICATIONS WITHDRAWN 7 $88,037 24 $102,867 2 $63,640 FILES CLOSED FOR INCOMPLETENESS 1 $81,150 1 $91,370 0 $0
Fire-safe hotels and motels in Florissant, Missouri:
Red Roof Inn, 307 Dunn Rd, Florissant, Missouri 63031 Phone: (314) 831-7900, Fax: (314) 831-1278
Hampton Inn St. Louis NW-Florissant/Hazelwood, 55 Dunn Rd, Florissant, Missouri 63031 Phone: (314) 839-2200, Fax: (314) 830-1878
All 2 fire-safe hotels and motels in Florissant, Missouri
Most common first names in Florissant, MO among deceased individuals Name Count Lived (average)
Mary 703 79.1 years John 648 73.8 years William 610 74.0 years Robert 493 70.9 years James 411 70.7 years Joseph 410 75.8 years Dorothy 371 77.3 years Helen 366 80.6 years Charles 339 74.1 years Margaret 299 80.6 years
Most common last names in Florissant, MO among deceased individuals Last name Count Lived (average)
Smith 207 74.0 years Williams 130 75.4 years Johnson 130 75.0 years Meyer 122 78.1 years Jones 111 76.0 years Davis 107 76.6 years Miller 104 76.5 years Brown 102 71.4 years Wilson 72 75.8 years Moore 64 73.6 years
Florissant compared to Missouri state average:
Median house value below state average. Unemployed percentage significantly below state average. Black race population percentage significantly above state average. Hispanic race population percentage below state average. Median age above state average. Length of stay since moving in significantly above state average. Florissant on our top lists :
#4 on the list of "Top 101 cities with the highest percentage of English-only speaking households, population 50,000+"
#9 on the list of "Top 101 cities with the smallest house values disparities (population 50,000+)"
#10 on the list of "Top 100 cities with lowest ratio of median house value to median household income (pop. 50,000+)"
#16 on the list of "Top 101 cities with largest percentage of females in occupations: office and administrative support occupations (population 50,000+)"
#16 on the list of "Top 101 cities with the largest percentage of elementary and middle school students in private schools (5,000+ students)"
#21 on the list of "Top 101 cities with largest percentage of males in occupations: healthcare support occupations (population 50,000+)"
#34 on the list of "Top 101 cities with the largest percentage of one, detached housing units in structures (20,000+ housing units)"
#35 on the list of "Top 100 cities with the largest percentage of females (pop. 50,000+)"
#37 on the list of "Top 101 cities with the most people born in the same U.S. state as the city (population 50,000+)"
#40 on the list of "Top 101 cities with largest percentage of males in industries: retail trade (population 50,000+)"
#40 on the list of "Top 101 cities with the smallest household incomes disparities (population 50,000+)"
#43 on the list of "Top 101 cities with the smallest percentage of likely homosexual households (counted as self-reported same-sex unmarried-partner households) (population 50,000+)"
#45 on the list of "Top 101 cities with the lowest number of rapes per 100,000 residents (population 50,000+)"
#48 on the list of "Top 101 cities with fewest building permits per 10,000 residents (population 50,000+)"
#71 on the list of "Top 101 cities with largest percentage of females in occupations: community and social service occupations (population 50,000+)"
#73 on the list of "Top 101 cities with largest percentage of males in industries: arts, entertainment, and recreation (population 50,000+)"
#76 on the list of "Top 101 cities with largest percentage of males in occupations: transportation occupations (population 50,000+)"
#78 on the list of "Top 101 cities with the smallest city-data.com crime index per police officer (population 50,000+)"
#78 on the list of "Top 101 cities with the largest wind speed differences during a year (population 50,000+)"
#79 on the list of "Top 101 cities with the lowest number of arson incidents per 100,000 residents (population 50,000+)"
#27 on the list of "Top 101 counties with the highest surface withdrawal of fresh water for public supply"
#27 on the list of "Top 101 counties with the most Catholic congregations"
#34 on the list of "Top 101 counties with the most Mainline Protestant adherents"
#36 on the list of "Top 101 counties with the most Evangelical Protestant adherents"
#39 on the list of "Top 101 counties with the highest total withdrawal of fresh water for public supply (pop. 50,000+)"
Top Patent Applicants
Bobby N. Trawick (17)
Mark Joseph Fanning (11)
Neal A. Froeschner (9)
Anil Ramachandran (7)
Allan J. Reifel (7)
Keith G. Tomazi (7)
James R. Fox (6)
Mark Ulrich (6)
Joseph S. Silkey (6)
Donald E. Morgan (6)
Total of 336 patent applications in 2008-2024.
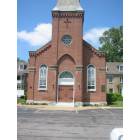
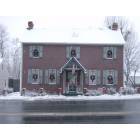


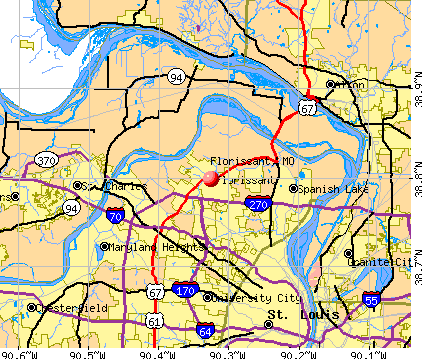


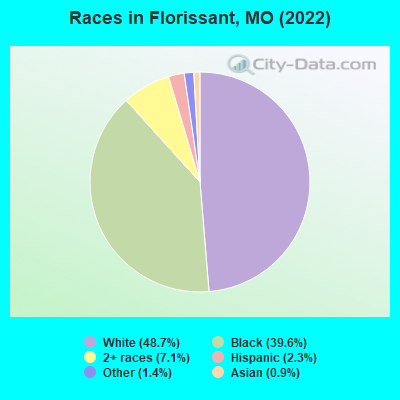
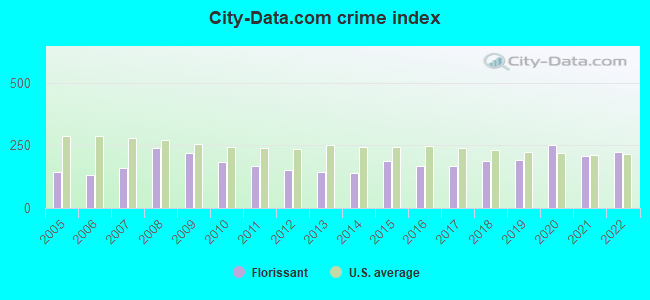
 Recent articles from our blog. Our writers, many of them Ph.D. graduates or candidates, create easy-to-read articles on a wide variety of topics.


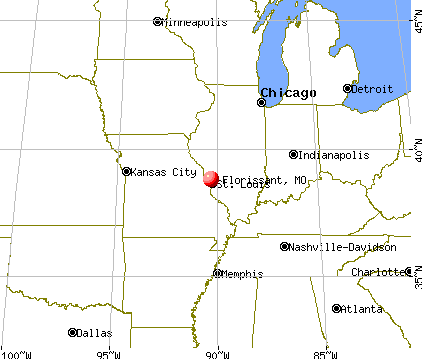
 (12.6 miles
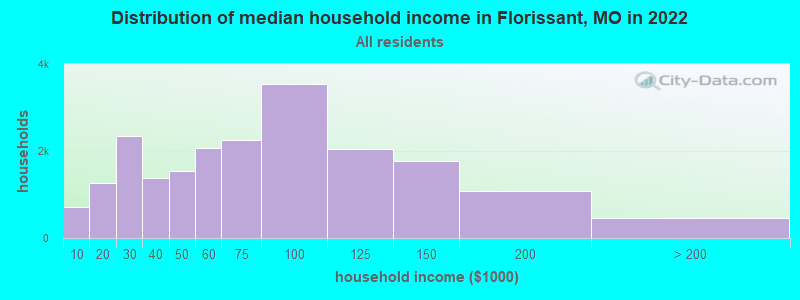
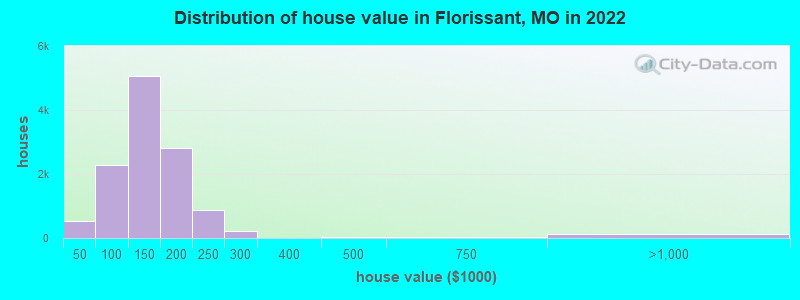
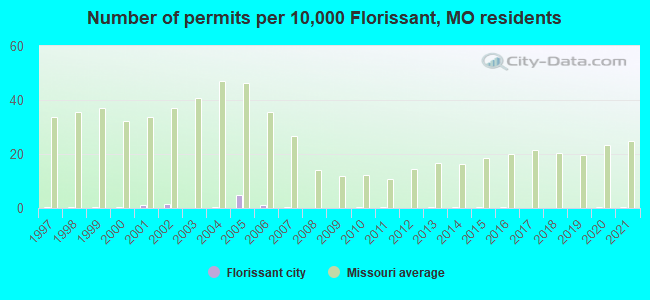
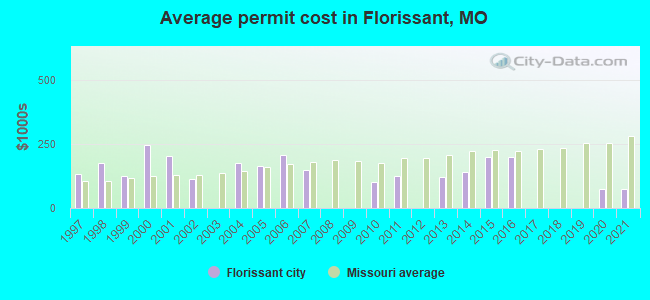
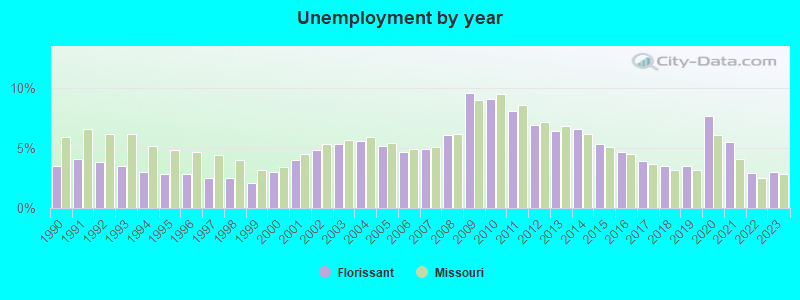
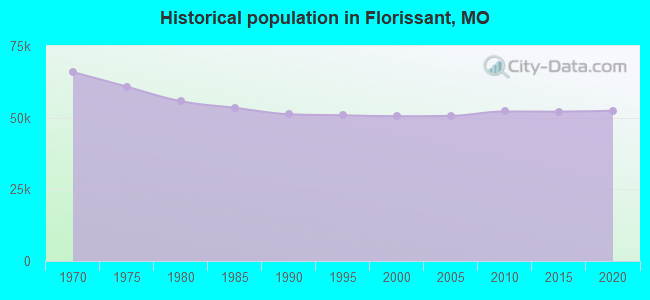
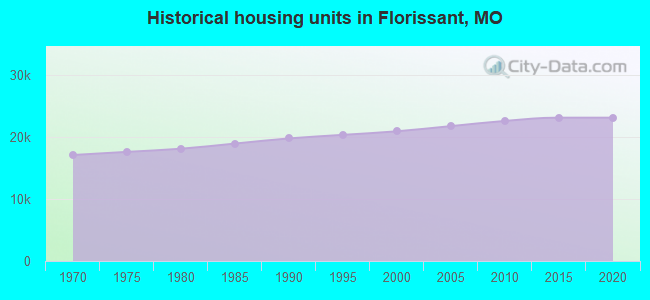
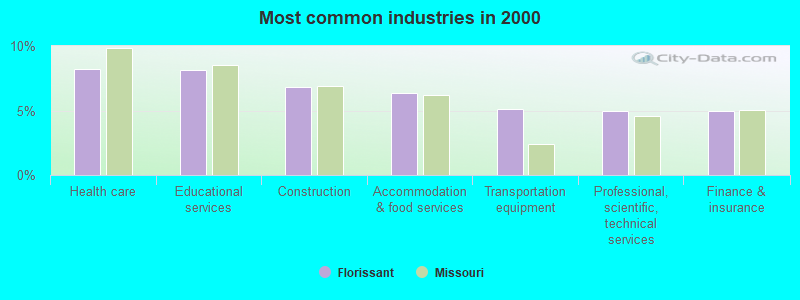
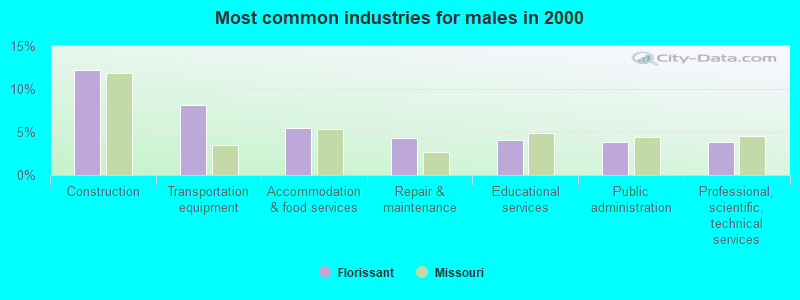
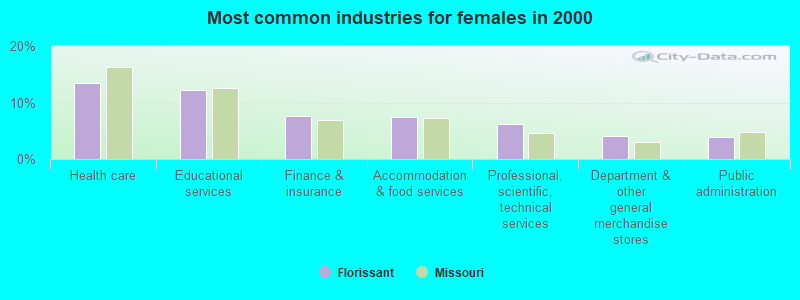
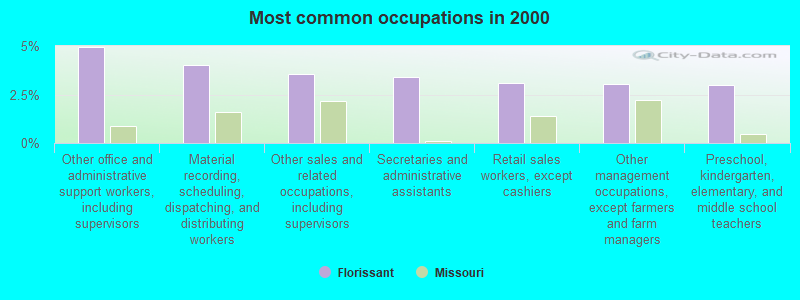
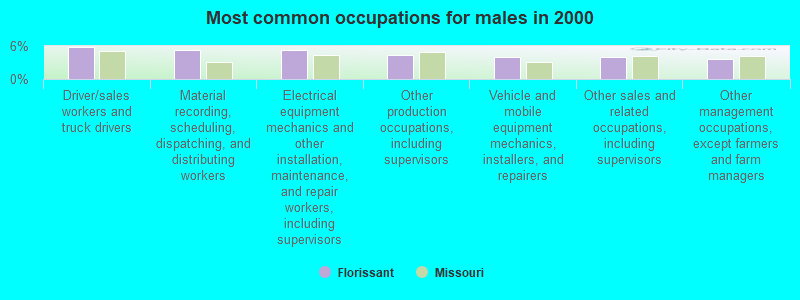
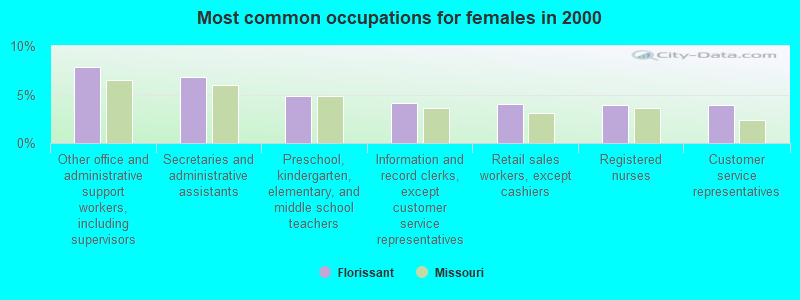
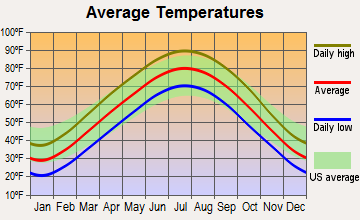
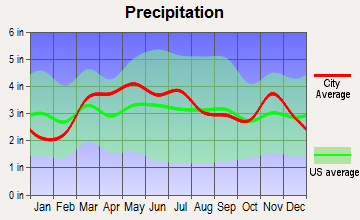
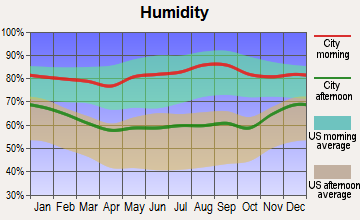
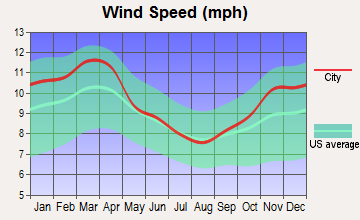
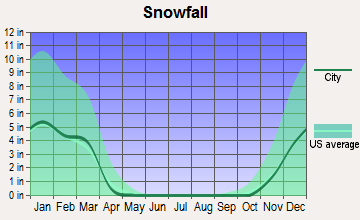
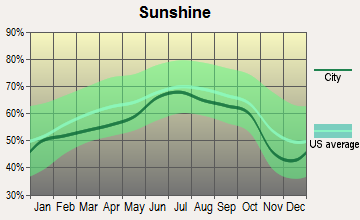
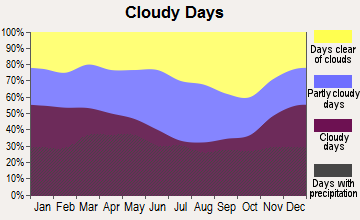
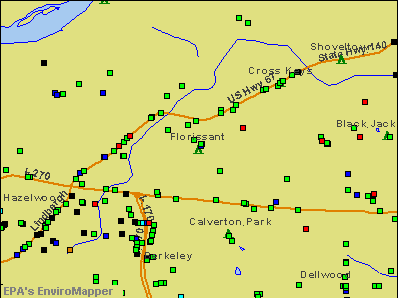

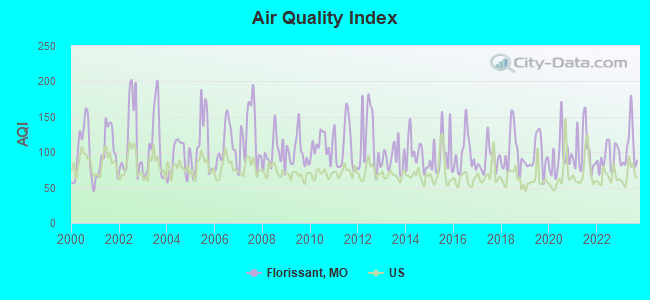
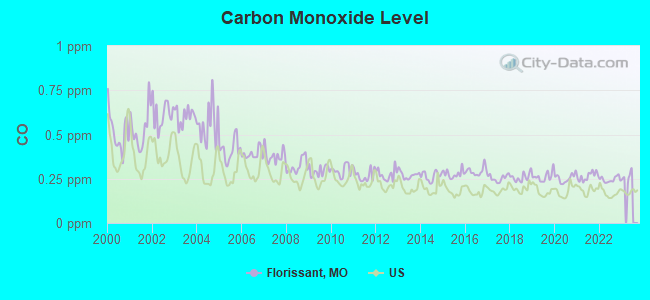
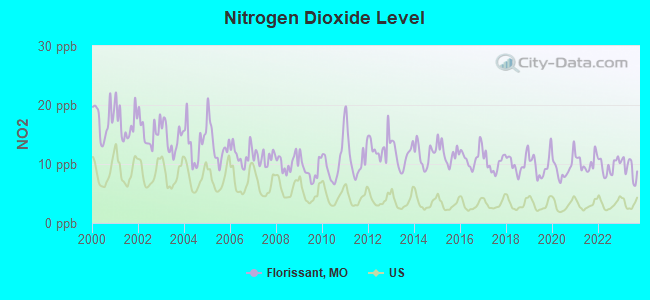
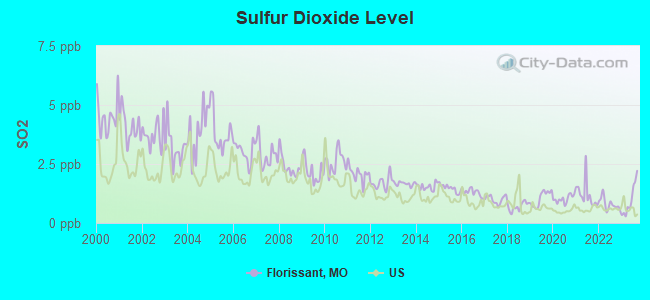
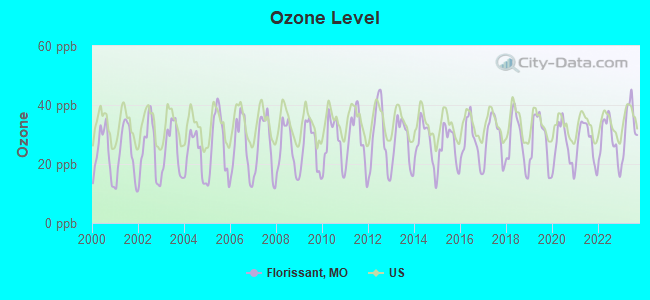
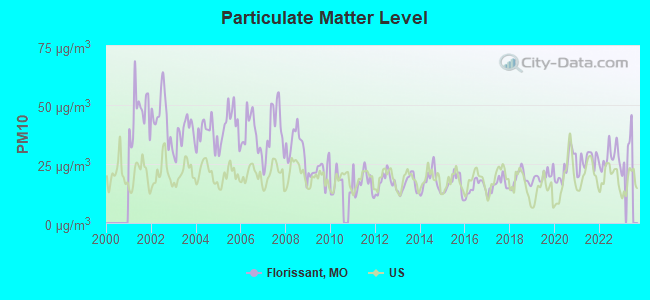
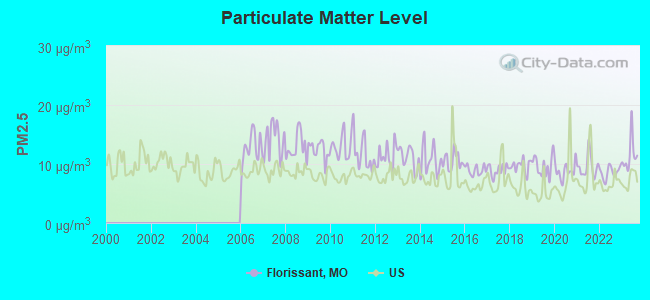
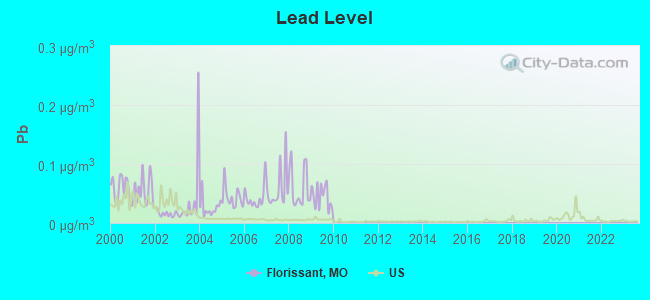
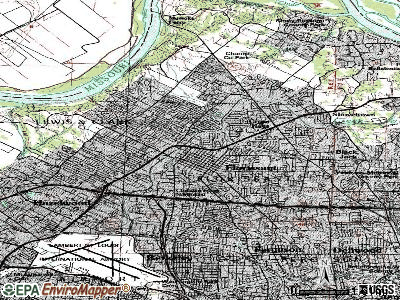
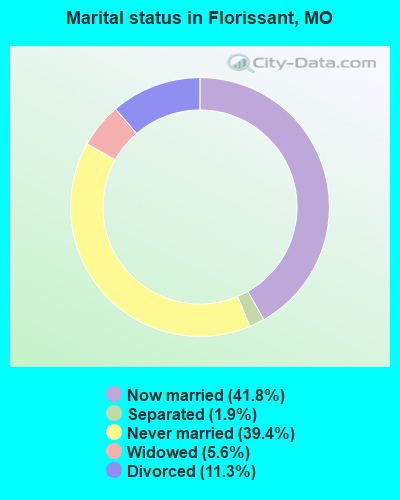
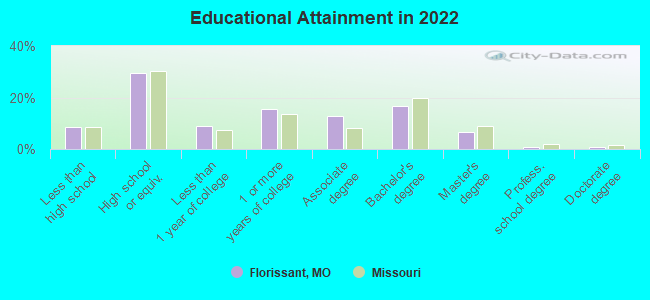
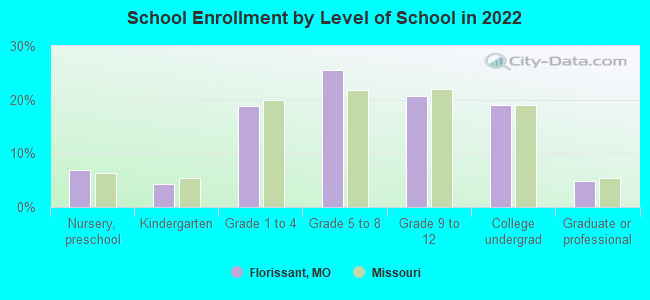
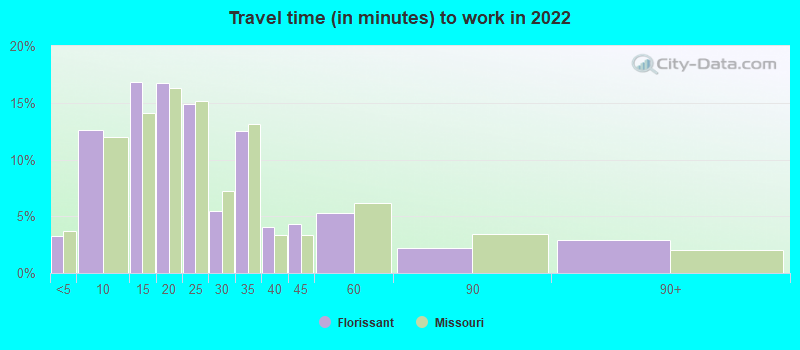
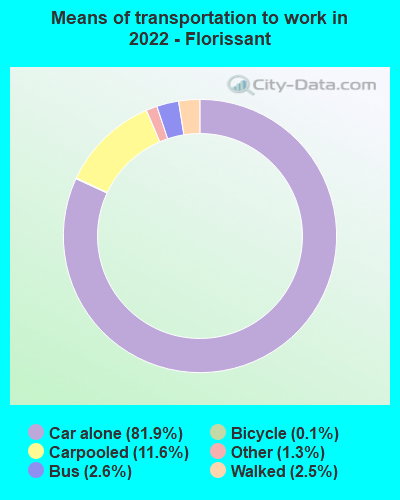
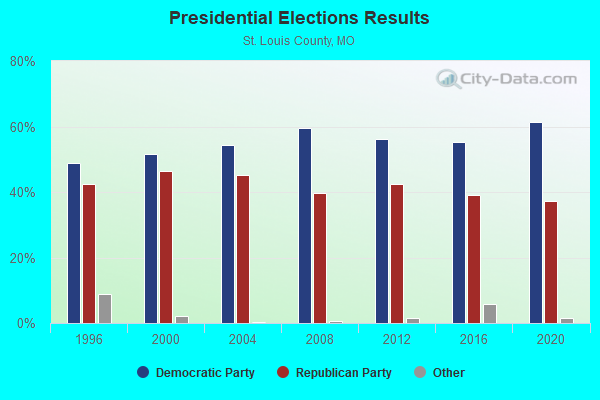
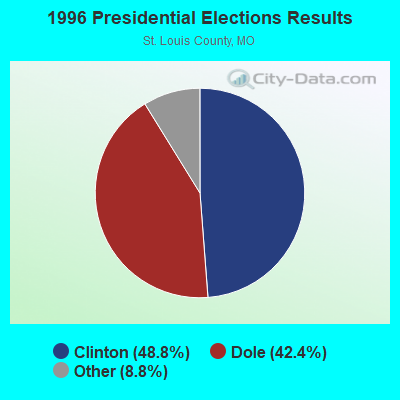
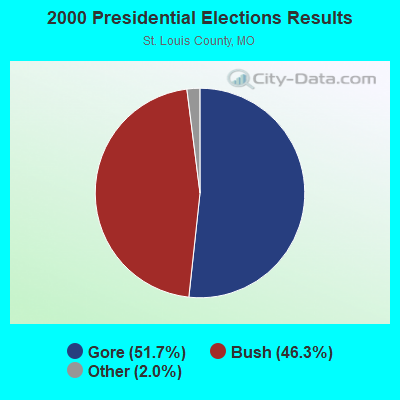
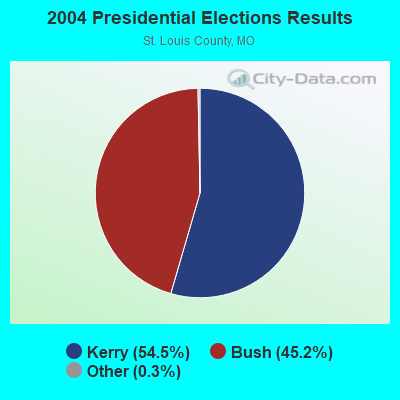
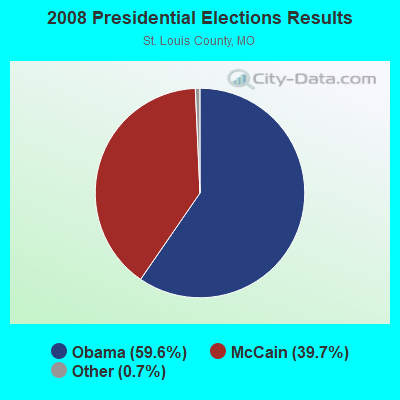
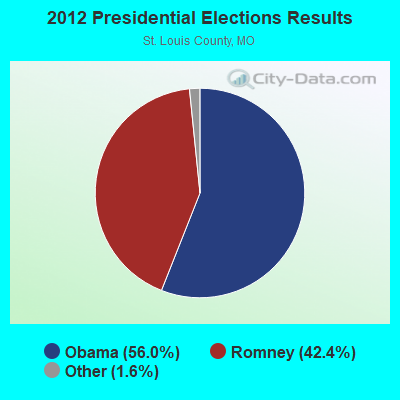
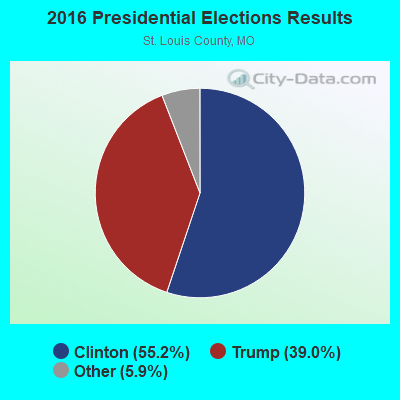
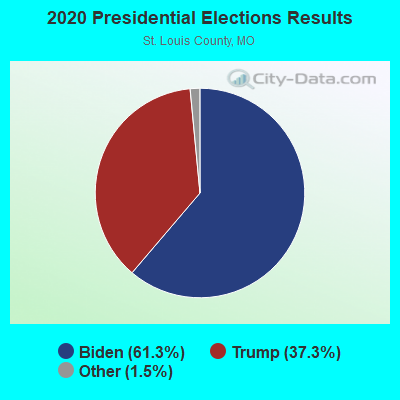
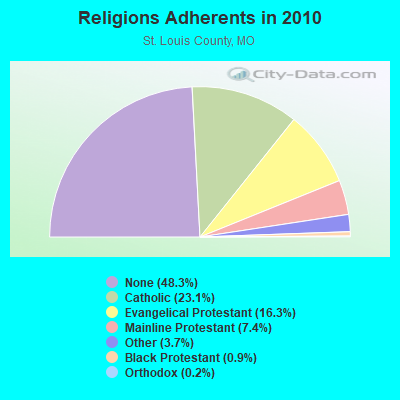
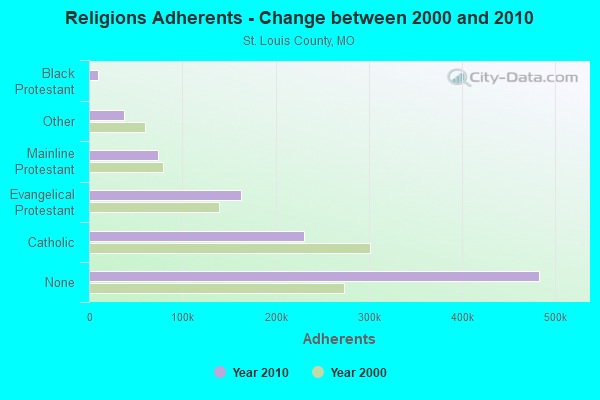
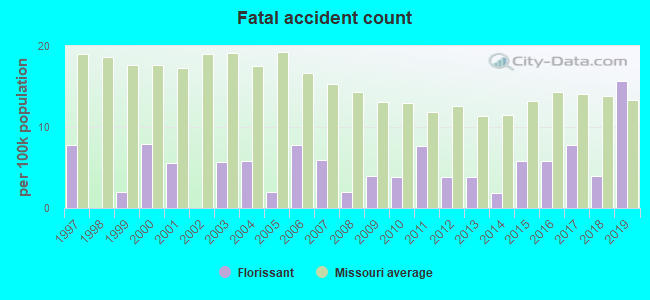
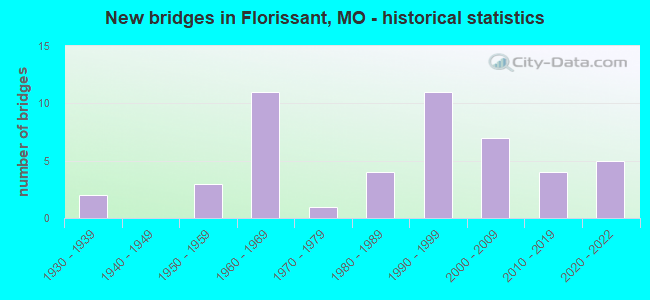
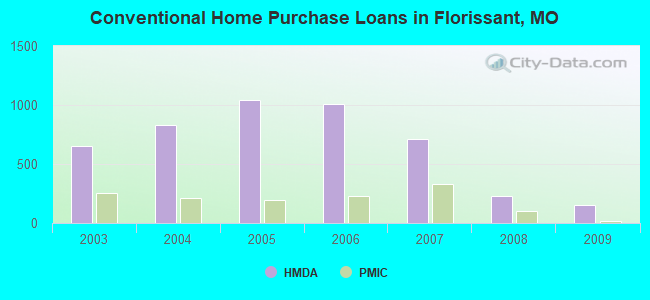
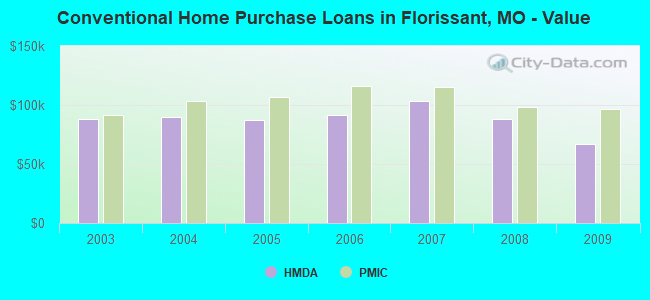
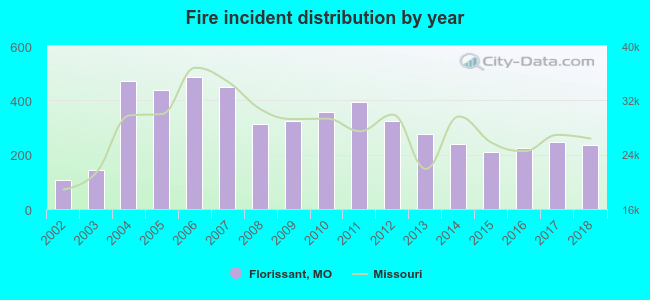 According to the data from the years 2002 - 2018 the average number of fire incidents per year is 308. The highest number of reported fire incidents - 485 took place in 2006, and the least - 108 in 2002. The data has a growing trend.
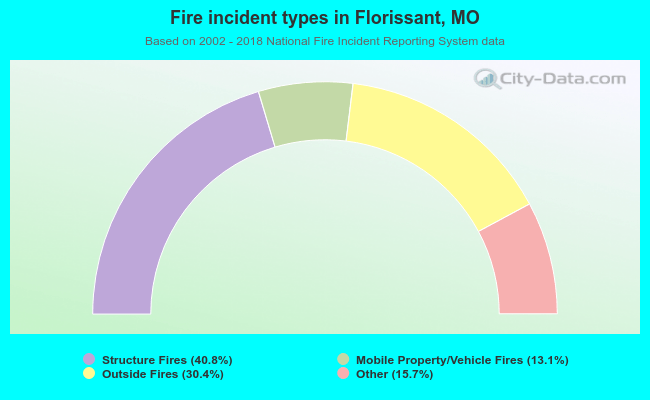 When looking into fire subcategories, the most reports belonged to: Structure Fires (40.8%), and Outside Fires (30.4%).