Foxborough, Massachusetts Submit your own pictures of this place and show them to the world
OSM Map
General Map
Google Map
MSN Map
OSM Map
General Map
Google Map
MSN Map
OSM Map
General Map
Google Map
MSN Map
OSM Map
General Map
Google Map
MSN Map
Please wait while loading the map...
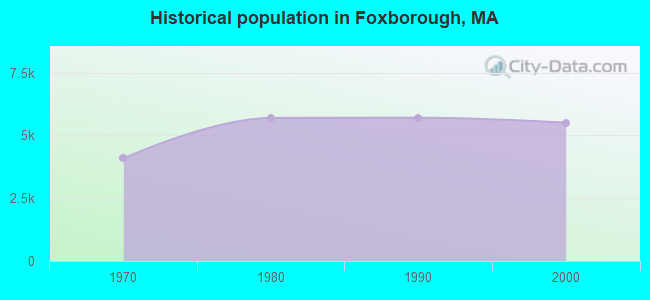
Population in 2010: 5,625. Population change since 2000: +2.1%Males: 2,531 Females: 3,094
March 2022 cost of living index in Foxborough: 136.6 (high, U.S. average is 100) Percentage of residents living in poverty in 2022: 9.5%
Profiles of local businesses
Business Search - 14 Million verified businesses
Data:
Median household income ($)
Median household income (% change since 2000)
Household income diversity
Ratio of average income to average house value (%)
Ratio of average income to average rent
Median household income ($) - White
Median household income ($) - Black or African American
Median household income ($) - Asian
Median household income ($) - Hispanic or Latino
Median household income ($) - American Indian and Alaska Native
Median household income ($) - Multirace
Median household income ($) - Other Race
Median household income for houses/condos with a mortgage ($)
Median household income for apartments without a mortgage ($)
Races - White alone (%)
Races - White alone (% change since 2000)
Races - Black alone (%)
Races - Black alone (% change since 2000)
Races - American Indian alone (%)
Races - American Indian alone (% change since 2000)
Races - Asian alone (%)
Races - Asian alone (% change since 2000)
Races - Hispanic (%)
Races - Hispanic (% change since 2000)
Races - Native Hawaiian and Other Pacific Islander alone (%)
Races - Native Hawaiian and Other Pacific Islander alone (% change since 2000)
Races - Two or more races (%)
Races - Two or more races (% change since 2000)
Races - Other race alone (%)
Races - Other race alone (% change since 2000)
Racial diversity
Unemployment (%)
Unemployment (% change since 2000)
Unemployment (%) - White
Unemployment (%) - Black or African American
Unemployment (%) - Asian
Unemployment (%) - Hispanic or Latino
Unemployment (%) - American Indian and Alaska Native
Unemployment (%) - Multirace
Unemployment (%) - Other Race
Population density (people per square mile)
Population - Males (%)
Population - Females (%)
Population - Males (%) - White
Population - Males (%) - Black or African American
Population - Males (%) - Asian
Population - Males (%) - Hispanic or Latino
Population - Males (%) - American Indian and Alaska Native
Population - Males (%) - Multirace
Population - Males (%) - Other Race
Population - Females (%) - White
Population - Females (%) - Black or African American
Population - Females (%) - Asian
Population - Females (%) - Hispanic or Latino
Population - Females (%) - American Indian and Alaska Native
Population - Females (%) - Multirace
Population - Females (%) - Other Race
Coronavirus confirmed cases (Apr 23, 2024)
Deaths caused by coronavirus (Apr 23, 2024)
Coronavirus confirmed cases (per 100k population) (Apr 23, 2024)
Deaths caused by coronavirus (per 100k population) (Apr 23, 2024)
Daily increase in number of cases (Apr 23, 2024)
Weekly increase in number of cases (Apr 23, 2024)
Cases doubled (in days) (Apr 23, 2024)
Hospitalized patients (Apr 18, 2022)
Negative test results (Apr 18, 2022)
Total test results (Apr 18, 2022)
COVID Vaccine doses distributed (per 100k population) (Sep 19, 2023)
COVID Vaccine doses administered (per 100k population) (Sep 19, 2023)
COVID Vaccine doses distributed (Sep 19, 2023)
COVID Vaccine doses administered (Sep 19, 2023)
Likely homosexual households (%)
Likely homosexual households (% change since 2000)
Likely homosexual households - Lesbian couples (%)
Likely homosexual households - Lesbian couples (% change since 2000)
Likely homosexual households - Gay men (%)
Likely homosexual households - Gay men (% change since 2000)
Cost of living index
Median gross rent ($)
Median contract rent ($)
Median monthly housing costs ($)
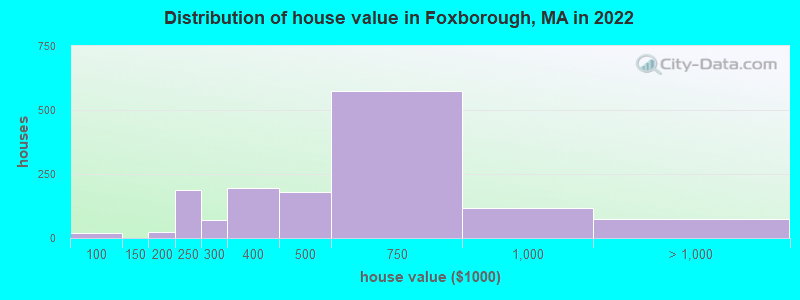
Median house or condo value ($)
Median house or condo value ($ change since 2000)
Mean house or condo value by units in structure - 1, detached ($)
Mean house or condo value by units in structure - 1, attached ($)
Mean house or condo value by units in structure - 2 ($)
Mean house or condo value by units in structure by units in structure - 3 or 4 ($)
Mean house or condo value by units in structure - 5 or more ($)
Mean house or condo value by units in structure - Boat, RV, van, etc. ($)
Mean house or condo value by units in structure - Mobile home ($)
Median house or condo value ($) - White
Median house or condo value ($) - Black or African American
Median house or condo value ($) - Asian
Median house or condo value ($) - Hispanic or Latino
Median house or condo value ($) - American Indian and Alaska Native
Median house or condo value ($) - Multirace
Median house or condo value ($) - Other Race
Median resident age
Resident age diversity
Median resident age - Males
Median resident age - Females
Median resident age - White
Median resident age - Black or African American
Median resident age - Asian
Median resident age - Hispanic or Latino
Median resident age - American Indian and Alaska Native
Median resident age - Multirace
Median resident age - Other Race
Median resident age - Males - White
Median resident age - Males - Black or African American
Median resident age - Males - Asian
Median resident age - Males - Hispanic or Latino
Median resident age - Males - American Indian and Alaska Native
Median resident age - Males - Multirace
Median resident age - Males - Other Race
Median resident age - Females - White
Median resident age - Females - Black or African American
Median resident age - Females - Asian
Median resident age - Females - Hispanic or Latino
Median resident age - Females - American Indian and Alaska Native
Median resident age - Females - Multirace
Median resident age - Females - Other Race
Commute - mean travel time to work (minutes)
Travel time to work - Less than 5 minutes (%)
Travel time to work - Less than 5 minutes (% change since 2000)
Travel time to work - 5 to 9 minutes (%)
Travel time to work - 5 to 9 minutes (% change since 2000)
Travel time to work - 10 to 19 minutes (%)
Travel time to work - 10 to 19 minutes (% change since 2000)
Travel time to work - 20 to 29 minutes (%)
Travel time to work - 20 to 29 minutes (% change since 2000)
Travel time to work - 30 to 39 minutes (%)
Travel time to work - 30 to 39 minutes (% change since 2000)
Travel time to work - 40 to 59 minutes (%)
Travel time to work - 40 to 59 minutes (% change since 2000)
Travel time to work - 60 to 89 minutes (%)
Travel time to work - 60 to 89 minutes (% change since 2000)
Travel time to work - 90 or more minutes (%)
Travel time to work - 90 or more minutes (% change since 2000)
Marital status - Never married (%)
Marital status - Now married (%)
Marital status - Separated (%)
Marital status - Widowed (%)
Marital status - Divorced (%)
Median family income ($)
Median family income (% change since 2000)
Median non-family income ($)
Median non-family income (% change since 2000)
Median per capita income ($)
Median per capita income (% change since 2000)
Median family income ($) - White
Median family income ($) - Black or African American
Median family income ($) - Asian
Median family income ($) - Hispanic or Latino
Median family income ($) - American Indian and Alaska Native
Median family income ($) - Multirace
Median family income ($) - Other Race
Median year house/condo built
Median year apartment built
Year house built - Built 2005 or later (%)
Year house built - Built 2000 to 2004 (%)
Year house built - Built 1990 to 1999 (%)
Year house built - Built 1980 to 1989 (%)
Year house built - Built 1970 to 1979 (%)
Year house built - Built 1960 to 1969 (%)
Year house built - Built 1950 to 1959 (%)
Year house built - Built 1940 to 1949 (%)
Year house built - Built 1939 or earlier (%)
Average household size
Household density (households per square mile)
Average household size - White
Average household size - Black or African American
Average household size - Asian
Average household size - Hispanic or Latino
Average household size - American Indian and Alaska Native
Average household size - Multirace
Average household size - Other Race
Occupied housing units (%)
Vacant housing units (%)
Owner occupied housing units (%)
Renter occupied housing units (%)
Vacancy status - For rent (%)
Vacancy status - For sale only (%)
Vacancy status - Rented or sold, not occupied (%)
Vacancy status - For seasonal, recreational, or occasional use (%)
Vacancy status - For migrant workers (%)
Vacancy status - Other vacant (%)
Residents with income below the poverty level (%)
Residents with income below 50% of the poverty level (%)
Children below poverty level (%)
Poor families by family type - Married-couple family (%)
Poor families by family type - Male, no wife present (%)
Poor families by family type - Female, no husband present (%)
Poverty status for native-born residents (%)
Poverty status for foreign-born residents (%)
Poverty among high school graduates not in families (%)
Poverty among people who did not graduate high school not in families (%)
Residents with income below the poverty level (%) - White
Residents with income below the poverty level (%) - Black or African American
Residents with income below the poverty level (%) - Asian
Residents with income below the poverty level (%) - Hispanic or Latino
Residents with income below the poverty level (%) - American Indian and Alaska Native
Residents with income below the poverty level (%) - Multirace
Residents with income below the poverty level (%) - Other Race
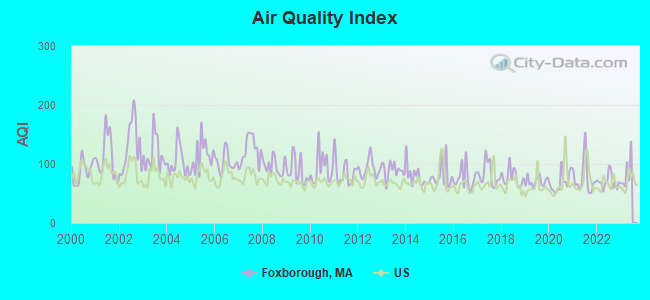
Air pollution - Air Quality Index (AQI)
Air pollution - CO
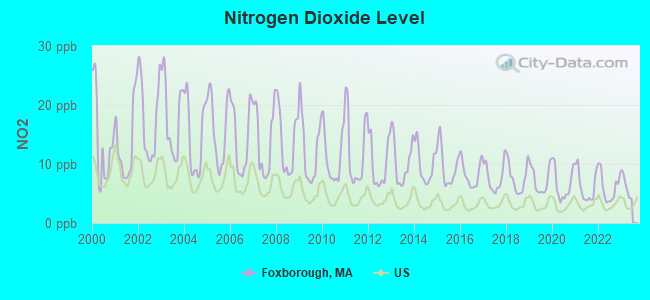
Air pollution - NO2
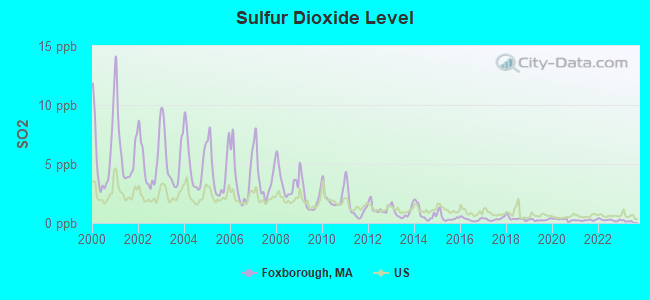
Air pollution - SO2
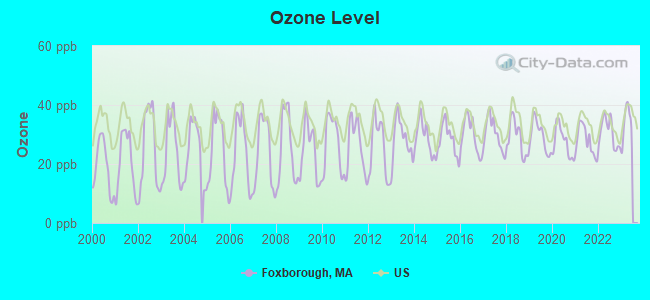
Air pollution - Ozone
Air pollution - PM10
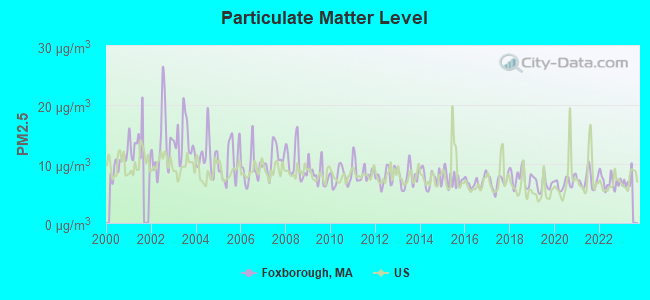
Air pollution - PM25
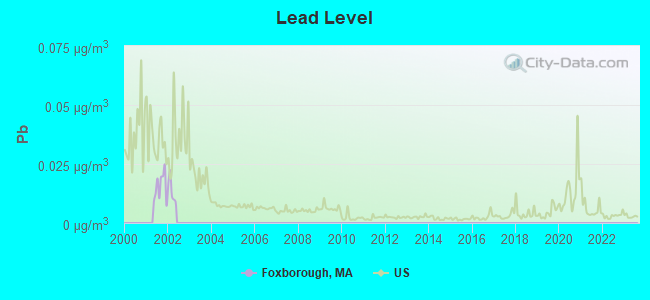
Air pollution - Pb
Crime - Murders per 100,000 population
Crime - Rapes per 100,000 population
Crime - Robberies per 100,000 population
Crime - Assaults per 100,000 population
Crime - Burglaries per 100,000 population
Crime - Thefts per 100,000 population
Crime - Auto thefts per 100,000 population
Crime - Arson per 100,000 population
Crime - City-data.com crime index
Crime - Violent crime index
Crime - Property crime index
Crime - Murders per 100,000 population (5 year average)
Crime - Rapes per 100,000 population (5 year average)
Crime - Robberies per 100,000 population (5 year average)
Crime - Assaults per 100,000 population (5 year average)
Crime - Burglaries per 100,000 population (5 year average)
Crime - Thefts per 100,000 population (5 year average)
Crime - Auto thefts per 100,000 population (5 year average)
Crime - Arson per 100,000 population (5 year average)
Crime - City-data.com crime index (5 year average)
Crime - Violent crime index (5 year average)
Crime - Property crime index (5 year average)
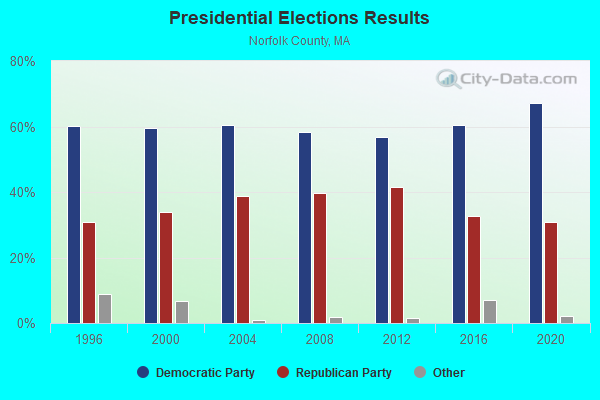
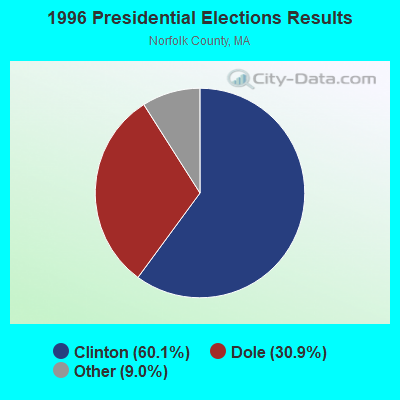
1996 Presidential Elections Results (%) - Democratic Party (Clinton)
1996 Presidential Elections Results (%) - Republican Party (Dole)
1996 Presidential Elections Results (%) - Other
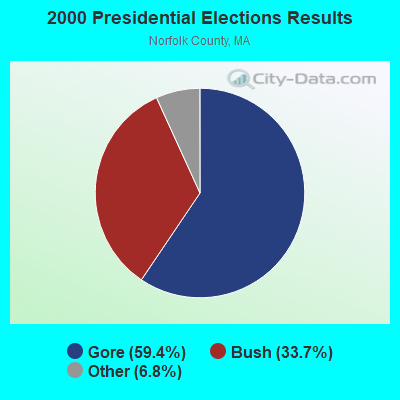
2000 Presidential Elections Results (%) - Democratic Party (Gore)
2000 Presidential Elections Results (%) - Republican Party (Bush)
2000 Presidential Elections Results (%) - Other
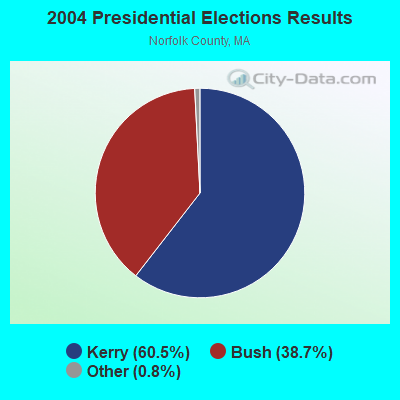
2004 Presidential Elections Results (%) - Democratic Party (Kerry)
2004 Presidential Elections Results (%) - Republican Party (Bush)
2004 Presidential Elections Results (%) - Other
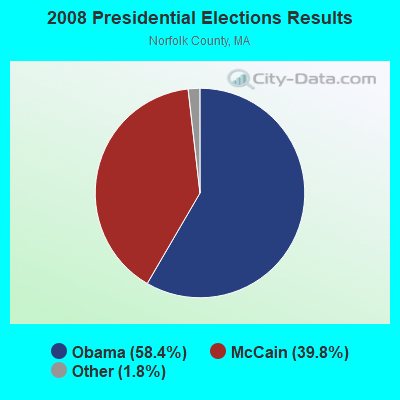
2008 Presidential Elections Results (%) - Democratic Party (Obama)
2008 Presidential Elections Results (%) - Republican Party (McCain)
2008 Presidential Elections Results (%) - Other
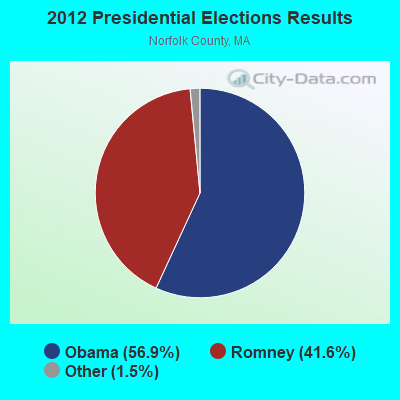
2012 Presidential Elections Results (%) - Democratic Party (Obama)
2012 Presidential Elections Results (%) - Republican Party (Romney)
2012 Presidential Elections Results (%) - Other
2016 Presidential Elections Results (%) - Democratic Party (Clinton)
2016 Presidential Elections Results (%) - Republican Party (Trump)
2016 Presidential Elections Results (%) - Other
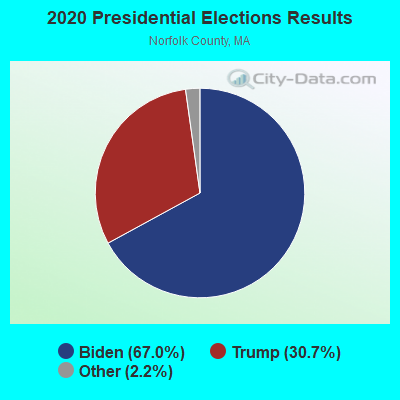
2020 Presidential Elections Results (%) - Democratic Party (Biden)
2020 Presidential Elections Results (%) - Republican Party (Trump)
2020 Presidential Elections Results (%) - Other
Ancestries Reported - Arab (%)
Ancestries Reported - Czech (%)
Ancestries Reported - Danish (%)
Ancestries Reported - Dutch (%)
Ancestries Reported - English (%)
Ancestries Reported - French (%)
Ancestries Reported - French Canadian (%)
Ancestries Reported - German (%)
Ancestries Reported - Greek (%)
Ancestries Reported - Hungarian (%)
Ancestries Reported - Irish (%)
Ancestries Reported - Italian (%)
Ancestries Reported - Lithuanian (%)
Ancestries Reported - Norwegian (%)
Ancestries Reported - Polish (%)
Ancestries Reported - Portuguese (%)
Ancestries Reported - Russian (%)
Ancestries Reported - Scotch-Irish (%)
Ancestries Reported - Scottish (%)
Ancestries Reported - Slovak (%)
Ancestries Reported - Subsaharan African (%)
Ancestries Reported - Swedish (%)
Ancestries Reported - Swiss (%)
Ancestries Reported - Ukrainian (%)
Ancestries Reported - United States (%)
Ancestries Reported - Welsh (%)
Ancestries Reported - West Indian (%)
Ancestries Reported - Other (%)
Educational Attainment - No schooling completed (%)
Educational Attainment - Less than high school (%)
Educational Attainment - High school or equivalent (%)
Educational Attainment - Less than 1 year of college (%)
Educational Attainment - 1 or more years of college (%)
Educational Attainment - Associate degree (%)
Educational Attainment - Bachelor's degree (%)
Educational Attainment - Master's degree (%)
Educational Attainment - Professional school degree (%)
Educational Attainment - Doctorate degree (%)
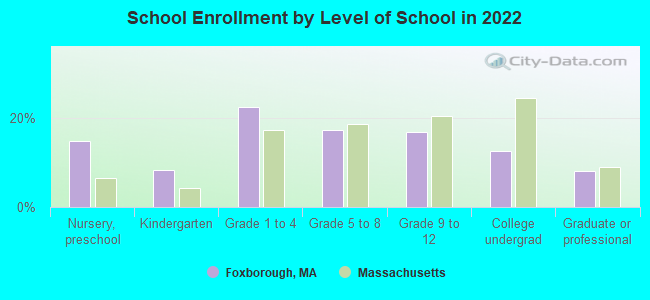
School Enrollment - Nursery, preschool (%)
School Enrollment - Kindergarten (%)
School Enrollment - Grade 1 to 4 (%)
School Enrollment - Grade 5 to 8 (%)
School Enrollment - Grade 9 to 12 (%)
School Enrollment - College undergrad (%)
School Enrollment - Graduate or professional (%)
School Enrollment - Not enrolled in school (%)
School enrollment - Public schools (%)
School enrollment - Private schools (%)
School enrollment - Not enrolled (%)
Median number of rooms in houses and condos
Median number of rooms in apartments
Housing units lacking complete plumbing facilities (%)
Housing units lacking complete kitchen facilities (%)
Density of houses
Urban houses (%)
Rural houses (%)
Households with people 60 years and over (%)
Households with people 65 years and over (%)
Households with people 75 years and over (%)
Households with one or more nonrelatives (%)
Households with no nonrelatives (%)
Population in households (%)
Family households (%)
Nonfamily households (%)
Population in families (%)
Family households with own children (%)
Median number of bedrooms in owner occupied houses
Mean number of bedrooms in owner occupied houses
Median number of bedrooms in renter occupied houses
Mean number of bedrooms in renter occupied houses
Median number of vehichles in owner occupied houses
Mean number of vehichles in owner occupied houses
Median number of vehichles in renter occupied houses
Mean number of vehichles in renter occupied houses
Mortgage status - with mortgage (%)
Mortgage status - with second mortgage (%)
Mortgage status - with home equity loan (%)
Mortgage status - with both second mortgage and home equity loan (%)
Mortgage status - without a mortgage (%)
Average family size
Average family size - White
Average family size - Black or African American
Average family size - Asian
Average family size - Hispanic or Latino
Average family size - American Indian and Alaska Native
Average family size - Multirace
Average family size - Other Race
Geographical mobility - Same house 1 year ago (%)
Geographical mobility - Moved within same county (%)
Geographical mobility - Moved from different county within same state (%)
Geographical mobility - Moved from different state (%)
Geographical mobility - Moved from abroad (%)
Place of birth - Born in state of residence (%)
Place of birth - Born in other state (%)
Place of birth - Native, outside of US (%)
Place of birth - Foreign born (%)
Housing units in structures - 1, detached (%)
Housing units in structures - 1, attached (%)
Housing units in structures - 2 (%)
Housing units in structures - 3 or 4 (%)
Housing units in structures - 5 to 9 (%)
Housing units in structures - 10 to 19 (%)
Housing units in structures - 20 to 49 (%)
Housing units in structures - 50 or more (%)
Housing units in structures - Mobile home (%)
Housing units in structures - Boat, RV, van, etc. (%)
House/condo owner moved in on average (years ago)
Renter moved in on average (years ago)
Year householder moved into unit - Moved in 1999 to March 2000 (%)
Year householder moved into unit - Moved in 1995 to 1998 (%)
Year householder moved into unit - Moved in 1990 to 1994 (%)
Year householder moved into unit - Moved in 1980 to 1989 (%)
Year householder moved into unit - Moved in 1970 to 1979 (%)
Year householder moved into unit - Moved in 1969 or earlier (%)
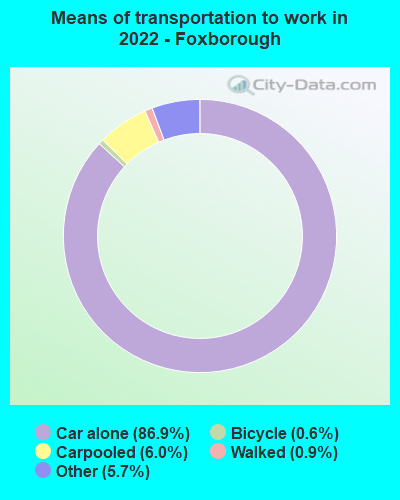
Means of transportation to work - Drove car alone (%)
Means of transportation to work - Carpooled (%)
Means of transportation to work - Public transportation (%)
Means of transportation to work - Bus or trolley bus (%)
Means of transportation to work - Streetcar or trolley car (%)
Means of transportation to work - Subway or elevated (%)
Means of transportation to work - Railroad (%)
Means of transportation to work - Ferryboat (%)
Means of transportation to work - Taxicab (%)
Means of transportation to work - Motorcycle (%)
Means of transportation to work - Bicycle (%)
Means of transportation to work - Walked (%)
Means of transportation to work - Other means (%)
Working at home (%)
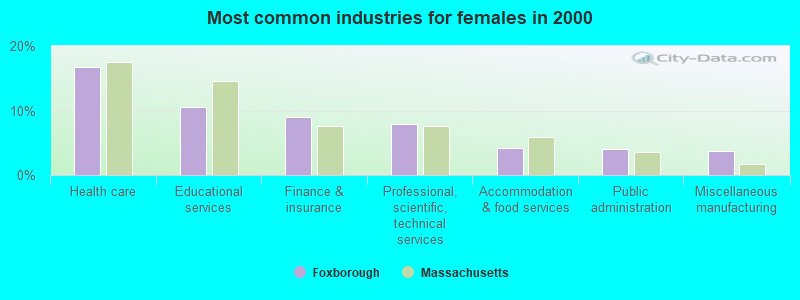
Industry diversity
Most Common Industries - Agriculture, forestry, fishing and hunting, and mining (%)
Most Common Industries - Agriculture, forestry, fishing and hunting (%)
Most Common Industries - Mining, quarrying, and oil and gas extraction (%)
Most Common Industries - Construction (%)
Most Common Industries - Manufacturing (%)
Most Common Industries - Wholesale trade (%)
Most Common Industries - Retail trade (%)
Most Common Industries - Transportation and warehousing, and utilities (%)
Most Common Industries - Transportation and warehousing (%)
Most Common Industries - Utilities (%)
Most Common Industries - Information (%)
Most Common Industries - Finance and insurance, and real estate and rental and leasing (%)
Most Common Industries - Finance and insurance (%)
Most Common Industries - Real estate and rental and leasing (%)
Most Common Industries - Professional, scientific, and management, and administrative and waste management services (%)
Most Common Industries - Professional, scientific, and technical services (%)
Most Common Industries - Management of companies and enterprises (%)
Most Common Industries - Administrative and support and waste management services (%)
Most Common Industries - Educational services, and health care and social assistance (%)
Most Common Industries - Educational services (%)
Most Common Industries - Health care and social assistance (%)
Most Common Industries - Arts, entertainment, and recreation, and accommodation and food services (%)
Most Common Industries - Arts, entertainment, and recreation (%)
Most Common Industries - Accommodation and food services (%)
Most Common Industries - Other services, except public administration (%)
Most Common Industries - Public administration (%)
Occupation diversity
Most Common Occupations - Management, business, science, and arts occupations (%)
Most Common Occupations - Management, business, and financial occupations (%)
Most Common Occupations - Management occupations (%)
Most Common Occupations - Business and financial operations occupations (%)
Most Common Occupations - Computer, engineering, and science occupations (%)
Most Common Occupations - Computer and mathematical occupations (%)
Most Common Occupations - Architecture and engineering occupations (%)
Most Common Occupations - Life, physical, and social science occupations (%)
Most Common Occupations - Education, legal, community service, arts, and media occupations (%)
Most Common Occupations - Community and social service occupations (%)
Most Common Occupations - Legal occupations (%)
Most Common Occupations - Education, training, and library occupations (%)
Most Common Occupations - Arts, design, entertainment, sports, and media occupations (%)
Most Common Occupations - Healthcare practitioners and technical occupations (%)
Most Common Occupations - Health diagnosing and treating practitioners and other technical occupations (%)
Most Common Occupations - Health technologists and technicians (%)
Most Common Occupations - Service occupations (%)
Most Common Occupations - Healthcare support occupations (%)
Most Common Occupations - Protective service occupations (%)
Most Common Occupations - Fire fighting and prevention, and other protective service workers including supervisors (%)
Most Common Occupations - Law enforcement workers including supervisors (%)
Most Common Occupations - Food preparation and serving related occupations (%)
Most Common Occupations - Building and grounds cleaning and maintenance occupations (%)
Most Common Occupations - Personal care and service occupations (%)
Most Common Occupations - Sales and office occupations (%)
Most Common Occupations - Sales and related occupations (%)
Most Common Occupations - Office and administrative support occupations (%)
Most Common Occupations - Natural resources, construction, and maintenance occupations (%)
Most Common Occupations - Farming, fishing, and forestry occupations (%)
Most Common Occupations - Construction and extraction occupations (%)
Most Common Occupations - Installation, maintenance, and repair occupations (%)
Most Common Occupations - Production, transportation, and material moving occupations (%)
Most Common Occupations - Production occupations (%)
Most Common Occupations - Transportation occupations (%)
Most Common Occupations - Material moving occupations (%)
People in Group quarters - Institutionalized population (%)
People in Group quarters - Correctional institutions (%)
People in Group quarters - Federal prisons and detention centers (%)
People in Group quarters - Halfway houses (%)
People in Group quarters - Local jails and other confinement facilities (including police lockups) (%)
People in Group quarters - Military disciplinary barracks (%)
People in Group quarters - State prisons (%)
People in Group quarters - Other types of correctional institutions (%)
People in Group quarters - Nursing homes (%)
People in Group quarters - Hospitals/wards, hospices, and schools for the handicapped (%)
People in Group quarters - Hospitals/wards and hospices for chronically ill (%)
People in Group quarters - Hospices or homes for chronically ill (%)
People in Group quarters - Military hospitals or wards for chronically ill (%)
People in Group quarters - Other hospitals or wards for chronically ill (%)
People in Group quarters - Hospitals or wards for drug/alcohol abuse (%)
People in Group quarters - Mental (Psychiatric) hospitals or wards (%)
People in Group quarters - Schools, hospitals, or wards for the mentally retarded (%)
People in Group quarters - Schools, hospitals, or wards for the physically handicapped (%)
People in Group quarters - Institutions for the deaf (%)
People in Group quarters - Institutions for the blind (%)
People in Group quarters - Orthopedic wards and institutions for the physically handicapped (%)
People in Group quarters - Wards in general hospitals for patients who have no usual home elsewhere (%)
People in Group quarters - Wards in military hospitals for patients who have no usual home elsewhere (%)
People in Group quarters - Juvenile institutions (%)
People in Group quarters - Long-term care (%)
People in Group quarters - Homes for abused, dependent, and neglected children (%)
People in Group quarters - Residential treatment centers for emotionally disturbed children (%)
People in Group quarters - Training schools for juvenile delinquents (%)
People in Group quarters - Short-term care, detention or diagnostic centers for delinquent children (%)
People in Group quarters - Type of juvenile institution unknown (%)
People in Group quarters - Noninstitutionalized population (%)
People in Group quarters - College dormitories (includes college quarters off campus) (%)
People in Group quarters - Military quarters (%)
People in Group quarters - On base (%)
People in Group quarters - Barracks, unaccompanied personnel housing (UPH), (Enlisted/Officer), ;and similar group living quarters for military personnel (%)
People in Group quarters - Transient quarters for temporary residents (%)
People in Group quarters - Military ships (%)
People in Group quarters - Group homes (%)
People in Group quarters - Homes or halfway houses for drug/alcohol abuse (%)
People in Group quarters - Homes for the mentally ill (%)
People in Group quarters - Homes for the mentally retarded (%)
People in Group quarters - Homes for the physically handicapped (%)
People in Group quarters - Other group homes (%)
People in Group quarters - Religious group quarters (%)
People in Group quarters - Dormitories (%)
People in Group quarters - Agriculture workers' dormitories on farms (%)
People in Group quarters - Job Corps and vocational training facilities (%)
People in Group quarters - Other workers' dormitories (%)
People in Group quarters - Crews of maritime vessels (%)
People in Group quarters - Other nonhousehold living situations (%)
People in Group quarters - Other noninstitutional group quarters (%)
Residents speaking English at home (%)
Residents speaking English at home - Born in the United States (%)
Residents speaking English at home - Native, born elsewhere (%)
Residents speaking English at home - Foreign born (%)
Residents speaking Spanish at home (%)
Residents speaking Spanish at home - Born in the United States (%)
Residents speaking Spanish at home - Native, born elsewhere (%)
Residents speaking Spanish at home - Foreign born (%)
Residents speaking other language at home (%)
Residents speaking other language at home - Born in the United States (%)
Residents speaking other language at home - Native, born elsewhere (%)
Residents speaking other language at home - Foreign born (%)
Class of Workers - Employee of private company (%)
Class of Workers - Self-employed in own incorporated business (%)
Class of Workers - Private not-for-profit wage and salary workers (%)
Class of Workers - Local government workers (%)
Class of Workers - State government workers (%)
Class of Workers - Federal government workers (%)
Class of Workers - Self-employed workers in own not incorporated business and Unpaid family workers (%)
House heating fuel used in houses and condos - Utility gas (%)
House heating fuel used in houses and condos - Bottled, tank, or LP gas (%)
House heating fuel used in houses and condos - Electricity (%)
House heating fuel used in houses and condos - Fuel oil, kerosene, etc. (%)
House heating fuel used in houses and condos - Coal or coke (%)
House heating fuel used in houses and condos - Wood (%)
House heating fuel used in houses and condos - Solar energy (%)
House heating fuel used in houses and condos - Other fuel (%)
House heating fuel used in houses and condos - No fuel used (%)
House heating fuel used in apartments - Utility gas (%)
House heating fuel used in apartments - Bottled, tank, or LP gas (%)
House heating fuel used in apartments - Electricity (%)
House heating fuel used in apartments - Fuel oil, kerosene, etc. (%)
House heating fuel used in apartments - Coal or coke (%)
House heating fuel used in apartments - Wood (%)
House heating fuel used in apartments - Solar energy (%)
House heating fuel used in apartments - Other fuel (%)
House heating fuel used in apartments - No fuel used (%)
Armed forces status - In Armed Forces (%)
Armed forces status - Civilian (%)
Armed forces status - Civilian - Veteran (%)
Armed forces status - Civilian - Nonveteran (%)
Fatal accidents locations in years 2005-2021
Fatal accidents locations in 2005
Fatal accidents locations in 2006
Fatal accidents locations in 2007
Fatal accidents locations in 2008
Fatal accidents locations in 2009
Fatal accidents locations in 2010
Fatal accidents locations in 2011
Fatal accidents locations in 2012
Fatal accidents locations in 2013
Fatal accidents locations in 2014
Fatal accidents locations in 2015
Fatal accidents locations in 2016
Fatal accidents locations in 2017
Fatal accidents locations in 2018
Fatal accidents locations in 2019
Fatal accidents locations in 2020
Fatal accidents locations in 2021
Alcohol use - People drinking some alcohol every month (%)
Alcohol use - People not drinking at all (%)
Alcohol use - Average days/month drinking alcohol
Alcohol use - Average drinks/week
Alcohol use - Average days/year people drink much
Audiometry - Average condition of hearing (%)
Audiometry - People that can hear a whisper from across a quiet room (%)
Audiometry - People that can hear normal voice from across a quiet room (%)
Audiometry - Ears ringing, roaring, buzzing (%)
Audiometry - Had a job exposure to loud noise (%)
Audiometry - Had off-work exposure to loud noise (%)
Blood Pressure & Cholesterol - Has high blood pressure (%)
Blood Pressure & Cholesterol - Checking blood pressure at home (%)
Blood Pressure & Cholesterol - Frequently checking blood cholesterol (%)
Blood Pressure & Cholesterol - Has high cholesterol level (%)
Consumer Behavior - Money monthly spent on food at supermarket/grocery store
Consumer Behavior - Money monthly spent on food at other stores
Consumer Behavior - Money monthly spent on eating out
Consumer Behavior - Money monthly spent on carryout/delivered foods
Consumer Behavior - Income spent on food at supermarket/grocery store (%)
Consumer Behavior - Income spent on food at other stores (%)
Consumer Behavior - Income spent on eating out (%)
Consumer Behavior - Income spent on carryout/delivered foods (%)
Current Health Status - General health condition (%)
Current Health Status - Blood donors (%)
Current Health Status - Has blood ever tested for HIV virus (%)
Current Health Status - Left-handed people (%)
Dermatology - People using sunscreen (%)
Diabetes - Diabetics (%)
Diabetes - Had a blood test for high blood sugar (%)
Diabetes - People taking insulin (%)
Diet Behavior & Nutrition - Diet health (%)
Diet Behavior & Nutrition - Milk product consumption (# of products/month)
Diet Behavior & Nutrition - Meals not home prepared (#/week)
Diet Behavior & Nutrition - Meals from fast food or pizza place (#/week)
Diet Behavior & Nutrition - Ready-to-eat foods (#/month)
Diet Behavior & Nutrition - Frozen meals/pizza (#/month)
Drug Use - People that ever used marijuana or hashish (%)
Drug Use - Ever used hard drugs (%)
Drug Use - Ever used any form of cocaine (%)
Drug Use - Ever used heroin (%)
Drug Use - Ever used methamphetamine (%)
Health Insurance - People covered by health insurance (%)
Kidney Conditions-Urology - Avg. # of times urinating at night
Medical Conditions - People with asthma (%)
Medical Conditions - People with anemia (%)
Medical Conditions - People with psoriasis (%)
Medical Conditions - People with overweight (%)
Medical Conditions - Elderly people having difficulties in thinking or remembering (%)
Medical Conditions - People who ever received blood transfusion (%)
Medical Conditions - People having trouble seeing even with glass/contacts (%)
Medical Conditions - People with arthritis (%)
Medical Conditions - People with gout (%)
Medical Conditions - People with congestive heart failure (%)
Medical Conditions - People with coronary heart disease (%)
Medical Conditions - People with angina pectoris (%)
Medical Conditions - People who ever had heart attack (%)
Medical Conditions - People who ever had stroke (%)
Medical Conditions - People with emphysema (%)
Medical Conditions - People with thyroid problem (%)
Medical Conditions - People with chronic bronchitis (%)
Medical Conditions - People with any liver condition (%)
Medical Conditions - People who ever had cancer or malignancy (%)
Mental Health - People who have little interest in doing things (%)
Mental Health - People feeling down, depressed, or hopeless (%)
Mental Health - People who have trouble sleeping or sleeping too much (%)
Mental Health - People feeling tired or having little energy (%)
Mental Health - People with poor appetite or overeating (%)
Mental Health - People feeling bad about themself (%)
Mental Health - People who have trouble concentrating on things (%)
Mental Health - People moving or speaking slowly or too fast (%)
Mental Health - People having thoughts they would be better off dead (%)
Oral Health - Average years since last visit a dentist
Oral Health - People embarrassed because of mouth (%)
Oral Health - People with gum disease (%)
Oral Health - General health of teeth and gums (%)
Oral Health - Average days a week using dental floss/device
Oral Health - Average days a week using mouthwash for dental problem
Oral Health - Average number of teeth
Pesticide Use - Households using pesticides to control insects (%)
Pesticide Use - Households using pesticides to kill weeds (%)
Physical Activity - People doing vigorous-intensity work activities (%)
Physical Activity - People doing moderate-intensity work activities (%)
Physical Activity - People walking or bicycling (%)
Physical Activity - People doing vigorous-intensity recreational activities (%)
Physical Activity - People doing moderate-intensity recreational activities (%)
Physical Activity - Average hours a day doing sedentary activities
Physical Activity - Average hours a day watching TV or videos
Physical Activity - Average hours a day using computer
Physical Functioning - People having limitations keeping them from working (%)
Physical Functioning - People limited in amount of work they can do (%)
Physical Functioning - People that need special equipment to walk (%)
Physical Functioning - People experiencing confusion/memory problems (%)
Physical Functioning - People requiring special healthcare equipment (%)
Prescription Medications - Average number of prescription medicines taking
Preventive Aspirin Use - Adults 40+ taking low-dose aspirin (%)
Reproductive Health - Vaginal deliveries (%)
Reproductive Health - Cesarean deliveries (%)
Reproductive Health - Deliveries resulted in a live birth (%)
Reproductive Health - Pregnancies resulted in a delivery (%)
Reproductive Health - Women breastfeeding newborns (%)
Reproductive Health - Women that had a hysterectomy (%)
Reproductive Health - Women that had both ovaries removed (%)
Reproductive Health - Women that have ever taken birth control pills (%)
Reproductive Health - Women taking birth control pills (%)
Reproductive Health - Women that have ever used Depo-Provera or injectables (%)
Reproductive Health - Women that have ever used female hormones (%)
Sexual Behavior - People 18+ that ever had sex (vaginal, anal, or oral) (%)
Sexual Behavior - Males 18+ that ever had vaginal sex with a woman (%)
Sexual Behavior - Males 18+ that ever performed oral sex on a woman (%)
Sexual Behavior - Males 18+ that ever had anal sex with a woman (%)
Sexual Behavior - Males 18+ that ever had any sex with a man (%)
Sexual Behavior - Females 18+ that ever had vaginal sex with a man (%)
Sexual Behavior - Females 18+ that ever performed oral sex on a man (%)
Sexual Behavior - Females 18+ that ever had anal sex with a man (%)
Sexual Behavior - Females 18+ that ever had any kind of sex with a woman (%)
Sexual Behavior - Average age people first had sex
Sexual Behavior - Average number of female sex partners in lifetime (males 18+)
Sexual Behavior - Average number of female vaginal sex partners in lifetime (males 18+)
Sexual Behavior - Average age people first performed oral sex on a woman (18+)
Sexual Behavior - Average number of woman performed oral sex on in lifetime (18+)
Sexual Behavior - Average number of male sex partners in lifetime (males 18+)
Sexual Behavior - Average number of male anal sex partners in lifetime (males 18+)
Sexual Behavior - Average age people first performed oral sex on a man (18+)
Sexual Behavior - Average number of male oral sex partners in lifetime (18+)
Sexual Behavior - People using protection when performing oral sex (%)
Sexual Behavior - Average number of times people have vaginal or anal sex a year
Sexual Behavior - People having sex without condom (%)
Sexual Behavior - Average number of male sex partners in lifetime (females 18+)
Sexual Behavior - Average number of male vaginal sex partners in lifetime (females 18+)
Sexual Behavior - Average number of female sex partners in lifetime (females 18+)
Sexual Behavior - Circumcised males 18+ (%)
Sleep Disorders - Average hours sleeping at night
Sleep Disorders - People that has trouble sleeping (%)
Smoking-Cigarette Use - People smoking cigarettes (%)
Taste & Smell - People 40+ having problems with smell (%)
Taste & Smell - People 40+ having problems with taste (%)
Taste & Smell - People 40+ that ever had wisdom teeth removed (%)
Taste & Smell - People 40+ that ever had tonsils teeth removed (%)
Taste & Smell - People 40+ that ever had a loss of consciousness because of a head injury (%)
Taste & Smell - People 40+ that ever had a broken nose or other serious injury to face or skull (%)
Taste & Smell - People 40+ that ever had two or more sinus infections (%)
Weight - Average height (inches)
Weight - Average weight (pounds)
Weight - Average BMI
Weight - People that are obese (%)
Weight - People that ever were obese (%)
Weight - People trying to lose weight (%)
Officers per 1,000 residents here:
2.08Massachusetts average:
2.53
Latest news from Foxborough, MA collected exclusively by city-data.com from local newspapers, TV, and radio stations
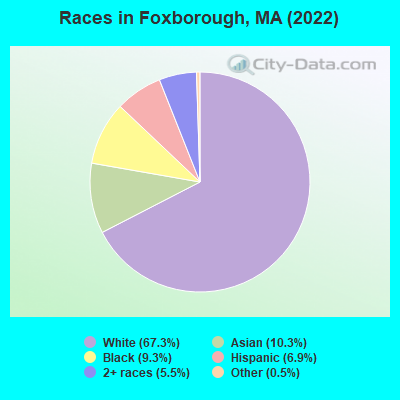
Ancestries: Irish (26.2%), Nigerian (10.7%), Italian (6.1%), English (4.6%), French Canadian (3.4%), Lebanese (3.3%).
Current Local Time:
Land area: 2.91 square miles.
Population density: 1,936 people per square mile (low).
876 residents are foreign born (7.8% Asia , 2.2% Europe , 1.9% Latin America ).
This place:
13.8%Massachusetts:
17.6%
Median real estate property taxes paid for housing units with mortgages in 2022: $5,792 (1.2%)Median real estate property taxes paid for housing units with no mortgage in 2022: $6,649 (1.0%)
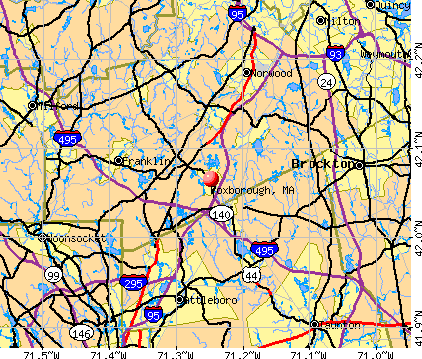
Nearest city with pop. 50,000+: Brockton, MA
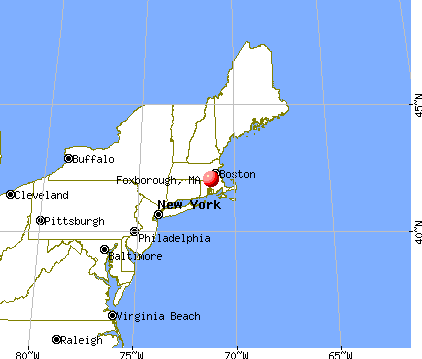
Nearest city with pop. 200,000+: Boston, MA
Nearest city with pop. 1,000,000+: Bronx, NY
Nearest cities:
Latitude: 42.07 N, Longitude: 71.25 W
Daytime population change due to commuting: +1,350 (+21.3%)Workers who live and work in this place: 807 (26.8%)
Foxborough tourist attractions:
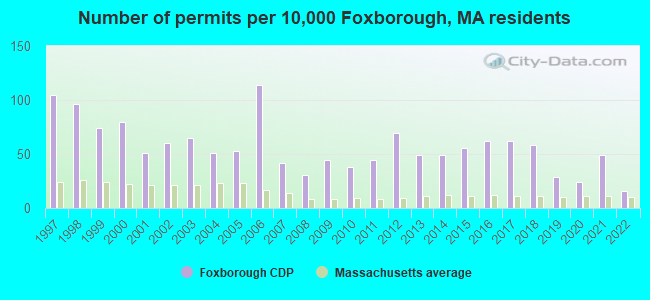
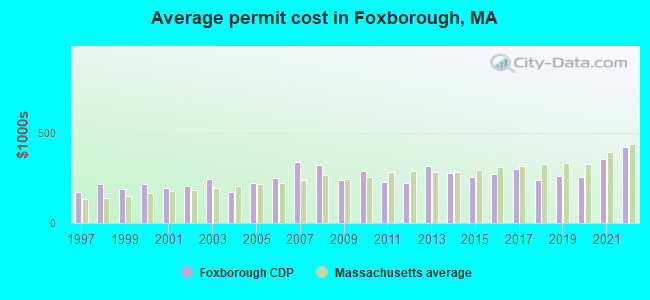
Single-family new house construction building permits:
2022: 9 buildings , average cost: $423,2002021: 27 buildings , average cost: $353,3002020: 13 buildings , average cost: $252,5002019: 16 buildings , average cost: $261,3002018: 32 buildings , average cost: $236,2002017: 34 buildings , average cost: $298,4002016: 34 buildings , average cost: $269,8002015: 31 buildings , average cost: $251,6002014: 27 buildings , average cost: $277,3002013: 27 buildings , average cost: $315,1002012: 38 buildings , average cost: $221,1002011: 24 buildings , average cost: $226,4002010: 21 buildings , average cost: $287,0002009: 24 buildings , average cost: $237,6002008: 17 buildings , average cost: $319,8002007: 23 buildings , average cost: $337,2002006: 63 buildings , average cost: $249,3002005: 29 buildings , average cost: $222,1002004: 28 buildings , average cost: $172,1002003: 36 buildings , average cost: $245,5002002: 33 buildings , average cost: $201,5002001: 28 buildings , average cost: $192,8002000: 44 buildings , average cost: $217,4001999: 41 buildings , average cost: $186,8001998: 53 buildings , average cost: $217,1001997: 58 buildings , average cost: $169,500Unemployment in December 2023: Here:
3.1%Massachusetts:
3.5%
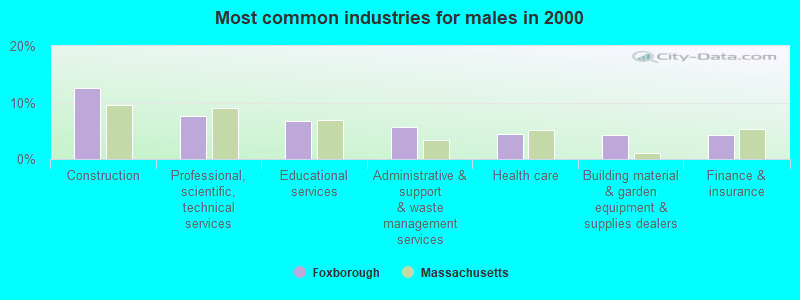
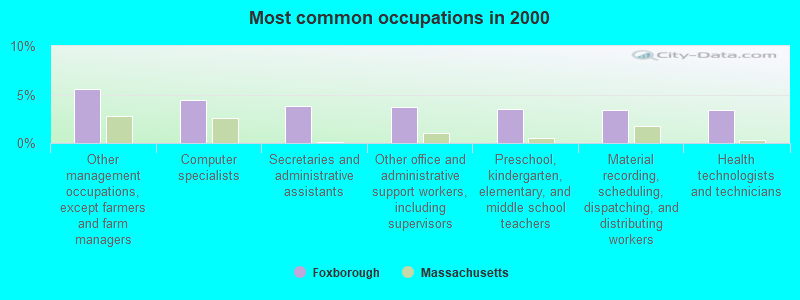
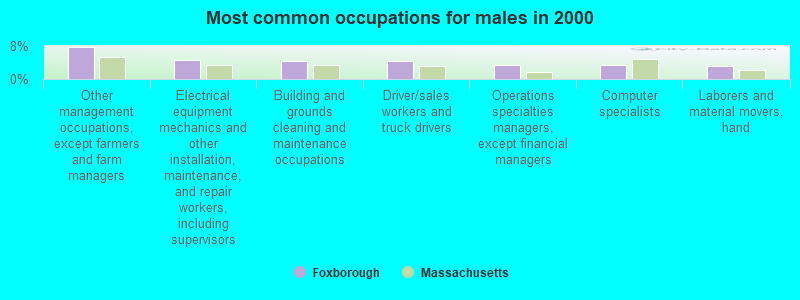
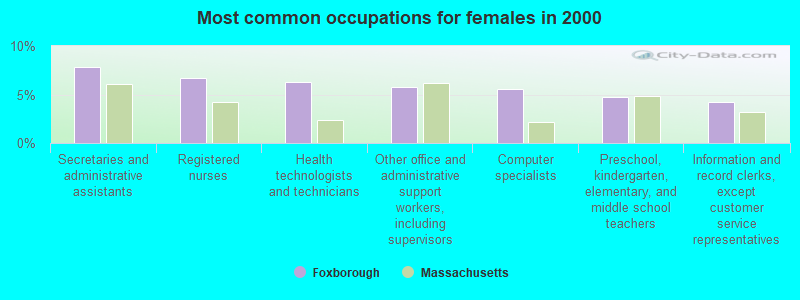
Most common occupations in Foxborough, MA (%)
Both Males Females
Other management occupations, except farmers and farm managers (5.6%)
Computer specialists (4.4%)
Secretaries and administrative assistants (3.8%)
Other office and administrative support workers, including supervisors (3.7%)
Preschool, kindergarten, elementary, and middle school teachers (3.5%)
Material recording, scheduling, dispatching, and distributing workers (3.4%)
Health technologists and technicians (3.4%)
Other management occupations, except farmers and farm managers (7.7%)
Electrical equipment mechanics and other installation, maintenance, and repair workers, including supervisors (4.6%)
Building and grounds cleaning and maintenance occupations (4.4%)
Driver/sales workers and truck drivers (4.4%)
Operations specialties managers, except financial managers (3.5%)
Computer specialists (3.3%)
Laborers and material movers, hand (3.2%)
Secretaries and administrative assistants (7.9%)
Registered nurses (6.7%)
Health technologists and technicians (6.3%)
Other office and administrative support workers, including supervisors (5.8%)
Computer specialists (5.5%)
Preschool, kindergarten, elementary, and middle school teachers (4.7%)
Information and record clerks, except customer service representatives (4.2%)
Tornado activity:
Foxborough-area historical tornado activity is near Massachusetts state average. It is 45% smaller than the overall U.S. average.
On 6/9/1953, a category F4 (max. wind speeds 207-260 mph) tornado 21.4 miles away from the Foxborough place center killed 90 people and injured 1228 people and caused between $50,000,000 and $500,000,000 in damages.
On 6/9/1953, a category F3 (max. wind speeds 158-206 mph) tornado 2.7 miles away from the place center injured 17 people and caused between $500,000 and $5,000,000 in damages.
Earthquake activity:
Foxborough-area historical earthquake activity is significantly above Massachusetts state average. It is 73% smaller than the overall U.S. average. On 10/7/1983 at 10:18:46, a magnitude 5.3 (5.1 MB, 5.3 LG, 5.1 ML, Class: Moderate, Intensity: VI - VII) earthquake occurred 203.8 miles away from Foxborough center On 4/20/2002 at 10:50:47, a magnitude 5.3 (5.3 ML, Depth: 3.0 mi) earthquake occurred 209.4 miles away from the city center On 1/19/1982 at 00:14:42, a magnitude 4.7 (4.5 MB, 4.7 MD, 4.5 LG, Class: Light, Intensity: IV - V) earthquake occurred 100.8 miles away from Foxborough center On 4/20/2002 at 10:50:47, a magnitude 5.2 (5.2 MB, 4.2 MS, 5.2 MW, 5.0 MW) earthquake occurred 208.6 miles away from Foxborough center On 10/16/2012 at 23:12:25, a magnitude 4.7 (4.7 ML, Depth: 10.0 mi) earthquake occurred 110.1 miles away from Foxborough center On 8/22/1992 at 12:20:32, a magnitude 4.8 (4.8 MB, 3.8 MS, 4.7 LG, Depth: 6.2 mi) earthquake occurred 210.4 miles away from the city center Magnitude types: regional Lg-wave magnitude (LG), body-wave magnitude (MB), duration magnitude (MD), local magnitude (ML), surface-wave magnitude (MS), moment magnitude (MW) Natural disasters: The number of natural disasters in Norfolk County (31) is a lot greater than the US average (15).Major Disasters (Presidential) Declared: 18Emergencies Declared: 13Floods: 12, Storms: 10, Hurricanes: 6, Snowstorms: 5, Snows: 3, Winter Storms: 3, Blizzards: 2, Explosion: 1, Heavy Rain: 1, Snowfall: 1, Tropical Storm: 1, Water Main Break: 1, Wind: 1 (Note: some incidents may be assigned to more than one category). Hospitals and medical centers near Foxborough: VAN-DORA NURSING HOME (Nursing Home, about 1 miles away; FOXBORO, MA)
CARITAS SOUTHWOOD HOSPITAL (Hospital, about 4 miles away; NORFOLK, MA)
SERENITY HILL NURSING CENTER (Nursing Home, about 4 miles away; WRENTHAM, MA)
MAPLES REHABILITATION AND NURSING CENTER (Nursing Home, about 4 miles away; WRENTHAM, MA)
MAPLES CONV HOME, INC (Nursing Home, about 5 miles away; WRENTHAM, MA)
EPOCH SENIOR HEALTHCARE OF SHARON (Nursing Home, about 6 miles away; SHARON, MA)
COUNTRY HAVEN NURS HME INC (Nursing Home, about 7 miles away; NORTON, MA)
Amtrak stations near Foxborough: 12 miles: ROUTE 128 (WESTWOOD, UNIVERSITY AVE. & RTE. 128) Services: ticket office, enclosed waiting area, public restrooms, public payphones, vending machines, paid short-term parking, taxi stand, public transit connection.
18 miles: FRAMINGHAM (443 WAVERLY ST.) Services: public payphones, snack bar, paid short-term parking, taxi stand, public transit connection.
19 miles: PROVIDENCE (100 GASPEE ST.) Services: ticket office, fully wheelchair accessible, enclosed waiting area, public restrooms, public payphones, snack bar, ATM, paid short-term parking, paid long-term parking, call for car rental service, taxi stand, public transit connection.
Colleges/universities with over 2000 students nearest to Foxborough:
Stonehill College (about 9 miles; Easton, MA ; Full-time enrollment: 2,563)
Massasoit Community College (about 14 miles; Brockton, MA ; FT enrollment: 5,442)
Curry College (about 14 miles; Milton, MA ; FT enrollment: 2,586)
Bridgewater State University (about 16 miles; Bridgewater, MA ; FT enrollment: 9,802)
Babson College (about 17 miles; Wellesley, MA ; FT enrollment: 3,230)
Wellesley College (about 17 miles; Wellesley, MA ; FT enrollment: 2,658)
Massachusetts Bay Community College (about 18 miles; Wellesley Hills, MA ; FT enrollment: 3,636)
Public high schools in Foxborough:
Public elementary/middle schools in Foxborough:
Private elementary/middle school in Foxborough: ACADEMY AT FOXBOROUGH Students: 68, Location: 115 MECHANIC ST, Grades: PK-7)
See full list of schools located in Foxborough Library in Foxborough: BOYDEN LIBRARY Operating income: $923,883; Location: 10 BIRD ST.; 94,793 books ; 523 e-books ; 6,955 audio materials ; 4,426 video materials ; 6 local licensed databases ; 34 state licensed databases ; 1 other licensed databases ; 178 print serial subscriptions )
Notable locations in Foxborough: (A) , Memorial Hall (B) , Orpehum Theatre (C) . Display/hide their locations on the map
Shopping Centers: (1) , Bradlees Plaza Shopping Center (2) . Display/hide their locations on the map
Churches in Foxborough include: (A) , Redeemer Lutheran Church (B) , Foxboro Universalist Church (C) , Bethany Congregation Church (D) , Saint Marys Church (E) , Saint Marks Church (F) . Display/hide their locations on the map
Cemeteries: (1) , Rock Hill Cemetery (2) . Display/hide their locations on the map
Lakes and reservoirs: (A) , Foundry Pond (B) , Neponset Reservoir (C) . Display/hide their locations on the map
Birthplace of: Harold P. Williams - Justice, Tom Nalen - Football player.
Norfolk County has a predicted average indoor radon screening level between 2 and 4 pCi/L (pico curies per liter) - Moderate Potential Drinking water stations with addresses in Foxborough and their reported violations in the past:
FOXBORO WATER DEPARTMENT (Population served: 17,170, Groundwater):
Past health violations:
MCL, Monthly (TCR) - In SEP-2011, Contaminant: Coliform. Follow-up actions: St AO (w/o penalty) issued (NOV-29-2011), St Compliance achieved (NOV-29-2011)
Past monitoring violations:
Notification, State - In SEP-2011, Contaminant: Coliform (TCR). Follow-up actions: St AO (w/o penalty) issued (NOV-29-2011), St Compliance achieved (NOV-29-2011)
Monitoring, Repeat Major (TCR) - In SEP-2011, Contaminant: Coliform (TCR). Follow-up actions: St AO (w/o penalty) issued (NOV-29-2011), St Compliance achieved (NOV-29-2011)
Monitoring and Reporting (DBP) - Between APR-2006 and JUN-2006, Contaminant: TTHM. Follow-up actions: St AO (w/o penalty) issued (AUG-01-2006)
49 regular monitoring violations
Average household size: This place:
2.2 peopleMassachusetts:
2.5 people
Percentage of family households: This place:
54.0%Whole state:
63.0%
Percentage of households with unmarried partners: This place:
7.6%Whole state:
7.0%
Likely homosexual households (counted as self-reported same-sex unmarried-partner households)
Lesbian couples: 0.2% of all households Gay men: 0.1% of all households
23 people in nursing facilities/skilled-nursing facilities in 2010people in other noninstitutional facilities in 2010People in group quarters in Foxborough in 2000:
68 people in nursing homes
6 people in other group homes
6 people in other noninstitutional group quarters
2 people in religious group quarters
Arena or stadium:
Gillette Stadium. Capacity: 68,756. New England Patriots, New England Revolution.
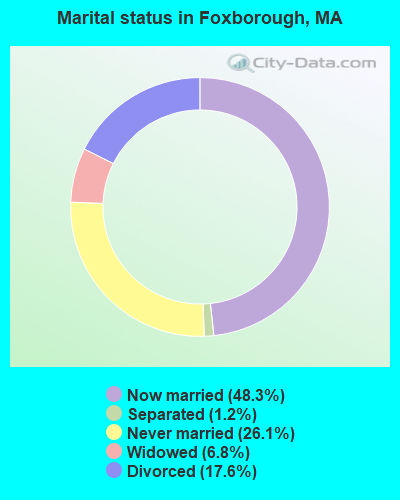
For population 15 years and over in Foxborough:
Never married: 26.1%Now married: 48.3%Separated: 1.2%Widowed: 6.8%Divorced: 17.6% For population 25 years and over in Foxborough:
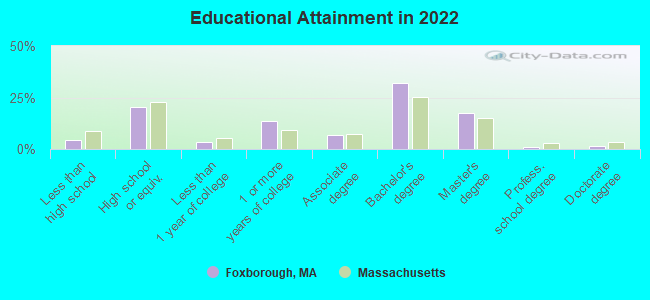
High school or higher: 95.4%Bachelor's degree or higher: 50.4%Graduate or professional degree: 19.2%Unemployed: 2.1%Mean travel time to work (commute): 27.4 minutes
Education Gini index (Inequality in education) Here:
10.2Massachusetts average:
13.0
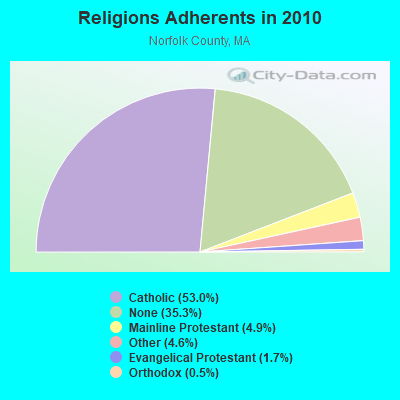
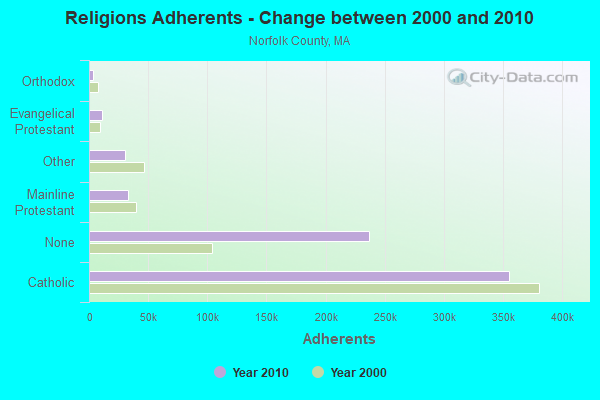
Religion statistics for Foxborough, MA (based on Norfolk County data)
Religion Adherents Congregations Catholic 355,321 52 Mainline Protestant 33,086 115 Other 30,593 75 Evangelical Protestant 11,323 89 Orthodox 3,539 9 None 236,988 -
Source: Clifford Grammich, Kirk Hadaway, Richard Houseal, Dale E.Jones, Alexei Krindatch, Richie Stanley and Richard H.Taylor. 2012. 2010 U.S.Religion Census: Religious Congregations & Membership Study. Association of Statisticians of American Religious Bodies. Jones, Dale E., et al. 2002. Congregations and Membership in the United States 2000. Nashville, TN: Glenmary Research Center. Graphs represent county-level data
Food Environment Statistics: Number of grocery stores : 108Here :
1.65 / 10,000 pop.Massachusetts :
1.98 / 10,000 pop.
Number of supercenters and club stores : 6Norfolk County :
0.09 / 10,000 pop.Massachusetts :
0.05 / 10,000 pop.
Number of convenience stores (no gas) : 134Norfolk County :
2.04 / 10,000 pop.State :
2.22 / 10,000 pop.
Number of convenience stores (with gas) : 103Norfolk County :
1.57 / 10,000 pop.Massachusetts :
1.77 / 10,000 pop.
Number of full-service restaurants : 556This county :
8.48 / 10,000 pop.Massachusetts :
8.76 / 10,000 pop.
Adult diabetes rate : This county :
7.1%Massachusetts :
8.1%
Adult obesity rate : This county :
19.1%State :
22.5%
Low-income preschool obesity rate : Here :
12.9%Massachusetts :
16.5%
Health and Nutrition:
Average overall health of teeth and gums : This city:
63.7%Massachusetts:
48.0%
Average BMI : Here:
27.1Massachusetts:
28.4
People feeling badly about themselves : This city:
16.2%Massachusetts:
20.7%
People not drinking alcohol at all : Foxborough:
6.2%Massachusetts:
10.4%
Average hours sleeping at night : This city:
7.1Massachusetts:
6.8
Overweight people : Foxborough:
31.1%State:
33.4%
General health condition : This city:
68.1%Massachusetts:
57.1%
Average condition of hearing : Foxborough:
83.1%State:
79.2%
More about Health and Nutrition of Foxborough, MA Residents
8.01% of this county's 2021 resident taxpayers lived in other counties in 2020 ($110,572 average adjusted gross income )
Here:
8.01%Massachusetts average:
6.35%
0.01% of residents moved from foreign countries ($78 average AGI )Norfolk County:
0.01%Massachusetts average:
0.01%
Top counties from which taxpayers relocated into this county between 2020 and 2021:
8.55% of this county's 2020 resident taxpayers moved to other counties in 2021 ($128,358 average adjusted gross income )
Here:
8.55%Massachusetts average:
7.18%
0.01% of residents moved to foreign countries ($348 average AGI )Norfolk County:
0.01%Massachusetts average:
0.02%
Top counties to which taxpayers relocated from this county between 2020 and 2021:
Businesses in Foxborough, MA
Name Count Name Count
Baskin-Robbins 1 GNC 1 Bath & Body Works 1 GameStop 1 Bed Bath & Beyond 1 Marriott 2 Dunkin Donuts 3 Nike 1 Express 1 Old Navy 1 FedEx 1 Walgreens 1
Strongest AM radio stations in Foxborough:
WEEI (850 AM; 50 kW; BOSTON, MA; Owner: ENTERCOM BOSTON LICENSE, LLC)
WALE (990 AM; 50 kW; GREENVILLE, RI; Owner: NORTH AMERICAN BROADCASTING CO., INC.)
WKOX (1200 AM; 50 kW; FRAMINGHAM, MA; Owner: CAPSTAR TX LIMITED PARTNERSHIP)
WBIX (1060 AM; 40 kW; NATICK, MA; Owner: LANGER BROADCASTING CORPORATION)
WAMG (890 AM; 25 kW; DEDHAM, MA; Owner: MEGA COMMUNICATIONS OF DEDHAM LICENSEE, LLC)
WBZ (1030 AM; 50 kW; BOSTON, MA; Owner: INFINITY BROADCASTING OPERATIONS, INC.)
WRKO (680 AM; 50 kW; BOSTON, MA; Owner: ENTERCOM BOSTON LICENSE, LLC)
WDIS (1170 AM; daytime; 1 kW; NORFOLK, MA; Owner: DISCUSSION RADIO, INCORPORATED)
WWZN (1510 AM; 50 kW; BOSTON, MA; Owner: ROSE CITY RADIO CORPORATION)
WARL (1320 AM; 5 kW; ATTLEBORO, MA; Owner: THE ADD RADIO GROUP, INC.)
WUNR (1600 AM; 20 kW; BROOKLINE, MA; Owner: CHAMPION BROADCASTING SYSTEMS, INC.)
WRCA (1330 AM; 25 kW; WALTHAM, MA; Owner: WRCA LICENSE, LLC)
WCRN (830 AM; 50 kW; WORCESTER, MA; Owner: CARTER BROADCASTING CORPORATION)
Strongest FM radio stations in Foxborough:
WWBB (101.5 FM; PROVIDENCE, RI; Owner: CLEAR CHANNEL BROADCASTING LICENSES, INC.)
WBMX (98.5 FM; BOSTON, MA; Owner: INFINITY RADIO OPERATIONS INC.)
WBOS (92.9 FM; BROOKLINE, MA; Owner: GREATER BOSTON RADIO, INC.)
WJMN (94.5 FM; BOSTON, MA; Owner: AMFM RADIO LICENSES, L.L.C.)
WCRB (102.5 FM; WALTHAM, MA; Owner: CHARLES RIVER BROADCASTING WCRB LICE)
WTKK (96.9 FM; BOSTON, MA; Owner: GREATER BOSTON RADIO, INC.)
WROR-FM (105.7 FM; FRAMINGHAM, MA; Owner: GREATER BOSTON RADIO, INC.)
WGBH (89.7 FM; BOSTON, MA; Owner: WGBH EDUCATIONAL FOUNDATION)
WBUR-FM (90.9 FM; BOSTON, MA; Owner: TRUSTEES OF BOSTON UNIVERSITY)
WBOT (97.7 FM; BROCKTON, MA; Owner: RADIO ONE LICENSES, LLC)
WODS (103.3 FM; BOSTON, MA; Owner: INFINITY BROADCASTING OPERATIONS, INC.)
WXKS-FM (107.9 FM; MEDFORD, MA; Owner: AMFM RADIO LICENSES, L.L.C.)
WMJX (106.7 FM; BOSTON, MA; Owner: GREATER BOSTON RADIO, INC.)
WSNE-FM (93.3 FM; TAUNTON, MA; Owner: CAPSTAR TX LIMITED PARTNERSHIP)
WBCN (104.1 FM; BOSTON, MA; Owner: HEMISPHERE BROADCASTING CORPORATION)
WZLX (100.7 FM; BOSTON, MA; Owner: INFINITY BROADCASTING CORPORATION OF BOSTON)
WWKX (106.3 FM; WOONSOCKET, RI; Owner: AAA ENTERTAINMENT LICENSING LLC)
W267AI (101.3 FM; BOSTON, MA; Owner: MCC BROADCASTING COMPANY, INC.)
WERS (88.9 FM; BOSTON, MA; Owner: EMERSON COLLEGE)
WGAO (88.3 FM; FRANKLIN, MA; Owner: DEAN COLLEGE)
TV broadcast stations around Foxborough:
WWDP (Channel 46; NORWELL, MA; Owner: NORWELL TELEVISION, LLC)
WCVB-TV (Channel 5; BOSTON, MA; Owner: WCVB HEARST-ARGYLE TV, INC.)
WGBH-TV (Channel 2; BOSTON, MA; Owner: WGBH EDUCATIONAL FOUNDATION)
WMFP (Channel 62; LAWRENCE, MA; Owner: WSAH LICENSE, INC.)
WHDH-TV (Channel 7; BOSTON, MA; Owner: WHDH-TV)
WSBK-TV (Channel 38; BOSTON, MA; Owner: VIACOM INC.)
WLVI-TV (Channel 56; CAMBRIDGE, MA; Owner: WLVI, INC.)
WPRI-TV (Channel 12; PROVIDENCE, RI; Owner: TVL BROADCASTING OF RHODE ISLAND, LLC)
WBZ-TV (Channel 4; BOSTON, MA; Owner: VIACOM INC.)
WGBX-TV (Channel 44; BOSTON, MA; Owner: WGBH EDUCATIONAL FOUNDATION)
WNAC-TV (Channel 64; PROVIDENCE, RI; Owner: WNAC, LLC)
WLNE-TV (Channel 6; NEW BEDFORD, MA; Owner: FREEDOM BROADCASTING OF SOUTHERN NEW ENGLAND, INC.)
WFXT (Channel 25; BOSTON, MA; Owner: FOX TELEVISION STATIONS INC.)
WJAR (Channel 10; PROVIDENCE, RI; Owner: OUTLET BROADCASTING, INC.)
WSBE-TV (Channel 36; PROVIDENCE, RI; Owner: RHODE ISLAND PUBLIC TELECOM. AUTHORITY)
W40BO (Channel 40; BOSTON, MA; Owner: PAXSON COMMUNICATIONS LPTV, INC.)
WBPX (Channel 68; BOSTON, MA; Owner: PAXSON BOSTON-68 LICENSE, INC.)
WUTF (Channel 66; MARLBOROUGH, MA; Owner: TELEFUTURA BOSTON LLC)
WUNI (Channel 27; WORCESTER, MA; Owner: ENTRAVISION HOLDINGS, LLC)
WTMU-LP (Channel 32; BOSTON, MA; Owner: ZGS BOSTON, INC.)
WCEA-LP (Channel 58; BOSTON, MA; Owner: CHANNEL 19 TV CORPORATION)
WPXQ (Channel 69; BLOCK ISLAND, RI; Owner: OCEAN STATE TELEVISION, L.L.C.)
WLWC (Channel 28; NEW BEDFORD, MA; Owner: C-28 FCC LICENSEE SUBSIDIARY, LLC)
WRIW-LP (Channel 50; PROVIDENCE, RI; Owner: ZGS PROVIDENCE, INC.)
National Bridge Inventory (NBI) Statistics 32 Number of bridges312ft / 94.6m Total length $71,080,000 Total costs1,141,287 Total average daily traffic34,698 Total average daily truck traffic
New bridges - historical statistics
1 1950-1959 27 1960-1969 2 1990-1999 2 2000-2009
See full National Bridge Inventory statistics for Foxborough, MA
FCC Registered Antenna Towers: 6
KELLYE E ABERNATHY, 21 E Belcher Rd (Lat: 42.055833 Lon: -71.231944), Type: 39.6, Overall height: 39.6 m, Registrant: Cingular Wireless LLC, Kellye.E.Abernathy@cingular.Com, , Plano, Phone: (469) 229-7422 David C Jatlow, 21 E Belcher Rd (Lat: 42.055833 Lon: -71.231944), Type: 39.6, Overall height: 39.6 m, Registrant: Cingular Wireless (Formerly At&t Wireless), David.Jatlow@cingular.Com, , Washi-ngton, Phone: (202) 223-9222 DAVID C JATLOW, 21 E Belcher Rd (Lat: 42.055833 Lon: -71.231944), Type: 39.6, Overall height: 39.6 m, Registrant: Cingular Wireless LLC, Kellye.E.Abernathy, , Dalla-s, Phone: (972) 733-2092 KELLYE E ABERNATHY, 21 E Belcher Rd (Lat: 42.055833 Lon: -71.231944), Type: 39.6, Overall height: 39.6 m, Registrant: Cingular Wireless LLC, Kellye.E.Abernathy@cingular.Com, , Plano, Phone: (469) 229-7422 David Saska, 21 E Belcher Rd (Lat: 42.055833 Lon: -71.231944), Type: 39.6, Overall height: 39.6 m, Registrant: At&t Mobility LLC, Ka8805@att.Com, , Plano, Phone: (469) 229-7422 21 E Belcher Rd (Lat: 42.055833 Lon: -71.231944), Type: 39.6, Overall height: 39.6 m, Registrant: At&t Wireless Services Inc, Esther.Hilliard@attws.Com, , Washi-ngton, Phone: (202) 223-9222 FCC Registered Private Land Mobile Towers: 1 (
See the full list of FCC Registered Private Land Mobile Towers in Foxborough, MA )
FCC Registered Broadcast Land Mobile Towers: 10 (
See the full list of FCC Registered Broadcast Land Mobile Towers )
FCC Registered Microwave Towers: 37 (
See the full list of FCC Registered Microwave Towers in this town )
FCC Registered Paging Towers: 4 (
See the full list of FCC Registered Paging Towers )
FCC Registered Amateur Radio Licenses: 14 (
See the full list of FCC Registered Amateur Radio Licenses in Foxborough )
FAA Registered Aircraft: 2
Aircraft: GULFSTREAM AEROSPACE G-V (Category: Land, Engines: 2, Seats: 20, Weight: 20,000+ Pounds), Engine: BMW ROLLS BR 700 SERIES (14970 Pounds of Thrust) (Turbo-fan)N-Number: 176SM, N176SM, N-176SM, Serial Number: 637, Year manufactured: 2001, Airworthiness Date: 04/17/2001, Certificate Issue Date: 05/01/2017Registrant (LLC): Massmutual Asset Finance LLC, 2 Hampshire St Ste 101, Foxborough, MA 02035Aircraft: AIRBUS HELICOPTERS INC AS350B3 (Category: Land, Seats: 7, Weight: Up to 12,499 Pounds), Engine: TURBOMECA ARRIEL 2D (802 HP) (Turbo-shaft)N-Number: 941EM, N941EM, N-941EM, Serial Number: 7854, Year manufactured: 2014, Airworthiness Date: 05/20/2014, Certificate Issue Date: 12/28/2015Registrant (LLC): Massmutual Asset Finance LLC, 2 Hampshire St Ste 101, Foxborough, MA 02035
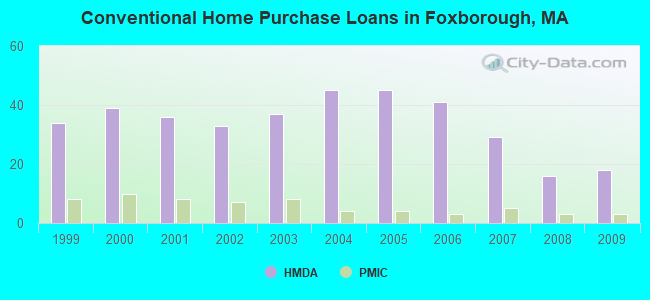
Home Mortgage Disclosure Act Aggregated Statistics For Year 2009(Based on 2 partial tracts) A) FHA, FSA/RHS & VA B) Conventional C) Refinancings D) Home Improvement Loans F) Non-occupant Loans on Number Average Value Number Average Value Number Average Value Number Average Value Number Average Value
LOANS ORIGINATED 7 $278,947 18 $282,684 100 $273,065 5 $146,948 2 $279,965 APPLICATIONS APPROVED, NOT ACCEPTED 0 $0 1 $323,880 5 $262,698 0 $0 0 $0 APPLICATIONS DENIED 2 $231,495 3 $160,667 19 $285,021 2 $251,345 0 $0 APPLICATIONS WITHDRAWN 0 $0 1 $338,420 14 $301,637 1 $318,720 0 $0 FILES CLOSED FOR INCOMPLETENESS 0 $0 1 $138,230 5 $278,974 0 $0 1 $206,580
Aggregated Statistics For Year 2008(Based on 2 partial tracts) A) FHA, FSA/RHS & VA B) Conventional C) Refinancings D) Home Improvement Loans E) Loans on Dwellings For 5+ Families F) Non-occupant Loans on G) Loans On Manufactured Number Average Value Number Average Value Number Average Value Number Average Value Number Average Value Number Average Value Number Average Value
LOANS ORIGINATED 5 $308,190 16 $305,495 39 $278,405 7 $78,703 1 $236,890 3 $253,430 0 $0 APPLICATIONS APPROVED, NOT ACCEPTED 0 $0 2 $231,575 4 $307,225 1 $111,020 0 $0 0 $0 0 $0 APPLICATIONS DENIED 0 $0 4 $231,488 16 $276,820 2 $76,955 0 $0 1 $250,700 1 $4,940 APPLICATIONS WITHDRAWN 1 $183,940 2 $318,790 7 $271,957 1 $252,570 0 $0 1 $210,660 0 $0 FILES CLOSED FOR INCOMPLETENESS 0 $0 1 $236,350 2 $291,405 0 $0 0 $0 0 $0 0 $0
Aggregated Statistics For Year 2007(Based on 2 partial tracts) A) FHA, FSA/RHS & VA B) Conventional C) Refinancings D) Home Improvement Loans E) Loans on Dwellings For 5+ Families F) Non-occupant Loans on Number Average Value Number Average Value Number Average Value Number Average Value Number Average Value Number Average Value
LOANS ORIGINATED 1 $327,880 29 $300,653 42 $237,569 11 $87,353 1 $289,460 3 $229,990 APPLICATIONS APPROVED, NOT ACCEPTED 0 $0 5 $253,026 7 $326,670 1 $57,710 0 $0 1 $918,930 APPLICATIONS DENIED 0 $0 8 $285,038 19 $263,806 5 $88,660 0 $0 1 $308,360 APPLICATIONS WITHDRAWN 0 $0 5 $372,600 8 $262,789 0 $0 0 $0 1 $166,360 FILES CLOSED FOR INCOMPLETENESS 0 $0 0 $0 4 $224,345 0 $0 0 $0 0 $0
Aggregated Statistics For Year 2006(Based on 2 partial tracts) B) Conventional C) Refinancings D) Home Improvement Loans E) Loans on Dwellings For 5+ Families F) Non-occupant Loans on Number Average Value Number Average Value Number Average Value Number Average Value Number Average Value
LOANS ORIGINATED 41 $256,529 56 $232,466 18 $78,576 1 $452,030 3 $283,687 APPLICATIONS APPROVED, NOT ACCEPTED 4 $194,925 6 $237,002 2 $45,365 0 $0 0 $0 APPLICATIONS DENIED 4 $338,000 24 $265,138 4 $37,400 0 $0 2 $265,775 APPLICATIONS WITHDRAWN 3 $355,807 15 $279,787 1 $306,280 0 $0 1 $196,040 FILES CLOSED FOR INCOMPLETENESS 1 $145,600 4 $279,685 0 $0 0 $0 0 $0
Aggregated Statistics For Year 2005(Based on 2 partial tracts) B) Conventional C) Refinancings D) Home Improvement Loans E) Loans on Dwellings For 5+ Families F) Non-occupant Loans on Number Average Value Number Average Value Number Average Value Number Average Value Number Average Value
LOANS ORIGINATED 45 $230,707 69 $244,688 15 $107,883 1 $710,390 4 $260,388 APPLICATIONS APPROVED, NOT ACCEPTED 4 $235,022 8 $239,318 1 $72,930 0 $0 1 $250,410 APPLICATIONS DENIED 6 $202,038 22 $226,517 3 $102,273 0 $0 2 $146,045 APPLICATIONS WITHDRAWN 7 $251,739 17 $246,187 2 $191,530 0 $0 0 $0 FILES CLOSED FOR INCOMPLETENESS 2 $272,590 8 $236,469 0 $0 0 $0 1 $194,130
Aggregated Statistics For Year 2004(Based on 2 partial tracts) B) Conventional C) Refinancings D) Home Improvement Loans E) Loans on Dwellings For 5+ Families F) Non-occupant Loans on Number Average Value Number Average Value Number Average Value Number Average Value Number Average Value
LOANS ORIGINATED 45 $282,808 88 $226,226 11 $97,047 1 $165,720 4 $264,392 APPLICATIONS APPROVED, NOT ACCEPTED 5 $270,786 10 $234,531 1 $69,920 0 $0 1 $77,000 APPLICATIONS DENIED 5 $274,786 15 $223,583 4 $62,135 0 $0 2 $258,990 APPLICATIONS WITHDRAWN 3 $333,567 25 $214,626 1 $131,250 0 $0 0 $0 FILES CLOSED FOR INCOMPLETENESS 1 $220,200 10 $285,534 0 $0 0 $0 0 $0
Aggregated Statistics For Year 2003(Based on 2 partial tracts) A) FHA, FSA/RHS & VA B) Conventional C) Refinancings D) Home Improvement Loans E) Loans on Dwellings For 5+ Families F) Non-occupant Loans on Number Average Value Number Average Value Number Average Value Number Average Value Number Average Value Number Average Value
LOANS ORIGINATED 1 $201,830 37 $255,037 241 $201,363 4 $57,910 2 $628,430 6 $168,643 APPLICATIONS APPROVED, NOT ACCEPTED 0 $0 4 $243,720 23 $199,395 2 $30,995 0 $0 1 $145,090 APPLICATIONS DENIED 1 $160,270 5 $242,166 31 $226,551 3 $64,683 0 $0 1 $401,440 APPLICATIONS WITHDRAWN 0 $0 2 $257,265 21 $204,185 1 $110,590 0 $0 0 $0 FILES CLOSED FOR INCOMPLETENESS 0 $0 0 $0 3 $180,280 0 $0 0 $0 0 $0
Aggregated Statistics For Year 2002(Based on 2 partial tracts) A) FHA, FSA/RHS & VA B) Conventional C) Refinancings D) Home Improvement Loans E) Loans on Dwellings For 5+ Families F) Non-occupant Loans on Number Average Value Number Average Value Number Average Value Number Average Value Number Average Value Number Average Value
LOANS ORIGINATED 1 $350,080 33 $233,298 175 $189,352 13 $66,767 1 $583,740 4 $182,935 APPLICATIONS APPROVED, NOT ACCEPTED 0 $0 4 $258,892 18 $178,355 3 $43,153 0 $0 0 $0 APPLICATIONS DENIED 0 $0 4 $344,558 20 $170,695 4 $45,785 0 $0 0 $0 APPLICATIONS WITHDRAWN 0 $0 2 $236,820 15 $187,579 1 $48,610 0 $0 1 $146,930 FILES CLOSED FOR INCOMPLETENESS 0 $0 1 $204,510 6 $174,978 0 $0 0 $0 0 $0
Aggregated Statistics For Year 2001(Based on 2 partial tracts) A) FHA, FSA/RHS & VA B) Conventional C) Refinancings D) Home Improvement Loans E) Loans on Dwellings For 5+ Families F) Non-occupant Loans on Number Average Value Number Average Value Number Average Value Number Average Value Number Average Value Number Average Value
LOANS ORIGINATED 1 $147,370 36 $212,255 114 $174,434 12 $47,595 1 $155,680 3 $167,823 APPLICATIONS APPROVED, NOT ACCEPTED 0 $0 3 $205,777 10 $180,165 3 $35,637 0 $0 1 $158,910 APPLICATIONS DENIED 0 $0 2 $281,670 21 $168,031 4 $28,692 0 $0 1 $52,290 APPLICATIONS WITHDRAWN 0 $0 1 $239,300 13 $159,758 2 $67,820 0 $0 0 $0 FILES CLOSED FOR INCOMPLETENESS 0 $0 0 $0 2 $158,385 0 $0 0 $0 0 $0
Aggregated Statistics For Year 2000(Based on 2 partial tracts) A) FHA, FSA/RHS & VA B) Conventional C) Refinancings D) Home Improvement Loans E) Loans on Dwellings For 5+ Families F) Non-occupant Loans on Number Average Value Number Average Value Number Average Value Number Average Value Number Average Value Number Average Value
LOANS ORIGINATED 2 $217,625 39 $186,015 25 $121,889 11 $29,984 0 $0 0 $0 APPLICATIONS APPROVED, NOT ACCEPTED 0 $0 2 $170,680 3 $103,580 5 $34,622 0 $0 0 $0 APPLICATIONS DENIED 0 $0 4 $181,880 10 $136,847 4 $21,740 0 $0 1 $231,290 APPLICATIONS WITHDRAWN 0 $0 3 $175,500 8 $117,468 2 $28,345 1 $2,095,170 0 $0 FILES CLOSED FOR INCOMPLETENESS 0 $0 1 $120,740 1 $173,260 0 $0 0 $0 0 $0
Aggregated Statistics For Year 1999(Based on 3 partial tracts) A) FHA, FSA/RHS & VA B) Conventional C) Refinancings D) Home Improvement Loans F) Non-occupant Loans on Number Average Value Number Average Value Number Average Value Number Average Value Number Average Value
LOANS ORIGINATED 3 $144,740 34 $172,216 59 $134,806 8 $34,142 2 $145,890 APPLICATIONS APPROVED, NOT ACCEPTED 0 $0 2 $133,545 5 $110,522 2 $37,645 1 $55,600 APPLICATIONS DENIED 0 $0 4 $119,828 14 $123,971 5 $29,856 1 $104,180 APPLICATIONS WITHDRAWN 0 $0 2 $180,890 12 $141,841 2 $46,145 0 $0 FILES CLOSED FOR INCOMPLETENESS 0 $0 0 $0 3 $138,860 0 $0 0 $0
Detailed HMDA statistics for the following Tracts:
4101.00
, 4104.00
Private Mortgage Insurance Companies Aggregated Statistics For Year 2009(Based on 2 partial tracts) A) Conventional B) Refinancings Number Average Value Number Average Value
LOANS ORIGINATED 3 $261,777 2 $327,310 APPLICATIONS APPROVED, NOT ACCEPTED 0 $0 1 $362,950 APPLICATIONS DENIED 0 $0 0 $0 APPLICATIONS WITHDRAWN 0 $0 1 $182,310 FILES CLOSED FOR INCOMPLETENESS 0 $0 0 $0
Aggregated Statistics For Year 2008(Based on 2 partial tracts) A) Conventional B) Refinancings Number Average Value Number Average Value
LOANS ORIGINATED 3 $357,973 2 $303,455 APPLICATIONS APPROVED, NOT ACCEPTED 1 $246,800 2 $259,000 APPLICATIONS DENIED 1 $234,480 0 $0 APPLICATIONS WITHDRAWN 1 $197,270 0 $0 FILES CLOSED FOR INCOMPLETENESS 0 $0 0 $0
Aggregated Statistics For Year 2007(Based on 2 partial tracts) A) Conventional B) Refinancings Number Average Value Number Average Value
LOANS ORIGINATED 5 $298,810 3 $332,467 APPLICATIONS APPROVED, NOT ACCEPTED 1 $351,550 1 $322,070 APPLICATIONS DENIED 0 $0 0 $0 APPLICATIONS WITHDRAWN 0 $0 0 $0 FILES CLOSED FOR INCOMPLETENESS 0 $0 0 $0
Aggregated Statistics For Year 2006(Based on 2 partial tracts) A) Conventional B) Refinancings Number Average Value Number Average Value
LOANS ORIGINATED 3 $266,940 2 $265,705 APPLICATIONS APPROVED, NOT ACCEPTED 0 $0 0 $0 APPLICATIONS DENIED 0 $0 0 $0 APPLICATIONS WITHDRAWN 0 $0 0 $0 FILES CLOSED FOR INCOMPLETENESS 0 $0 0 $0
Aggregated Statistics For Year 2005(Based on 2 partial tracts) A) Conventional B) Refinancings Number Average Value Number Average Value
LOANS ORIGINATED 4 $306,942 1 $272,140 APPLICATIONS APPROVED, NOT ACCEPTED 1 $313,730 0 $0 APPLICATIONS DENIED 0 $0 0 $0 APPLICATIONS WITHDRAWN 0 $0 0 $0 FILES CLOSED FOR INCOMPLETENESS 0 $0 0 $0
Aggregated Statistics For Year 2004(Based on 2 partial tracts) A) Conventional B) Refinancings Number Average Value Number Average Value
LOANS ORIGINATED 4 $296,865 2 $269,095 APPLICATIONS APPROVED, NOT ACCEPTED 1 $213,360 0 $0 APPLICATIONS DENIED 0 $0 0 $0 APPLICATIONS WITHDRAWN 0 $0 0 $0 FILES CLOSED FOR INCOMPLETENESS 0 $0 0 $0
Aggregated Statistics For Year 2003(Based on 2 partial tracts) A) Conventional B) Refinancings Number Average Value Number Average Value
LOANS ORIGINATED 8 $257,355 5 $275,604 APPLICATIONS APPROVED, NOT ACCEPTED 3 $211,657 1 $130,030 APPLICATIONS DENIED 0 $0 0 $0 APPLICATIONS WITHDRAWN 0 $0 1 $263,390 FILES CLOSED FOR INCOMPLETENESS 0 $0 0 $0
Aggregated Statistics For Year 2002(Based on 2 partial tracts) A) Conventional B) Refinancings Number Average Value Number Average Value
LOANS ORIGINATED 7 $230,714 2 $210,005 APPLICATIONS APPROVED, NOT ACCEPTED 1 $244,530 0 $0 APPLICATIONS DENIED 0 $0 0 $0 APPLICATIONS WITHDRAWN 0 $0 0 $0 FILES CLOSED FOR INCOMPLETENESS 0 $0 0 $0
Aggregated Statistics For Year 2001(Based on 2 partial tracts) A) Conventional B) Refinancings C) Non-occupant Loans on Number Average Value Number Average Value Number Average Value
LOANS ORIGINATED 8 $236,818 7 $211,743 1 $141,490 APPLICATIONS APPROVED, NOT ACCEPTED 2 $183,910 1 $250,330 0 $0 APPLICATIONS DENIED 0 $0 0 $0 0 $0 APPLICATIONS WITHDRAWN 0 $0 0 $0 0 $0 FILES CLOSED FOR INCOMPLETENESS 0 $0 0 $0 0 $0
Aggregated Statistics For Year 2000(Based on 2 partial tracts) A) Conventional B) Refinancings Number Average Value Number Average Value
LOANS ORIGINATED 10 $200,590 1 $259,970 APPLICATIONS APPROVED, NOT ACCEPTED 1 $189,200 0 $0 APPLICATIONS DENIED 0 $0 0 $0 APPLICATIONS WITHDRAWN 1 $132,840 0 $0 FILES CLOSED FOR INCOMPLETENESS 0 $0 0 $0
Aggregated Statistics For Year 1999(Based on 3 partial tracts) A) Conventional B) Refinancings Number Average Value Number Average Value
LOANS ORIGINATED 8 $171,650 2 $198,910 APPLICATIONS APPROVED, NOT ACCEPTED 1 $228,890 0 $0 APPLICATIONS DENIED 1 $137,970 0 $0 APPLICATIONS WITHDRAWN 1 $116,150 0 $0 FILES CLOSED FOR INCOMPLETENESS 0 $0 0 $0
Detailed PMIC statistics for the following Tracts:
4101.00
, 4104.00 Foxborough compared to Massachusetts state average:
Unemployed percentage significantly below state average. Length of stay since moving in significantly above state average. Percentage of population with a bachelor's degree or higher above state average. Foxborough on our top lists :
#23 on the list of "Top 101 cities with largest percentage of females in industries: other services, except public administration (population 5,000+)"
#73 on the list of "Top 101 cities with the most residents born in Other Western Africa (population 500+)"
#77 on the list of "Top 101 cities with the most residents born in Other Northern Africa (population 500+)"
#83 on the list of "Top 101 cities with largest percentage of males in industries: management of companies and enterprises (population 5,000+)"
#73 (02035) on the list of "Top 101 zip codes with the largest percentage of Irish first ancestries (pop 5,000+)"
#7 on the list of "Top 101 counties with the highest percentage of residents that visited a dentist within the past year"
#12 on the list of "Top 101 counties with the lowest percentage of residents that keep firearms around their homes"
#13 on the list of "Top 101 counties with the best general health status score of residents (1-5), 3 years of data"
#18 on the list of "Top 101 counties with the lowest Nitrogen Dioxide air pollution readings in 2012 (ppm)"
#25 on the list of "Top 101 counties with the lowest number of infant deaths per 1000 residents 2007-2013 (pop. 50,000+)"
There are 2 pilots and no other airmen in this city.
Top Patent Applicants
John R. Martin (11)
David Sharpe (7)
Anthony Jeannotte (7)
Giordano Caponigro (6)
Jon Ian Montcrieff (6)
Steven P. Gygi (4)
Anthony C. Gilby (4)
Luc Farmer (4)
Brian Ganter (3)
Jon I. Montcrieff (3)
Total of 108 patent applications in 2008-2024.


 Recent articles from our blog. Our writers, many of them Ph.D. graduates or candidates, create easy-to-read articles on a wide variety of topics.


 (11.7 miles


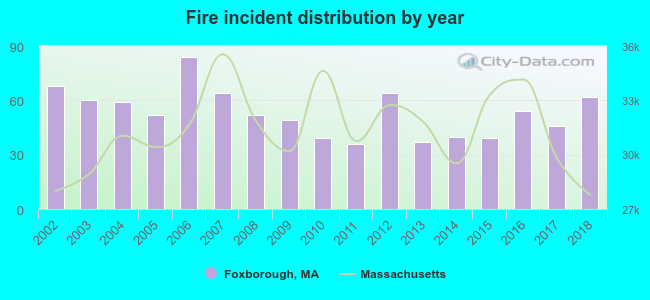 According to the data from the years 2002 - 2018 the average number of fire incidents per year is 53. The highest number of reported fire incidents - 84 took place in 2006, and the least - 36 in 2011. The data has a decreasing trend.
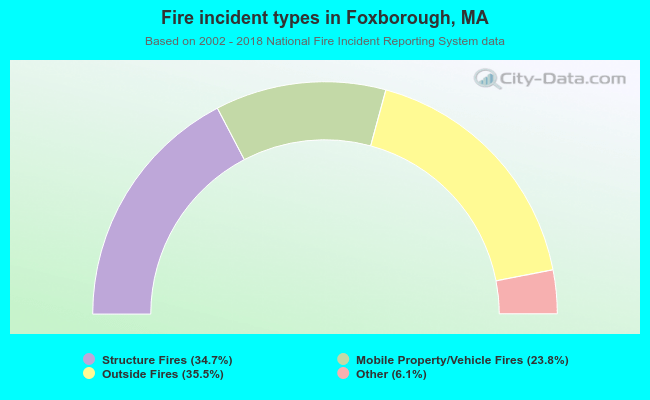 When looking into fire subcategories, the most incidents belonged to: Outside Fires (35.5%), and Structure Fires (34.7%).

