Franklin, Indiana Submit your own pictures of this city and show them to the world
OSM Map
General Map
Google Map
MSN Map
OSM Map
General Map
Google Map
MSN Map
OSM Map
General Map
Google Map
MSN Map
OSM Map
General Map
Google Map
MSN Map
Please wait while loading the map...
Population in 2022: 25,728 (99% urban, 1% rural). Population change since 2000: +32.2%Males: 11,999 Females: 13,729
March 2022 cost of living index in Franklin: 87.6 (less than average, U.S. average is 100) Percentage of residents living in poverty in 2022: 11.2%for White Non-Hispanic residents , 18.1% for Hispanic or Latino residents , 13.5% for other race residents , 25.1% for two or more races residents )
Profiles of local businesses
Business Search - 14 Million verified businesses
Data:
Median household income ($)
Median household income (% change since 2000)
Household income diversity
Ratio of average income to average house value (%)
Ratio of average income to average rent
Median household income ($) - White
Median household income ($) - Black or African American
Median household income ($) - Asian
Median household income ($) - Hispanic or Latino
Median household income ($) - American Indian and Alaska Native
Median household income ($) - Multirace
Median household income ($) - Other Race
Median household income for houses/condos with a mortgage ($)
Median household income for apartments without a mortgage ($)
Races - White alone (%)
Races - White alone (% change since 2000)
Races - Black alone (%)
Races - Black alone (% change since 2000)
Races - American Indian alone (%)
Races - American Indian alone (% change since 2000)
Races - Asian alone (%)
Races - Asian alone (% change since 2000)
Races - Hispanic (%)
Races - Hispanic (% change since 2000)
Races - Native Hawaiian and Other Pacific Islander alone (%)
Races - Native Hawaiian and Other Pacific Islander alone (% change since 2000)
Races - Two or more races (%)
Races - Two or more races (% change since 2000)
Races - Other race alone (%)
Races - Other race alone (% change since 2000)
Racial diversity
Unemployment (%)
Unemployment (% change since 2000)
Unemployment (%) - White
Unemployment (%) - Black or African American
Unemployment (%) - Asian
Unemployment (%) - Hispanic or Latino
Unemployment (%) - American Indian and Alaska Native
Unemployment (%) - Multirace
Unemployment (%) - Other Race
Population density (people per square mile)
Population - Males (%)
Population - Females (%)
Population - Males (%) - White
Population - Males (%) - Black or African American
Population - Males (%) - Asian
Population - Males (%) - Hispanic or Latino
Population - Males (%) - American Indian and Alaska Native
Population - Males (%) - Multirace
Population - Males (%) - Other Race
Population - Females (%) - White
Population - Females (%) - Black or African American
Population - Females (%) - Asian
Population - Females (%) - Hispanic or Latino
Population - Females (%) - American Indian and Alaska Native
Population - Females (%) - Multirace
Population - Females (%) - Other Race
Coronavirus confirmed cases (Apr 24, 2024)
Deaths caused by coronavirus (Apr 24, 2024)
Coronavirus confirmed cases (per 100k population) (Apr 24, 2024)
Deaths caused by coronavirus (per 100k population) (Apr 24, 2024)
Daily increase in number of cases (Apr 24, 2024)
Weekly increase in number of cases (Apr 24, 2024)
Cases doubled (in days) (Apr 24, 2024)
Hospitalized patients (Apr 18, 2022)
Negative test results (Apr 18, 2022)
Total test results (Apr 18, 2022)
COVID Vaccine doses distributed (per 100k population) (Sep 19, 2023)
COVID Vaccine doses administered (per 100k population) (Sep 19, 2023)
COVID Vaccine doses distributed (Sep 19, 2023)
COVID Vaccine doses administered (Sep 19, 2023)
Likely homosexual households (%)
Likely homosexual households (% change since 2000)
Likely homosexual households - Lesbian couples (%)
Likely homosexual households - Lesbian couples (% change since 2000)
Likely homosexual households - Gay men (%)
Likely homosexual households - Gay men (% change since 2000)
Cost of living index
Median gross rent ($)
Median contract rent ($)
Median monthly housing costs ($)
Median house or condo value ($)
Median house or condo value ($ change since 2000)
Mean house or condo value by units in structure - 1, detached ($)
Mean house or condo value by units in structure - 1, attached ($)
Mean house or condo value by units in structure - 2 ($)
Mean house or condo value by units in structure by units in structure - 3 or 4 ($)
Mean house or condo value by units in structure - 5 or more ($)
Mean house or condo value by units in structure - Boat, RV, van, etc. ($)
Mean house or condo value by units in structure - Mobile home ($)
Median house or condo value ($) - White
Median house or condo value ($) - Black or African American
Median house or condo value ($) - Asian
Median house or condo value ($) - Hispanic or Latino
Median house or condo value ($) - American Indian and Alaska Native
Median house or condo value ($) - Multirace
Median house or condo value ($) - Other Race
Median resident age
Resident age diversity
Median resident age - Males
Median resident age - Females
Median resident age - White
Median resident age - Black or African American
Median resident age - Asian
Median resident age - Hispanic or Latino
Median resident age - American Indian and Alaska Native
Median resident age - Multirace
Median resident age - Other Race
Median resident age - Males - White
Median resident age - Males - Black or African American
Median resident age - Males - Asian
Median resident age - Males - Hispanic or Latino
Median resident age - Males - American Indian and Alaska Native
Median resident age - Males - Multirace
Median resident age - Males - Other Race
Median resident age - Females - White
Median resident age - Females - Black or African American
Median resident age - Females - Asian
Median resident age - Females - Hispanic or Latino
Median resident age - Females - American Indian and Alaska Native
Median resident age - Females - Multirace
Median resident age - Females - Other Race
Commute - mean travel time to work (minutes)
Travel time to work - Less than 5 minutes (%)
Travel time to work - Less than 5 minutes (% change since 2000)
Travel time to work - 5 to 9 minutes (%)
Travel time to work - 5 to 9 minutes (% change since 2000)
Travel time to work - 10 to 19 minutes (%)
Travel time to work - 10 to 19 minutes (% change since 2000)
Travel time to work - 20 to 29 minutes (%)
Travel time to work - 20 to 29 minutes (% change since 2000)
Travel time to work - 30 to 39 minutes (%)
Travel time to work - 30 to 39 minutes (% change since 2000)
Travel time to work - 40 to 59 minutes (%)
Travel time to work - 40 to 59 minutes (% change since 2000)
Travel time to work - 60 to 89 minutes (%)
Travel time to work - 60 to 89 minutes (% change since 2000)
Travel time to work - 90 or more minutes (%)
Travel time to work - 90 or more minutes (% change since 2000)
Marital status - Never married (%)
Marital status - Now married (%)
Marital status - Separated (%)
Marital status - Widowed (%)
Marital status - Divorced (%)
Median family income ($)
Median family income (% change since 2000)
Median non-family income ($)
Median non-family income (% change since 2000)
Median per capita income ($)
Median per capita income (% change since 2000)
Median family income ($) - White
Median family income ($) - Black or African American
Median family income ($) - Asian
Median family income ($) - Hispanic or Latino
Median family income ($) - American Indian and Alaska Native
Median family income ($) - Multirace
Median family income ($) - Other Race
Median year house/condo built
Median year apartment built
Year house built - Built 2005 or later (%)
Year house built - Built 2000 to 2004 (%)
Year house built - Built 1990 to 1999 (%)
Year house built - Built 1980 to 1989 (%)
Year house built - Built 1970 to 1979 (%)
Year house built - Built 1960 to 1969 (%)
Year house built - Built 1950 to 1959 (%)
Year house built - Built 1940 to 1949 (%)
Year house built - Built 1939 or earlier (%)
Average household size
Household density (households per square mile)
Average household size - White
Average household size - Black or African American
Average household size - Asian
Average household size - Hispanic or Latino
Average household size - American Indian and Alaska Native
Average household size - Multirace
Average household size - Other Race
Occupied housing units (%)
Vacant housing units (%)
Owner occupied housing units (%)
Renter occupied housing units (%)
Vacancy status - For rent (%)
Vacancy status - For sale only (%)
Vacancy status - Rented or sold, not occupied (%)
Vacancy status - For seasonal, recreational, or occasional use (%)
Vacancy status - For migrant workers (%)
Vacancy status - Other vacant (%)
Residents with income below the poverty level (%)
Residents with income below 50% of the poverty level (%)
Children below poverty level (%)
Poor families by family type - Married-couple family (%)
Poor families by family type - Male, no wife present (%)
Poor families by family type - Female, no husband present (%)
Poverty status for native-born residents (%)
Poverty status for foreign-born residents (%)
Poverty among high school graduates not in families (%)
Poverty among people who did not graduate high school not in families (%)
Residents with income below the poverty level (%) - White
Residents with income below the poverty level (%) - Black or African American
Residents with income below the poverty level (%) - Asian
Residents with income below the poverty level (%) - Hispanic or Latino
Residents with income below the poverty level (%) - American Indian and Alaska Native
Residents with income below the poverty level (%) - Multirace
Residents with income below the poverty level (%) - Other Race
Air pollution - Air Quality Index (AQI)
Air pollution - CO
Air pollution - NO2
Air pollution - SO2
Air pollution - Ozone
Air pollution - PM10
Air pollution - PM25
Air pollution - Pb
Crime - Murders per 100,000 population
Crime - Rapes per 100,000 population
Crime - Robberies per 100,000 population
Crime - Assaults per 100,000 population
Crime - Burglaries per 100,000 population
Crime - Thefts per 100,000 population
Crime - Auto thefts per 100,000 population
Crime - Arson per 100,000 population
Crime - City-data.com crime index
Crime - Violent crime index
Crime - Property crime index
Crime - Murders per 100,000 population (5 year average)
Crime - Rapes per 100,000 population (5 year average)
Crime - Robberies per 100,000 population (5 year average)
Crime - Assaults per 100,000 population (5 year average)
Crime - Burglaries per 100,000 population (5 year average)
Crime - Thefts per 100,000 population (5 year average)
Crime - Auto thefts per 100,000 population (5 year average)
Crime - Arson per 100,000 population (5 year average)
Crime - City-data.com crime index (5 year average)
Crime - Violent crime index (5 year average)
Crime - Property crime index (5 year average)
1996 Presidential Elections Results (%) - Democratic Party (Clinton)
1996 Presidential Elections Results (%) - Republican Party (Dole)
1996 Presidential Elections Results (%) - Other
2000 Presidential Elections Results (%) - Democratic Party (Gore)
2000 Presidential Elections Results (%) - Republican Party (Bush)
2000 Presidential Elections Results (%) - Other
2004 Presidential Elections Results (%) - Democratic Party (Kerry)
2004 Presidential Elections Results (%) - Republican Party (Bush)
2004 Presidential Elections Results (%) - Other
2008 Presidential Elections Results (%) - Democratic Party (Obama)
2008 Presidential Elections Results (%) - Republican Party (McCain)
2008 Presidential Elections Results (%) - Other
2012 Presidential Elections Results (%) - Democratic Party (Obama)
2012 Presidential Elections Results (%) - Republican Party (Romney)
2012 Presidential Elections Results (%) - Other
2016 Presidential Elections Results (%) - Democratic Party (Clinton)
2016 Presidential Elections Results (%) - Republican Party (Trump)
2016 Presidential Elections Results (%) - Other
2020 Presidential Elections Results (%) - Democratic Party (Biden)
2020 Presidential Elections Results (%) - Republican Party (Trump)
2020 Presidential Elections Results (%) - Other
Ancestries Reported - Arab (%)
Ancestries Reported - Czech (%)
Ancestries Reported - Danish (%)
Ancestries Reported - Dutch (%)
Ancestries Reported - English (%)
Ancestries Reported - French (%)
Ancestries Reported - French Canadian (%)
Ancestries Reported - German (%)
Ancestries Reported - Greek (%)
Ancestries Reported - Hungarian (%)
Ancestries Reported - Irish (%)
Ancestries Reported - Italian (%)
Ancestries Reported - Lithuanian (%)
Ancestries Reported - Norwegian (%)
Ancestries Reported - Polish (%)
Ancestries Reported - Portuguese (%)
Ancestries Reported - Russian (%)
Ancestries Reported - Scotch-Irish (%)
Ancestries Reported - Scottish (%)
Ancestries Reported - Slovak (%)
Ancestries Reported - Subsaharan African (%)
Ancestries Reported - Swedish (%)
Ancestries Reported - Swiss (%)
Ancestries Reported - Ukrainian (%)
Ancestries Reported - United States (%)
Ancestries Reported - Welsh (%)
Ancestries Reported - West Indian (%)
Ancestries Reported - Other (%)
Educational Attainment - No schooling completed (%)
Educational Attainment - Less than high school (%)
Educational Attainment - High school or equivalent (%)
Educational Attainment - Less than 1 year of college (%)
Educational Attainment - 1 or more years of college (%)
Educational Attainment - Associate degree (%)
Educational Attainment - Bachelor's degree (%)
Educational Attainment - Master's degree (%)
Educational Attainment - Professional school degree (%)
Educational Attainment - Doctorate degree (%)
School Enrollment - Nursery, preschool (%)
School Enrollment - Kindergarten (%)
School Enrollment - Grade 1 to 4 (%)
School Enrollment - Grade 5 to 8 (%)
School Enrollment - Grade 9 to 12 (%)
School Enrollment - College undergrad (%)
School Enrollment - Graduate or professional (%)
School Enrollment - Not enrolled in school (%)
School enrollment - Public schools (%)
School enrollment - Private schools (%)
School enrollment - Not enrolled (%)
Median number of rooms in houses and condos
Median number of rooms in apartments
Housing units lacking complete plumbing facilities (%)
Housing units lacking complete kitchen facilities (%)
Density of houses
Urban houses (%)
Rural houses (%)
Households with people 60 years and over (%)
Households with people 65 years and over (%)
Households with people 75 years and over (%)
Households with one or more nonrelatives (%)
Households with no nonrelatives (%)
Population in households (%)
Family households (%)
Nonfamily households (%)
Population in families (%)
Family households with own children (%)
Median number of bedrooms in owner occupied houses
Mean number of bedrooms in owner occupied houses
Median number of bedrooms in renter occupied houses
Mean number of bedrooms in renter occupied houses
Median number of vehichles in owner occupied houses
Mean number of vehichles in owner occupied houses
Median number of vehichles in renter occupied houses
Mean number of vehichles in renter occupied houses
Mortgage status - with mortgage (%)
Mortgage status - with second mortgage (%)
Mortgage status - with home equity loan (%)
Mortgage status - with both second mortgage and home equity loan (%)
Mortgage status - without a mortgage (%)
Average family size
Average family size - White
Average family size - Black or African American
Average family size - Asian
Average family size - Hispanic or Latino
Average family size - American Indian and Alaska Native
Average family size - Multirace
Average family size - Other Race
Geographical mobility - Same house 1 year ago (%)
Geographical mobility - Moved within same county (%)
Geographical mobility - Moved from different county within same state (%)
Geographical mobility - Moved from different state (%)
Geographical mobility - Moved from abroad (%)
Place of birth - Born in state of residence (%)
Place of birth - Born in other state (%)
Place of birth - Native, outside of US (%)
Place of birth - Foreign born (%)
Housing units in structures - 1, detached (%)
Housing units in structures - 1, attached (%)
Housing units in structures - 2 (%)
Housing units in structures - 3 or 4 (%)
Housing units in structures - 5 to 9 (%)
Housing units in structures - 10 to 19 (%)
Housing units in structures - 20 to 49 (%)
Housing units in structures - 50 or more (%)
Housing units in structures - Mobile home (%)
Housing units in structures - Boat, RV, van, etc. (%)
House/condo owner moved in on average (years ago)
Renter moved in on average (years ago)
Year householder moved into unit - Moved in 1999 to March 2000 (%)
Year householder moved into unit - Moved in 1995 to 1998 (%)
Year householder moved into unit - Moved in 1990 to 1994 (%)
Year householder moved into unit - Moved in 1980 to 1989 (%)
Year householder moved into unit - Moved in 1970 to 1979 (%)
Year householder moved into unit - Moved in 1969 or earlier (%)
Means of transportation to work - Drove car alone (%)
Means of transportation to work - Carpooled (%)
Means of transportation to work - Public transportation (%)
Means of transportation to work - Bus or trolley bus (%)
Means of transportation to work - Streetcar or trolley car (%)
Means of transportation to work - Subway or elevated (%)
Means of transportation to work - Railroad (%)
Means of transportation to work - Ferryboat (%)
Means of transportation to work - Taxicab (%)
Means of transportation to work - Motorcycle (%)
Means of transportation to work - Bicycle (%)
Means of transportation to work - Walked (%)
Means of transportation to work - Other means (%)
Working at home (%)
Industry diversity
Most Common Industries - Agriculture, forestry, fishing and hunting, and mining (%)
Most Common Industries - Agriculture, forestry, fishing and hunting (%)
Most Common Industries - Mining, quarrying, and oil and gas extraction (%)
Most Common Industries - Construction (%)
Most Common Industries - Manufacturing (%)
Most Common Industries - Wholesale trade (%)
Most Common Industries - Retail trade (%)
Most Common Industries - Transportation and warehousing, and utilities (%)
Most Common Industries - Transportation and warehousing (%)
Most Common Industries - Utilities (%)
Most Common Industries - Information (%)
Most Common Industries - Finance and insurance, and real estate and rental and leasing (%)
Most Common Industries - Finance and insurance (%)
Most Common Industries - Real estate and rental and leasing (%)
Most Common Industries - Professional, scientific, and management, and administrative and waste management services (%)
Most Common Industries - Professional, scientific, and technical services (%)
Most Common Industries - Management of companies and enterprises (%)
Most Common Industries - Administrative and support and waste management services (%)
Most Common Industries - Educational services, and health care and social assistance (%)
Most Common Industries - Educational services (%)
Most Common Industries - Health care and social assistance (%)
Most Common Industries - Arts, entertainment, and recreation, and accommodation and food services (%)
Most Common Industries - Arts, entertainment, and recreation (%)
Most Common Industries - Accommodation and food services (%)
Most Common Industries - Other services, except public administration (%)
Most Common Industries - Public administration (%)
Occupation diversity
Most Common Occupations - Management, business, science, and arts occupations (%)
Most Common Occupations - Management, business, and financial occupations (%)
Most Common Occupations - Management occupations (%)
Most Common Occupations - Business and financial operations occupations (%)
Most Common Occupations - Computer, engineering, and science occupations (%)
Most Common Occupations - Computer and mathematical occupations (%)
Most Common Occupations - Architecture and engineering occupations (%)
Most Common Occupations - Life, physical, and social science occupations (%)
Most Common Occupations - Education, legal, community service, arts, and media occupations (%)
Most Common Occupations - Community and social service occupations (%)
Most Common Occupations - Legal occupations (%)
Most Common Occupations - Education, training, and library occupations (%)
Most Common Occupations - Arts, design, entertainment, sports, and media occupations (%)
Most Common Occupations - Healthcare practitioners and technical occupations (%)
Most Common Occupations - Health diagnosing and treating practitioners and other technical occupations (%)
Most Common Occupations - Health technologists and technicians (%)
Most Common Occupations - Service occupations (%)
Most Common Occupations - Healthcare support occupations (%)
Most Common Occupations - Protective service occupations (%)
Most Common Occupations - Fire fighting and prevention, and other protective service workers including supervisors (%)
Most Common Occupations - Law enforcement workers including supervisors (%)
Most Common Occupations - Food preparation and serving related occupations (%)
Most Common Occupations - Building and grounds cleaning and maintenance occupations (%)
Most Common Occupations - Personal care and service occupations (%)
Most Common Occupations - Sales and office occupations (%)
Most Common Occupations - Sales and related occupations (%)
Most Common Occupations - Office and administrative support occupations (%)
Most Common Occupations - Natural resources, construction, and maintenance occupations (%)
Most Common Occupations - Farming, fishing, and forestry occupations (%)
Most Common Occupations - Construction and extraction occupations (%)
Most Common Occupations - Installation, maintenance, and repair occupations (%)
Most Common Occupations - Production, transportation, and material moving occupations (%)
Most Common Occupations - Production occupations (%)
Most Common Occupations - Transportation occupations (%)
Most Common Occupations - Material moving occupations (%)
People in Group quarters - Institutionalized population (%)
People in Group quarters - Correctional institutions (%)
People in Group quarters - Federal prisons and detention centers (%)
People in Group quarters - Halfway houses (%)
People in Group quarters - Local jails and other confinement facilities (including police lockups) (%)
People in Group quarters - Military disciplinary barracks (%)
People in Group quarters - State prisons (%)
People in Group quarters - Other types of correctional institutions (%)
People in Group quarters - Nursing homes (%)
People in Group quarters - Hospitals/wards, hospices, and schools for the handicapped (%)
People in Group quarters - Hospitals/wards and hospices for chronically ill (%)
People in Group quarters - Hospices or homes for chronically ill (%)
People in Group quarters - Military hospitals or wards for chronically ill (%)
People in Group quarters - Other hospitals or wards for chronically ill (%)
People in Group quarters - Hospitals or wards for drug/alcohol abuse (%)
People in Group quarters - Mental (Psychiatric) hospitals or wards (%)
People in Group quarters - Schools, hospitals, or wards for the mentally retarded (%)
People in Group quarters - Schools, hospitals, or wards for the physically handicapped (%)
People in Group quarters - Institutions for the deaf (%)
People in Group quarters - Institutions for the blind (%)
People in Group quarters - Orthopedic wards and institutions for the physically handicapped (%)
People in Group quarters - Wards in general hospitals for patients who have no usual home elsewhere (%)
People in Group quarters - Wards in military hospitals for patients who have no usual home elsewhere (%)
People in Group quarters - Juvenile institutions (%)
People in Group quarters - Long-term care (%)
People in Group quarters - Homes for abused, dependent, and neglected children (%)
People in Group quarters - Residential treatment centers for emotionally disturbed children (%)
People in Group quarters - Training schools for juvenile delinquents (%)
People in Group quarters - Short-term care, detention or diagnostic centers for delinquent children (%)
People in Group quarters - Type of juvenile institution unknown (%)
People in Group quarters - Noninstitutionalized population (%)
People in Group quarters - College dormitories (includes college quarters off campus) (%)
People in Group quarters - Military quarters (%)
People in Group quarters - On base (%)
People in Group quarters - Barracks, unaccompanied personnel housing (UPH), (Enlisted/Officer), ;and similar group living quarters for military personnel (%)
People in Group quarters - Transient quarters for temporary residents (%)
People in Group quarters - Military ships (%)
People in Group quarters - Group homes (%)
People in Group quarters - Homes or halfway houses for drug/alcohol abuse (%)
People in Group quarters - Homes for the mentally ill (%)
People in Group quarters - Homes for the mentally retarded (%)
People in Group quarters - Homes for the physically handicapped (%)
People in Group quarters - Other group homes (%)
People in Group quarters - Religious group quarters (%)
People in Group quarters - Dormitories (%)
People in Group quarters - Agriculture workers' dormitories on farms (%)
People in Group quarters - Job Corps and vocational training facilities (%)
People in Group quarters - Other workers' dormitories (%)
People in Group quarters - Crews of maritime vessels (%)
People in Group quarters - Other nonhousehold living situations (%)
People in Group quarters - Other noninstitutional group quarters (%)
Residents speaking English at home (%)
Residents speaking English at home - Born in the United States (%)
Residents speaking English at home - Native, born elsewhere (%)
Residents speaking English at home - Foreign born (%)
Residents speaking Spanish at home (%)
Residents speaking Spanish at home - Born in the United States (%)
Residents speaking Spanish at home - Native, born elsewhere (%)
Residents speaking Spanish at home - Foreign born (%)
Residents speaking other language at home (%)
Residents speaking other language at home - Born in the United States (%)
Residents speaking other language at home - Native, born elsewhere (%)
Residents speaking other language at home - Foreign born (%)
Class of Workers - Employee of private company (%)
Class of Workers - Self-employed in own incorporated business (%)
Class of Workers - Private not-for-profit wage and salary workers (%)
Class of Workers - Local government workers (%)
Class of Workers - State government workers (%)
Class of Workers - Federal government workers (%)
Class of Workers - Self-employed workers in own not incorporated business and Unpaid family workers (%)
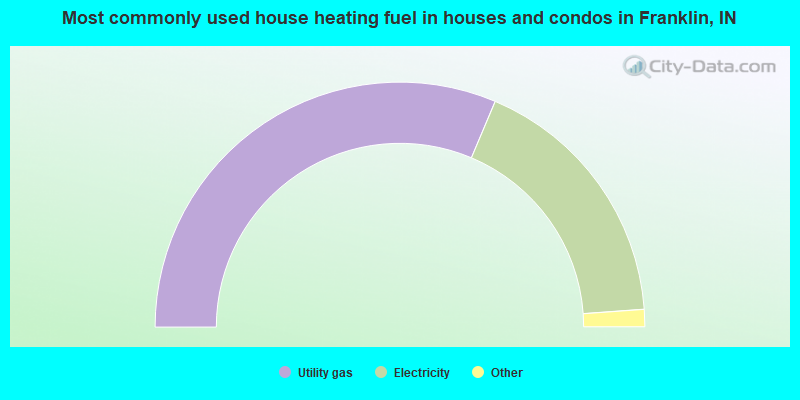
House heating fuel used in houses and condos - Utility gas (%)
House heating fuel used in houses and condos - Bottled, tank, or LP gas (%)
House heating fuel used in houses and condos - Electricity (%)
House heating fuel used in houses and condos - Fuel oil, kerosene, etc. (%)
House heating fuel used in houses and condos - Coal or coke (%)
House heating fuel used in houses and condos - Wood (%)
House heating fuel used in houses and condos - Solar energy (%)
House heating fuel used in houses and condos - Other fuel (%)
House heating fuel used in houses and condos - No fuel used (%)
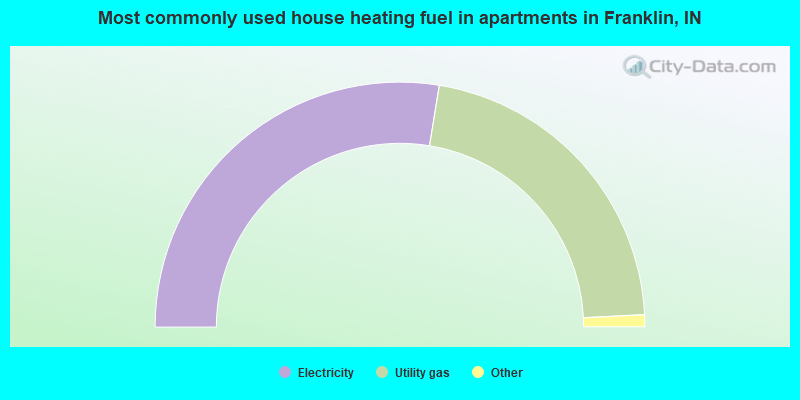
House heating fuel used in apartments - Utility gas (%)
House heating fuel used in apartments - Bottled, tank, or LP gas (%)
House heating fuel used in apartments - Electricity (%)
House heating fuel used in apartments - Fuel oil, kerosene, etc. (%)
House heating fuel used in apartments - Coal or coke (%)
House heating fuel used in apartments - Wood (%)
House heating fuel used in apartments - Solar energy (%)
House heating fuel used in apartments - Other fuel (%)
House heating fuel used in apartments - No fuel used (%)
Armed forces status - In Armed Forces (%)
Armed forces status - Civilian (%)
Armed forces status - Civilian - Veteran (%)
Armed forces status - Civilian - Nonveteran (%)
Fatal accidents locations in years 2005-2021
Fatal accidents locations in 2005
Fatal accidents locations in 2006
Fatal accidents locations in 2007
Fatal accidents locations in 2008
Fatal accidents locations in 2009
Fatal accidents locations in 2010
Fatal accidents locations in 2011
Fatal accidents locations in 2012
Fatal accidents locations in 2013
Fatal accidents locations in 2014
Fatal accidents locations in 2015
Fatal accidents locations in 2016
Fatal accidents locations in 2017
Fatal accidents locations in 2018
Fatal accidents locations in 2019
Fatal accidents locations in 2020
Fatal accidents locations in 2021
Alcohol use - People drinking some alcohol every month (%)
Alcohol use - People not drinking at all (%)
Alcohol use - Average days/month drinking alcohol
Alcohol use - Average drinks/week
Alcohol use - Average days/year people drink much
Audiometry - Average condition of hearing (%)
Audiometry - People that can hear a whisper from across a quiet room (%)
Audiometry - People that can hear normal voice from across a quiet room (%)
Audiometry - Ears ringing, roaring, buzzing (%)
Audiometry - Had a job exposure to loud noise (%)
Audiometry - Had off-work exposure to loud noise (%)
Blood Pressure & Cholesterol - Has high blood pressure (%)
Blood Pressure & Cholesterol - Checking blood pressure at home (%)
Blood Pressure & Cholesterol - Frequently checking blood cholesterol (%)
Blood Pressure & Cholesterol - Has high cholesterol level (%)
Consumer Behavior - Money monthly spent on food at supermarket/grocery store
Consumer Behavior - Money monthly spent on food at other stores
Consumer Behavior - Money monthly spent on eating out
Consumer Behavior - Money monthly spent on carryout/delivered foods
Consumer Behavior - Income spent on food at supermarket/grocery store (%)
Consumer Behavior - Income spent on food at other stores (%)
Consumer Behavior - Income spent on eating out (%)
Consumer Behavior - Income spent on carryout/delivered foods (%)
Current Health Status - General health condition (%)
Current Health Status - Blood donors (%)
Current Health Status - Has blood ever tested for HIV virus (%)
Current Health Status - Left-handed people (%)
Dermatology - People using sunscreen (%)
Diabetes - Diabetics (%)
Diabetes - Had a blood test for high blood sugar (%)
Diabetes - People taking insulin (%)
Diet Behavior & Nutrition - Diet health (%)
Diet Behavior & Nutrition - Milk product consumption (# of products/month)
Diet Behavior & Nutrition - Meals not home prepared (#/week)
Diet Behavior & Nutrition - Meals from fast food or pizza place (#/week)
Diet Behavior & Nutrition - Ready-to-eat foods (#/month)
Diet Behavior & Nutrition - Frozen meals/pizza (#/month)
Drug Use - People that ever used marijuana or hashish (%)
Drug Use - Ever used hard drugs (%)
Drug Use - Ever used any form of cocaine (%)
Drug Use - Ever used heroin (%)
Drug Use - Ever used methamphetamine (%)
Health Insurance - People covered by health insurance (%)
Kidney Conditions-Urology - Avg. # of times urinating at night
Medical Conditions - People with asthma (%)
Medical Conditions - People with anemia (%)
Medical Conditions - People with psoriasis (%)
Medical Conditions - People with overweight (%)
Medical Conditions - Elderly people having difficulties in thinking or remembering (%)
Medical Conditions - People who ever received blood transfusion (%)
Medical Conditions - People having trouble seeing even with glass/contacts (%)
Medical Conditions - People with arthritis (%)
Medical Conditions - People with gout (%)
Medical Conditions - People with congestive heart failure (%)
Medical Conditions - People with coronary heart disease (%)
Medical Conditions - People with angina pectoris (%)
Medical Conditions - People who ever had heart attack (%)
Medical Conditions - People who ever had stroke (%)
Medical Conditions - People with emphysema (%)
Medical Conditions - People with thyroid problem (%)
Medical Conditions - People with chronic bronchitis (%)
Medical Conditions - People with any liver condition (%)
Medical Conditions - People who ever had cancer or malignancy (%)
Mental Health - People who have little interest in doing things (%)
Mental Health - People feeling down, depressed, or hopeless (%)
Mental Health - People who have trouble sleeping or sleeping too much (%)
Mental Health - People feeling tired or having little energy (%)
Mental Health - People with poor appetite or overeating (%)
Mental Health - People feeling bad about themself (%)
Mental Health - People who have trouble concentrating on things (%)
Mental Health - People moving or speaking slowly or too fast (%)
Mental Health - People having thoughts they would be better off dead (%)
Oral Health - Average years since last visit a dentist
Oral Health - People embarrassed because of mouth (%)
Oral Health - People with gum disease (%)
Oral Health - General health of teeth and gums (%)
Oral Health - Average days a week using dental floss/device
Oral Health - Average days a week using mouthwash for dental problem
Oral Health - Average number of teeth
Pesticide Use - Households using pesticides to control insects (%)
Pesticide Use - Households using pesticides to kill weeds (%)
Physical Activity - People doing vigorous-intensity work activities (%)
Physical Activity - People doing moderate-intensity work activities (%)
Physical Activity - People walking or bicycling (%)
Physical Activity - People doing vigorous-intensity recreational activities (%)
Physical Activity - People doing moderate-intensity recreational activities (%)
Physical Activity - Average hours a day doing sedentary activities
Physical Activity - Average hours a day watching TV or videos
Physical Activity - Average hours a day using computer
Physical Functioning - People having limitations keeping them from working (%)
Physical Functioning - People limited in amount of work they can do (%)
Physical Functioning - People that need special equipment to walk (%)
Physical Functioning - People experiencing confusion/memory problems (%)
Physical Functioning - People requiring special healthcare equipment (%)
Prescription Medications - Average number of prescription medicines taking
Preventive Aspirin Use - Adults 40+ taking low-dose aspirin (%)
Reproductive Health - Vaginal deliveries (%)
Reproductive Health - Cesarean deliveries (%)
Reproductive Health - Deliveries resulted in a live birth (%)
Reproductive Health - Pregnancies resulted in a delivery (%)
Reproductive Health - Women breastfeeding newborns (%)
Reproductive Health - Women that had a hysterectomy (%)
Reproductive Health - Women that had both ovaries removed (%)
Reproductive Health - Women that have ever taken birth control pills (%)
Reproductive Health - Women taking birth control pills (%)
Reproductive Health - Women that have ever used Depo-Provera or injectables (%)
Reproductive Health - Women that have ever used female hormones (%)
Sexual Behavior - People 18+ that ever had sex (vaginal, anal, or oral) (%)
Sexual Behavior - Males 18+ that ever had vaginal sex with a woman (%)
Sexual Behavior - Males 18+ that ever performed oral sex on a woman (%)
Sexual Behavior - Males 18+ that ever had anal sex with a woman (%)
Sexual Behavior - Males 18+ that ever had any sex with a man (%)
Sexual Behavior - Females 18+ that ever had vaginal sex with a man (%)
Sexual Behavior - Females 18+ that ever performed oral sex on a man (%)
Sexual Behavior - Females 18+ that ever had anal sex with a man (%)
Sexual Behavior - Females 18+ that ever had any kind of sex with a woman (%)
Sexual Behavior - Average age people first had sex
Sexual Behavior - Average number of female sex partners in lifetime (males 18+)
Sexual Behavior - Average number of female vaginal sex partners in lifetime (males 18+)
Sexual Behavior - Average age people first performed oral sex on a woman (18+)
Sexual Behavior - Average number of woman performed oral sex on in lifetime (18+)
Sexual Behavior - Average number of male sex partners in lifetime (males 18+)
Sexual Behavior - Average number of male anal sex partners in lifetime (males 18+)
Sexual Behavior - Average age people first performed oral sex on a man (18+)
Sexual Behavior - Average number of male oral sex partners in lifetime (18+)
Sexual Behavior - People using protection when performing oral sex (%)
Sexual Behavior - Average number of times people have vaginal or anal sex a year
Sexual Behavior - People having sex without condom (%)
Sexual Behavior - Average number of male sex partners in lifetime (females 18+)
Sexual Behavior - Average number of male vaginal sex partners in lifetime (females 18+)
Sexual Behavior - Average number of female sex partners in lifetime (females 18+)
Sexual Behavior - Circumcised males 18+ (%)
Sleep Disorders - Average hours sleeping at night
Sleep Disorders - People that has trouble sleeping (%)
Smoking-Cigarette Use - People smoking cigarettes (%)
Taste & Smell - People 40+ having problems with smell (%)
Taste & Smell - People 40+ having problems with taste (%)
Taste & Smell - People 40+ that ever had wisdom teeth removed (%)
Taste & Smell - People 40+ that ever had tonsils teeth removed (%)
Taste & Smell - People 40+ that ever had a loss of consciousness because of a head injury (%)
Taste & Smell - People 40+ that ever had a broken nose or other serious injury to face or skull (%)
Taste & Smell - People 40+ that ever had two or more sinus infections (%)
Weight - Average height (inches)
Weight - Average weight (pounds)
Weight - Average BMI
Weight - People that are obese (%)
Weight - People that ever were obese (%)
Weight - People trying to lose weight (%)
According to our research of Indiana and other state lists, there were 4 registered sex offenders living in Franklin, Indiana as of April 24, 2024 . The ratio of all residents to sex offenders in Franklin is 6,045 to 1.The ratio of registered sex offenders to all residents in this city is much lower than the state average.
Officers per 1,000 residents here:
2.03Indiana average:
2.16
Latest news from Franklin, IN collected exclusively by city-data.com from local newspapers, TV, and radio stations
Ancestries: American (34.7%), German (14.6%), English (8.2%), Irish (7.2%), European (2.4%), Scottish (1.9%).
Current Local Time:
Land area: 11.3 square miles.
Population density: 2,284 people per square mile (low).
738 residents are foreign born (1.2% Asia , 1.1% Europe ).
This city:
2.8%Indiana:
5.6%
Median real estate property taxes paid for housing units with mortgages in 2022: $1,616 (0.7%)Median real estate property taxes paid for housing units with no mortgage in 2022: $2,005 (0.9%)
Nearest city with pop. 50,000+: Indianapolis, IN
Nearest city with pop. 1,000,000+: Chicago, IL
Nearest cities:
Latitude: 39.49 N, Longitude: 86.06 W
Daytime population change due to commuting: -454 (-1.7%)Workers who live and work in this city: 5,095 (38.9%)
Single-family new house construction building permits:
2022: 101 buildings , average cost: $304,5002021: 175 buildings , average cost: $253,5002020: 159 buildings , average cost: $223,1002019: 93 buildings , average cost: $206,0002018: 174 buildings , average cost: $200,9002017: 131 buildings , average cost: $188,4002016: 63 buildings , average cost: $141,1002015: 62 buildings , average cost: $146,4002014: 75 buildings , average cost: $133,1002013: 55 buildings , average cost: $150,8002012: 36 buildings , average cost: $130,7002011: 29 buildings , average cost: $128,6002010: 33 buildings , average cost: $154,9002009: 22 buildings , average cost: $121,6002008: 67 buildings , average cost: $138,7002007: 114 buildings , average cost: $133,2002006: 155 buildings , average cost: $138,9002005: 261 buildings , average cost: $126,4002004: 307 buildings , average cost: $129,3002003: 163 buildings , average cost: $126,8002002: 232 buildings , average cost: $112,0002001: 200 buildings , average cost: $115,8002000: 292 buildings , average cost: $96,9001999: 334 buildings , average cost: $98,0001998: 297 buildings , average cost: $99,0001997: 314 buildings , average cost: $94,800Unemployment in December 2023:
Population change in the 1990s: +6,873 (+54.6%).
Most common occupations in Franklin, IN (%)
Both Males Females
Other production occupations, including supervisors (5.7%)
Other management occupations, except farmers and farm managers (4.2%)
Other office and administrative support workers, including supervisors (4.1%)
Metal workers and plastic workers (4.1%)
Material recording, scheduling, dispatching, and distributing workers (3.8%)
Building and grounds cleaning and maintenance occupations (3.4%)
Electrical equipment mechanics and other installation, maintenance, and repair workers, including supervisors (3.1%)
Metal workers and plastic workers (7.5%)
Other production occupations, including supervisors (6.4%)
Electrical equipment mechanics and other installation, maintenance, and repair workers, including supervisors (5.9%)
Other management occupations, except farmers and farm managers (4.6%)
Building and grounds cleaning and maintenance occupations (4.3%)
Assemblers and fabricators (4.0%)
Driver/sales workers and truck drivers (4.0%)
Other office and administrative support workers, including supervisors (7.0%)
Secretaries and administrative assistants (5.5%)
Other production occupations, including supervisors (4.9%)
Cashiers (4.5%)
Preschool, kindergarten, elementary, and middle school teachers (4.3%)
Material recording, scheduling, dispatching, and distributing workers (3.9%)
Other management occupations, except farmers and farm managers (3.8%)
Tornado activity:
Franklin-area historical tornado activity is slightly above Indiana state average. It is 123% greater than the overall U.S. average.
On 4/25/1961, a category F4 (max. wind speeds 207-260 mph) tornado 15.1 miles away from the Franklin city center injured 7 people and caused between $500,000 and $5,000,000 in damages.
On 5/14/1972, a category F4 tornado 19.4 miles away from the city center injured 20 people and caused between $50,000 and $500,000 in damages.
Earthquake activity:
Franklin-area historical earthquake activity is significantly above Indiana state average. It is 87% greater than the overall U.S. average. On 4/18/2008 at 09:36:59, a magnitude 5.4 (5.1 MB, 4.8 MS, 5.4 MW, 5.2 MW, Class: Moderate, Intensity: VI - VII) earthquake occurred 121.8 miles away from the city center On 4/18/2008 at 09:36:59, a magnitude 5.2 (5.2 MW, Depth: 8.9 mi) earthquake occurred 121.8 miles away from Franklin center On 6/10/1987 at 23:48:54, a magnitude 5.1 (4.9 MB, 4.4 MS, 4.6 MS, 5.1 LG) earthquake occurred 108.4 miles away from Franklin center On 7/27/1980 at 18:52:21, a magnitude 5.2 (5.1 MB, 4.7 MS, 5.0 UK, 5.2 UK) earthquake occurred 144.4 miles away from Franklin center On 6/18/2002 at 17:37:15, a magnitude 5.0 (4.3 MB, 4.6 MW, 5.0 LG) earthquake occurred 139.4 miles away from the city center On 4/18/2008 at 15:14:16, a magnitude 4.8 (4.5 MB, 4.8 MW, 4.6 MW, Class: Light, Intensity: IV - V) earthquake occurred 119.1 miles away from Franklin center Magnitude types: regional Lg-wave magnitude (LG), body-wave magnitude (MB), surface-wave magnitude (MS), moment magnitude (MW) Natural disasters: The number of natural disasters in Johnson County (13) is near the US average (15).Major Disasters (Presidential) Declared: 9Emergencies Declared: 3Floods: 6, Storms: 6, Tornadoes: 4, Winter Storms: 3, Blizzard: 1, Hurricane: 1, Snow: 1, Snowstorm: 1, Other: 1 (Note: some incidents may be assigned to more than one category). Hospitals in Franklin: AMERICARE HOSPICE (1150 N MAIN ST, SUITE A) CARDINAL SERVICE MGMT, INC (1650 E JEFFERSON ST) CARDINAL SERVICE MGMT, INC (699 GRAHAM ST) JOHNSON MEMORIAL HOSPITAL (Government - Local, provides emergency services, 1125 W JEFFERSON ST) Nursing Homes in Franklin: FRANKLIN MEADOWS (1285 W JEFFERSON ST) FRANKLIN UNITED METHODIST COMMUNITY (1070 W JEFFERSON ST) HICKORY CREEK AT FRANKLIN (580 LEMLEY ST) HOMEVIEW CENTER OF FRANKLIN (651 S STATE ST) INDIANA MASONIC HOME INC (690 S STATE ST) RECORDS AUTUMN CARE RETIREMEN (1109 NORTH MAIN STREET, PO BOX 277) TODD-AIKENS HEALTH CENTER (1125 W JEFFERSON ST) WELCOME NURSING HOME (1109 NORTH MAIN STREET) Dialysis Facilities in Franklin: DAVITA - DIALYSIS - FRANKLIN (1140 W JEFFERSON STREET, SUITE A) FMC - FRANKLIN (1159 WEST JEFFERSON ST., SUITE 201) Home Health Centers in Franklin: ACACIA HOME HEALTH SERVICES (690 STATE ST) AMERICARE HOME HEALTH SERVICES (20 CIRCLE DR) JOHNSON MEMORIAL HOME CARE SERVICES (1101 W JEFFERSON ST STE R) Amtrak station near Franklin: 20 miles: INDIANAPOLIS (350 S. ILLINOIS ST.) Services: ticket office, partially wheelchair accessible, public payphones, full-service food facilities, free short-term parking, paid long-term parking, call for car rental service, taxi stand, intercity bus service.
College/University in Franklin: Franklin College Full-time enrollment: 1,061; Location: 101 Branigin Blvd; Private, not-for-profit; Website: www.franklincollege.edu)
Colleges/universities with over 2000 students nearest to Franklin:
University of Indianapolis (about 16 miles; Indianapolis, IN ; Full-time enrollment: 4,625)
Harrison College-Indianapolis (about 20 miles; Indianapolis, IN ; FT enrollment: 4,244)
American College of Education (about 21 miles; Indianapolis, IN ; FT enrollment: 2,718)
Indiana University-Purdue University-Indianapolis (about 21 miles; Indianapolis, IN ; FT enrollment: 22,751)
Ivy Tech Community College (about 23 miles; Indianapolis, IN ; FT enrollment: 71,493)
Marian University (about 24 miles; Indianapolis, IN ; FT enrollment: 2,476)
Butler University (about 26 miles; Indianapolis, IN ; FT enrollment: 4,388)
Public high school in Franklin: FRANKLIN COMMUNITY HIGH SCH Location: 2600 CUMBERLAND DR, Grades: 9-12)
Public elementary/middle schools in Franklin: FRANKLIN COMMUNITY MIDDLE SCHOOL Students: 1,409, Location: 625 GRIZZLY CUB DR, Grades: 7-8)CREEKSIDE ELEMENTARY SCH Students: 653, Location: 700 E SR 44, Grades: KG-4)CLARK ELEMENTARY SCHOOL Students: 613, Location: CR 700 N & 575 E, Grades: KG-4)NORTHWOOD ELEMENTARY SCHOOL Students: 604, Location: 965 GRIZZLY CUB DR, Grades: PK-4)NEEDHAM ELEMENTARY SCHOOL Students: 482, Location: 1399 UPPER SHELBYVILLE RD, Grades: KG-4)WEBB ELEMENTARY SCHOOL Students: 405, Location: 1400 WEBB CT, Grades: KG-4)CUSTER BAKER INTERMEDIATE SCHOOL Location: 101 W SR 44, Grades: 5-6)
Private elementary/middle school in Franklin:
See full list of schools located in Franklin Library in Franklin: JOHNSON COUNTY PUBLIC LIBRARY Operating income: $5,079,156; Location: 401 SOUTH STATE STREET; 362,636 books ; 7,930 e-books ; 30,506 audio materials ; 29,601 video materials ; 25 local licensed databases ; 37 state licensed databases ; 701 print serial subscriptions )
User-submitted facts and corrections:
St. Rose of Lima School has grades Pre-K through 8 and has approx. 200 students enrolled.
Notable locations in Franklin: (A) , Stewart "Red" Faught Stadium (B) , Johnson County Courthouse Square (C) , Canary Creek Outdoor Cinema (D) , Von Boll Welcome Center (E) , Spurlock Center (F) , Shirk Hall (G) , Old Main (H) , Napolitan Student Center (I) , Napolitan Alumni House (J) , Johnson-Dietz Hall (K) , Johnson Center for The Arts (L) , Hoover Hall (M) , Hamilton Library (N) , Elsey Hall (O) , Dietz Center (P) , Cline Hall (Q) , Barnes Science Hall (R) , Masonic Home (S) , Franklin Fire Department Station 21 (T) . Display/hide their locations on the map
Churches in Franklin include: (A) , Franklin Church of the Nazarene (B) , First Baptist Church (C) , First Presbyterian Church (D) , Tabernacle Christian Church (E) , First Separate Baptist Church (F) , Grace United Methodist Church (G) , Temple Baptist Church (H) , Saint Andrew's Anglican Catholic Church (I) . Display/hide their locations on the map
Cemetery: (1) . Display/hide its location on the map
Creek: (A) . Display/hide its location on the map
Parks in Franklin include: (1) , Runkle Tennis Courts (2) , Dame Mall (3) . Display/hide their locations on the map
Tourist attraction:
Hotels:
Courts:
Birthplace of: Jon Schaffer - Heavy metal guitarist, Andrew Duggan - Film actor, Max Terhune - Actor, Nick Hardwick - 2005 NFL player (San Diego Chargers, born : Sep 12, 1981), Homer Bone - Federal judge, Marcellus M. Crocker - Union Army general, Clinton L. Armstrong - Union Army Medal of Honor recipient, J.R. Angle - College basketball player (Iowa Hawkeyes), Marcus Peter Blakemore - Solider, Maude Turner Gordon - Actor.
Johnson County has a predicted average indoor radon screening level greater than 4 pCi/L (pico curies per liter) - Highest Potential Drinking water stations with addresses in Franklin and their reported violations in the past:
SHILOH COMMUNITY CHURCH (Population served: 35, Groundwater):
Past health violations:
MCL, Monthly (TCR) - In DEC-2011, Contaminant: Coliform. Follow-up actions: St Violation/Reminder Notice (DEC-30-2011), St Public Notif requested (DEC-30-2011), St Boil Water Order (DEC-30-2011), St Compliance achieved (FEB-24-2012)
MCL, Monthly (TCR) - In MAY-2009, Contaminant: Coliform. Follow-up actions: St Public Notif requested (JUN-04-2009), St Violation/Reminder Notice (JUN-04-2009), St Boil Water Order (JUN-04-2009), St Compliance achieved (MAR-24-2010)
Drinking water stations with addresses in Franklin that have no violations reported:
INDIANA MASONIC HOME (Population served: 450, Primary Water Source Type: Groundwater)
Average household size: This city:
2.5 peopleIndiana:
2.5 people
Percentage of family households: This city:
67.4%Whole state:
66.9%
Percentage of households with unmarried partners: This city:
7.4%Whole state:
6.9%
Likely homosexual households (counted as self-reported same-sex unmarried-partner households)
Lesbian couples: 0.4% of all households Gay men: 0.3% of all households
People in group quarters in Franklin in 2010:
589 people in college/university student housing
480 people in nursing facilities/skilled-nursing facilities
98 people in correctional facilities intended for juveniles
People in group quarters in Franklin in 2000:
721 people in other noninstitutional group quarters
673 people in college dormitories (includes college quarters off campus)
462 people in nursing homes
13 people in homes for the mentally ill
12 people in homes for the mentally retarded
8 people in schools, hospitals, or wards for the intellectually disabled
Banks with most branches in Franklin (2011 data):
Mutual Savings Bank: at 80 East Jefferson Street, Methodist Home Branch, Main Street Branch. Info updated 2008/09/02: Bank assets: $118.9 mil, Deposits: $89.0 mil, local headquarters , positive income , Commercial Lending Specialization, 6 total offices , Holding Company: Third Century Bancorp
MainSource Bank: Banta Street Branch at 597 Banta Street, branch established on 1996/10/31. Info updated 2009/12/09: Bank assets: $2,729.1 mil, Deposits: $2,167.0 mil, headquarters in Greensburg, IN, positive income , 86 total offices , Holding Company: Mainsource Financial Group, Inc.
Old National Bank: Franklin/Walmart Branch at 2125 N Morton St, branch established on 2004/11/12. Info updated 2011/08/01: Bank assets: $8,467.9 mil, Deposits: $6,653.1 mil, headquarters in Evansville, IN, positive income , 195 total offices , Holding Company: Old National Bancorp
PNC Bank, National Association: Franklin at 1500 North Morton Street, branch established on 1988/03/23. Info updated 2012/03/20: Bank assets: $263,309.6 mil, Deposits: $197,343.0 mil, headquarters in Wilmington, DE, positive income , Commercial Lending Specialization, 3085 total offices , Holding Company: Pnc Financial Services Group, Inc., The
The Huntington National Bank: Franklin Marsh Branch at 1126 North Main, branch established on 1992/03/01. Info updated 2012/04/02: Bank assets: $54,183.4 mil, Deposits: $44,300.3 mil, headquarters in Columbus, OH, positive income , Commercial Lending Specialization, 878 total offices , Holding Company: Huntington Bancshares Incorporated
Heartland Community Bank: at 420 North Morton Street, branch established on 1997/12/17. Info updated 2006/11/03: Bank assets: $245.3 mil, Deposits: $218.7 mil, local headquarters , positive income , Commercial Lending Specialization, 6 total offices , Holding Company: Heartland Bancshares, Inc.
First Financial Bank, National Association: Franklin Branch at 1073 West Jefferson Street, branch established on 1994/08/16. Info updated 2009/09/21: Bank assets: $6,663.4 mil, Deposits: $5,754.9 mil, headquarters in Hamilton, OH, positive income , Commercial Lending Specialization, 101 total offices , Holding Company: First Financial Bancorp
JPMorgan Chase Bank, National Association: Franklin at 1600 N Morton St, branch established on 1972/01/13. Info updated 2011/11/10: Bank assets: $1,811,678.0 mil, Deposits: $1,190,738.0 mil, headquarters in Columbus, OH, positive income , International Specialization, 5577 total offices , Holding Company: Jpmorgan Chase & Co.
BMO Harris Bank National Association: Franklin In Branch at 2389 North Morton Street, branch established on 2009/04/20. Info updated 2011/07/14: Bank assets: $97,264.0 mil, Deposits: $75,624.6 mil, headquarters in Chicago, IL, positive income , 717 total offices , Holding Company: Bank Of Montreal
4 other banks with 4 local branches
For population 15 years and over in Franklin:
Never married: 32.0%Now married: 50.6%Separated: 0.6%Widowed: 6.5%Divorced: 10.2% For population 25 years and over in Franklin:
High school or higher: 92.9%Bachelor's degree or higher: 21.0%Graduate or professional degree: 7.2%Unemployed: 5.8%Mean travel time to work (commute): 21.1 minutes
Education Gini index (Inequality in education) Here:
9.7Indiana average:
11.3
Religion statistics for Franklin, IN (based on Johnson County data)
Religion Adherents Congregations Evangelical Protestant 41,166 98 Catholic 11,589 4 Mainline Protestant 9,942 31 Other 1,325 3 Black Protestant 314 2 Orthodox 27 1 None 75,291 -
Source: Clifford Grammich, Kirk Hadaway, Richard Houseal, Dale E.Jones, Alexei Krindatch, Richie Stanley and Richard H.Taylor. 2012. 2010 U.S.Religion Census: Religious Congregations & Membership Study. Association of Statisticians of American Religious Bodies. Jones, Dale E., et al. 2002. Congregations and Membership in the United States 2000. Nashville, TN: Glenmary Research Center. Graphs represent county-level data
Food Environment Statistics: Number of grocery stores : 14Johnson County :
1.03 / 10,000 pop.Indiana :
1.73 / 10,000 pop.
Number of supercenters and club stores : 4Johnson County :
0.29 / 10,000 pop.Indiana :
0.21 / 10,000 pop.
Number of convenience stores (no gas) : 5Johnson County :
0.37 / 10,000 pop.Indiana :
0.50 / 10,000 pop.
Number of convenience stores (with gas) : 36Here :
2.65 / 10,000 pop.Indiana :
3.57 / 10,000 pop.
Number of full-service restaurants : 89Johnson County :
6.54 / 10,000 pop.State :
6.78 / 10,000 pop.
Adult diabetes rate : This county :
8.1%Indiana :
9.2%
Adult obesity rate : This county :
27.6%Indiana :
29.0%
Low-income preschool obesity rate : Johnson County :
12.6%State :
14.3%
Health and Nutrition: Healthy diet rate : Franklin:
53.9%State:
49.3%
Average overall health of teeth and gums : Franklin:
54.2%Indiana:
46.2%
Average BMI : Franklin:
27.9Indiana:
28.7
People feeling badly about themselves : Franklin:
20.3%Indiana:
21.3%
People not drinking alcohol at all : Average hours sleeping at night : General health condition : Franklin:
61.5%Indiana:
56.1%
Average condition of hearing : This city:
80.8%State:
78.7%
More about Health and Nutrition of Franklin, IN Residents
Local government employment and payroll (March 2022)
Function
Full-time employees
Monthly full-time payroll
Average yearly full-time wage
Part-time employees
Monthly part-time payroll
Police Protection - Officers
53 $280,634 $63,540 0 $0 Firefighters
48 $252,716 $63,179 0 $0 Streets and Highways
18 $71,743 $47,829 0 $0 Parks and Recreation
15 $61,172 $48,938 63 $32,448 Sewerage
15 $72,606 $58,085 0 $0 Police - Other
6 $22,265 $44,530 0 $0 Other Government Administration
4 $15,006 $45,018 0 $0 Financial Administration
4 $23,952 $71,856 0 $0 Other and Unallocable
4 $14,690 $44,070 0 $0 Judicial and Legal
3 $12,037 $48,148 0 $0 Fire - Other
2 $8,124 $48,744 0 $0 Housing and Community Development (Local)
2 $11,813 $70,878 0 $0
Totals for Government
174 $846,758 $58,397 63 $32,448
Franklin government finances - Expenditure in 2021 (per resident):
Construction - Sewerage: $201,000 ($7.81)
Regular Highways: $10,000 ($0.39)General - Other: $1,000 ($0.04)Current Operations - Regular Highways: $9,153,000 ($355.76)
Police Protection: $4,833,000 ($187.85)General - Other: $4,675,000 ($181.71)Local Fire Protection: $4,124,000 ($160.29)Sewerage: $2,567,000 ($99.77)Parks and Recreation: $2,345,000 ($91.15)Central Staff Services: $692,000 ($26.90)General Public Buildings: $492,000 ($19.12)Judicial and Legal Services: $339,000 ($13.18)Miscellaneous Commercial Activities - Other: $285,000 ($11.08)Financial Administration: $243,000 ($9.44)Health - Other: $93,000 ($3.61)General - Interest on Debt: $1,056,000 ($41.04)
Other Capital Outlay - Regular Highways: $1,696,000 ($65.92)
Police Protection: $322,000 ($12.52)General - Other: $213,000 ($8.28)Local Fire Protection: $120,000 ($4.66)Parks and Recreation: $18,000 ($0.70)
Franklin government finances - Revenue in 2021 (per resident):
Charges - Sewerage: $12,542,000 ($487.48)
Parks and Recreation: $438,000 ($17.02)Other: $242,000 ($9.41)Miscellaneous Commercial Activities: $166,000 ($6.45)Regular Highways: $12,000 ($0.47)Local Intergovernmental - Highways: $465,000 ($18.07)
Other: $60,000 ($2.33)Miscellaneous - General Revenue - Other: $476,000 ($18.50)
Interest Earnings: $365,000 ($14.19)Donations From Private Sources: $363,000 ($14.11)Fines and Forfeits: $57,000 ($2.22)State Intergovernmental - Other: $9,816,000 ($381.53)
Highways: $2,521,000 ($97.99)General Local Government Support: $1,556,000 ($60.48)Tax - Property: $14,381,000 ($558.96)
Motor Vehicle License: $590,000 ($22.93)Other License: $309,000 ($12.01)Public Utilities Sales: $194,000 ($7.54)
Franklin government finances - Debt in 2021 (per resident):
Long Term Debt - Beginning Outstanding - Unspecified Public Purpose: $26,407,000 ($1026.39)
Outstanding Unspecified Public Purpose: $26,407,000 ($1026.39)
Franklin government finances - Cash and Securities in 2021 (per resident):
Bond Funds - Cash and Securities: $16,961,000 ($659.24)
Other Funds - Cash and Securities: $31,561,000 ($1226.72)
Sinking Funds - Cash and Securities: $1,750,000 ($68.02)
Businesses in Franklin, IN
Name Count Name Count
AT&T 2 Long John Silver's 1 Advance Auto Parts 1 Lowe's 1 Applebee's 1 MasterBrand Cabinets 4 Arby's 1 McDonald's 2 AutoZone 1 Nike 2 Burger King 2 Papa John's Pizza 1 CVS 1 Penske 1 Chevrolet 1 Pizza Hut 1 Circle K 3 Quality 1 Comfort Inn 1 Quiznos 1 Dairy Queen 1 RadioShack 1 Decora Cabinetry 2 Sears 1 Domino's Pizza 1 Starbucks 1 Fashion Bug 1 Steak 'n Shake 1 FedEx 3 Subway 3 Ford 1 Super 8 1 GNC 1 T-Mobile 2 GameStop 1 Taco Bell 1 H&R Block 1 U-Haul 2 Howard Johnson 1 UPS 2 Jones New York 1 Waffle House 1 KFC 1 Walgreens 1 Kohl's 1 Walmart 1 Kroger 1 Wendy's 1 Little Caesars Pizza 1 White Castle 1
Strongest AM radio stations in Franklin:
WIBC (1070 AM; 50 kW; INDIANAPOLIS, IN; Owner: EMMIS RADIO LICENSE CORPORATION)
WTLC (1310 AM; 5 kW; INDIANAPOLIS, IN; Owner: RADIO ONE OF INDIANA, LLC)
WNTS (1590 AM; 5 kW; BEECH GROVE, IN; Owner: S + M BROADCASTING CO., INC.)
WLW (700 AM; 50 kW; CINCINNATI, OH; Owner: JACOR BROADCASTING CORPORATION)
WXLW (950 AM; 5 kW; INDIANAPOLIS, IN)
WHAS (840 AM; 50 kW; LOUISVILLE, KY; Owner: CLEAR CHANNEL BROADCASTING LICENSES, INC.)
WNDE (1260 AM; 5 kW; INDIANAPOLIS, IN; Owner: CAPSTAR TX LIMITED PARTNERSHIP)
WXNT (1430 AM; 5 kW; INDIANAPOLIS, IN; Owner: MYSTAR COMMUNICATIONS CORPORATION)
WBRI (1500 AM; daytime; 5 kW; INDIANAPOLIS, IN)
WSAI (1530 AM; 50 kW; CINCINNATI, OH; Owner: JACOR BROADCASTING CORPORATION)
WOWO (1190 AM; 50 kW; FORT WAYNE, IN; Owner: PATHFINDER COMMUNICATIONS CORPORATION)
WGCL (1370 AM; 5 kW; BLOOMINGTON, IN; Owner: SARKES TARZIAN, INC,)
WTVN (610 AM; 50 kW; COLUMBUS, OH; Owner: CITICASTERS LICENSES, L.P.)
Strongest FM radio stations in Franklin:
WIJY (95.9 FM; FRANKLIN, IN; Owner: PILGRIM COMMUNICATIONS, LLC)
WTTS (92.3 FM; BLOOMINGTON, IN; Owner: SARKES TARZIAN, INC.)
WENS (97.1 FM; SHELBYVILLE, IN; Owner: EMMIS RADIO LICENSE CORPORATION)
WZPL (99.5 FM; GREENFIELD, IN; Owner: MYSTAR COMMUNICATIONS CORPORATION)
WNOU (93.1 FM; INDIANAPOLIS, IN; Owner: EMMIS RADIO LICENSE CORPORATION)
WFMS (95.5 FM; INDIANAPOLIS, IN; Owner: WFMS LICO, INC)
WYXB (105.7 FM; INDIANAPOLIS, IN; Owner: EMMIS RADIO LICENSE CORPORATION)
WFCI (89.5 FM; FRANKLIN, IN; Owner: FRANKLIN COLLEGE OF INDIANA)
WHHH (96.3 FM; INDIANAPOLIS, IN; Owner: RADIO ONE OF INDIANA, LLC)
WJLR (91.5 FM; SEYMOUR, IN; Owner: MIDWEST MINISTRIES, INC.)
WFBQ (94.7 FM; INDIANAPOLIS, IN; Owner: CAPSTAR TX LIMITED PARTNERSHIP)
WRZX (103.3 FM; INDIANAPOLIS, IN; Owner: CAPSTAR TX LIMITED PARTNERSHIP)
WCBK-FM (102.3 FM; MARTINSVILLE, IN; Owner: MID-AMERICA RADIO GROUP, INC.)
WGLD (104.5 FM; INDIANAPOLIS, IN; Owner: INDY LICO, INC)
WTPI (107.9 FM; INDIANAPOLIS, IN; Owner: MYSTAR COMMUNICATIONS CORPORATION)
WKKG (101.5 FM; COLUMBUS, IN; Owner: WHITE RIVER BROADCASTING CO. INC.)
WYGB (102.9 FM; EDINBURGH, IN; Owner: EDINBURGH RADIO)
WTLC-FM (106.7 FM; GREENWOOD, IN; Owner: RADIO ONE OF INDIANA, LLC)
WVNI (95.1 FM; NASHVILLE, IN; Owner: BROWN COUNTY BROADCASTERS, INC.)
WFYI-FM (90.1 FM; INDIANAPOLIS, IN; Owner: METROPOLITAN IN. PUBLIC B/CING, INC.)
TV broadcast stations around Franklin:
WTTV (Channel 4; BLOOMINGTON, IN; Owner: TRIBUNE BROADCAST HOLDINGS, INC.)
WIPX (Channel 63; BLOOMINGTON, IN; Owner: PAXSON INDIANAPOLIS LICENSE, INC.)
WCLJ (Channel 42; BLOOMINGTON, IN; Owner: TRINITY BROADCASTING OF INDIANA, INC.)
WKOG-LP (Channel 31; INDIANAPOLIS, IN; Owner: KINGDOM OF GOD MINISTRIES, INC.)
WDNI-LP (Channel 65; INDIANAPOLIS, IN; Owner: RADIO ONE OF INDIANA, LLC)
WIPX-LP (Channel 51; INDIANAPOLIS, IN; Owner: PAXSON COMMUNICATIONS LICENSE COMPANY, LLC)
WTIU (Channel 30; BLOOMINGTON, IN; Owner: THE TRUSTEES OF INDIANA UNIVERSITY)
WXIN (Channel 59; INDIANAPOLIS, IN; Owner: TRIBUNE TELEVISION COMPANY)
WISH-TV (Channel 8; INDIANAPOLIS, IN; Owner: INDIANA BROADCASTING, LLC)
WHMB-TV (Channel 40; INDIANAPOLIS, IN; Owner: LESEA BROADCASTING CORPORATION)
WRTV (Channel 6; INDIANAPOLIS, IN; Owner: MCGRAW-HILL BROADCASTING COMPANY, INC.)
WTHR (Channel 13; INDIANAPOLIS, IN; Owner: VIDEOINDIANA, INC.)
WBXI-CA (Channel 47; INDIANAPOLIS, IN; Owner: THE BOX WORLDWIDE LLC)
WFYI (Channel 20; INDIANAPOLIS, IN; Owner: METROPOLITAN INDIANAPOLIS PUBLIC BROADCASTING, INC.)
WTBU-TV (Channel 69; INDIANAPOLIS, IN; Owner: BUTLER UNIVERSITY)
WALV-CA (Channel 50; INDIANAPOLIS, IN; Owner: VIDEOHIO, INC..)
WIIH-CA (Channel 11; INDIANAPOLIS, IN; Owner: INDIANA BROADCASTING, LLC)
Medal of Honor Recipients
Medal of Honor Recipient born in Franklin: Clinton L. Armstrong.
National Bridge Inventory (NBI) Statistics 74 Number of bridges636ft / 194m Total length $7,719,000 Total costs568,527 Total average daily traffic68,820 Total average daily truck traffic
New bridges - historical statistics
1 1910-1919 1 1930-1939 3 1940-1949 3 1950-1959 4 1960-1969 33 1970-1979 7 1980-1989 8 1990-1999 11 2000-2009 3 2010-2019
See full National Bridge Inventory statistics for Franklin, IN
Home Mortgage Disclosure Act Aggregated Statistics For Year 2009(Based on 2 full and 1 partial tracts) A) FHA, FSA/RHS & VA B) Conventional C) Refinancings D) Home Improvement Loans E) Loans on Dwellings For 5+ Families F) Non-occupant Loans on G) Loans On Manufactured Number Average Value Number Average Value Number Average Value Number Average Value Number Average Value Number Average Value Number Average Value
LOANS ORIGINATED 56 $102,502 39 $82,489 141 $106,958 8 $38,264 1 $165,000 23 $67,052 0 $0 APPLICATIONS APPROVED, NOT ACCEPTED 2 $139,705 4 $90,322 25 $109,800 1 $6,670 0 $0 2 $75,405 0 $0 APPLICATIONS DENIED 9 $108,054 11 $80,468 66 $99,224 11 $17,041 0 $0 7 $68,643 2 $72,000 APPLICATIONS WITHDRAWN 7 $95,197 6 $52,783 42 $100,655 1 $11,000 0 $0 3 $40,707 0 $0 FILES CLOSED FOR INCOMPLETENESS 4 $111,085 1 $207,830 6 $135,642 0 $0 0 $0 0 $0 0 $0
Aggregated Statistics For Year 2008(Based on 2 full and 1 partial tracts) A) FHA, FSA/RHS & VA B) Conventional C) Refinancings D) Home Improvement Loans E) Loans on Dwellings For 5+ Families F) Non-occupant Loans on G) Loans On Manufactured Number Average Value Number Average Value Number Average Value Number Average Value Number Average Value Number Average Value Number Average Value
LOANS ORIGINATED 54 $109,414 75 $94,425 102 $97,748 12 $17,442 2 $212,505 34 $72,887 0 $0 APPLICATIONS APPROVED, NOT ACCEPTED 8 $114,789 7 $152,251 20 $101,368 2 $35,245 0 $0 4 $72,270 1 $136,000 APPLICATIONS DENIED 10 $124,194 17 $68,988 101 $113,442 30 $32,977 0 $0 10 $62,483 0 $0 APPLICATIONS WITHDRAWN 6 $89,312 7 $105,366 44 $120,345 5 $67,548 1 $2,800,000 4 $45,332 0 $0 FILES CLOSED FOR INCOMPLETENESS 3 $90,023 1 $202,620 10 $130,343 0 $0 0 $0 0 $0 0 $0
Aggregated Statistics For Year 2007(Based on 2 full and 1 partial tracts) A) FHA, FSA/RHS & VA B) Conventional C) Refinancings D) Home Improvement Loans F) Non-occupant Loans on G) Loans On Manufactured Number Average Value Number Average Value Number Average Value Number Average Value Number Average Value Number Average Value
LOANS ORIGINATED 35 $118,315 136 $102,528 123 $92,878 22 $58,958 48 $81,933 0 $0 APPLICATIONS APPROVED, NOT ACCEPTED 2 $93,575 24 $118,520 35 $106,756 2 $59,595 5 $105,718 1 $120,000 APPLICATIONS DENIED 7 $90,556 34 $101,904 142 $108,062 33 $66,055 13 $104,078 2 $22,160 APPLICATIONS WITHDRAWN 8 $115,331 17 $110,047 63 $101,693 11 $55,900 11 $48,775 1 $84,010 FILES CLOSED FOR INCOMPLETENESS 2 $100,325 2 $95,360 15 $111,737 1 $63,000 0 $0 0 $0
Aggregated Statistics For Year 2006(Based on 2 full and 1 partial tracts) A) FHA, FSA/RHS & VA B) Conventional C) Refinancings D) Home Improvement Loans E) Loans on Dwellings For 5+ Families F) Non-occupant Loans on G) Loans On Manufactured Number Average Value Number Average Value Number Average Value Number Average Value Number Average Value Number Average Value Number Average Value
LOANS ORIGINATED 34 $112,225 218 $91,500 152 $90,882 27 $29,830 1 $237,220 51 $87,584 0 $0 APPLICATIONS APPROVED, NOT ACCEPTED 2 $120,000 28 $84,409 36 $87,817 3 $23,413 0 $0 8 $79,439 0 $0 APPLICATIONS DENIED 7 $108,800 60 $98,136 182 $98,688 43 $35,066 1 $4,684,000 29 $77,833 2 $8,485 APPLICATIONS WITHDRAWN 1 $81,000 40 $94,619 71 $110,662 2 $13,500 0 $0 6 $88,775 1 $245,000 FILES CLOSED FOR INCOMPLETENESS 1 $167,000 8 $77,702 27 $102,729 0 $0 1 $2,342,000 4 $79,148 0 $0
Aggregated Statistics For Year 2005(Based on 2 full and 1 partial tracts) A) FHA, FSA/RHS & VA B) Conventional C) Refinancings D) Home Improvement Loans E) Loans on Dwellings For 5+ Families F) Non-occupant Loans on G) Loans On Manufactured Number Average Value Number Average Value Number Average Value Number Average Value Number Average Value Number Average Value Number Average Value
LOANS ORIGINATED 67 $113,150 211 $82,367 193 $93,719 30 $45,829 1 $785,800 68 $71,690 0 $0 APPLICATIONS APPROVED, NOT ACCEPTED 6 $97,987 22 $72,123 26 $89,423 10 $41,619 0 $0 4 $83,390 2 $33,455 APPLICATIONS DENIED 16 $86,000 62 $77,993 151 $103,289 35 $30,873 0 $0 19 $73,387 8 $67,734 APPLICATIONS WITHDRAWN 10 $102,363 31 $71,587 74 $108,972 12 $70,856 0 $0 11 $65,416 1 $49,420 FILES CLOSED FOR INCOMPLETENESS 1 $91,000 4 $107,328 53 $119,072 2 $45,000 0 $0 3 $78,453 0 $0
Aggregated Statistics For Year 2004(Based on 2 full and 1 partial tracts) A) FHA, FSA/RHS & VA B) Conventional C) Refinancings D) Home Improvement Loans F) Non-occupant Loans on G) Loans On Manufactured Number Average Value Number Average Value Number Average Value Number Average Value Number Average Value Number Average Value
LOANS ORIGINATED 83 $111,608 179 $86,609 203 $90,377 20 $24,931 58 $69,012 0 $0 APPLICATIONS APPROVED, NOT ACCEPTED 3 $97,000 32 $84,232 49 $112,125 3 $26,313 6 $69,253 1 $27,000 APPLICATIONS DENIED 18 $117,344 40 $90,995 142 $95,948 28 $25,500 14 $84,196 4 $50,985 APPLICATIONS WITHDRAWN 3 $99,747 22 $113,034 58 $89,020 8 $27,556 8 $54,366 1 $68,000 FILES CLOSED FOR INCOMPLETENESS 5 $103,000 5 $78,478 34 $105,718 0 $0 2 $80,500 0 $0
Aggregated Statistics For Year 2003(Based on 2 full and 1 partial tracts) A) FHA, FSA/RHS & VA B) Conventional C) Refinancings D) Home Improvement Loans F) Non-occupant Loans on Number Average Value Number Average Value Number Average Value Number Average Value Number Average Value
LOANS ORIGINATED 77 $112,590 118 $91,680 464 $94,705 11 $46,259 45 $64,350 APPLICATIONS APPROVED, NOT ACCEPTED 2 $89,570 5 $98,146 56 $102,202 6 $15,742 6 $71,980 APPLICATIONS DENIED 9 $82,928 16 $99,079 147 $92,152 22 $11,528 10 $64,837 APPLICATIONS WITHDRAWN 5 $113,664 14 $99,314 70 $96,140 5 $26,926 5 $110,902 FILES CLOSED FOR INCOMPLETENESS 0 $0 4 $55,828 20 $99,798 0 $0 2 $63,000
Aggregated Statistics For Year 2002(Based on 2 full and 1 partial tracts) A) FHA, FSA/RHS & VA B) Conventional C) Refinancings D) Home Improvement Loans F) Non-occupant Loans on Number Average Value Number Average Value Number Average Value Number Average Value Number Average Value
LOANS ORIGINATED 58 $94,333 81 $88,693 323 $93,389 28 $11,716 40 $72,050 APPLICATIONS APPROVED, NOT ACCEPTED 4 $90,948 11 $88,199 52 $83,822 3 $8,333 4 $62,938 APPLICATIONS DENIED 6 $94,838 20 $95,146 123 $80,548 25 $22,276 11 $64,954 APPLICATIONS WITHDRAWN 7 $103,353 12 $78,266 53 $84,546 4 $19,940 7 $82,454 FILES CLOSED FOR INCOMPLETENESS 0 $0 2 $205,540 18 $108,852 0 $0 0 $0
Aggregated Statistics For Year 2001(Based on 2 full and 1 partial tracts) A) FHA, FSA/RHS & VA B) Conventional C) Refinancings D) Home Improvement Loans F) Non-occupant Loans on Number Average Value Number Average Value Number Average Value Number Average Value Number Average Value
LOANS ORIGINATED 67 $100,149 81 $91,867 302 $86,462 35 $11,580 25 $65,507 APPLICATIONS APPROVED, NOT ACCEPTED 4 $89,000 8 $73,501 49 $71,315 8 $19,041 1 $76,110 APPLICATIONS DENIED 3 $114,817 38 $56,431 109 $79,316 33 $16,930 11 $56,324 APPLICATIONS WITHDRAWN 10 $112,699 4 $87,092 66 $73,422 2 $9,415 3 $52,473 FILES CLOSED FOR INCOMPLETENESS 2 $132,670 2 $94,500 12 $87,626 0 $0 0 $0
Aggregated Statistics For Year 2000(Based on 2 full and 1 partial tracts) A) FHA, FSA/RHS & VA B) Conventional C) Refinancings D) Home Improvement Loans F) Non-occupant Loans on Number Average Value Number Average Value Number Average Value Number Average Value Number Average Value
LOANS ORIGINATED 62 $101,101 125 $82,000 132 $71,680 53 $22,324 36 $73,372 APPLICATIONS APPROVED, NOT ACCEPTED 7 $115,786 17 $75,308 32 $57,194 20 $22,548 3 $51,773 APPLICATIONS DENIED 9 $108,013 84 $48,361 119 $65,405 48 $15,632 9 $58,264 APPLICATIONS WITHDRAWN 4 $88,752 10 $56,295 52 $60,101 7 $29,286 3 $58,360 FILES CLOSED FOR INCOMPLETENESS 1 $73,000 2 $87,605 14 $67,041 0 $0 2 $100,455
Aggregated Statistics For Year 1999(Based on 2 full and 1 partial tracts) A) FHA, FSA/RHS & VA B) Conventional C) Refinancings D) Home Improvement Loans E) Loans on Dwellings For 5+ Families F) Non-occupant Loans on Number Average Value Number Average Value Number Average Value Number Average Value Number Average Value Number Average Value
LOANS ORIGINATED 94 $95,533 108 $91,737 221 $71,290 41 $13,369 1 $142,670 33 $69,531 APPLICATIONS APPROVED, NOT ACCEPTED 4 $107,492 22 $52,902 52 $63,719 15 $12,513 0 $0 9 $53,011 APPLICATIONS DENIED 8 $99,309 43 $45,462 122 $68,731 42 $10,633 1 $3,199,360 11 $60,400 APPLICATIONS WITHDRAWN 9 $94,133 12 $85,055 87 $69,626 3 $24,033 0 $0 7 $74,231 FILES CLOSED FOR INCOMPLETENESS 0 $0 3 $93,237 17 $87,473 0 $0 0 $0 0 $0
Detailed HMDA statistics for the following Tracts:
6109.00
, 6110.00 , 6111.00
Private Mortgage Insurance Companies Aggregated Statistics For Year 2009(Based on 2 full and 1 partial tracts) A) Conventional B) Refinancings Number Average Value Number Average Value
LOANS ORIGINATED 7 $108,801 6 $116,308 APPLICATIONS APPROVED, NOT ACCEPTED 3 $120,337 3 $75,990 APPLICATIONS DENIED 1 $160,470 1 $99,000 APPLICATIONS WITHDRAWN 0 $0 0 $0 FILES CLOSED FOR INCOMPLETENESS 0 $0 0 $0
Aggregated Statistics For Year 2008(Based on 2 full and 1 partial tracts) A) Conventional B) Refinancings C) Non-occupant Loans on Number Average Value Number Average Value Number Average Value
LOANS ORIGINATED 33 $101,972 7 $118,444 5 $59,202 APPLICATIONS APPROVED, NOT ACCEPTED 5 $115,522 6 $95,070 0 $0 APPLICATIONS DENIED 4 $86,842 1 $108,000 0 $0 APPLICATIONS WITHDRAWN 1 $70,000 1 $144,310 0 $0 FILES CLOSED FOR INCOMPLETENESS 1 $64,250 0 $0 0 $0
Aggregated Statistics For Year 2007(Based on 2 full and 1 partial tracts) A) Conventional B) Refinancings C) Non-occupant Loans on Number Average Value Number Average Value Number Average Value
LOANS ORIGINATED 58 $98,081 16 $117,261 6 $72,428 APPLICATIONS APPROVED, NOT ACCEPTED 6 $106,062 9 $131,326 2 $94,595 APPLICATIONS DENIED 1 $84,000 0 $0 0 $0 APPLICATIONS WITHDRAWN 2 $103,290 1 $214,840 0 $0 FILES CLOSED FOR INCOMPLETENESS 0 $0 0 $0 0 $0
Aggregated Statistics For Year 2006(Based on 2 full and 1 partial tracts) A) Conventional B) Refinancings C) Non-occupant Loans on Number Average Value Number Average Value Number Average Value
LOANS ORIGINATED 66 $93,677 10 $120,109 8 $67,558 APPLICATIONS APPROVED, NOT ACCEPTED 9 $105,988 5 $113,000 0 $0 APPLICATIONS DENIED 3 $71,000 0 $0 0 $0 APPLICATIONS WITHDRAWN 3 $116,667 0 $0 0 $0 FILES CLOSED FOR INCOMPLETENESS 0 $0 0 $0 0 $0
Aggregated Statistics For Year 2005(Based on 2 full and 1 partial tracts) A) Conventional B) Refinancings C) Non-occupant Loans on Number Average Value Number Average Value Number Average Value
LOANS ORIGINATED 45 $100,410 24 $107,795 12 $72,425 APPLICATIONS APPROVED, NOT ACCEPTED 7 $104,357 11 $129,135 3 $100,200 APPLICATIONS DENIED 1 $15,810 0 $0 1 $15,810 APPLICATIONS WITHDRAWN 0 $0 4 $101,025 0 $0 FILES CLOSED FOR INCOMPLETENESS 0 $0 0 $0 0 $0
Aggregated Statistics For Year 2004(Based on 2 full and 1 partial tracts) A) Conventional B) Refinancings C) Non-occupant Loans on Number Average Value Number Average Value Number Average Value
LOANS ORIGINATED 56 $102,499 21 $116,338 10 $76,609 APPLICATIONS APPROVED, NOT ACCEPTED 7 $77,973 8 $125,400 2 $43,000 APPLICATIONS DENIED 0 $0 0 $0 0 $0 APPLICATIONS WITHDRAWN 1 $185,740 2 $178,505 0 $0 FILES CLOSED FOR INCOMPLETENESS 2 $64,240 0 $0 0 $0
Aggregated Statistics For Year 2003(Based on 2 full and 1 partial tracts) A) Conventional B) Refinancings C) Non-occupant Loans on Number Average Value Number Average Value Number Average Value
LOANS ORIGINATED 36 $108,826 71 $109,788 10 $72,178 APPLICATIONS APPROVED, NOT ACCEPTED 5 $81,940 11 $93,191 3 $66,543 APPLICATIONS DENIED 0 $0 0 $0 0 $0 APPLICATIONS WITHDRAWN 0 $0 1 $113,260 0 $0 FILES CLOSED FOR INCOMPLETENESS 0 $0 1 $98,000 0 $0
Aggregated Statistics For Year 2002(Based on 2 full and 1 partial tracts) A) Conventional B) Refinancings C) Non-occupant Loans on Number Average Value Number Average Value Number Average Value
LOANS ORIGINATED 35 $95,744 48 $97,652 9 $68,628 APPLICATIONS APPROVED, NOT ACCEPTED 6 $88,647 12 $115,669 2 $67,065 APPLICATIONS DENIED 1 $106,750 3 $113,667 0 $0 APPLICATIONS WITHDRAWN 0 $0 1 $49,420 1 $49,420 FILES CLOSED FOR INCOMPLETENESS 0 $0 0 $0 0 $0
Aggregated Statistics For Year 2001(Based on 2 full and 1 partial tracts) A) Conventional B) Refinancings C) Non-occupant Loans on Number Average Value Number Average Value Number Average Value
LOANS ORIGINATED 32 $104,791 39 $106,843 8 $61,464 APPLICATIONS APPROVED, NOT ACCEPTED 3 $103,247 9 $74,417 1 $69,190 APPLICATIONS DENIED 0 $0 2 $83,920 0 $0 APPLICATIONS WITHDRAWN 0 $0 1 $102,880 0 $0 FILES CLOSED FOR INCOMPLETENESS 0 $0 0 $0 0 $0
Aggregated Statistics For Year 2000(Based on 2 full and 1 partial tracts) A) Conventional B) Refinancings C) Non-occupant Loans on Number Average Value Number Average Value Number Average Value
LOANS ORIGINATED 31 $106,806 13 $87,322 3 $93,437 APPLICATIONS APPROVED, NOT ACCEPTED 4 $136,292 6 $81,692 0 $0 APPLICATIONS DENIED 0 $0 0 $0 0 $0 APPLICATIONS WITHDRAWN 1 $69,000 0 $0 0 $0 FILES CLOSED FOR INCOMPLETENESS 0 $0 0 $0 0 $0
Aggregated Statistics For Year 1999(Based on 2 full and 1 partial tracts) A) Conventional B) Refinancings C) Non-occupant Loans on Number Average Value Number Average Value Number Average Value
LOANS ORIGINATED 30 $90,800 24 $93,134 4 $99,930 APPLICATIONS APPROVED, NOT ACCEPTED 4 $80,530 5 $74,628 1 $93,760 APPLICATIONS DENIED 0 $0 2 $75,510 0 $0 APPLICATIONS WITHDRAWN 0 $0 0 $0 0 $0 FILES CLOSED FOR INCOMPLETENESS 0 $0 0 $0 0 $0
Detailed PMIC statistics for the following Tracts:
6109.00
, 6110.00 , 6111.00 Fire-safe hotels and motels in Franklin, Indiana:
Hilltop Motel, RR #5, Franklin, Indiana 46131 Phone: (812) 526-6555
Econo Lodge, 2180 E King St, Franklin, Indiana 46131 Phone: (317) 736-8000, Fax: (317) 736-9678
Comfort Inn, 2122 Holiday Ln, Franklin, Indiana 46131 Phone: (317) 736-0480, Fax: (317) 736-4580
Quality Inn & Suites, 150 N Lovers Ln, Franklin, Indiana 46131 Phone: (317) 346-6444, Fax: (317) 346-6445
Howard Johnson Inn, 176 N Lovers Ln, Franklin, Indiana 46131 Phone: (317) 738-4448, Fax: (317) 738-4448
Super 8 Motel, 188 N Lovers Ln, Franklin, Indiana 46131 Phone: (317) 738-0888, Fax: (317) 738-0888
All 6 fire-safe hotels and motels in Franklin, Indiana
Most common first names in Franklin, IN among deceased individuals Name Count Lived (average)
Mary 315 82.8 years William 195 76.7 years James 191 75.1 years John 161 77.4 years Robert 159 73.2 years Charles 155 77.1 years Ruth 130 84.9 years Dorothy 104 83.1 years Helen 101 82.8 years George 90 79.6 years
Most common last names in Franklin, IN among deceased individuals Last name Count Lived (average)
Smith 148 79.9 years Brown 87 76.7 years Jones 58 80.7 years Williams 57 78.8 years Johnson 54 80.3 years Wilson 50 82.3 years Miller 50 81.8 years Davis 48 78.3 years Clark 46 79.2 years Moore 43 77.3 years
Franklin compared to Indiana state average:
Unemployed percentage below state average. Hispanic race population percentage below state average. Median age below state average. House age below state average.
#49 on the list of "Top 101 cities with the largest percentage of people in other noninstitutional group quarters (population 1,000+)"
#4 on the list of "Top 101 counties with the lowest percentage of residents relocating from foreign countries between 2010 and 2011"
#64 on the list of "Top 101 counties with the highest Ozone (1-hour) air pollution readings in 2012 (ppm)"
Top Patent Applicants
Richard K. Mann (80)
Michael J Ruth (14)
Douglas David Dierksmeier (5)
Douglas D. Dierksmeier (5)
Richard Kevin Mann (5)
Lisa Selsam Beavers (4)
Sandra Ann Filla (4)
Donald Prince (4)
Bryan E. Blackwell (4)
Justin Kruer (4)
Total of 188 patent applications in 2008-2024.

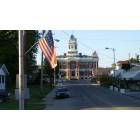


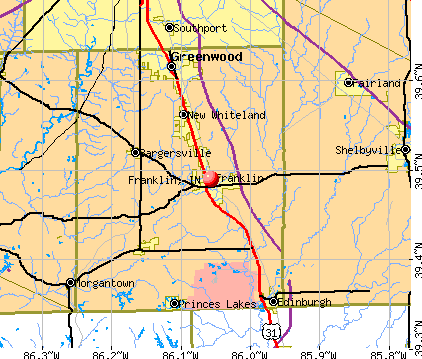


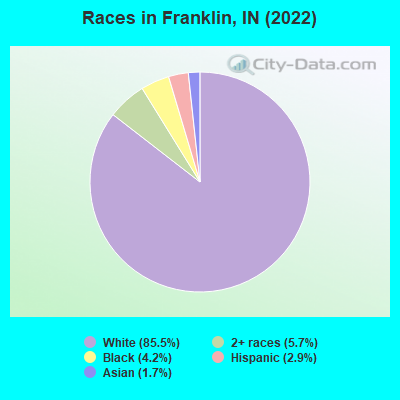
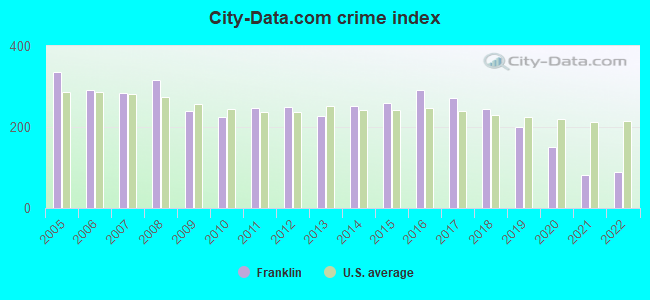
 Recent articles from our blog. Our writers, many of them Ph.D. graduates or candidates, create easy-to-read articles on a wide variety of topics.


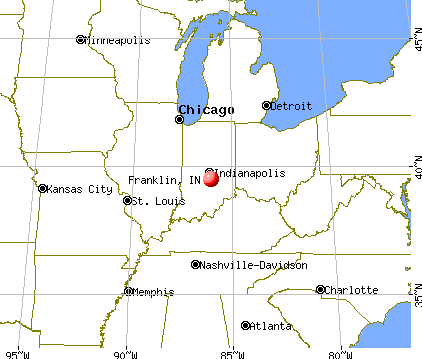
 (21.4 miles
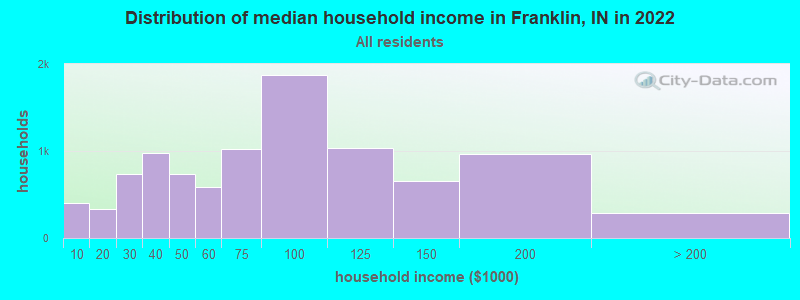
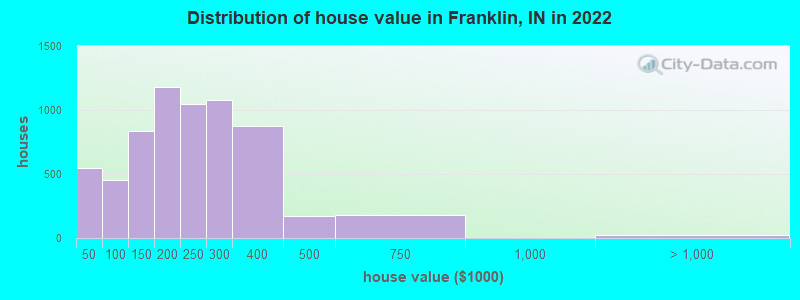
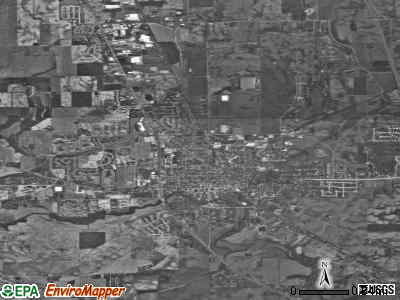
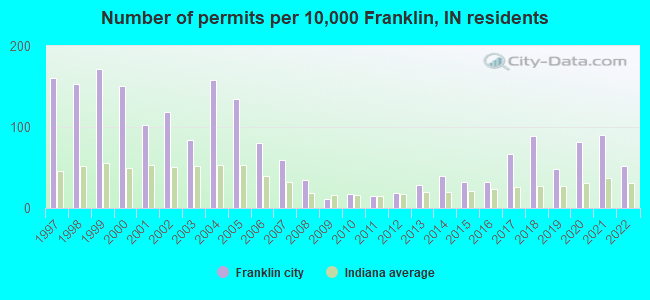
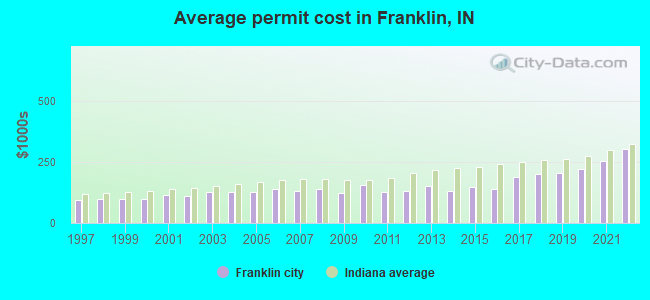
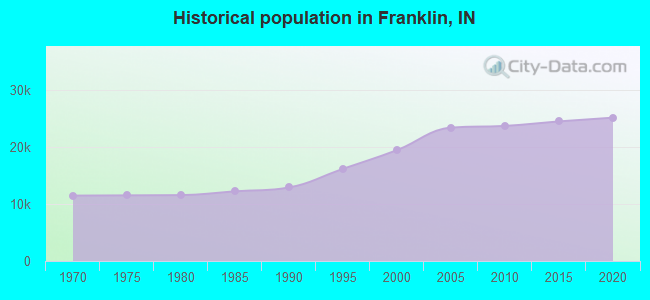
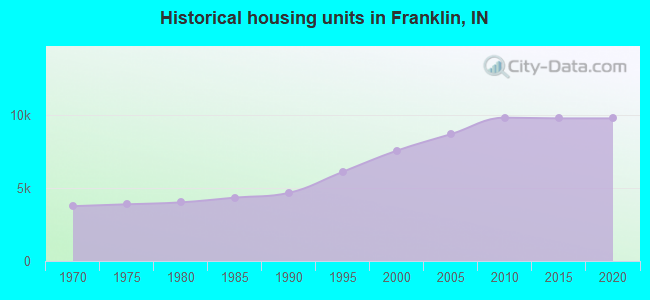
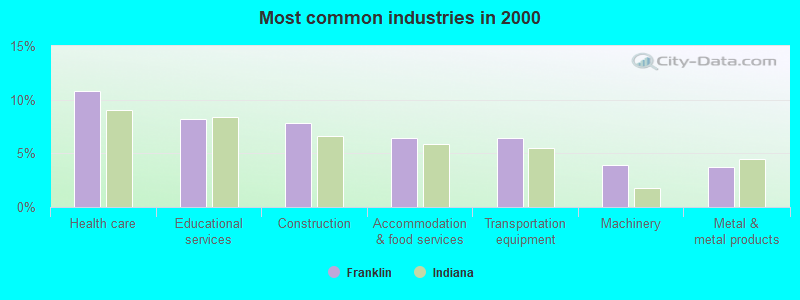
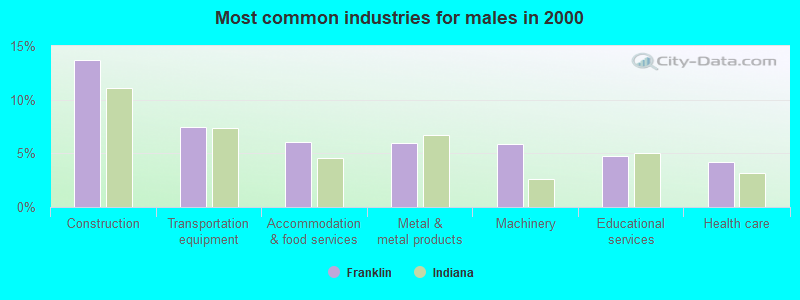
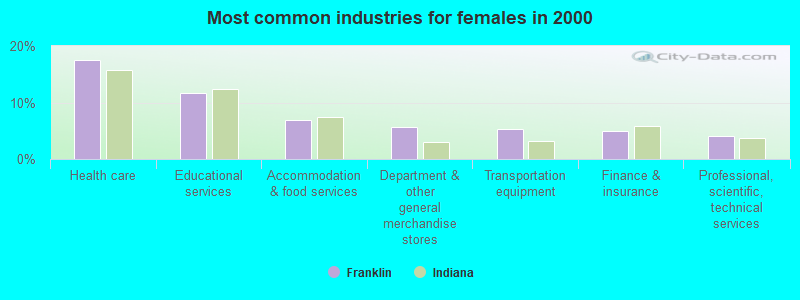
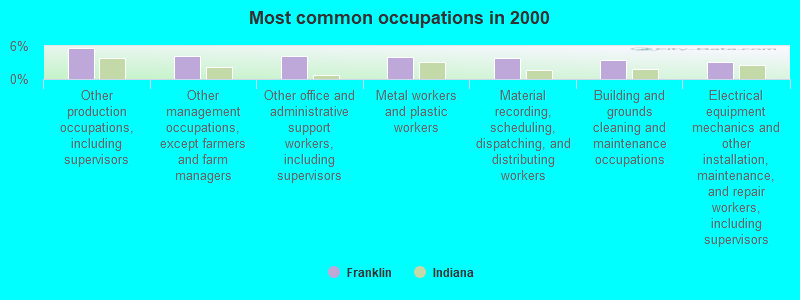
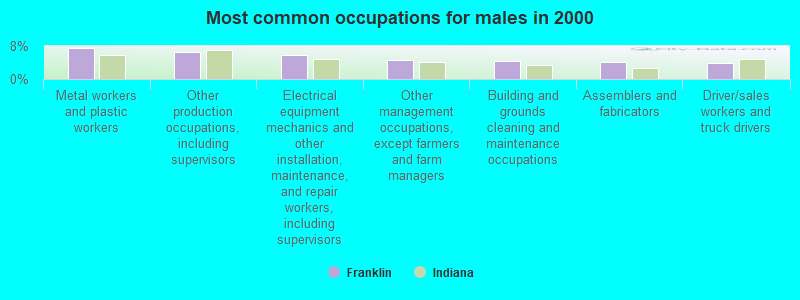
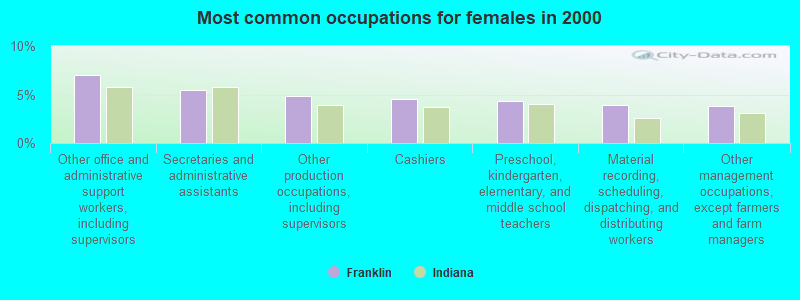
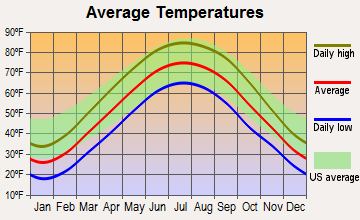
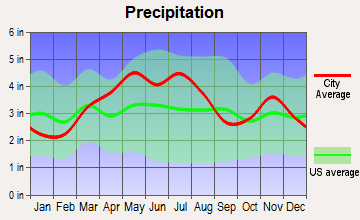
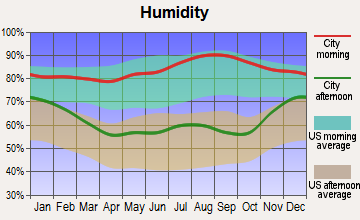
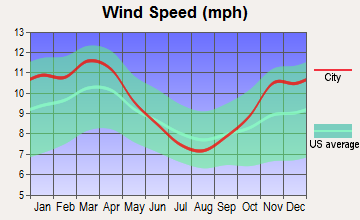
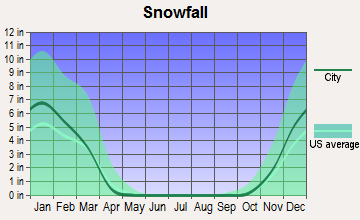
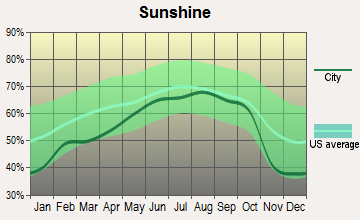
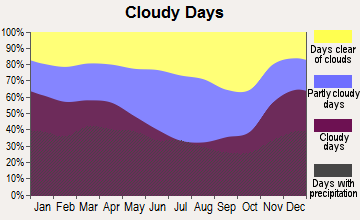


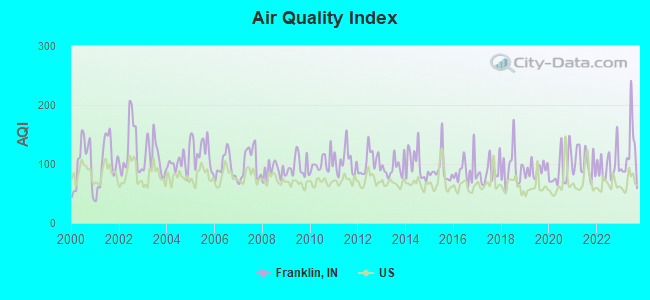
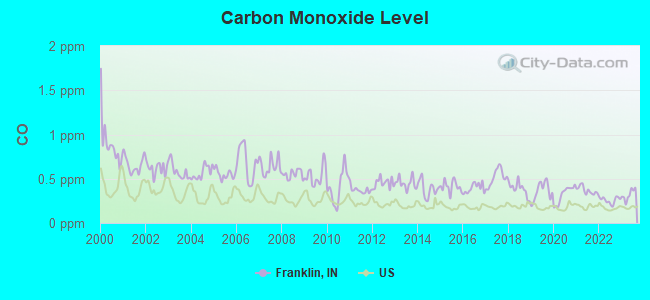
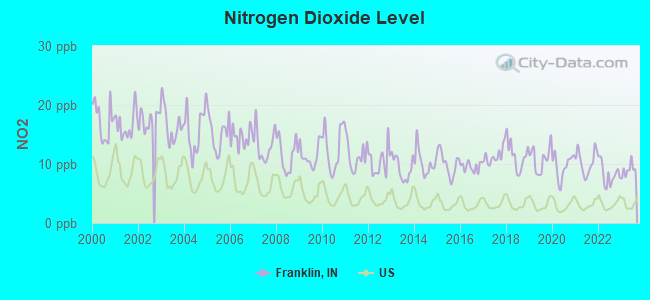
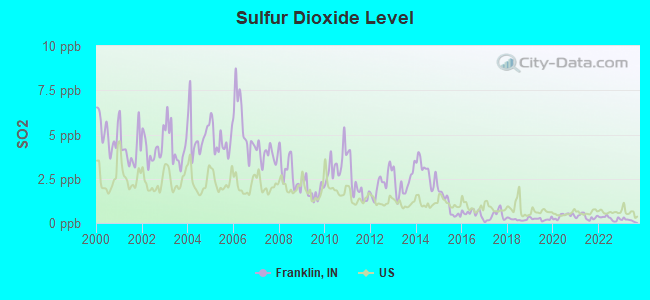
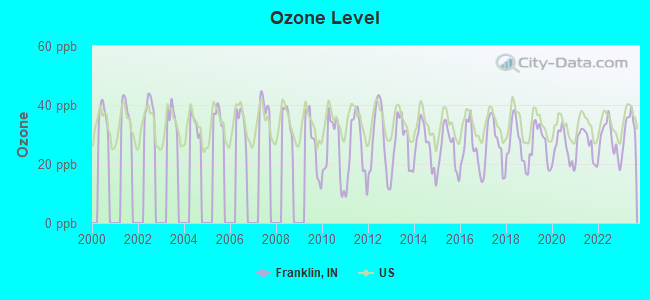
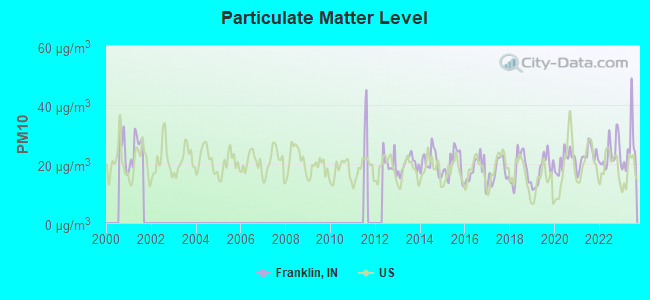
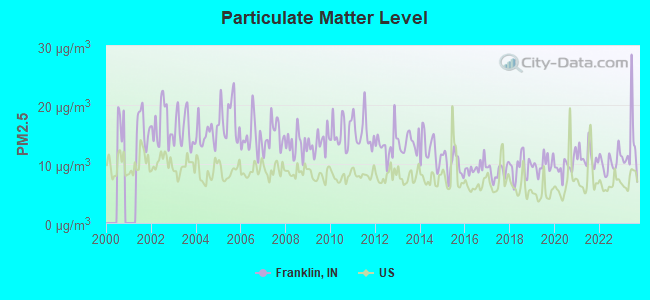
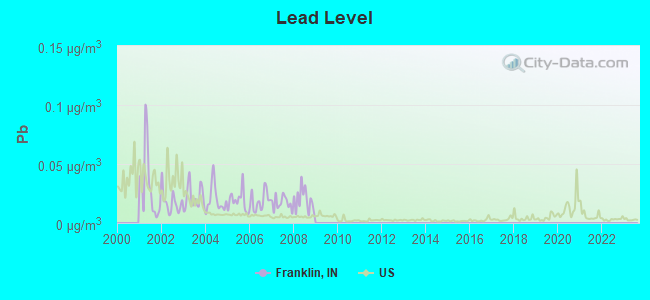

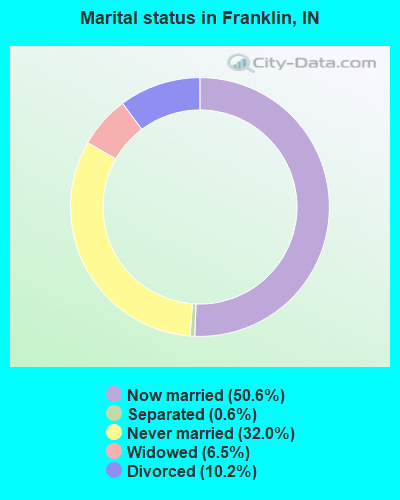
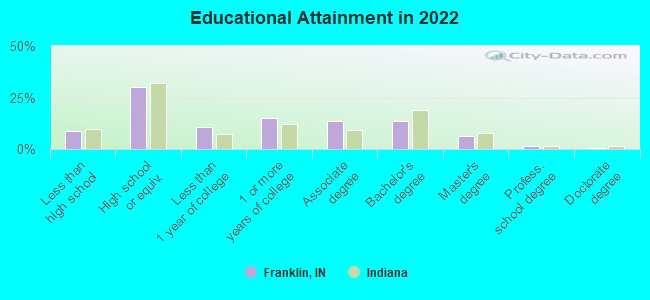
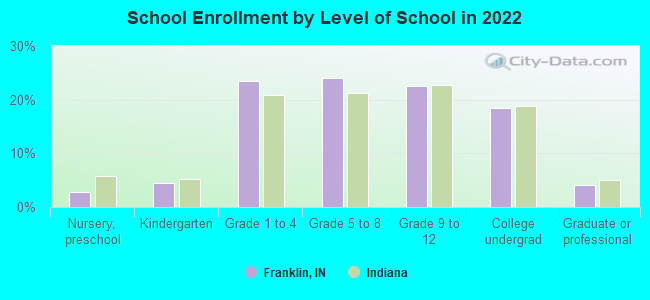
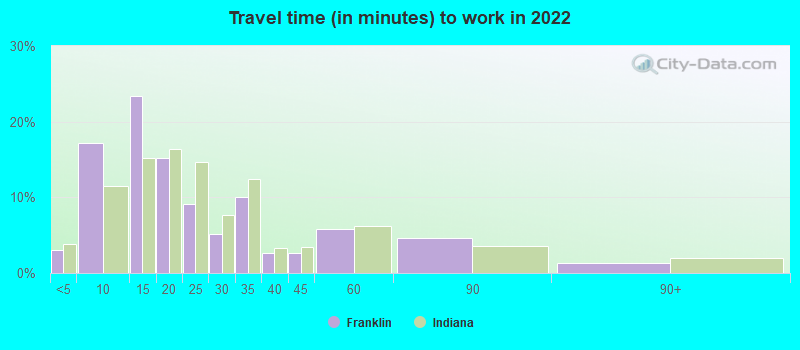
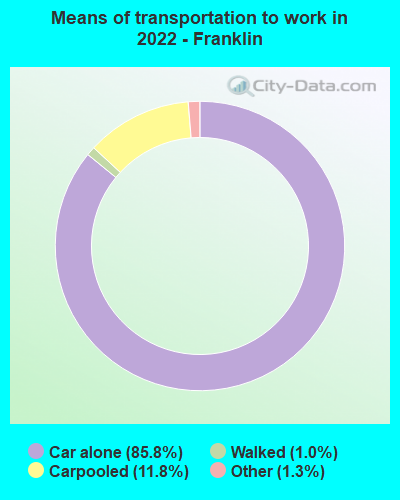
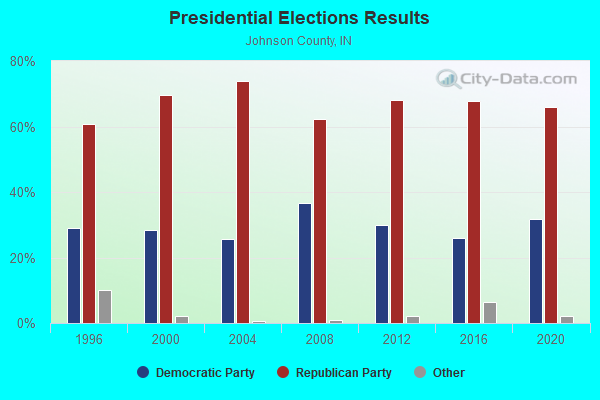
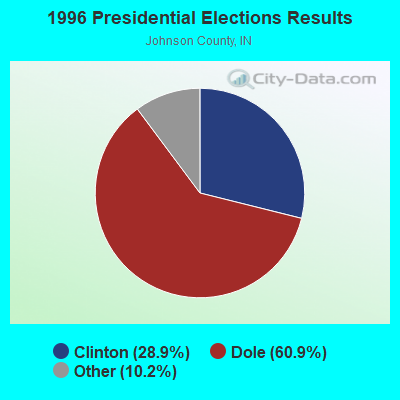


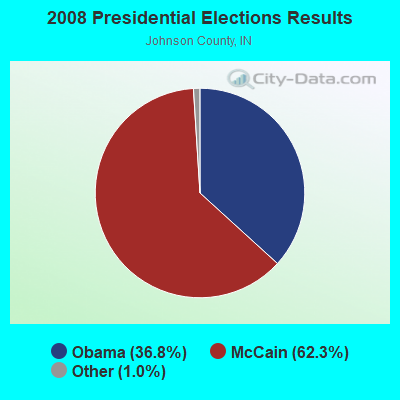
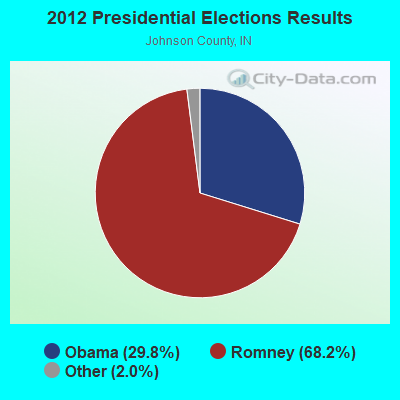
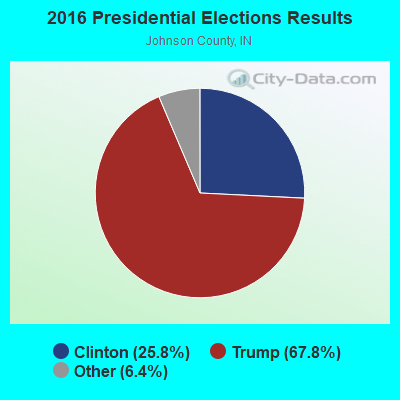
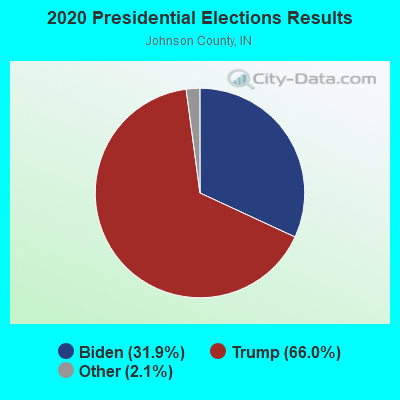
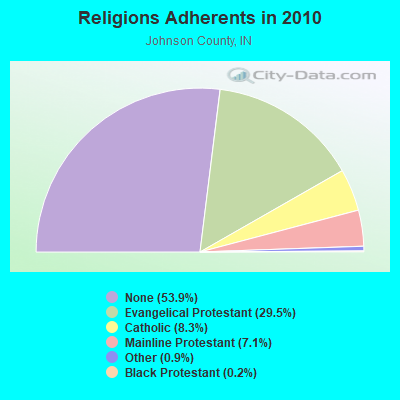
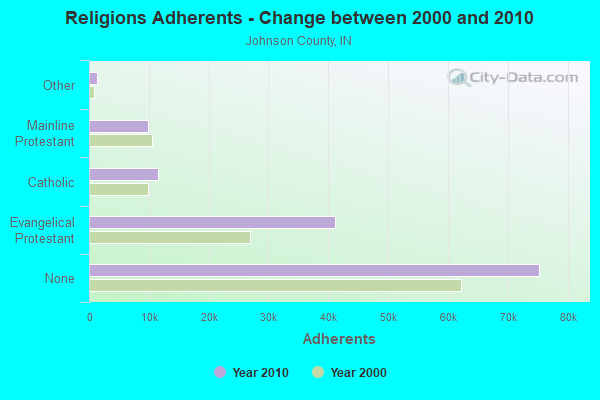
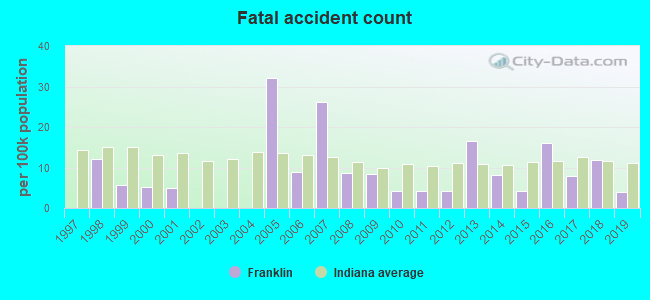

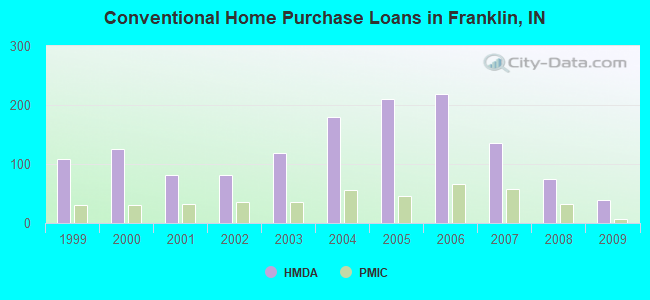
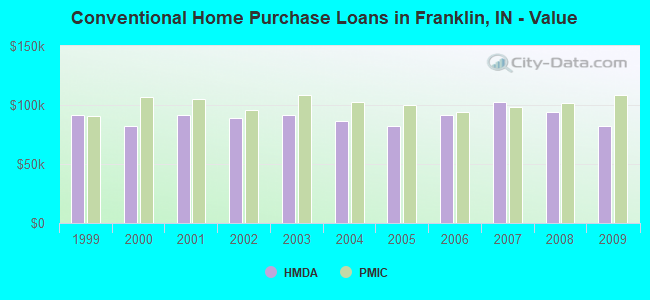
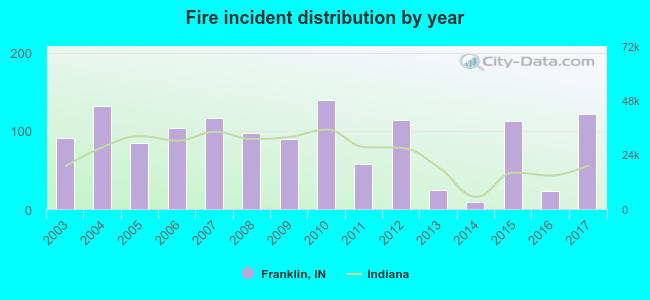 According to the data from the years 2003 - 2017 the average number of fires per year is 88. The highest number of fires - 139 took place in 2010, and the least - 9 in 2014. The data has an increasing trend.
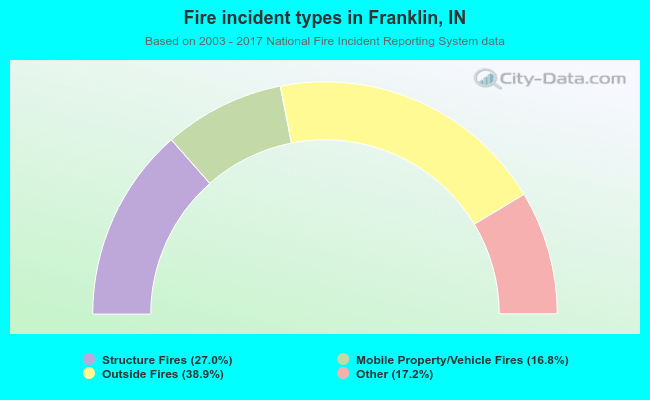 When looking into fire subcategories, the most incidents belonged to: Outside Fires (38.9%), and Structure Fires (27.0%).