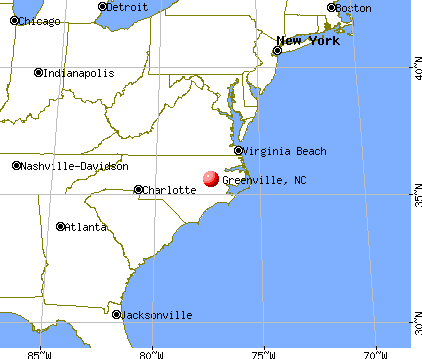
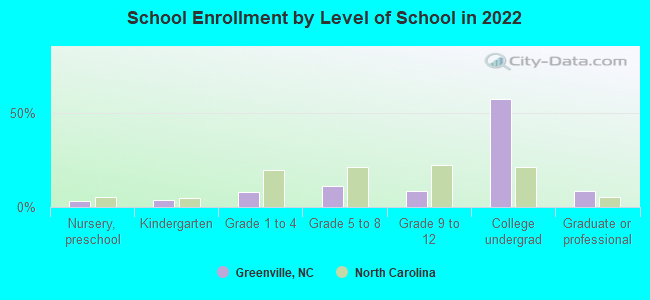
Greenville, North Carolina
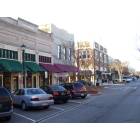
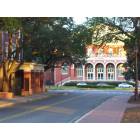
Greenville: Downtown Evans St
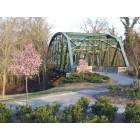
Greenville: Old Greene St. Bridge - Town Commons
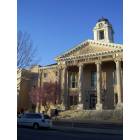
Greenville: Pitt County Court House
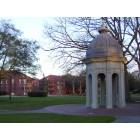
Greenville: Austin Cupola at ECU
Greenville: Train crossing
Greenville: Wright Auditorium at ECU

Greenville: Cotton Fields of home

Greenville: hospital of greenville nc
Greenville: CSX train In Greenville,NC on side of US 13 & NC 903
Greenville: Ribbon Cutting of Streetscape Entrance to West Greenville
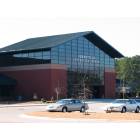
Greenville: Greenville Convention Center
- see
18
more - add
your


Submit your own pictures of this city and show them to the world
- OSM Map
- General Map
- Google Map
- MSN Map
Population change since 2000: +47.6%
| Males: 40,123 | |
| Females: 49,110 |
| Median resident age: | 28.6 years |
| North Carolina median age: | 39.2 years |
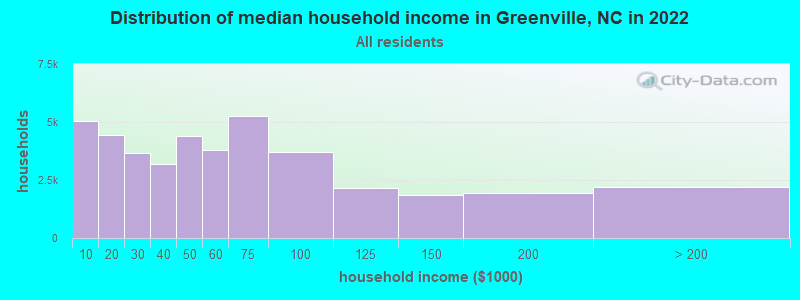
| Greenville: | $50,120 |
| NC: | $67,481 |
Estimated per capita income in 2022: $32,130 (it was $18,476 in 2000)
Greenville city income, earnings, and wages data
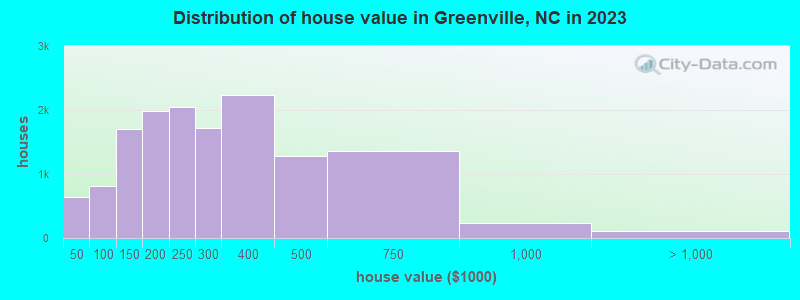
Estimated median house or condo value in 2022: $231,400 (it was $92,100 in 2000)
| Greenville: | $231,400 |
| NC: | $280,600 |
Mean prices in 2022: all housing units: $277,915; detached houses: $307,687; townhouses or other attached units: $210,780; in 2-unit structures: $102,486; in 3-to-4-unit structures: $172,496; in 5-or-more-unit structures: $83,559; mobile homes: $67,031
Median gross rent in 2022: $921.
(30.3% for White Non-Hispanic residents, 21.3% for Black residents, 15.9% for Hispanic or Latino residents, 67.9% for American Indian residents, 11.7% for other race residents, 19.2% for two or more races residents)
Detailed information about poverty and poor residents in Greenville, NC


Compare current foreclosures in Greenville, NC:
| Photo | Address | Area | Beds / Baths | Price | Details |
|---|---|---|---|---|---|

|
#1
Kirkland Dr
Greenville, NC 27858
|
2,673 sq. feet
|
3 baths 3 beds |
$320,000
|
show details |

|
#2
Kings Crossroads Rd
Greenville, NC 27834
|
1,170 sq. feet
|
1 baths 4 beds |
show details | |

|
#3
Cedarhurst Rd
Greenville, NC 27834
|
2,132 sq. feet
|
2 baths 3 beds |
show details | |

|
#4
Stanton Dr
Greenville, NC 27834
|
1,160 sq. feet
|
1 baths 3 beds |
show details | |

|
#5
Hudsons Crossroads Rd
Greenville, NC 27858
|
1,647 sq. feet
|
2 baths 3 beds |
show details | |

|
#6
Cortland Rd
Greenville, NC 27834
|
1,056 sq. feet
|
2 baths 3 beds |
show details | |

|
#7
Moore Rd
Greenville, NC 27834
|
1,075 sq. feet
|
1 baths 3 beds |
show details | |

|
#8
Dickinson Ave # B
Greenville, NC 27834
|
2,368 sq. feet
|
2 baths 5 beds |
show details | |

|
#9
Chance St
Greenville, NC 27834
|
2,052 sq. feet
|
2 baths 4 beds |
show details | |

|
#10
Autumn Dr
Greenville, NC 27834
|
1,270 sq. feet
|
2 baths 3 beds |
show details |
| Photo | Address | Area | Beds / Baths | Price | Details |
|---|---|---|---|---|---|

|
#11
Katherines Pl
Greenville, NC 27834
|
1,890 sq. feet
|
2 baths 4 beds |
show details | |

|
#12
Webb St
Greenville, NC 27834
|
1,110 sq. feet
|
1 baths 3 beds |
show details | |

|
#13
Greenville Blvd SW
Greenville, NC 27834
|
1,792 sq. feet
|
1 baths 3 beds |
show details | |

|
#14
Jackson Dr
Greenville, NC 27858
|
1,722 sq. feet
|
1 baths 3 beds |
show details | |

|
#15
May St
Greenville, NC 27834
|
1,956 sq. feet
|
1 baths 3 beds |
show details | |

|
#16
Scarlett Ohara Rd
Greenville, NC 27834
|
1,944 sq. feet
|
2 baths 4 beds |
show details | |

|
#17
Abbey Ln
Greenville, NC 27834
|
1,422 sq. feet
|
2 baths 3 beds |
show details | |

|
#18
N Village Dr
Greenville, NC 27834
|
1,663 sq. feet
|
1 baths 5 beds |
show details | |

|
#19
Holland Rd
Greenville, NC 27834
|
1,053 sq. feet
|
1 baths 3 beds |
show details | |

|
#20
Slauter St
Greenville, NC 27834
|
1,944 sq. feet
|
2 baths 3 beds |
show details |
| Photo | Address | Area | Beds / Baths | Price | Details |
|---|---|---|---|---|---|

|
#21
Olivia Dr
Greenville, NC 27834
|
1,568 sq. feet
|
2 baths 3 beds |
show details | |

|
#22
Adams Blvd
Greenville, NC 27858
|
1,505 sq. feet
|
1 baths 3 beds |
show details | |

|
#23
Roosevelt Spain Rd
Greenville, NC 27834
|
1,380 sq. feet
|
1 baths 3 beds |
show details | |

|
#24
Scarlet Oak Dr
Greenville, NC 27858
|
2,820 sq. feet
|
2 baths 4 beds |
show details | |

|
#25
Holland Rd
Greenville, NC 27834
|
1,552 sq. feet
|
2 baths 2 beds |
show details | |

|
#26
Dawson St
Greenville, NC 27834
|
1,025 sq. feet
|
1 baths 3 beds |
show details | |

|
#27
Old River Rd
Greenville, NC 27834
|
2,128 sq. feet
|
2 baths 4 beds |
show details | |

|
#28
Roosevelt Spain Rd
Greenville, NC 27834
|
1,328 sq. feet
|
1 baths 3 beds |
show details | |

|
#29
Briarcliff Dr
Greenville, NC 27834
|
1,574 sq. feet
|
2 baths 3 beds |
show details | |

|
#30
Dickinson Ave
Greenville, NC 27834
|
1,572 sq. feet
|
2 baths 3 beds |
show details |
| Photo | Address | Area | Beds / Baths | Price | Details |
|---|---|---|---|---|---|

|
#31
Hillendale Cir
Greenville, NC 27858
|
1,330 sq. feet
|
1 baths 3 beds |
show details | |

|
#32
Old Creek Rd
Greenville, NC 27834
|
1,621 sq. feet
|
2 baths 3 beds |
show details | |

|
#33
Briarcliff Dr
Greenville, NC 27834
|
1,531 sq. feet
|
2 baths 3 beds |
show details | |

|
#34
Jefferson Dr
Greenville, NC 27858
|
1,677 sq. feet
|
1 baths 3 beds |
show details | |

|
#35
Sunny Side Rd
Greenville, NC 27834
|
2,254 sq. feet
|
2 baths 3 beds |
show details | |

|
#36
Old River Rd
Greenville, NC 27834
|
2,052 sq. feet
|
2 baths 4 beds |
show details | |

|
#37
Tracey Cir
Greenville, NC 27834
|
1,782 sq. feet
|
2 baths 3 beds |
show details | |

|
#38
Brunswick Ln
Greenville, NC 27834
|
3,510 sq. feet
|
3 baths 3 beds |
show details | |

|
#39
Prince Rd
Greenville, NC 27858
|
1,837 sq. feet
|
2 baths 3 beds |
show details | |

|
#40
Stokes Rd
Greenville, NC 27834
|
2,079 sq. feet
|
2 baths 4 beds |
show details |
| Photo | Address | Area | Beds / Baths | Price | Details |
|---|---|---|---|---|---|

|
#41
Nicklaus Dr
Greenville, NC 27834
|
1,265 sq. feet
|
2 baths 3 beds |
show details | |

|
#42
Ruth Ct
Greenville, NC 27834
|
1,247 sq. feet
|
2 baths 3 beds |
show details | |

|
#43
Nc Highway 43 S
Greenville, NC 27858
|
1,328 sq. feet
|
2 baths 3 beds |
show details | |

|
#44
Benjaman Dr
Greenville, NC 27834
|
1,782 sq. feet
|
2 baths 3 beds |
show details | |

|
#45
Avalon Ln
Greenville, NC 27858
|
1,548 sq. feet
|
2 baths 3 beds |
show details | |

|
#46
Dr.
Greenville, NC 27834
|
- sq. feet
|
- baths - beds |
$650,000
|
show details |

|
#47
Louis St
Greenville, NC 27858
|
1,720 sq. feet
|
2 baths 3 beds |
show details | |

|
#48
Christopher Dr
Greenville, NC 27858
|
1,619 sq. feet
|
2 baths 3 beds |
show details | |

|
#49
Anderson Rd
Greenville, NC 27834
|
1,000 sq. feet
|
1 baths 3 beds |
show details | |

|
Check over 1 million property listings on Foreclosure.com!
|
browse all offers | |||


- 43,13348.4%White alone
- 36,26240.7%Black alone
- 3,9314.4%Hispanic
- 3,3553.8%Two or more races
- 2,1182.4%Asian alone
- 2670.3%Other race alone
- 1370.2%American Indian alone
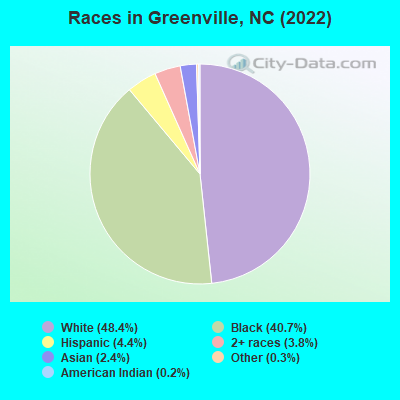
Races in Greenville detailed stats: ancestries, foreign born residents, place of birth
According to our research of North Carolina and other state lists, there were 219 registered sex offenders living in Greenville, North Carolina as of April 19, 2024.
The ratio of all residents to sex offenders in Greenville is 415 to 1.
The ratio of registered sex offenders to all residents in this city is near the state average.
The City-Data.com crime index weighs serious crimes and violent crimes more heavily. Higher means more crime, U.S. average is 246.1. It adjusts for the number of visitors and daily workers commuting into cities.
- means the value is smaller than the state average.- means the value is about the same as the state average.
- means the value is bigger than the state average.
- means the value is much bigger than the state average.
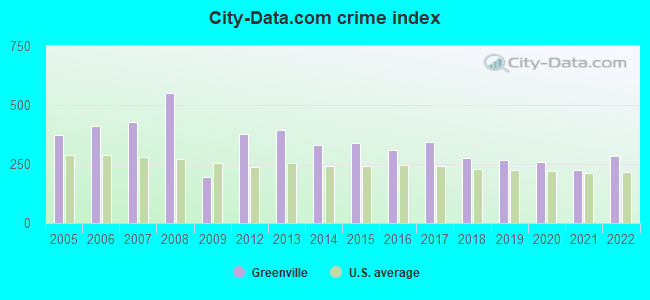
Crime rate in Greenville detailed stats: murders, rapes, robberies, assaults, burglaries, thefts, arson
Full-time law enforcement employees in 2021, including police officers: 223 (178 officers - 149 male; 29 female).
| Officers per 1,000 residents here: | 1.86 |
| North Carolina average: | 2.27 |
 Recent articles from our blog. Our writers, many of them Ph.D. graduates or candidates, create easy-to-read articles on a wide variety of topics.


Latest news from Greenville, NC collected exclusively by city-data.com from local newspapers, TV, and radio stations
Ancestries: English (12.0%), American (5.4%), Irish (4.9%), German (3.5%), Scotch-Irish (2.7%), European (2.5%).
Current Local Time: EST time zone
Elevation: 56 feet
Land area: 25.6 square miles.
Population density: 3,489 people per square mile (average).
4,325 residents are foreign born (2.1% Asia, 1.4% Latin America, 0.5% Europe).
| This city: | 4.9% |
| North Carolina: | 8.3% |
Median real estate property taxes paid for housing units with mortgages in 2022: $2,098 (0.9%)
Median real estate property taxes paid for housing units with no mortgage in 2022: $1,754 (0.8%)
Nearest city with pop. 200,000+: Raleigh, NC  (73.0 miles , pop. 276,093).
Nearest city with pop. 1,000,000+: Philadelphia, PA (327.5 miles , pop. 1,517,550).
Nearest cities:
), ), ), ), ), Latitude: 35.60 N, Longitude: 77.37 W
Daytime population change due to commuting: +16,081 (+18.0%)
Workers who live and work in this city: 32,490 (73.3%)
Area code: 252
Property values in Greenville, NC

Greenville tourist attractions:
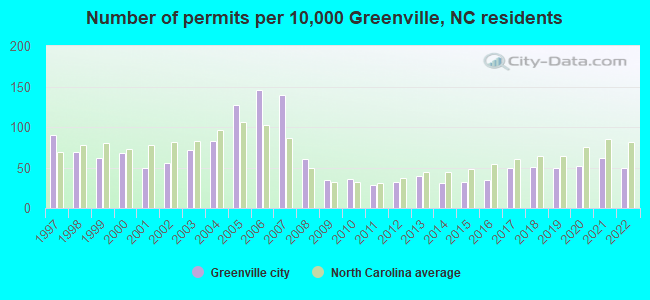
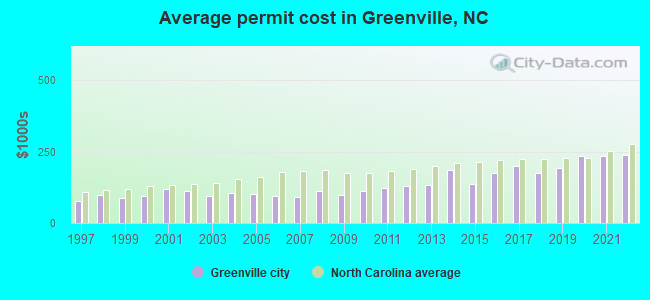
Single-family new house construction building permits:
- 2022: 302 buildings, average cost: $239,300
- 2021: 373 buildings, average cost: $233,800
- 2020: 317 buildings, average cost: $233,500
- 2019: 296 buildings, average cost: $191,600
- 2018: 309 buildings, average cost: $176,900
- 2017: 305 buildings, average cost: $200,600
- 2016: 206 buildings, average cost: $173,600
- 2015: 193 buildings, average cost: $137,100
- 2014: 185 buildings, average cost: $186,000
- 2013: 243 buildings, average cost: $132,900
- 2012: 195 buildings, average cost: $129,100
- 2011: 171 buildings, average cost: $122,300
- 2010: 218 buildings, average cost: $111,600
- 2009: 203 buildings, average cost: $98,600
- 2008: 362 buildings, average cost: $114,400
- 2007: 844 buildings, average cost: $90,400
- 2006: 883 buildings, average cost: $96,300
- 2005: 771 buildings, average cost: $99,600
- 2004: 504 buildings, average cost: $105,600
- 2003: 433 buildings, average cost: $95,600
- 2002: 338 buildings, average cost: $113,800
- 2001: 294 buildings, average cost: $120,600
- 2000: 411 buildings, average cost: $96,000
- 1999: 373 buildings, average cost: $88,200
- 1998: 416 buildings, average cost: $97,500
- 1997: 544 buildings, average cost: $75,600
| Here: | 4.0% |
| North Carolina: | 3.2% |
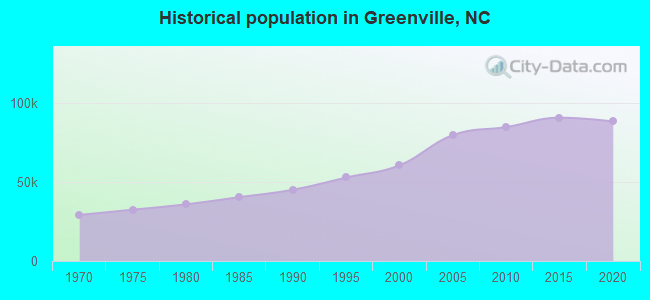
Population change in the 1990s: +11,017 (+22.3%).
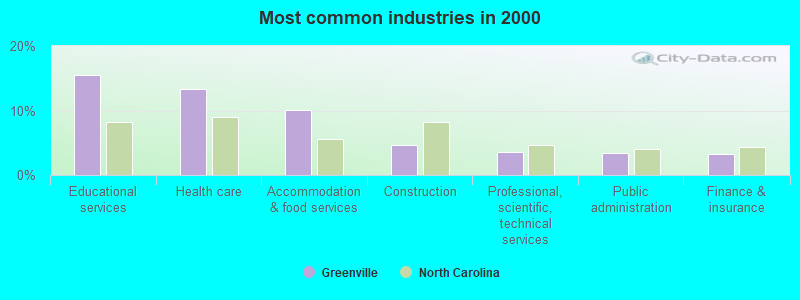
- Educational services (15.5%)
- Health care (13.3%)
- Accommodation & food services (10.0%)
- Construction (4.7%)
- Professional, scientific, technical services (3.6%)
- Public administration (3.5%)
- Finance & insurance (3.3%)
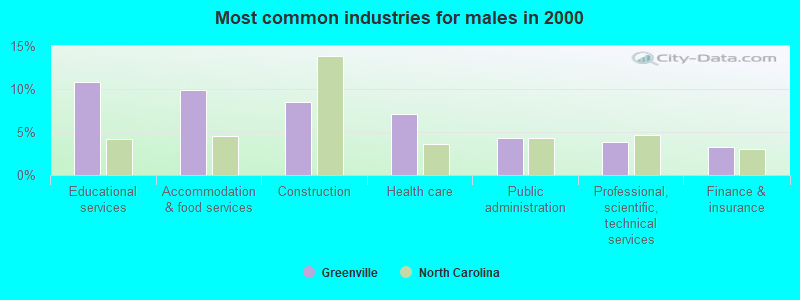
- Educational services (10.8%)
- Accommodation & food services (9.9%)
- Construction (8.4%)
- Health care (7.1%)
- Public administration (4.4%)
- Professional, scientific, technical services (3.9%)
- Finance & insurance (3.3%)
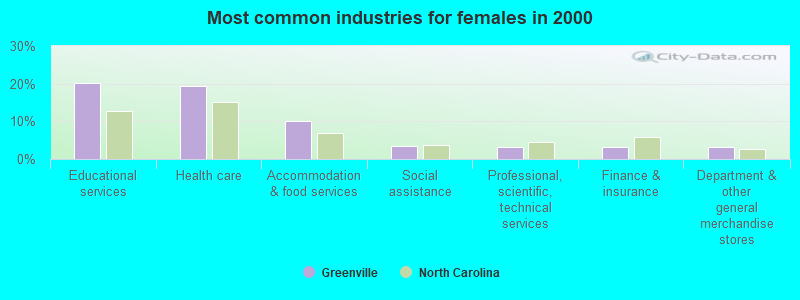
- Educational services (20.1%)
- Health care (19.3%)
- Accommodation & food services (10.2%)
- Social assistance (3.6%)
- Professional, scientific, technical services (3.3%)
- Finance & insurance (3.3%)
- Department & other general merchandise stores (3.1%)
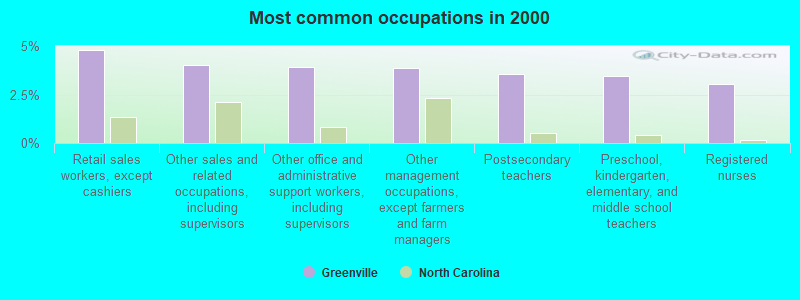
- Retail sales workers, except cashiers (4.8%)
- Other sales and related occupations, including supervisors (4.0%)
- Other office and administrative support workers, including supervisors (3.9%)
- Other management occupations, except farmers and farm managers (3.9%)
- Postsecondary teachers (3.6%)
- Preschool, kindergarten, elementary, and middle school teachers (3.5%)
- Registered nurses (3.1%)
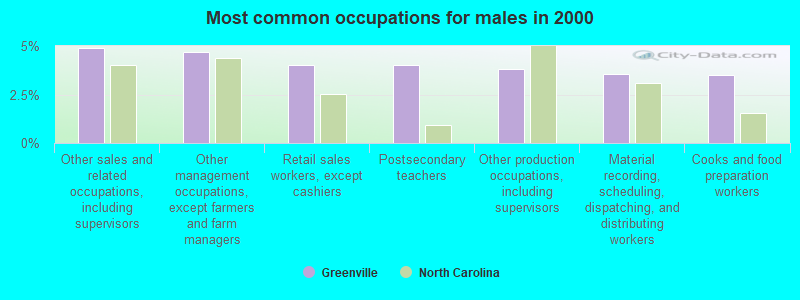
- Other sales and related occupations, including supervisors (4.9%)
- Other management occupations, except farmers and farm managers (4.7%)
- Retail sales workers, except cashiers (4.0%)
- Postsecondary teachers (4.0%)
- Other production occupations, including supervisors (3.8%)
- Material recording, scheduling, dispatching, and distributing workers (3.6%)
- Cooks and food preparation workers (3.5%)

- Other office and administrative support workers, including supervisors (6.0%)
- Preschool, kindergarten, elementary, and middle school teachers (6.0%)
- Retail sales workers, except cashiers (5.5%)
- Registered nurses (5.5%)
- Secretaries and administrative assistants (4.6%)
- Waiters and waitresses (4.0%)
- Cashiers (3.4%)
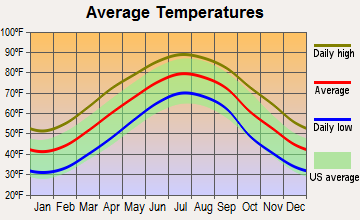
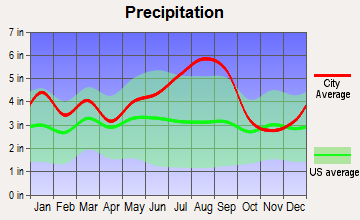
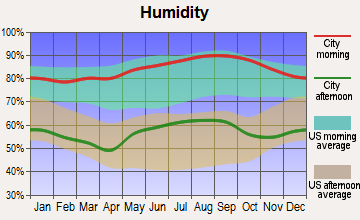
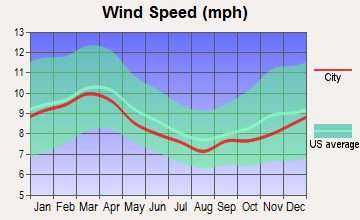
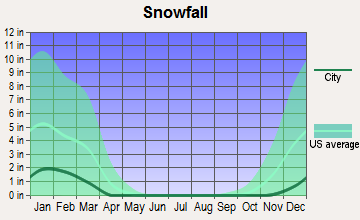
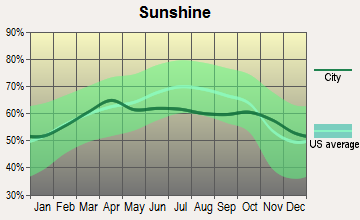
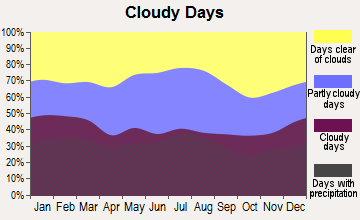
Average climate in Greenville, North Carolina
Based on data reported by over 4,000 weather stations
|
|

(lower is better)
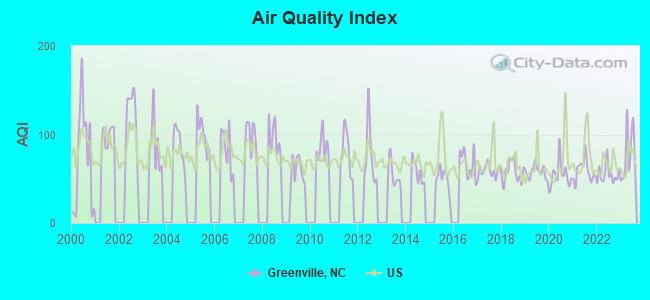
Air Quality Index (AQI) level in 2023 was 77.4. This is about average.
| City: | 77.4 |
| U.S.: | 72.6 |
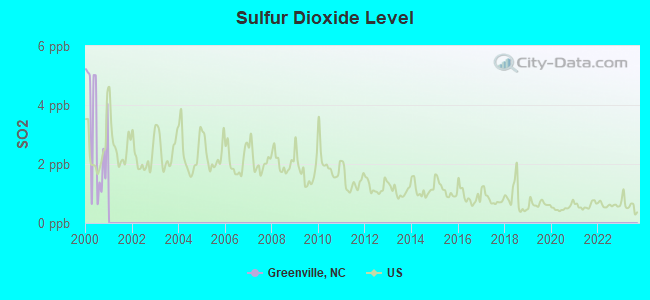
Sulfur Dioxide (SO2) [ppb] level in 2000 was 3.09. This is significantly worse than average. Closest monitor was 0.9 miles away from the city center.
| City: | 3.09 |
| U.S.: | 1.51 |
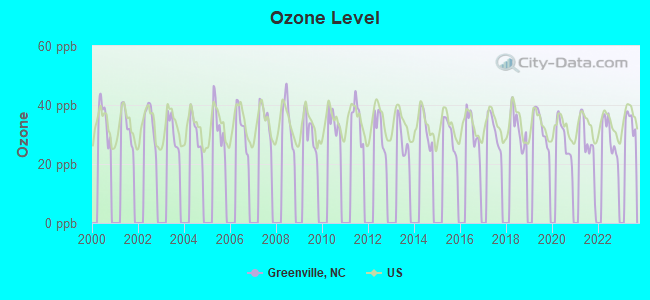
Ozone [ppb] level in 2022 was 29.2. This is about average. Closest monitor was 2.8 miles away from the city center.
| City: | 29.2 |
| U.S.: | 33.3 |
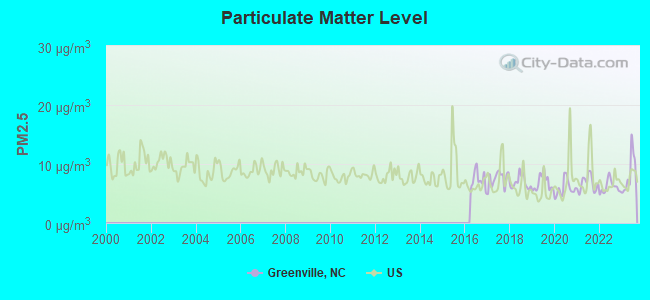
Particulate Matter (PM2.5) [µg/m3] level in 2023 was 8.35. This is about average. Closest monitor was 0.9 miles away from the city center.
| City: | 8.35 |
| U.S.: | 8.11 |
Tornado activity:
Greenville-area historical tornado activity is slightly above North Carolina state average. It is 9% greater than the overall U.S. average.
On 3/28/1984, a category F4 (max. wind speeds 207-260 mph) tornado 11.1 miles away from the Greenville city center killed 16 people and injured 153 people and caused between $5,000,000 and $50,000,000 in damages.
On 5/15/1972, a category F3 (max. wind speeds 158-206 mph) tornado 0.2 miles away from the city center injured 4 people and caused between $500,000 and $5,000,000 in damages.
Earthquake activity:
Greenville-area historical earthquake activity is significantly above North Carolina state average. It is 59% smaller than the overall U.S. average.On 8/23/2011 at 17:51:04, a magnitude 5.8 (5.8 MW, Depth: 3.7 mi, Class: Moderate, Intensity: VI - VII) earthquake occurred 162.7 miles away from Greenville center
On 8/9/2020 at 12:07:37, a magnitude 5.1 (5.1 MW, Depth: 4.7 mi) earthquake occurred 216.7 miles away from Greenville center
On 12/9/2003 at 20:59:14, a magnitude 4.5 (4.5 MB, 4.5 LG, Class: Light, Intensity: IV - V) earthquake occurred 140.4 miles away from Greenville center
On 12/9/2003 at 20:59:18, a magnitude 4.5 (4.5 ML, Depth: 6.2 mi) earthquake occurred 155.6 miles away from the city center
On 8/25/2011 at 05:07:52, a magnitude 4.5 (4.5 ML, Depth: 4.2 mi) earthquake occurred 165.5 miles away from the city center
On 8/6/1994 at 19:54:09, a magnitude 3.8 (3.6 LG, 3.8 LG, Depth: 3.1 mi, Class: Light, Intensity: II - III) earthquake occurred 51.0 miles away from the city center
Magnitude types: regional Lg-wave magnitude (LG), body-wave magnitude (MB), local magnitude (ML), moment magnitude (MW)
Natural disasters:
The number of natural disasters in Pitt County (22) is greater than the US average (15).Major Disasters (Presidential) Declared: 12
Emergencies Declared: 6
Causes of natural disasters: Hurricanes: 16, Storms: 3, Floods: 2, Tornadoes: 2, Blizzard: 1, Ice Storm: 1, Tropical Storm: 1, Wind: 1, Other: 1 (Note: some incidents may be assigned to more than one category).
Hospitals in Greenville:
- RHA/HOWELL CARE CENTERS/FOREST HILLS GROUP HOME (1913 FOREST HILLS DRIVE)
- RHA/HOWELL CARE CENTERS/KING GEORGE GROUP HOME (323 KING GEORGE ROAD)
- RHA/HOWELL CARE CENTERS/TAR RIVER (498 & 500 SEAN DRIVE)
- SKILL CREATIONS OF GREENVILLE (2701 W 5TH STREET)
- VIDANT MEDICAL CENTER (Voluntary non-profit - Private, 2100 STANTONSBURG RD)
- WALTER B JONES ALCOHOL AND DRUG ABUSE (2577 WEST FIFTH STREET)
- WALTER B JONES ALCOHOLIC REHAB CENTER (ROUTE 1 BOX 20A)
Nursing Homes in Greenville:
- CYPRESS GLEN RETIREMENT COMMUN (1000 HICKORY STREET)
- GOLDEN LIVINGCENTER - GREENVILLE (2910 MACGREGOR DOWNS)
- GREENFIELD PLACE (2575 W 5TH ST)
- GREENVILLE VILLA (MOYE RD)
- UNIVERSAL HEALTH CARE / GREENVILLE (2578 WEST 5TH STREET)
- UNIVERSITY NURSING CENTER (HWY 43W RT 1 BOX 21)
Dialysis Facilities in Greenville:
- FMC DIALYSIS SERVICES EAST CAROLINA UNIVERSITY (2355 W ARLINGTON BLVD)
- GREENVILLE DIALYSIS CENTER (510 PALADIN DRIVE)
Home Health Centers in Greenville:
Airports and heliports located in Greenville:
- Pitt-Greenville Airport (PGV) (Runways: 2, Commercial Ops: 2,720, Air Taxi Ops: 12,500, Itinerant Ops: 16,000, Local Ops: 16,500, Military Ops: 500)
- Mcgee 02 Heliport (02NR)
- Vidant Health Heliport (NC91)
Colleges/Universities in Greenville:
- East Carolina University (Full-time enrollment: 23,943; Location: East 5th Street; Public; Website: www.ecu.edu; Offers Doctor's degree)
- Miller-Motte College-Greenville (Full-time enrollment: 452; Location: 1021 WH Smith Blvd Ste 102; Private, for-profit; Website: www.miller-motte.edu)
- Mitchells Hairstyling Academy-Greenville (Full-time enrollment: 37; Location: 426 Arlington Blvd; Private, for-profit; Website: www.mitchells.edu)
- Grace College of Barbering (Full-time enrollment: 20; Location: 1206 Dickinson Ave; Private, not-for-profit; Website: www.gcb.edu)
Other colleges/universities with over 2000 students near Greenville:
- Pitt Community College (about 5 miles; Winterville, NC; Full-time enrollment: 7,026)
- Edgecombe Community College (about 23 miles; Tarboro, NC; FT enrollment: 2,058)
- Lenoir Community College (about 28 miles; Kinston, NC; FT enrollment: 2,555)
- Wayne Community College (about 36 miles; Goldsboro, NC; FT enrollment: 3,174)
- Craven Community College (about 38 miles; New Bern, NC; FT enrollment: 2,712)
- Nash Community College (about 40 miles; Rocky Mount, NC; FT enrollment: 2,520)
- Mount Olive College (about 48 miles; Mount Olive, NC; FT enrollment: 3,097)
Public high schools in Greenville:
- D H CONLEY HIGH (Location: 2006 WORTHINGTON RD, Grades: 9-12)
- JUNIUS H ROSE HIGH (Location: 600 W ARLINGTON BLVD, Grades: 9-12)
- VIDANT HEALTH (Location: 400 SPRUCE STREET, Grades: PK-12)
- NC STATE LEARNING ACADEMY- PITT (Location: 451 BELVOIR ROAD, Grades: 6-12)
Private high schools in Greenville:
- TRINITY CHRISTIAN SCHOOL (Students: 395, Location: 3111 GOLDEN RD, Grades: PK-12)
- THE OAKWOOD SCHOOL (Students: 347, Location: 4000 MACGREGOR DOWNS RD, Grades: PK-12)
- GREENVILLE CHRISTIAN ACADEMY (Students: 310, Location: 1621 GREENVILLE BLVD SW, Grades: PK-12)
- CALVARY CHRISTIAN ACADEMY (Students: 26, Location: 1412 HOLBERT ST, Grades: KG-12)
- THE GREENVILLE LEARNING CENTER (Students: 18, Location: 1101 S ELM ST, Grades: 3-12)
Biggest public elementary/middle schools in Greenville:
- C M EPPES MIDDLE (Location: 1100 SOUTH ELM STREET, Grades: 6-8)
- BELVOIR ELEMENTARY (Location: 2568 NC 33 WEST, Grades: PK-5)
- CHICOD (Location: 7557 NC 43 SOUTH, Grades: PK-8)
- FALKLAND ELEMENTARY (Location: 503 NC 121, Grades: KG-5)
- PACTOLUS (Location: 3405 YANKEE HALL RD, Grades: PK-8)
- WELLCOME MIDDLE (Location: 3101 N MEMORIAL DRIVE, Grades: 6-8)
- EASTERN ELEMENTARY (Location: 1700 CEDAR LN, Grades: KG-5)
- E B AYCOCK MIDDLE (Location: 1325 RED BANKS ROAD, Grades: 6-8)
- ELMHURST ELEMENTARY (Location: 1815 W BERKLEY RD, Grades: KG-5)
- SOUTH GREENVILLE ELEMENTARY (Location: 811 HOWELL ST, Grades: KG-5)
Private elementary/middle schools in Greenville:
User-submitted facts and corrections:
- In 2006, it was estimated that the City of Greenville's population was 75,525. Greenville is also the birthplace Chic bass player and producer the late Bernard Edwards, and Rapper Petey Pablo. added by Jack
- Brookhaven SDA School is now located at 4658 Reedy Branch Rd. Winterville, NC 28590
Points of interest:
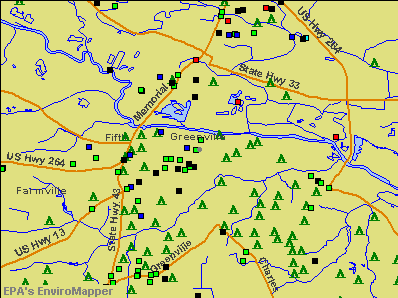
Notable locations in Greenville: The Plaza (A), Red Oak Plaza (B), Westend Circle (C), Moyewood (D), Cherry View (E), Greenville Golf and Country Club (F), Arlington Plaza (G), Executive Park West (H), Redbank Landing (I), Southside Commercial Center (J), Greenville Lot (K), Minges Coliseum (L), Brook Valley Country Club (M), Carolina Convention Center (N), University Square (O), East Carolina University - Greenville Main Campus Christenbury Memorial Gymnasium (P), Randolph Landing (Q), Sheppard Memorial Library - East Branch (R), Sheppard Memorial Library (S), Shepherd Memorial Library - Carver Branch (T). Display/hide their locations on the map
Shopping Centers: Colonial Heights Shopping Center (1), East Gate Shopping Center (2), Greenville Square Shopping Center (3), Patricks Plaza Shopping Center (4), Rivergate Shopping Center (5), South Park Shopping Center (6), Buyers Market Shopping Center (7), Greenville Square Shopping Center (8), Carolina East Mall (9). Display/hide their locations on the map
Churches in Greenville include: English Chapel Free Will Church (A), Memorial Baptist Church (B), Saint Paul Church (C), Saint Peter Church (D), Mount Calvary Church (E), Jarvis Memorial Church (F), Phillippi Church (G), University Church (H), Calvary Church (I). Display/hide their locations on the map
Cemeteries: Brownhill Cemetery (1), Gleenwood Cemetery (2), Greenwood Cemetery (3). Display/hide their locations on the map
Lake: Forbes Millpond (A). Display/hide its location on the map
Streams, rivers, and creeks: Fomes Branch (A), Bryan Creek (B), Bell Branch (C), Meeting House Branch (D), Schoolhouse Branch (E), Sams Branch (F), Parker Creek (G), Sains Branch (H). Display/hide their locations on the map
Parks in Greenville include: Harrington Field (1), East Carolina University - Williams Arena (2), Wright Circle (3), Town Common (4), River Park North (5), Davis Arboretum (6), South Greenville Park (7), Thomas Foreman Park (8), Guy Smith Park (9). Display/hide their locations on the map
Tourist attractions: Greenville Museum of Art (802 Evans Street) (1), Amf East Carolina Lanes (Amusement & Theme Parks; 700 Red Banks Road) (2), Greenville Fun Park Inc (Highway 264) (3), Lou's Beach Bingo Inc (500 West 10th Street) (4). Display/hide their approximate locations on the map
Hotels: Comfort Inn (3900 South Memorial Drive) (1), Hampton Inn Greenville (3439 South Memorial Drive) (2), Courtyard by Marriott (2225 Stantonsburg Road) (3), Greenville Motel (2309 South Memorial Drive) (4), Chasers (203 Greenville Boulevard Southwest) (5), Best Western Suites of Greenville (2310 Greenville Boulevard Northeast) (6), Camelot Inn (2828 South Memorial Drive) (7), Economy Inn Of Greenville (1901 Stantonsburg Rd) (8), Hilton Greenville (207 Greenfield Blvd) (9). Display/hide their approximate locations on the map
Courts: North Carolina State - Criminal- Clerk Of Superior Court- Traffic (100 West 3rd) (1), North Carolina State - Administration- Clerk Of Superior Court- Courts- Community Service Pro (100 West 3rd Street) (2), North Carolina State - Civil- Clerk Of Superior Court- Courts- Community Service Pro (100 West 3rd) (3), United States Government - Courts- U S District Court (201 Evans Street) (4), Federal Bureau Of Investigation (2200 Charles Boulevard) (5). Display/hide their approximate locations on the map
Birthplace of: Monte Barrett - Boxer, Billy Taylor - Jazz musician and composer, Alge Crumpler - 2005 NFL player (Atlanta Falcons, born: Dec 23, 1977), Blenda Gay - People, Bronswell Patrick - Baseball player, Everette Brown - Football player, Frank Holliday - Artist, Marjorie Dannenfelser - President of the Susan B. Anthony List, Petey Pablo - Rapper, Will MacKenzie - PGA Tour Golf player (born: 9/28/74).
| This city: | 2.2 people |
| North Carolina: | 2.5 people |
| This city: | 46.3% |
| Whole state: | 66.7% |
| This city: | 7.0% |
| Whole state: | 5.9% |
Likely homosexual households (counted as self-reported same-sex unmarried-partner households)
- Lesbian couples: 0.3% of all households
- Gay men: 0.2% of all households
People in group quarters in Greenville in 2010:
- 4,780 people in college/university student housing
- 734 people in nursing facilities/skilled-nursing facilities
- 87 people in emergency and transitional shelters (with sleeping facilities) for people experiencing homelessness
- 77 people in other noninstitutional facilities
- 75 people in group homes intended for adults
- 74 people in residential treatment centers for adults
- 20 people in group homes for juveniles (non-correctional)
- 5 people in workers' group living quarters and job corps centers
- 4 people in residential treatment centers for juveniles (non-correctional)
- 2 people in in-patient hospice facilities
People in group quarters in Greenville in 2000:
- 4,644 people in college dormitories (includes college quarters off campus)
- 454 people in other noninstitutional group quarters
- 381 people in nursing homes
- 28 people in homes for the physically handicapped
- 18 people in wards in general hospitals for patients who have no usual home elsewhere
- 15 people in homes or halfway houses for drug/alcohol abuse
- 14 people in hospitals or wards for drug/alcohol abuse
- 12 people in homes for the mentally retarded
- 9 people in homes for the mentally ill
- 8 people in other group homes
- 4 people in religious group quarters
- 3 people in other nonhousehold living situations
Banks with most branches in Greenville (2011 data):
- Wells Fargo Bank, National Association: Nc Pitt County, Greenville Uptown, Greenville Medical Park, Greenville East Branch, Greenville Red Banks Road. Info updated 2011/04/05: Bank assets: $1,161,490.0 mil, Deposits: $905,653.0 mil, headquarters in Sioux Falls, SD, positive income, 6395 total offices, Holding Company: Wells Fargo & Company
- First-Citizens Bank & Trust Company: Greenville Medical Center Branch, Greenville Downtown Branch, Trade Street Branch, Southeast Branch, Greenville Main. Info updated 2011/10/11: Bank assets: $20,566.4 mil, Deposits: $17,596.8 mil, headquarters in Raleigh, NC, positive income, Commercial Lending Specialization, 433 total offices, Holding Company: First Citizens Bancshares, Inc.
- Branch Banking and Trust Company: Medical Park Branch, Greenville Nc Main Branch, Redbanks Road Branch, Evans Street Branch. Info updated 2010/03/29: Bank assets: $168,867.6 mil, Deposits: $127,549.5 mil, headquarters in Winston Salem, NC, positive income, Commercial Lending Specialization, 1793 total offices, Holding Company: Bb&T Corporation
- Bank of America, National Association: East End Branch, Hospital Branch, South Park Branch, Greenville Main Branch. Info updated 2009/11/18: Bank assets: $1,451,969.3 mil, Deposits: $1,077,176.8 mil, headquarters in Charlotte, NC, positive income, 5782 total offices, Holding Company: Bank Of America Corporation
- First South Bank: Greenville-Firetower Branch, Greenville Boulevard Branch, Greenville Branch. Info updated 2006/11/03: Bank assets: $744.4 mil, Deposits: $644.7 mil, headquarters in Washington, NC, positive income, Commercial Lending Specialization, 27 total offices, Holding Company: First South Bancorp, Inc.
- PNC Bank, National Association: Arlington Boulevard Branch, Mall Branch, Medical Park Branch. Info updated 2012/03/20: Bank assets: $263,309.6 mil, Deposits: $197,343.0 mil, headquarters in Wilmington, DE, positive income, Commercial Lending Specialization, 3085 total offices, Holding Company: Pnc Financial Services Group, Inc., The
- The East Carolina Bank: Red Banks Road Branch, University Medical Center Branch, Hardee Village- Greenville. Info updated 2010/05/27: Bank assets: $921.7 mil, Deposits: $797.6 mil, headquarters in Engelhard, NC, positive income, Commercial Lending Specialization, 25 total offices, Holding Company: Ecb Bancorp, Inc.
- Southern Bank and Trust Company: Greenville Main Branch at 2310 South Charles Boulevard, branch established on 2000/09/01; Greenville Medical Center at 2275 Stantonsburg Road, branch established on 2008/05/27. Info updated 2011/09/26: Bank assets: $2,039.8 mil, Deposits: $1,658.5 mil, headquarters in Mount Olive, NC, positive income, Commercial Lending Specialization, 66 total offices, Holding Company: Southern Bancshares (N.C.), Inc.
- First Carolina State Bank: Greenville Branch at 300 East Arlington Street, branch established on 2009/08/07; Greenville Lpo at 323 Clifton Street, Suite 5, branch established on 2007/04/15. Info updated 2008/10/01: Bank assets: $85.2 mil, Deposits: $73.3 mil, headquarters in Rocky Mount, NC, negative income in the last year, Commercial Lending Specialization, 4 total offices, Holding Company: Capitol Bancorp Ltd.
- 5 other banks with 6 local branches
For population 15 years and over in Greenville:
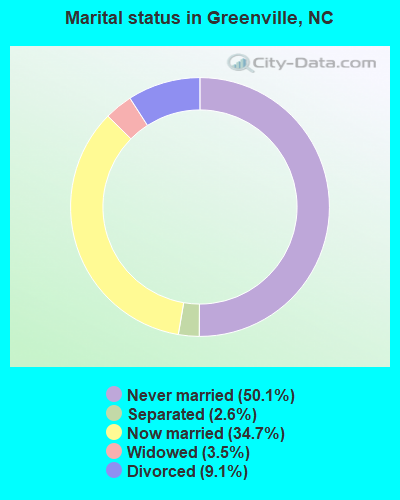
- Never married: 50.1%
- Now married: 34.7%
- Separated: 2.6%
- Widowed: 3.5%
- Divorced: 9.1%
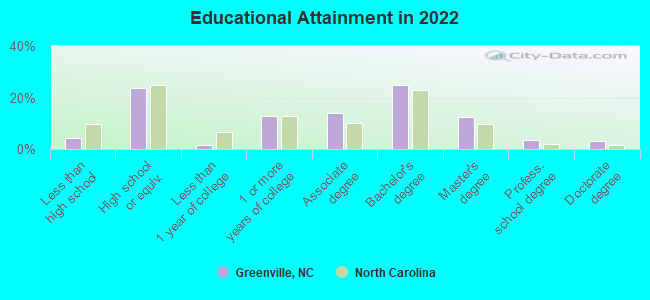
For population 25 years and over in Greenville:
- High school or higher: 95.7%
- Bachelor's degree or higher: 43.6%
- Graduate or professional degree: 18.9%
- Unemployed: 8.7%
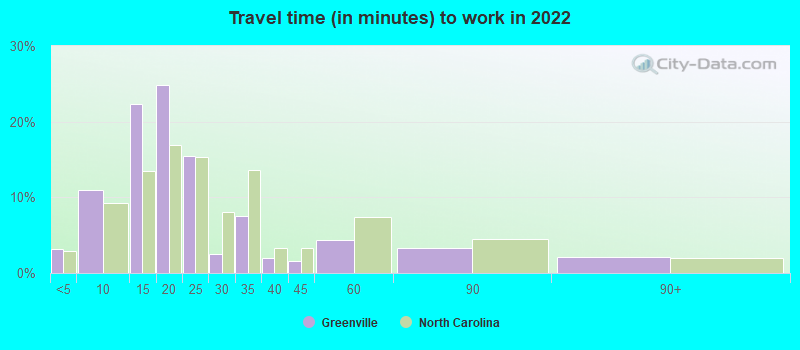
- Mean travel time to work (commute): 17.0 minutes
| Here: | 10.2 |
| North Carolina average: | 11.7 |
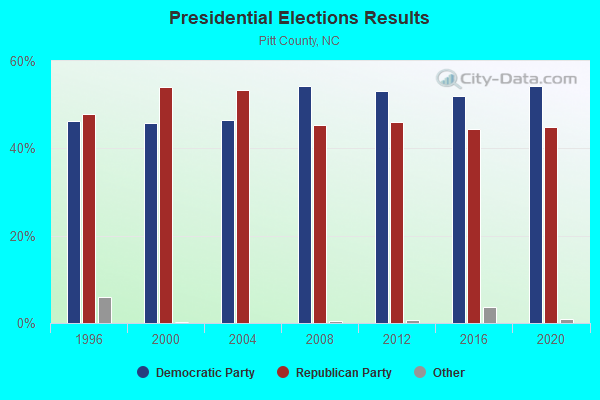
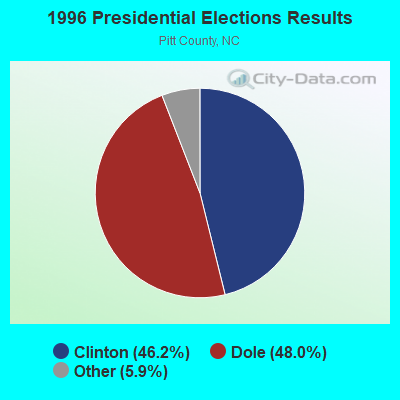
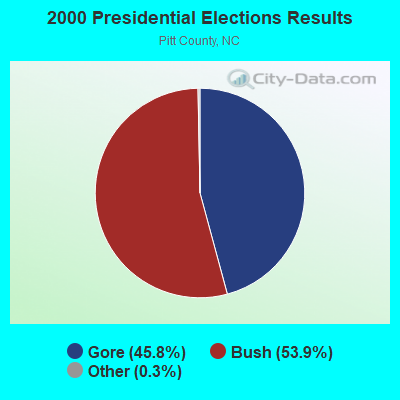
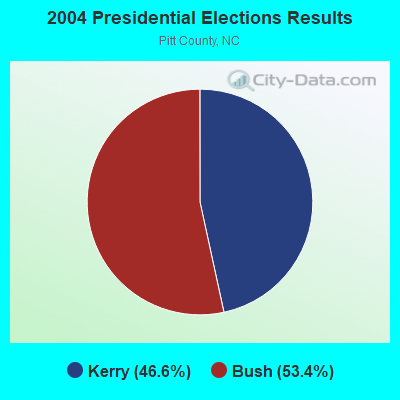
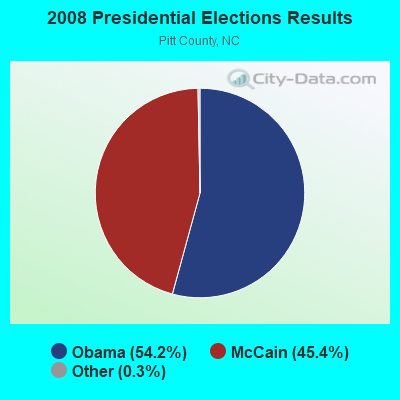
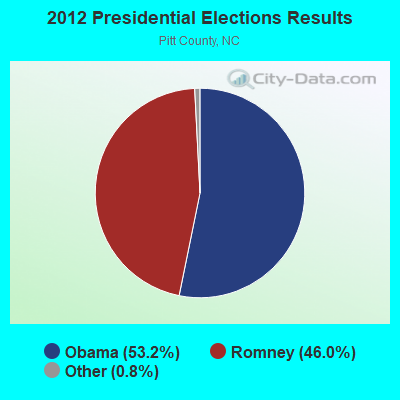
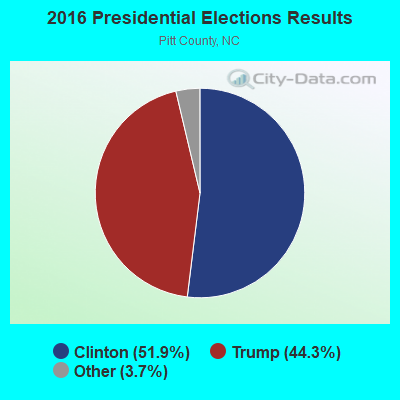

Graphs represent county-level data. Detailed 2008 Election Results
Religion statistics for Greenville, NC (based on Pitt County data)
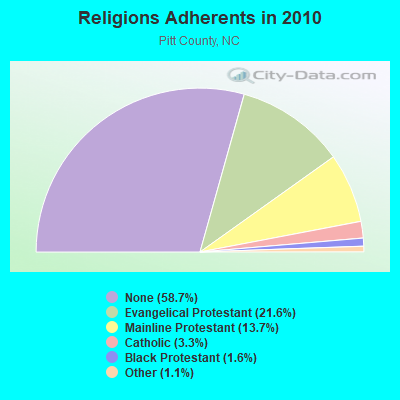
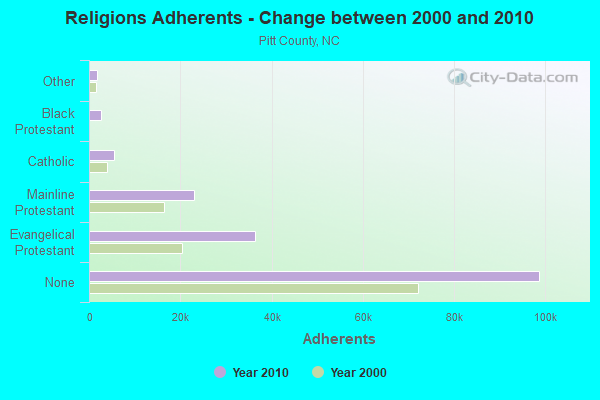
| Religion | Adherents | Congregations |
|---|---|---|
| Evangelical Protestant | 36,334 | 154 |
| Mainline Protestant | 23,029 | 47 |
| Catholic | 5,489 | 3 |
| Black Protestant | 2,712 | 32 |
| Other | 1,855 | 11 |
| Orthodox | 50 | 1 |
| None | 98,679 | - |
Food Environment Statistics:
| Pitt County: | 1.91 / 10,000 pop. |
| State: | 2.05 / 10,000 pop. |
| Pitt County: | 0.13 / 10,000 pop. |
| North Carolina: | 0.14 / 10,000 pop. |
| This county: | 0.85 / 10,000 pop. |
| State: | 0.92 / 10,000 pop. |
| Pitt County: | 4.54 / 10,000 pop. |
| North Carolina: | 4.75 / 10,000 pop. |
| Pitt County: | 6.70 / 10,000 pop. |
| North Carolina: | 7.57 / 10,000 pop. |
| Here: | 9.6% |
| State: | 9.8% |
| Here: | 32.2% |
| North Carolina: | 28.3% |
| This county: | 15.9% |
| State: | 15.6% |
Health and Nutrition:
| Greenville: | 50.5% |
| North Carolina: | 48.9% |
| Greenville: | 51.2% |
| North Carolina: | 46.1% |
| Greenville: | 28.3 |
| North Carolina: | 28.8 |
| This city: | 18.7% |
| State: | 20.7% |
| Here: | 11.0% |
| North Carolina: | 10.7% |
| Greenville: | 6.8 |
| North Carolina: | 6.8 |
| This city: | 30.3% |
| North Carolina: | 33.7% |
| Here: | 59.6% |
| North Carolina: | 55.8% |
| Greenville: | 83.3% |
| North Carolina: | 79.7% |
More about Health and Nutrition of Greenville, NC Residents
| Local government employment and payroll (March 2022) | |||||
| Function | Full-time employees | Monthly full-time payroll | Average yearly full-time wage | Part-time employees | Monthly part-time payroll |
|---|---|---|---|---|---|
| Other and Unallocable | 215 | $1,296,829 | $72,381 | 27 | $33,547 |
| Police Protection - Officers | 190 | $1,028,210 | $64,940 | 0 | $0 |
| Firefighters | 176 | $851,411 | $58,051 | 3 | $7,225 |
| Electric Power | 139 | $834,102 | $72,009 | 2 | $881 |
| Water Supply | 71 | $427,592 | $72,269 | 3 | $8,704 |
| Gas Supply | 53 | $336,292 | $76,142 | 0 | $0 |
| Streets and Highways | 52 | $227,593 | $52,521 | 0 | $0 |
| Sewerage | 49 | $279,044 | $68,337 | 3 | $8,042 |
| Solid Waste Management | 45 | $160,649 | $42,840 | 1 | $2,391 |
| Financial Administration | 45 | $262,971 | $70,126 | 0 | $0 |
| Housing and Community Development (Local) | 45 | $177,612 | $47,363 | 0 | $0 |
| Police - Other | 28 | $37,902 | $16,244 | 0 | $0 |
| Parks and Recreation | 24 | $125,645 | $62,823 | 94 | $51,768 |
| Airports | 20 | $70,682 | $42,409 | 0 | $0 |
| Other Government Administration | 19 | $168,224 | $106,247 | 7 | $5,583 |
| Local Libraries | 13 | $60,162 | $55,534 | 18 | $15,501 |
| Transit | 11 | $40,958 | $44,681 | 8 | $14,997 |
| Judicial and Legal | 4 | $38,227 | $114,681 | 0 | $0 |
| Fire - Other | 3 | $13,487 | $53,948 | 0 | $0 |
| Totals for Government | 1,202 | $6,437,592 | $64,269 | 166 | $148,641 |
Greenville government finances - Expenditure in 2021 (per resident):
- Construction - Water Utilities: $21,053,000 ($235.93)
Electric Utilities: $18,799,000 ($210.67)
Sewerage: $5,166,000 ($57.89)
Parks and Recreation: $3,584,000 ($40.16)
Gas Utilities: $3,144,000 ($35.23)
Regular Highways: $2,517,000 ($28.21)
Housing and Community Development: $2,343,000 ($26.26)
- Current Operations - Electric Utilities: $309,707,000 ($3470.77)
Gas Utilities: $51,913,000 ($581.77)
Sewerage: $37,540,000 ($420.70)
Water Utilities: $35,387,000 ($396.57)
Police Protection: $24,714,000 ($276.96)
General - Other: $17,275,000 ($193.59)
Local Fire Protection: $15,041,000 ($168.56)
Regular Highways: $10,129,000 ($113.51)
Solid Waste Management: $7,164,000 ($80.28)
Housing and Community Development: $6,812,000 ($76.34)
Parks and Recreation: $6,541,000 ($73.30)
Central Staff Services: $3,282,000 ($36.78)
Financial Administration: $2,664,000 ($29.85)
Transit Utilities: $2,628,000 ($29.45)
Libraries: $2,099,000 ($23.52)
Judicial and Legal Services: $567,000 ($6.35)
- Electric Utilities - Interest on Debt: $4,402,000 ($49.33)
- Gas Utilities - Interest on Debt: $1,398,000 ($15.67)
- General - Interest on Debt: $4,006,000 ($44.89)
- Intergovernmental to Local - Other - Electric Utilities: $20,000 ($0.22)
Other - Water Utilities: $13,000 ($0.15)
Other - Sewerage: $12,000 ($0.13)
Other - Gas Utilities: $10,000 ($0.11)
- Other Capital Outlay - Electric Utilities: $4,155,000 ($46.56)
Sewerage: $1,184,000 ($13.27)
Gas Utilities: $939,000 ($10.52)
Water Utilities: $770,000 ($8.63)
Police Protection: $593,000 ($6.65)
General - Other: $336,000 ($3.77)
Libraries: $136,000 ($1.52)
- Total Salaries and Wages: $33,189,000 ($371.94)
- Water Utilities - Interest on Debt: $3,396,000 ($38.06)
Greenville government finances - Revenue in 2021 (per resident):
- Charges - Sewerage: $55,171,000 ($618.28)
Solid Waste Management: $8,239,000 ($92.33)
Other: $3,724,000 ($41.73)
Hospital Public: $2,448,000 ($27.43)
Natural Resources - Other: $1,005,000 ($11.26)
Parks and Recreation: $742,000 ($8.32)
Miscellaneous Commercial Activities: $715,000 ($8.01)
Parking Facilities: $209,000 ($2.34)
- Federal Intergovernmental - Transit Utilities: $2,288,000 ($25.64)
Highways: $279,000 ($3.13)
Electric Utilities: $209,000 ($2.34)
Sewerage: $42,000 ($0.47)
Water Utilities: $15,000 ($0.17)
Gas Utilities: $13,000 ($0.15)
- Local Intergovernmental - General Local Government Support: $812,000 ($9.10)
- Miscellaneous - General Revenue - Other: $8,429,000 ($94.46)
Donations From Private Sources: $2,128,000 ($23.85)
Interest Earnings: $1,076,000 ($12.06)
Special Assessments: $676,000 ($7.58)
Sale of Property: $194,000 ($2.17)
- Revenue - Electric Utilities: $351,666,000 ($3940.99)
Gas Utilities: $66,616,000 ($746.54)
Water Utilities: $46,792,000 ($524.38)
Transit Utilities: $11,000 ($0.12)
- State Intergovernmental - General Local Government Support: $13,805,000 ($154.71)
Other: $2,415,000 ($27.06)
Highways: $2,125,000 ($23.81)
Housing and Community Development: $2,011,000 ($22.54)
Transit Utilities: $1,134,000 ($12.71)
- Tax - Property: $38,707,000 ($433.77)
General Sales and Gross Receipts: $19,176,000 ($214.90)
Other Selective Sales: $894,000 ($10.02)
Other License: $208,000 ($2.33)
Greenville government finances - Debt in 2021 (per resident):
- Long Term Debt - Beginning Outstanding - Unspecified Public Purpose: $380,538,000 ($4264.54)
Outstanding Unspecified Public Purpose: $375,416,000 ($4207.14)
Retired Unspecified Public Purpose: $84,967,000 ($952.19)
Issue, Unspecified Public Purpose: $79,844,000 ($894.78)
Greenville government finances - Cash and Securities in 2021 (per resident):
- Bond Funds - Cash and Securities: $5,331,000 ($59.74)
- Other Funds - Cash and Securities: $156,757,000 ($1756.72)
| Businesses in Greenville, NC | ||||
| Name | Count | Name | Count | |
|---|---|---|---|---|
| AMF Bowling | 1 | Little Caesars Pizza | 1 | |
| AT&T | 2 | Long John Silver's | 1 | |
| Advance Auto Parts | 3 | Lowe's | 1 | |
| Aeropostale | 1 | Marriott | 1 | |
| American Eagle Outfitters | 1 | MasterBrand Cabinets | 4 | |
| Ann Taylor | 1 | Maurices | 1 | |
| Applebee's | 1 | McDonald's | 7 | |
| Arby's | 3 | Men's Wearhouse | 1 | |
| Ashley Furniture | 1 | Microtel | 1 | |
| Audi | 1 | Motel 6 | 1 | |
| AutoZone | 2 | New Balance | 2 | |
| Barnes & Noble | 1 | New York & Co | 1 | |
| Baskin-Robbins | 1 | Nike | 8 | |
| Bath & Body Works | 1 | Nissan | 1 | |
| Baymont Inn | 1 | Office Depot | 1 | |
| Bed Bath & Beyond | 1 | Old Navy | 1 | |
| Best Western | 1 | Olive Garden | 1 | |
| Blockbuster | 2 | Outback | 1 | |
| Budget Car Rental | 1 | Outback Steakhouse | 1 | |
| Buffalo Wild Wings | 1 | Pac Sun | 1 | |
| Burger King | 4 | Panera Bread | 1 | |
| CVS | 3 | Papa John's Pizza | 1 | |
| Casual Male XL | 1 | Payless | 1 | |
| Catherines | 1 | Penske | 1 | |
| Charlotte Russe | 1 | PetSmart | 1 | |
| Chevrolet | 1 | Pier 1 Imports | 1 | |
| Chick-Fil-A | 3 | Pizza Hut | 1 | |
| Chico's | 1 | Quality | 1 | |
| Cold Stone Creamery | 1 | Quiznos | 1 | |
| Cracker Barrel | 1 | RadioShack | 2 | |
| Days Inn | 1 | Red Lobster | 1 | |
| Decora Cabinetry | 2 | Rite Aid | 5 | |
| Dennys | 1 | Ruby Tuesday | 1 | |
| Domino's Pizza | 3 | Rue21 | 1 | |
| DressBarn | 1 | Ryder Rental & Truck Leasing | 1 | |
| Dressbarn | 1 | SONIC Drive-In | 3 | |
| Dunkin Donuts | 6 | Sears | 2 | |
| Ethan Allen | 1 | Shoe Carnival | 1 | |
| Express | 1 | Spencer Gifts | 1 | |
| FedEx | 16 | Sprint Nextel | 2 | |
| Foot Locker | 1 | Staples | 1 | |
| Ford | 1 | Starbucks | 5 | |
| GNC | 3 | Subway | 6 | |
| GameStop | 2 | Super 8 | 1 | |
| Gap | 1 | T-Mobile | 3 | |
| Goodwill | 2 | T.J.Maxx | 1 | |
| Gymboree | 1 | Taco Bell | 2 | |
| H&R Block | 5 | Talbots | 1 | |
| Hardee's | 3 | Target | 1 | |
| Hilton | 2 | The Room Place | 1 | |
| Holiday Inn | 2 | Toyota | 1 | |
| Honda | 1 | Toys"R"Us | 1 | |
| Hot Topic | 1 | Travelodge | 1 | |
| Hyundai | 1 | U-Haul | 14 | |
| IHOP | 1 | U.S. Cellular | 4 | |
| JCPenney | 1 | UPS | 21 | |
| Jimmy John's | 3 | Vans | 2 | |
| JoS. A. Bank | 1 | Verizon Wireless | 1 | |
| Jones New York | 1 | Victoria's Secret | 1 | |
| KFC | 3 | Volkswagen | 1 | |
| Kincaid | 1 | Waffle House | 2 | |
| Kmart | 1 | Walgreens | 4 | |
| Kohl's | 1 | Walmart | 1 | |
| La-Z-Boy | 1 | Wendy's | 4 | |
| Lane Furniture | 1 | Wingate | 1 | |
Strongest AM radio stations in Greenville:
- WNCT (1070 AM; 10 kW; GREENVILLE, NC; Owner: WNCT LICENSE LIMITED PARTNERSHIP)
- WOOW (1340 AM; 1 kW; GREENVILLE, NC; Owner: THE MINORITY VOICE, INC.)
- WGHB (1250 AM; 5 kW; FARMVILLE, NC; Owner: CONNER MEDIA, INC.)
- WDLX (930 AM; 5 kW; WASHINGTON, NC; Owner: NM LICENSING, LLC)
- WPTF (680 AM; 50 kW; RALEIGH, NC; Owner: FIRST STATE COMMUNICATIONS)
- WRNS (960 AM; 5 kW; KINSTON, NC; Owner: NM LICENSING, LLC)
- WFTK (1030 AM; daytime; 50 kW; WAKE FOREST, NC; Owner: POSITIVE RADIO GROUP, INC.)
- WGTM (590 AM; 5 kW; WILSON, NC; Owner: SPIRIT BROADCASTING, INC.)
- WTAR (850 AM; 50 kW; NORFOLK, VA; Owner: SINCLAIR COMMUNICATIONS)
- WSMO (1120 AM; 20 kW; CAMP LEJEUNE, NC; Owner: CTC MEDIA GROUP, INC.)
- WCKO (1110 AM; daytime; 50 kW; NORFOLK, VA; Owner: WORD BROADCASTING NETWORK, INC.)
- WETC (540 AM; 8 kW; WENDELL-ZEBULON, NC; Owner: CAROLINA REGIONAL BROADCASTING CORPORATION)
- WDJS (1430 AM; 10 kW; MOUNT OLIVE, NC; Owner: MOUNT OLIVE BROADCASTING CO.)
Strongest FM radio stations in Greenville:
- WZMB (91.3 FM; GREENVILLE, NC; Owner: EAST CAROLINA UNIVERSITY STUDENT MEDIA BOARD)
- W201AO (88.1 FM; GREENVILLE, NC; Owner: CRAVEN COMMUNITY COLLEGE)
- WGPM (94.3 FM; FARMVILLE, NC; Owner: ABG NORTH CAROLINA, LLC)
- WERO (93.3 FM; WASHINGTON, NC; Owner: NM LICENSING, LLC)
- WNCT-FM (107.9 FM; GREENVILLE, NC; Owner: WNCT LICENSE LIMITED PARTNERSHIP)
- WTRG (100.7 FM; ROCKY MOUNT, NC; Owner: CAPSTAR TX LIMITED PARTNERSHIP)
- W287AH (105.3 FM; GREENVILLE, NC; Owner: BIBLE BROADCASTING NETWORK, INC.)
- WRNS-FM (95.1 FM; KINSTON, NC; Owner: NM LICENSING, LLC)
- WFXK (104.3 FM; TARBORO, NC; Owner: RADIO ONE LICENSES, LLC)
- WIKS (101.9 FM; NEW BERN, NC; Owner: WIKS LICENSE LIMITED PARTNERSHIP)
- WCBZ (103.7 FM; WILLIAMSTON, NC; Owner: ABG NORTH CAROLINA, LLC)
- WXNR (99.5 FM; GRIFTON, NC; Owner: WXNR LICENSE LIMITED PARTNERSHIP)
- WCZI (98.3 FM; WASHINGTON, NC; Owner: ABG NORTH CAROLINA, LLC)
- WRDU (106.1 FM; WILSON, NC; Owner: CAPSTAR TX LIMITED PARTNERSHIP)
- WAGO (88.7 FM; SNOW HILL, NC; Owner: PATHWAY CHRISTIAN ACADEMY, INC.)
- WRQM (90.9 FM; ROCKY MOUNT, NC; Owner: BOARD OF TRUSTEES UNIVERSITY OF NC AT CHAPEL HILL)
- WRSV (92.1 FM; ROCKY MOUNT, NC; Owner: NORTHSTAR BROADCATING CORPORATION)
- WSFL-FM (106.5 FM; NEW BERN, NC; Owner: WSFL LICENSE LIMITED PARTNERSHIP)
- W208AO (89.5 FM; BELL ARTHUR, NC; Owner: GRACE MISSIONARY BAPTIST CHURCH)
- WMGV (103.3 FM; NEWPORT, NC; Owner: WMGV LICENSE LIMITED PARTNERSHIP)
TV broadcast stations around Greenville:
- WITN-TV (Channel 7; WASHINGTON, NC; Owner: WITN LICENSEE CORP.)
- WNCT-TV (Channel 9; GREENVILLE, NC; Owner: MEDIA GENERAL COMMUNICATIONS, INC.)
- WUNK-TV (Channel 25; GREENVILLE, NC; Owner: UNIVERSITY OF NORTH CAROLINA)
- W60CV (Channel 60; GREENVILLE, NC; Owner: TRINITY BROADCASTING NETWORK)
- WYDO (Channel 14; GREENVILLE, NC; Owner: PIEDMONT TELEVISION OF EASTERN CAROLINA LICENSE LLC)
- WCTI-TV (Channel 12; NEW BERN, NC; Owner: EASTERN NORTH CAROLINA BROADCASTING CORPORATION)
- WUNM-TV (Channel 19; JACKSONVILLE, NC; Owner: UNIVERSITY OF NORTH CAROLINA)
- WEPX (Channel 38; GREENVILLE, NC; Owner: PAXSON GREENVILLE LICENSE, INC.)
- WRAY-TV (Channel 30; WILSON, NC; Owner: WRAY, INC.)
- WNCN (Channel 17; GOLDSBORO, NC; Owner: OUTLET BROADCASTING, INC.)
- WRPX (Channel 47; ROCKY MOUNT, NC; Owner: PAXSON RALEIGH LICENSE, INC.)
- WFTB-LP (Channel 55; WILLIAMSTON, ETC., NC; Owner: FREE TEMPLE MINISTRIES, INC.)
- W64AZ (Channel 64; KINSTON-GREENVILLE, NC; Owner: GOCOM TELEVISION, L.P.,)
- National Bridge Inventory (NBI) Statistics
- 133Number of bridges
- 1,509ft / 460mTotal length
- 1,230,171Total average daily traffic
- 132,230Total average daily truck traffic
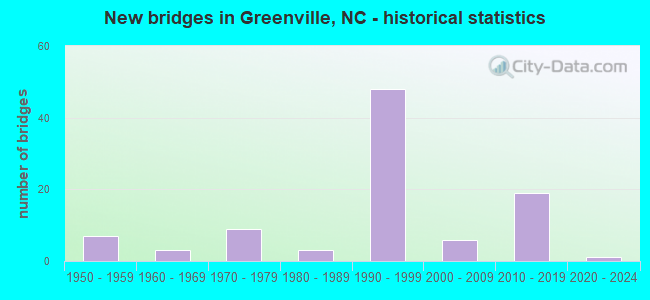
- New bridges - historical statistics
- 71950-1959
- 61960-1969
- 121970-1979
- 61980-1989
- 521990-1999
- 72000-2009
- 432010-2019
FCC Registered Antenna Towers: 631 (See the full list of FCC Registered Antenna Towers)
FCC Registered Commercial Land Mobile Towers: 1 (See the full list of FCC Registered Commercial Land Mobile Towers in Greenville, NC)
FCC Registered Private Land Mobile Towers: 2 (See the full list of FCC Registered Private Land Mobile Towers)
FCC Registered Broadcast Land Mobile Towers: 58 (See the full list of FCC Registered Broadcast Land Mobile Towers)
FCC Registered Microwave Towers: 49 (See the full list of FCC Registered Microwave Towers in this town)
FCC Registered Paging Towers: 10 (See the full list of FCC Registered Paging Towers)
FCC Registered Maritime Coast & Aviation Ground Towers: 20 (See the full list of FCC Registered Maritime Coast & Aviation Ground Towers)
FCC Registered Amateur Radio Licenses: 389 (See the full list of FCC Registered Amateur Radio Licenses in Greenville)
FAA Registered Aircraft Manufacturers and Dealers: 1 (See the full list of FAA Registered Manufacturers and Dealers in Greenville)
FAA Registered Aircraft: 84 (See the full list of FAA Registered Aircraft)
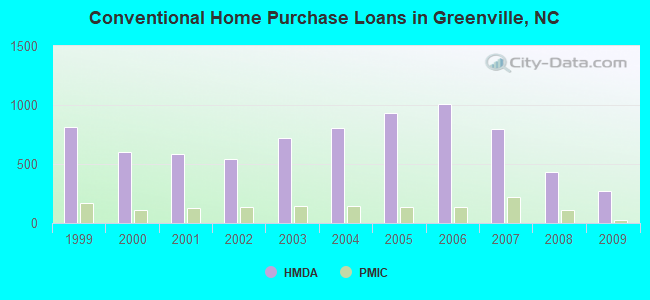
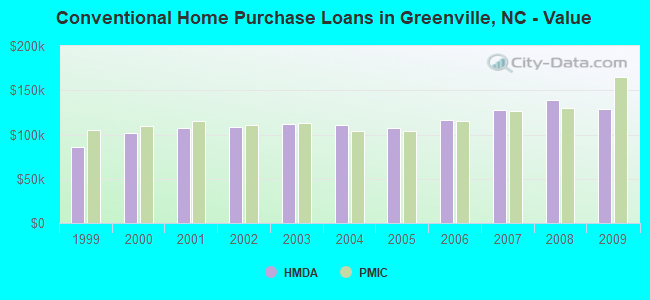
| Home Mortgage Disclosure Act Aggregated Statistics For Year 2009 (Based on 4 full and 8 partial tracts) | ||||||||||||||
| A) FHA, FSA/RHS & VA Home Purchase Loans | B) Conventional Home Purchase Loans | C) Refinancings | D) Home Improvement Loans | E) Loans on Dwellings For 5+ Families | F) Non-occupant Loans on < 5 Family Dwellings (A B C & D) | G) Loans On Manufactured Home Dwelling (A B C & D) | ||||||||
|---|---|---|---|---|---|---|---|---|---|---|---|---|---|---|
| Number | Average Value | Number | Average Value | Number | Average Value | Number | Average Value | Number | Average Value | Number | Average Value | Number | Average Value | |
| LOANS ORIGINATED | 152 | $121,788 | 269 | $128,961 | 650 | $172,401 | 18 | $89,866 | 11 | $1,270,865 | 127 | $110,888 | 0 | $0 |
| APPLICATIONS APPROVED, NOT ACCEPTED | 3 | $116,443 | 9 | $107,137 | 40 | $123,121 | 2 | $43,225 | 0 | $0 | 10 | $86,827 | 1 | $42,270 |
| APPLICATIONS DENIED | 26 | $118,096 | 39 | $98,511 | 153 | $151,047 | 18 | $39,792 | 2 | $476,000 | 37 | $132,796 | 4 | $54,052 |
| APPLICATIONS WITHDRAWN | 15 | $125,249 | 31 | $119,841 | 121 | $160,642 | 2 | $103,385 | 1 | $3,700,000 | 26 | $110,774 | 0 | $0 |
| FILES CLOSED FOR INCOMPLETENESS | 3 | $194,123 | 6 | $119,362 | 39 | $178,687 | 4 | $54,922 | 0 | $0 | 3 | $62,570 | 0 | $0 |
Detailed mortgage data for all 10 tracts in Greenville, NC
| Private Mortgage Insurance Companies Aggregated Statistics For Year 2009 (Based on 4 full and 7 partial tracts) | ||||||
| A) Conventional Home Purchase Loans | B) Refinancings | C) Non-occupant Loans on < 5 Family Dwellings (A & B) | ||||
|---|---|---|---|---|---|---|
| Number | Average Value | Number | Average Value | Number | Average Value | |
| LOANS ORIGINATED | 29 | $165,351 | 21 | $148,928 | 3 | $81,480 |
| APPLICATIONS APPROVED, NOT ACCEPTED | 9 | $172,856 | 6 | $163,948 | 1 | $184,860 |
| APPLICATIONS DENIED | 2 | $197,475 | 2 | $91,450 | 0 | $0 |
| APPLICATIONS WITHDRAWN | 2 | $200,335 | 2 | $233,230 | 0 | $0 |
| FILES CLOSED FOR INCOMPLETENESS | 1 | $83,400 | 1 | $120,460 | 1 | $83,400 |
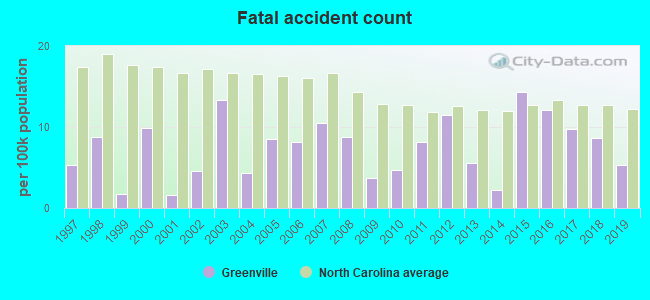
2002 - 2018 National Fire Incident Reporting System (NFIRS) incidents
- Fire incident types reported to NFIRS in Greenville, NC
- 2,68343.8%Structure Fires
- 2,14635.0%Outside Fires
- 1,01816.6%Mobile Property/Vehicle Fires
- 2834.6%Other
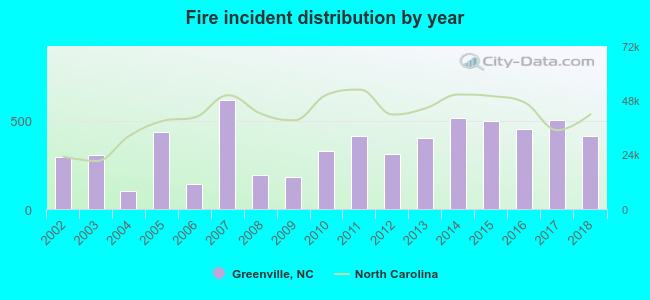 According to the data from the years 2002 - 2018 the average number of fires per year is 361. The highest number of fire incidents - 617 took place in 2007, and the least - 101 in 2004. The data has a growing trend.
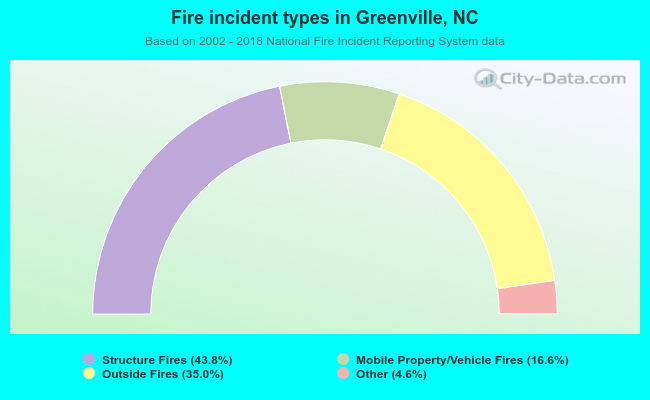 When looking into fire subcategories, the most reports belonged to: Structure Fires (43.8%), and Outside Fires (35.0%).
Fire-safe hotels and motels in Greenville, North Carolina:
- Quality Inn, 821 S Memorial Dr, Greenville, North Carolina 27834 , Phone: (252) 758-5544, Fax: (252) 758-1416
- Comfort Inn, 301 S E Greenville, Greenville, North Carolina 27858 , Phone: (252) 756-2792, Fax: (252) 321-0500
- Holiday Inn Express, 909 Moye Blvd, Greenville, North Carolina 27834 , Phone: (252) 754-8300, Fax: (252) 754-8301
- Holiday Inn, 203 W Greenville Blvd, Greenville, North Carolina 27834 , Phone: (252) 355-8300
- Baymont Inn & Suites, 3439 S Memorial Dr, Greenville, North Carolina 27834 , Phone: (252) 355-2521, Fax: (252) 355-0262
- Super 8 Motel, 1004 S Memorial Dr, Greenville, North Carolina 27834 , Phone: (252) 758-8888, Fax: (252) 758-0523
- Jameson Inn - Greenville, 920 Crosswinds St, Greenville, North Carolina 27834 , Phone: (252) 752-7382, Fax: (252) 752-8193
- Candlewood Suites, 1055 Waterford Commons Dr, Greenville, North Carolina 27834 , Phone: (252) 317-3000, Fax: (252) 317-3010
- 7 other hotels and motels
| Most common first names in Greenville, NC among deceased individuals | ||
| Name | Count | Lived (average) |
|---|---|---|
| James | 533 | 69.6 years |
| William | 476 | 69.9 years |
| Mary | 433 | 77.4 years |
| John | 342 | 71.2 years |
| Willie | 213 | 69.3 years |
| Annie | 210 | 79.4 years |
| Robert | 209 | 69.2 years |
| George | 141 | 71.8 years |
| Charles | 136 | 70.3 years |
| Joseph | 134 | 73.7 years |
| Most common last names in Greenville, NC among deceased individuals | ||
| Last name | Count | Lived (average) |
|---|---|---|
| Smith | 272 | 72.6 years |
| Williams | 258 | 71.7 years |
| Jones | 223 | 73.2 years |
| Moore | 212 | 72.4 years |
| Harris | 208 | 72.5 years |
| Mills | 147 | 74.1 years |
| Brown | 143 | 70.8 years |
| Evans | 116 | 75.1 years |
| Clark | 114 | 73.2 years |
| Edwards | 112 | 72.3 years |

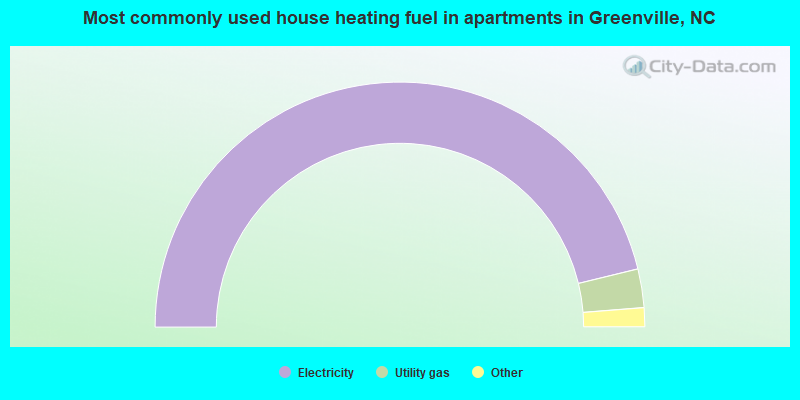
- 65.8%Electricity
- 31.1%Utility gas
- 1.5%Bottled, tank, or LP gas
- 1.1%No fuel used
- 0.2%Wood
- 0.1%Fuel oil, kerosene, etc.
- 92.4%Electricity
- 5.1%Utility gas
- 1.2%No fuel used
- 1.1%Bottled, tank, or LP gas
- 0.2%Fuel oil, kerosene, etc.
Greenville compared to North Carolina state average:
- Black race population percentage significantly above state average.
- Median age significantly below state average.
- Renting percentage above state average.
- Length of stay since moving in below state average.
- Number of college students significantly above state average.
- Percentage of population with a bachelor's degree or higher above state average.
Greenville on our top lists:
- #2 on the list of "Top 101 cities with largest percentage of males in industries: real estate and rental and leasing (population 50,000+)"
- #9 on the list of "Top 100 cities with the largest percentage of females (pop. 50,000+)"
- #19 on the list of "Top 101 cities with largest percentage of females in occupations: education, training, and library occupations (population 50,000+)"
- #19 on the list of "Top 101 cities with the largest household incomes disparities (population 50,000+)"
- #20 on the list of "Top 101 cities with largest percentage of females in occupations: food preparation and serving related occupations (population 50,000+)"
- #22 on the list of "Top 101 cities with largest percentage of females in occupations: extraction workers (population 50,000+)"
- #22 on the list of "Top 101 cities with largest percentage of females in occupations: fishing and hunting, and forest and logging workers (population 50,000+)"
- #23 on the list of "Top 101 cities with largest percentage of males in occupations: life, physical, and social science occupations (population 50,000+)"
- #23 on the list of "Top 101 cities with largest percentage of females in industries: wholesale electronic markets and agents and brokers (population 50,000+)"
- #23 on the list of "Top 101 cities with largest percentage of males in industries: wholesale electronic markets and agents and brokers (population 50,000+)"
- #23 on the list of "Top 101 cities with largest percentage of males in industries: broadcasting, internet publishing, and telecommunications services (population 50,000+)"
- #23 on the list of "Top 101 cities with largest percentage of females in industries: broadcasting, internet publishing, and telecommunications services (population 50,000+)"
- #25 on the list of "Top 100 cities with highest percentage of college students (pop. 50,000+)"
- #27 on the list of "Top 101 cities with largest percentage of males in occupations: food preparation and serving related occupations (population 50,000+)"
- #27 on the list of "Top 101 cities where the highest percentage of females (15+ years) which never married (with at least 10,000 females in this group)"
- #30 on the list of "Top 100 cities with youngest residents (pop. 50,000+)"
- #37 on the list of "Top 100 cities with shortest commuting times (pop. 50,000+)"
- #39 on the list of "Top 100 cities with highest percentage of renters (pop. 50,000+)"
- #40 on the list of "Top 101 cities with largest percentage of females in industries: accommodation and food services (population 50,000+)"
- #43 on the list of "Top 101 cities with largest percentage of females in industries: educational services (population 50,000+)"
- #35 on the list of "Top 101 counties with the smallest number of people without health insurance coverage in 2000 (pop. 50,000+)"
- #44 on the list of "Top 101 counties with the largest decrease in the number of deaths per 1000 residents 2000-2006 to 2007-2013 (pop. 50,000+)"

|
|
Total of 238 patent applications in 2008-2024.