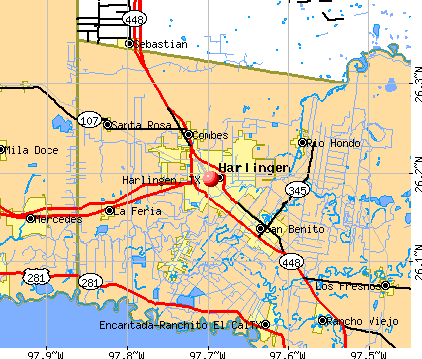
Harlingen, Texas

Harlingen: Iwo Jima monument on the grounds of Marine Military Academy
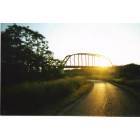
Harlingen: trestle over the hike/ bike trail along the Arroyo Colorado
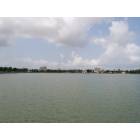
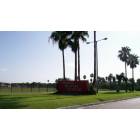
Harlingen: Lake Harlingen
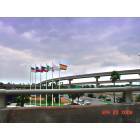
Harlingen: 77/83 Interchange
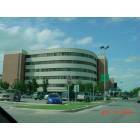
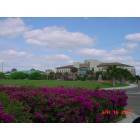
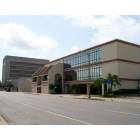
Harlingen: Medical Arts Pavilion
Harlingen: Regional Academic Health Center
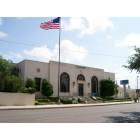
Harlingen: Marine Military Academy entrance
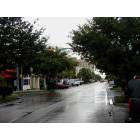
Harlingen: Downtown Harlingen
Harlingen: Capital One, downtown
Harlingen: downtown from the west
Harlingen: Bank of America, downtown
- see
20
more - add
your


Submit your own pictures of this city and show them to the world
- OSM Map
- General Map
- Google Map
- MSN Map
Population change since 2000: +24.5%
 |
| Males: 35,518 | |
| Females: 36,160 |
| Median resident age: | 39.5 years |
| Texas median age: | 35.6 years |
Zip codes: 78550.
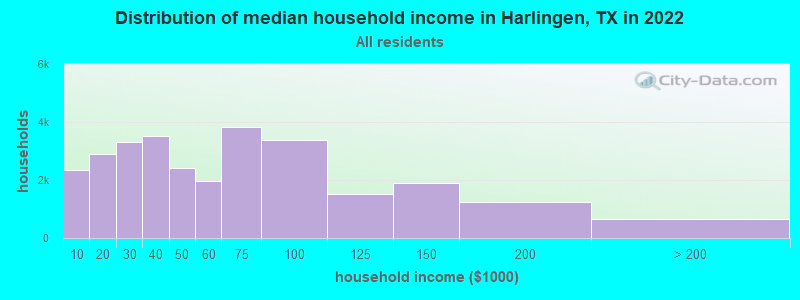
| Harlingen: | $50,166 |
| TX: | $72,284 |
Estimated per capita income in 2022: $26,136 (it was $13,886 in 2000)
Harlingen city income, earnings, and wages data
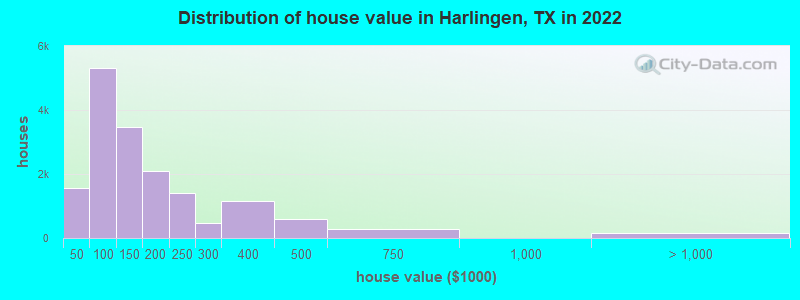
Estimated median house or condo value in 2022: $123,400 (it was $54,600 in 2000)
| Harlingen: | $123,400 |
| TX: | $275,400 |
Mean prices in 2022: all housing units: $183,374; detached houses: $195,613; townhouses or other attached units: $203,748; in 2-unit structures: $127,793; in 3-to-4-unit structures: $170,933; in 5-or-more-unit structures: $77,969; mobile homes: $96,978; occupied boats, rvs, vans, etc.: $35,320
Median gross rent in 2022: $868.
(9.5% for White Non-Hispanic residents, 46.3% for Black residents, 23.3% for Hispanic or Latino residents, 23.4% for American Indian residents, 28.2% for other race residents, 15.0% for two or more races residents)
Detailed information about poverty and poor residents in Harlingen, TX


Compare current foreclosures in Harlingen, TX:
| Photo | Address | Area | Beds / Baths | Price | Details |
|---|---|---|---|---|---|

|
#1
E Hurst St
Harlingen, TX 78550
|
924 sq. feet
|
1 baths 2 beds |
show details | |

|
#2
E Leggett Rd
Harlingen, TX 78550
|
1,747 sq. feet
|
3 baths 4 beds |
show details | |

|
#3
N Rose St
Harlingen, TX 78550
|
1,730 sq. feet
|
2 baths 3 beds |
show details | |

|
#4
Scarlett Cir
Harlingen, TX 78552
|
3,326 sq. feet
|
4 baths 4 beds |
show details | |

|
#5
Sun Crest Dr
Harlingen, TX 78552
|
1,835 sq. feet
|
2 baths 3 beds |
show details | |

|
#6
N 27th St
Harlingen, TX 78550
|
1,203 sq. feet
|
2 baths 3 beds |
show details | |

|
#7
Vista Verde Cir W
Harlingen, TX 78552
|
1,197 sq. feet
|
2 baths 3 beds |
show details | |

|
#8
Lazy Palm Dr S
Harlingen, TX 78552
|
1,072 sq. feet
|
2 baths 3 beds |
show details | |

|
#9
Lazy Lake Dr
Harlingen, TX 78550
|
3,254 sq. feet
|
2 baths 3 beds |
show details | |

|
#10
Fm 508
Harlingen, TX 78550
|
1,844 sq. feet
|
2 baths 4 beds |
show details |
| Photo | Address | Area | Beds / Baths | Price | Details |
|---|---|---|---|---|---|

|
#11
E Pierce Ave
Harlingen, TX 78550
|
900 sq. feet
|
1 baths 3 beds |
show details | |

|
#12
E Madison Ave
Harlingen, TX 78550
|
1,656 sq. feet
|
2 baths 3 beds |
show details | |

|
#13
Beckham Rd
Harlingen, TX 78552
|
2,661 sq. feet
|
2 baths 3 beds |
show details | |

|
#14
Sun Dr
Harlingen, TX 78552
|
1,196 sq. feet
|
2 baths 3 beds |
show details | |

|
#15
N Rose St
Harlingen, TX 78550
|
1,680 sq. feet
|
2 baths - beds |
show details | |

|
#16
N A St
Harlingen, TX 78550
|
1,160 sq. feet
|
1 baths - beds |
show details | |

|
#17
Hitching Post Blvd
Harlingen, TX 78552
|
2,530 sq. feet
|
- baths 4 beds |
show details | |

|
#18
Palm Valley Dr E
Harlingen, TX 78552
|
2,554 sq. feet
|
- baths 4 beds |
show details | |

|
#19
Scenic Ln
Harlingen, TX 78552
|
1,308 sq. feet
|
- baths 4 beds |
show details | |

|
#20
Bass Blvd
Harlingen, TX 78552
|
3,719 sq. feet
|
- baths 5 beds |
show details |
| Photo | Address | Area | Beds / Baths | Price | Details |
|---|---|---|---|---|---|

|
#21
Wild Olive
Harlingen, TX 78552
|
2,577 sq. feet
|
- baths 3 beds |
show details | |

|
#22
N 1st St
Harlingen, TX 78550
|
1,622 sq. feet
|
- baths - beds |
show details | |

|
#23
Rio Grande Cir
Harlingen, TX 78552
|
1,798 sq. feet
|
- baths - beds |
show details | |

|
#24
Thieme Rd
Harlingen, TX 78552
|
1,300 sq. feet
|
- baths - beds |
show details | |

|
#25
Bowie Ave
Harlingen, TX 78552
|
- sq. feet
|
- baths - beds |
show details | |

|
#26
E Monroe Ave
Harlingen, TX 78550
|
928 sq. feet
|
- baths - beds |
show details | |

|
#27
S Dakota St
Harlingen, TX 78552
|
896 sq. feet
|
- baths - beds |
show details | |

|
#28
W Lincoln Ave
Harlingen, TX 78550
|
1,271 sq. feet
|
- baths - beds |
show details | |

|
#29
Tamm Ln
Harlingen, TX 78552
|
- sq. feet
|
- baths - beds |
show details | |

|
#30
Vista Verde Cir W
Harlingen, TX 78552
|
- sq. feet
|
- baths - beds |
show details |
| Photo | Address | Area | Beds / Baths | Price | Details |
|---|---|---|---|---|---|

|
#31
E Washington Ave
Harlingen, TX 78550
|
1,448 sq. feet
|
- baths - beds |
show details | |

|
#32
N T St
Harlingen, TX 78550
|
1,039 sq. feet
|
- baths - beds |
show details | |

|
#33
N 7th St # 475
Harlingen, TX 78550
|
- sq. feet
|
- baths - beds |
show details | |

|
#34
E Jackson St
Harlingen, TX 78550
|
1,440 sq. feet
|
- baths - beds |
show details | |

|
#35
S Dakota St
Harlingen, TX 78552
|
1,084 sq. feet
|
- baths - beds |
show details | |

|
#36
Fairway
Harlingen, TX 78552
|
- sq. feet
|
- baths - beds |
show details | |

|
#37
Gonzalez Rd
Harlingen, TX 78550
|
550 sq. feet
|
- baths - beds |
show details | |

|
#38
W Grant Ave
Harlingen, TX 78550
|
- sq. feet
|
- baths - beds |
show details | |

|
#39
Cook Ln
Harlingen, TX 78552
|
4,743 sq. feet
|
- baths - beds |
show details | |

|
#40
Calle Condesa
Harlingen, TX 78552
|
- sq. feet
|
- baths - beds |
show details |
| Photo | Address | Area | Beds / Baths | Price | Details |
|---|---|---|---|---|---|

|
#41
Bass Blvd
Harlingen, TX 78552
|
2,673 sq. feet
|
- baths - beds |
show details | |

|
#42
S Palm Court Dr
Harlingen, TX 78552
|
2,056 sq. feet
|
- baths - beds |
show details | |

|
#43
Haine Dr Apt 2605
Harlingen, TX 78550
|
- sq. feet
|
- baths - beds |
show details | |

|
#44
Venado
Harlingen, TX 78552
|
- sq. feet
|
- baths - beds |
show details | |

|
#45
W Linda St
Harlingen, TX 78550
|
- sq. feet
|
- baths - beds |
show details | |

|
#46
Jordan St
Harlingen, TX 78552
|
- sq. feet
|
- baths - beds |
show details | |

|
#47
N 77 Sunshine Strip, Pmb 146
Harlingen, TX 78550
|
- sq. feet
|
- baths - beds |
show details | |

|
#48
Fountain View Ct
Harlingen, TX 78550
|
- sq. feet
|
- baths - beds |
show details | |

|
#49
E Austin Ave
Harlingen, TX 78550
|
2,758 sq. feet
|
- baths - beds |
show details | |

|
Check over 1 million property listings on Foreclosure.com!
|
browse all offers | |||


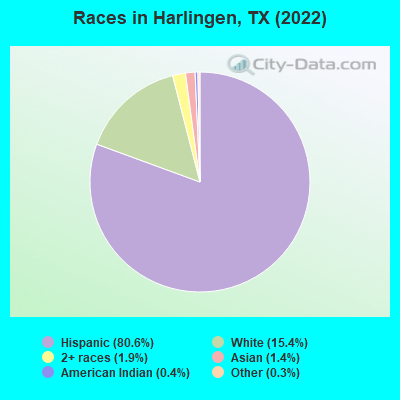
- 57,76880.6%Hispanic
- 11,02615.4%White alone
- 1,3321.9%Two or more races
- 1,0231.4%Asian alone
- 2740.4%American Indian alone
- 1830.3%Other race alone
- 630.09%Black alone
Races in Harlingen detailed stats: ancestries, foreign born residents, place of birth
According to our research of Texas and other state lists, there were 250 registered sex offenders living in Harlingen, Texas as of April 25, 2024.
The ratio of all residents to sex offenders in Harlingen is 265 to 1.
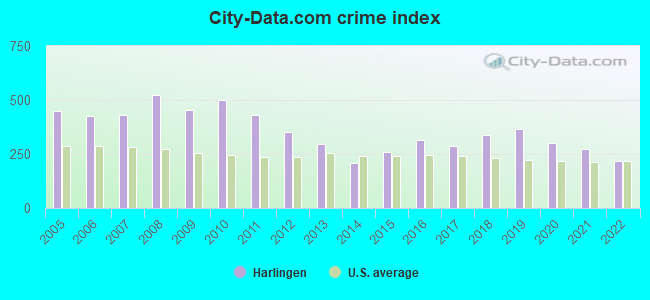
The City-Data.com crime index weighs serious crimes and violent crimes more heavily. Higher means more crime, U.S. average is 246.1. It adjusts for the number of visitors and daily workers commuting into cities.
- means the value is smaller than the state average.- means the value is about the same as the state average.
- means the value is bigger than the state average.
- means the value is much bigger than the state average.
Crime rate in Harlingen detailed stats: murders, rapes, robberies, assaults, burglaries, thefts, arson
Full-time law enforcement employees in 2021, including police officers: 180 (134 officers - 121 male; 13 female).
| Officers per 1,000 residents here: | 2.06 |
| Texas average: | 2.07 |
 Recent articles from our blog. Our writers, many of them Ph.D. graduates or candidates, create easy-to-read articles on a wide variety of topics.


Latest news from Harlingen, TX collected exclusively by city-data.com from local newspapers, TV, and radio stations
Ancestries: American (3.1%), English (2.6%), German (1.3%).
Current Local Time: CST time zone
Elevation: 45 feet
Land area: 34.1 square miles.
Population density: 2,104 people per square mile (low).
10,400 residents are foreign born (12.5% Latin America).
| This city: | 14.4% |
| Texas: | 17.1% |
Median real estate property taxes paid for housing units with mortgages in 2022: $3,220 (2.0%)
Median real estate property taxes paid for housing units with no mortgage in 2022: $1,508 (1.6%)
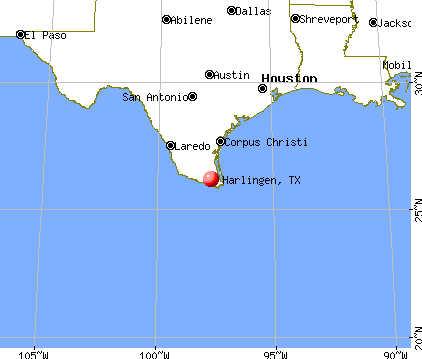
Nearest city with pop. 200,000+: Corpus Christi, TX  (108.8 miles , pop. 277,454).
Nearest city with pop. 1,000,000+: San Antonio, TX (230.9 miles , pop. 1,144,646).
Nearest cities:
), ), ), ), ), )Latitude: 26.19 N, Longitude: 97.70 W
Daytime population change due to commuting: +16,111 (+22.5%)
Workers who live and work in this city: 18,773 (65.8%)
Area code: 956
Property values in Harlingen, TX
Harlingen, Texas accommodation & food services, waste management - Economy and Business Data
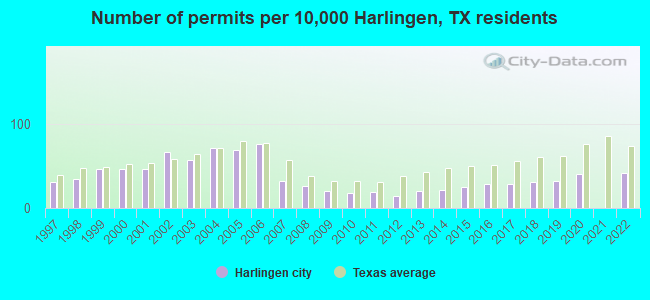
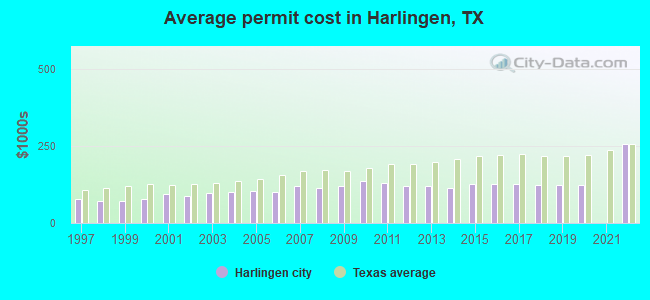
Single-family new house construction building permits:
- 2022: 238 buildings, average cost: $256,200
- 2020: 236 buildings, average cost: $124,700
- 2019: 187 buildings, average cost: $124,700
- 2018: 179 buildings, average cost: $124,000
- 2017: 164 buildings, average cost: $128,300
- 2016: 164 buildings, average cost: $128,300
- 2015: 142 buildings, average cost: $127,100
- 2014: 123 buildings, average cost: $113,100
- 2013: 117 buildings, average cost: $120,200
- 2012: 84 buildings, average cost: $121,300
- 2011: 107 buildings, average cost: $131,100
- 2010: 106 buildings, average cost: $136,100
- 2009: 115 buildings, average cost: $120,100
- 2008: 151 buildings, average cost: $112,800
- 2007: 188 buildings, average cost: $118,800
- 2006: 440 buildings, average cost: $102,000
- 2005: 399 buildings, average cost: $102,500
- 2004: 412 buildings, average cost: $102,000
- 2003: 332 buildings, average cost: $97,200
- 2002: 384 buildings, average cost: $88,400
- 2001: 268 buildings, average cost: $92,900
- 2000: 269 buildings, average cost: $76,900
- 1999: 265 buildings, average cost: $71,600
- 1998: 201 buildings, average cost: $71,100
- 1997: 181 buildings, average cost: $77,700
| Here: | 4.4% |
| Texas: | 3.5% |

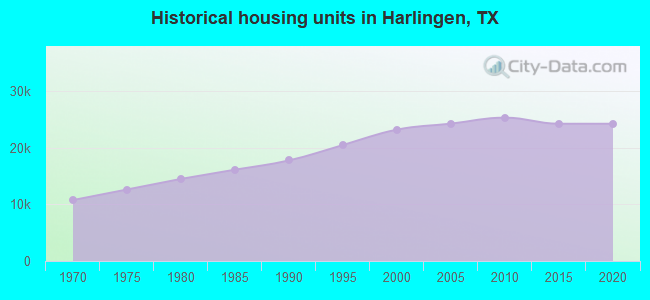
Population change in the 1990s: +9,459 (+19.7%).
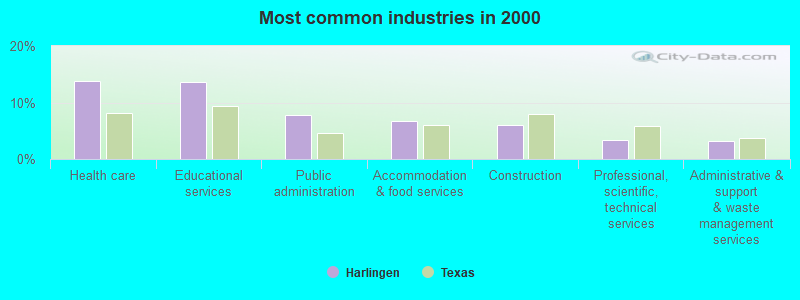
- Health care (13.8%)
- Educational services (13.7%)
- Public administration (7.9%)
- Accommodation & food services (6.7%)
- Construction (6.1%)
- Professional, scientific, technical services (3.4%)
- Administrative & support & waste management services (3.3%)
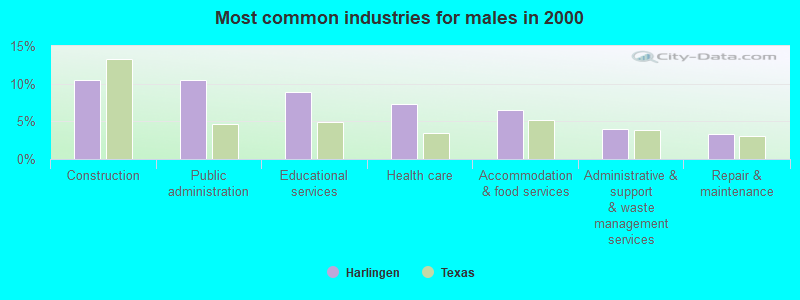
- Construction (10.5%)
- Public administration (10.4%)
- Educational services (8.9%)
- Health care (7.2%)
- Accommodation & food services (6.6%)
- Administrative & support & waste management services (4.0%)
- Repair & maintenance (3.4%)
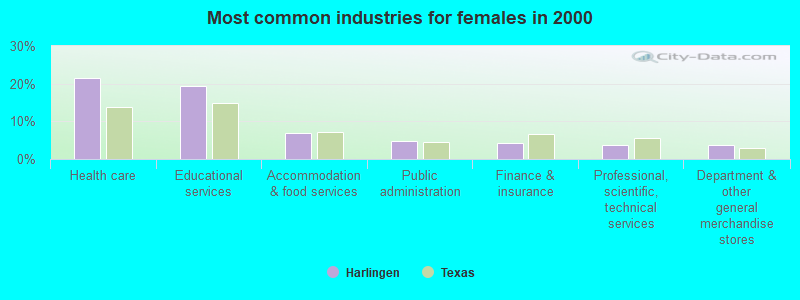
- Health care (21.6%)
- Educational services (19.3%)
- Accommodation & food services (6.9%)
- Public administration (4.8%)
- Finance & insurance (4.3%)
- Professional, scientific, technical services (3.6%)
- Department & other general merchandise stores (3.6%)
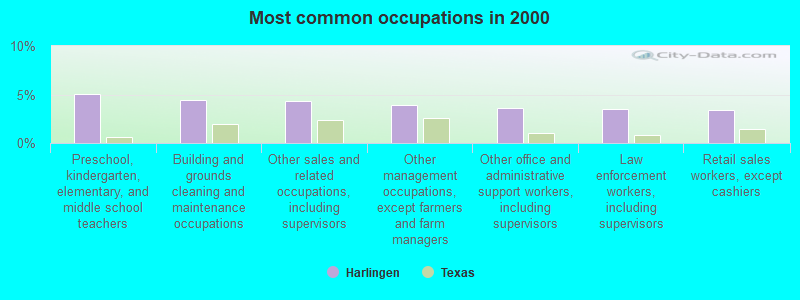
- Preschool, kindergarten, elementary, and middle school teachers (5.1%)
- Building and grounds cleaning and maintenance occupations (4.5%)
- Other sales and related occupations, including supervisors (4.4%)
- Other management occupations, except farmers and farm managers (3.9%)
- Other office and administrative support workers, including supervisors (3.6%)
- Law enforcement workers, including supervisors (3.5%)
- Retail sales workers, except cashiers (3.4%)
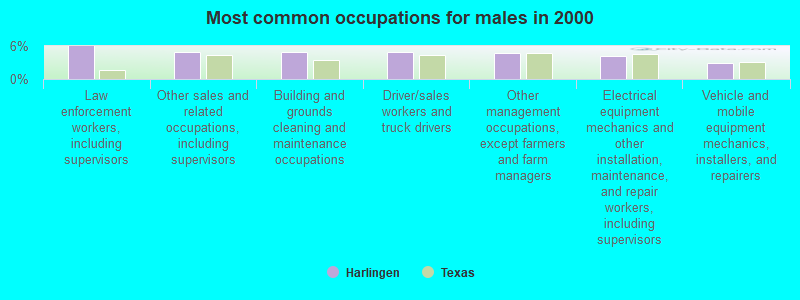
- Law enforcement workers, including supervisors (6.0%)
- Other sales and related occupations, including supervisors (5.0%)
- Building and grounds cleaning and maintenance occupations (4.9%)
- Driver/sales workers and truck drivers (4.9%)
- Other management occupations, except farmers and farm managers (4.7%)
- Electrical equipment mechanics and other installation, maintenance, and repair workers, including supervisors (4.1%)
- Vehicle and mobile equipment mechanics, installers, and repairers (3.0%)
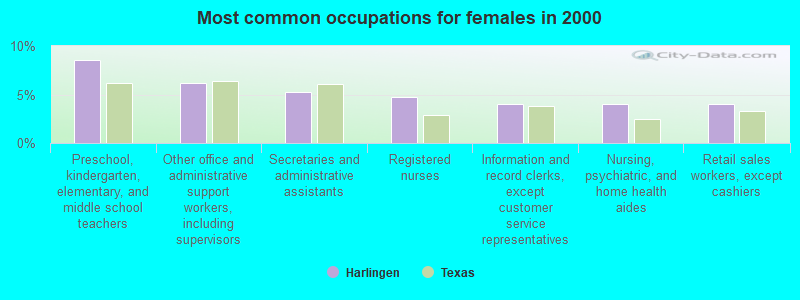
- Preschool, kindergarten, elementary, and middle school teachers (8.5%)
- Other office and administrative support workers, including supervisors (6.2%)
- Secretaries and administrative assistants (5.3%)
- Registered nurses (4.7%)
- Information and record clerks, except customer service representatives (4.1%)
- Nursing, psychiatric, and home health aides (4.0%)
- Retail sales workers, except cashiers (4.0%)
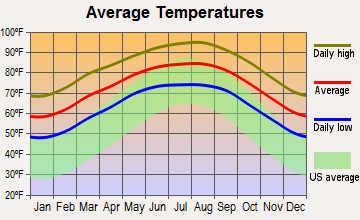
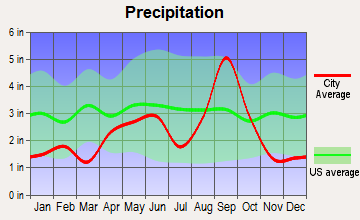
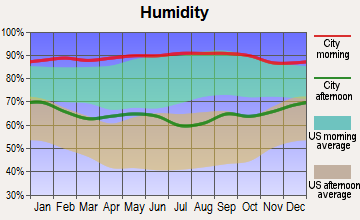
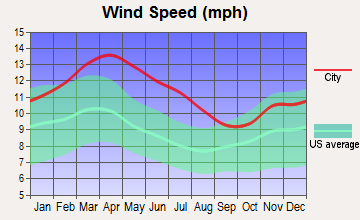
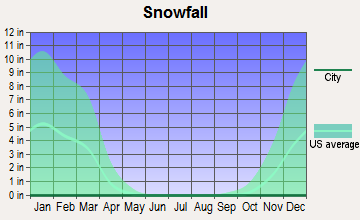
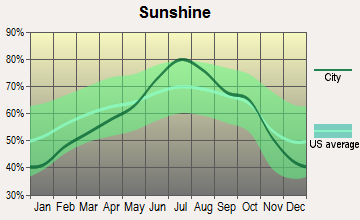
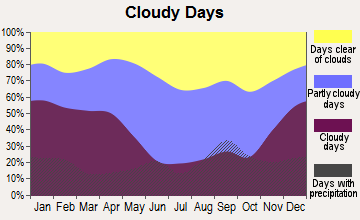
Average climate in Harlingen, Texas
Based on data reported by over 4,000 weather stations
|
|

(lower is better)
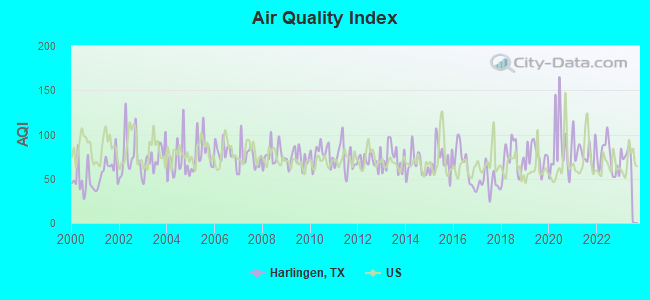
Air Quality Index (AQI) level in 2022 was 72.7. This is about average.
| City: | 72.7 |
| U.S.: | 72.6 |
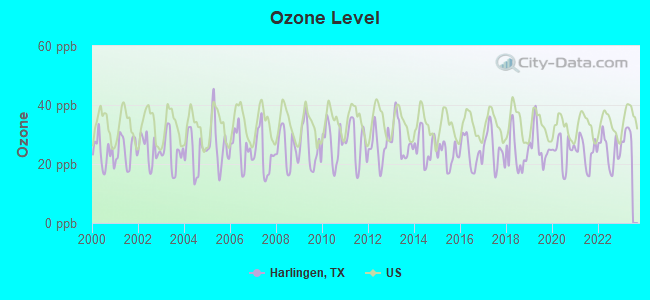
Ozone [ppb] level in 2022 was 24.4. This is better than average. Closest monitor was 1.2 miles away from the city center.
| City: | 24.4 |
| U.S.: | 33.3 |
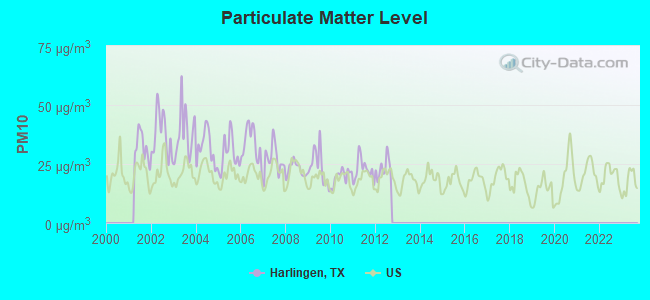
Particulate Matter (PM10) [µg/m3] level in 2012 was 23.1. This is worse than average. Closest monitor was 23.1 miles away from the city center.
| City: | 23.1 |
| U.S.: | 19.2 |
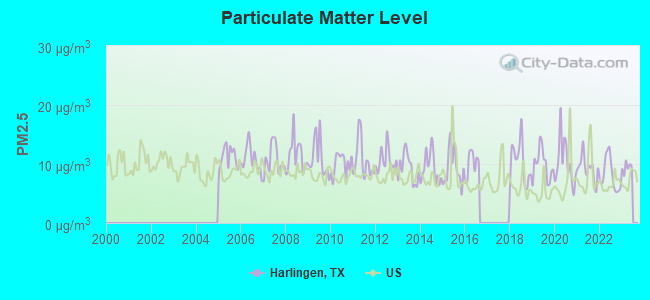
Particulate Matter (PM2.5) [µg/m3] level in 2022 was 8.14. This is about average. Closest monitor was 5.7 miles away from the city center.
| City: | 8.14 |
| U.S.: | 8.11 |
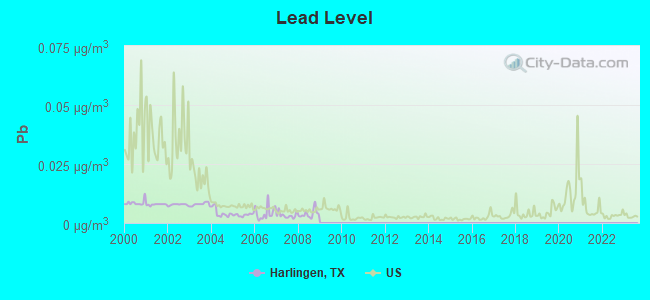
Lead (Pb) [µg/m3] level in 2008 was 0.00388. This is significantly better than average. Closest monitor was 1.1 miles away from the city center.
| City: | 0.00388 |
| U.S.: | 0.00931 |
Tornado activity:
Harlingen-area historical tornado activity is significantly below Texas state average. It is 77% smaller than the overall U.S. average.
On 5/12/1969, a category F3 (max. wind speeds 158-206 mph) tornado 2.2 miles away from the Harlingen city center caused between $5000 and $50,000 in damages.
On 5/12/1969, a category F3 tornado 8.7 miles away from the city center caused between $5000 and $50,000 in damages.
Earthquake activity:
Harlingen-area historical earthquake activity is below Texas state average. It is 82% smaller than the overall U.S. average.On 10/20/2011 at 12:24:41, a magnitude 4.8 (4.8 MW, Depth: 3.1 mi, Class: Light, Intensity: IV - V) earthquake occurred 186.4 miles away from Harlingen center
On 11/13/2017 at 11:23:01, a magnitude 3.9 (3.9 MD, Depth: 3.1 mi, Class: Light, Intensity: II - III) earthquake occurred 80.7 miles away from the city center
On 4/9/1993 at 12:29:19, a magnitude 4.3 (4.1 MB, 4.3 LG, Depth: 3.1 mi) earthquake occurred 183.0 miles away from the city center
On 4/25/2010 at 02:10:42, a magnitude 3.9 (3.9 MB, Depth: 3.1 mi) earthquake occurred 105.2 miles away from the city center
On 3/24/1997 at 22:31:34, a magnitude 3.8 (3.8 LG, Depth: 3.1 mi) earthquake occurred 107.7 miles away from the city center
On 4/14/1995 at 00:32:56, a magnitude 5.7 (5.6 MB, 5.7 MS, 5.7 MW, Depth: 11.1 mi, Class: Moderate, Intensity: VI - VII) earthquake occurred 446.3 miles away from the city center
Magnitude types: regional Lg-wave magnitude (LG), body-wave magnitude (MB), duration magnitude (MD), surface-wave magnitude (MS), moment magnitude (MW)
Natural disasters:
The number of natural disasters in Cameron County (23) is greater than the US average (15).Major Disasters (Presidential) Declared: 12
Emergencies Declared: 8
Causes of natural disasters: Hurricanes: 12, Floods: 7, Storms: 6, Tornadoes: 3, Winds: 2, Fire: 1, Heavy Rain: 1, Tropical Storm: 1, Other: 2 (Note: some incidents may be assigned to more than one category).

Hospitals in Harlingen:
- ADRIAN COMMUNITY HOME (2214 ADRIAN ST)
- DOMINION COMMUNITY HOME (133 W DOMINION)
- EAST WASHINGTON COMMUNITY HOME (1907 E WASHINGTON AVE)
- HARLINGEN MEDICAL CENTER (Proprietary, provides emergency services, 5501 SOUTH EXPRESSWAY 77)
- RIO GRANDE STATE CENTER (1401 S RANGERVILLE RD)
- RIO GRANDE STATE CENTER (1401 RANGERVILLE ROAD)
- SANDI JO FUNK HOSPICE PROGRAM (4405 GLASSCOCK STREET)
- SOLARA HOSPITAL HARLINGEN (508 VICTORIA LANE)
- SOUTH TEXAS HOSPITAL (1301 RANGERVILLE ROAD)
- SUNGLO NEW DAWN HOSPICE (1122 MORGAN BLVD)
- VHS HARLINGEN HOSPITAL COMPANY LLC (Proprietary, 2101 PEASE ST)
Airports and heliports located in Harlingen:
- Valley International Airport (HRL) (Runways: 3, Commercial Ops: 6,655, Air Taxi Ops: 3,472, Itinerant Ops: 2,534, Local Ops: 6,704, Military Ops: 17,258)
- Shofner Farms Airport (2TS2) (Runways: 1)
- South Texas Emergency Care Foundation Inc Heliport (78TS)
- Valley Baptist Medical Center (Vbmc) Heliport (TS68)
- Valley Baptist Medical Center Heliport (49TX)
Colleges/Universities in Harlingen:
- Texas State Technical College-Harlingen (Full-time enrollment: 3,700; Location: 1902 North Loop 499; Public; Website: www.harlingen.tstc.edu)
- Southern Careers Institute-Harlingen (Full-time enrollment: 432; Location: 603 Ed Carey Dr; Private, for-profit; Website: www.scitexas.edu)
- University of Cosmetology Arts & Sciences-Harlingen (Full-time enrollment: 128; Location: 913 N 13th St; Private, for-profit; Website: www.ucastx.com)
Other colleges/universities with over 2000 students near Harlingen:
- The University of Texas at Brownsville (about 25 miles; Brownsville, TX; Full-time enrollment: 9,165)
- The University of Texas-Pan American (about 31 miles; Edinburg, TX; FT enrollment: 16,766)
- South Texas College (about 35 miles; McAllen, TX; FT enrollment: 19,701)
- Texas A & M University-Kingsville (about 93 miles; Kingsville, TX; FT enrollment: 9,295)
- Texas A & M University-Corpus Christi (about 108 miles; Corpus Christi, TX; FT enrollment: 9,092)
- Del Mar College (about 111 miles; Corpus Christi, TX; FT enrollment: 5,213)
- Texas A & M International University (about 144 miles; Laredo, TX; FT enrollment: 5,203)
Public high schools in Harlingen:
- HARLINGEN H S (Students: 2,493, Location: 1201 E MARSHALL AVE, Grades: 9-12)
- HARLINGEN H S - SOUTH (Students: 2,041, Location: 1701 DIXIELAND RD, Grades: 9-12)
- EARLY COLLEGE H S (Students: 253, Location: 2510 PECAN BLDG R, Grades: 9-12)
- KEYS ACAD (Students: 144, Location: 2809 N 7TH ST, Grades: PK-12)
- SECONDARY ALTER CTR (Students: 47, Location: 1310 SAM HOUSTON, Grades: 6-12)
- EDNA TAMAYO HOUSE (Students: 15, Location: 1438 N 7TH, Grades: 8-10)
- CAMERON CO J J A E P (Location: 1409 E HARRISON ST, Grades: 7-12)
- DR ABRAHAM P CANO FRESHMAN ACADEMY (Location: 1701 LOZANO, Grades: 9)
- HARLINGEN SCHOOL OF HEALTH PROFESSIONS (Location: 2302 N 21ST ST, Grades: 8-9)
Private high schools in Harlingen:
Biggest public elementary/middle schools in Harlingen:
- COAKLEY MIDDLE (Students: 833, Location: 1402 S 6TH ST, Grades: 6-8)
- TREASURE HILLS EL (Students: 819, Location: 2525 HAINE DR, Grades: PK-5)
- MOISES VELA MIDDLE (Students: 779, Location: 801 S PALM BLVD, Grades: 6-8)
- DR HESIQUIO RODRIGUEZ EL (Students: 774, Location: 8402 W WILSON RD, Grades: PK-5)
- VERNON MIDDLE (Students: 751, Location: 125 S 13TH ST, Grades: 6-8)
- MEMORIAL MIDDLE (Students: 747, Location: 310 N 13TH ST, Grades: 6-8)
- LONG EL (Students: 728, Location: 2601 N 7TH, Grades: PK-5)
- GUTIERREZ MIDDLE (Students: 723, Location: 3205 W WILSON RD, Grades: 6-8)
- STUART PLACE EL (Students: 720, Location: 6701 BUSINESS HWY 83, Grades: PK-5)
- LEE H MEANS EL (Students: 550, Location: 1204 E LOOP 499, Grades: PK-5)
Private elementary/middle schools in Harlingen:
- CALVARY CHRISTIAN SCHOOL (Students: 343, Location: 1815 N 7TH ST, Grades: PK-8)
- ST ALBANS EPISCOPAL DAY SCHOOL (Students: 297, Location: 1417 E AUSTIN AVE, Grades: UG-6)
- ST ANTHONY CATHOLIC SCHOOL (Students: 220, Location: 1015 E HARRISON AVE, Grades: PK-8)
- MONTESSORI ACADEMY (Students: 34, Location: 3943 BOURBON ST, Grades: PK-5)
- HARLINGEN ADVENTIST ELEMENTARY SCHOOL (Students: 15, Location: 20811 MONTEZUMA AVE, Grades: 2-8)
User-submitted facts and corrections:
- New Hospital- Harlingen Medical Center added by Chris
- Please add to your church map listings: Covenant Presbyterian Church in America 2701 N. 7th St. Harlingen, Texas 78550 Thank you!
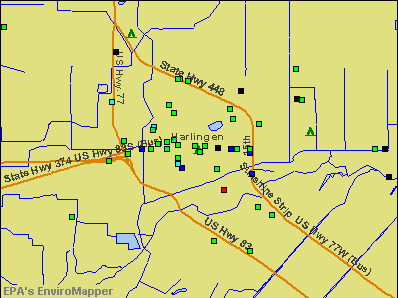
Points of interest:
Notable locations in Harlingen: Harlingen Municipal Golf Course (A), Harlingen Fire Department Station 8 (B), Harlingen Fire Department Station 1 (C), Harlingen Fire Department Station 3 (D), Harlingen Fire Department Station 4 (E), Harlingen Fire Department Station 6 (F), Harlingen Fire Department Station 7 (G), Harlingen Police Department (H), Cameron County Sheriff's Office (I), Texas Highway Patrol (J), Rio Grande Valley Museum (K), Harlingen Fire Department Station 5 (L), South Texas Emergency Care Foundation (M). Display/hide their locations on the map
Churches in Harlingen include: First Presbyterian Church (A), The Church of Jesus Christ of Latter Day Saints - Harlingen (B), El Buen Samaritano Methodist Church (C), Lutheran Church Our Redeemer (D), Parkwood Evangelical Free Church (E), First Church of the Nazarene (F), First Church of God (G), Church of Christ Pendleton Park (H), Church of Christ North 7th Street (I). Display/hide their locations on the map
Lakes and reservoirs: Lake Harlingen (A), City of Harlingen Reservoir (B). Display/hide their locations on the map
Creek: Little Creek (A). Display/hide its location on the map
Parks in Harlingen include: Liberty Gardens Park (1), Windsor Park (2), Sam Houston Park (3), Ramsey Park (4), Travis Park (5), Mc Cullough Park (6), Wood Park (7), Victor Park (8), Diaz Park (9). Display/hide their locations on the map
Hotels: Best Western Casa Villa Suites (4317 South Expressway 83) (1), Comfort Inn (406 North Expressway 77) (2), Comfort Inn Harlingen (406 North Expressway 77) (3). Display/hide their approximate locations on the map
Birthplace of: Jim Leavitt - Football player, Beth Nielsen Chapman - Country guitarist, Bobby Joe Morrow - (born 1935), athlete, Dylan Gandy - 2005 NFL player (Indianapolis Colts, born: Mar 8, 1982), Nick Stahl - Child actor, Randy Williams - 2005 Major League Baseball player (Colorado Rockies, born: Sep 18, 1975), Mark Farris - Football player, Rachel McLish - Bodybuilder, Danielle Doty - Beauty pageant winner, Ryan Buck - College basketball player (Tx Pan American Broncos).
Drinking water stations with addresses in Harlingen and their reported violations in the past:
VALLEY BAPTIST MEDICAL CENTER (Population served: 602, Purch surface water):Past monitoring violations:
- 4 routine major monitoring violations
| This city: | 3.0 people |
| Texas: | 2.8 people |
| This city: | 74.7% |
| Whole state: | 69.9% |
| This city: | 6.2% |
| Whole state: | 6.0% |
Likely homosexual households (counted as self-reported same-sex unmarried-partner households)
- Lesbian couples: 0.3% of all households
- Gay men: 0.2% of all households
People in group quarters in Harlingen in 2010:
- 415 people in nursing facilities/skilled-nursing facilities
- 282 people in college/university student housing
- 123 people in residential treatment centers for adults
- 113 people in other noninstitutional facilities
- 61 people in workers' group living quarters and job corps centers
- 31 people in group homes for juveniles (non-correctional)
- 21 people in group homes intended for adults
- 13 people in emergency and transitional shelters (with sleeping facilities) for people experiencing homelessness
- 11 people in correctional facilities intended for juveniles
People in group quarters in Harlingen in 2000:
- 732 people in nursing homes
- 341 people in unknown juvenile institutions
- 203 people in college dormitories (includes college quarters off campus)
- 114 people in homes for the mentally retarded
- 91 people in schools, hospitals, or wards for the intellectually disabled
- 85 people in other noninstitutional group quarters
- 10 people in hospitals/wards and hospices for chronically ill
- 10 people in other hospitals or wards for chronically ill
- 9 people in religious group quarters
- 5 people in homes for the mentally ill
Banks with most branches in Harlingen (2011 data):
- Compass Bank: Palm Valley Branch, Harlingen Medical Center Branch, Harlingen Main Branch, Harlingen Central Branch, Harlingen West Branch. Info updated 2011/02/24: Bank assets: $63,107.0 mil, Deposits: $46,232.4 mil, headquarters in Birmingham, AL, negative income in the last year, Commercial Lending Specialization, 720 total offices, Holding Company: Banco Bilbao Vizcaya Argentaria, S.A.
- Capital One, National Association: Van Buren Branch, Harlingen-Van Buren Du Branch, Dixieland Road Branch, Harlingen Branch. Info updated 2011/07/01: Bank assets: $133,477.8 mil, Deposits: $97,063.7 mil, headquarters in Mclean, VA, positive income, 984 total offices, Holding Company: Capital One Financial Corporation
- First Community Bank, National Association: Harlingen Banking Center Branch, Stuart Place Road Branch, Valley Baptist Medical Banking Cente. Info updated 2006/11/03: Bank assets: $206.0 mil, Deposits: $185.8 mil, headquarters in San Benito, TX, positive income, Commercial Lending Specialization, 6 total offices, Holding Company: First San Benito Bancshares Corporation
- International Bank of Commerce: Harlingen Branch, Harlingen Branch, Harlingen Walmart Instore. Info updated 2006/11/03: Bank assets: $952.8 mil, Deposits: $601.8 mil, headquarters in Brownsville, TX, positive income, Commercial Lending Specialization, 14 total offices, Holding Company: International Bancshares Corporation
- The Frost National Bank: Harlingen East Branch, Harlingen West Branch, Harlingen Branch. Info updated 2006/12/21: Bank assets: $20,372.1 mil, Deposits: $16,846.8 mil, headquarters in San Antonio, TX, positive income, Commercial Lending Specialization, 133 total offices, Holding Company: Cullen/Frost Bankers, Inc.
- Wells Fargo Bank, National Association: Dixieland Branch at 1206 Dixieland Road, branch established on 1996/05/20; Ed Carey Branch at 1901 South 77 Sunshine Strip, branch established on 1907/03/05. Info updated 2011/04/05: Bank assets: $1,161,490.0 mil, Deposits: $905,653.0 mil, headquarters in Sioux Falls, SD, positive income, 6395 total offices, Holding Company: Wells Fargo & Company
- First National Bank: Harlingen Expressway Branch at 1010 S. Expressway 83, branch established on 1997/08/01; Morgan Branch at 1221 Morgan Boulevard, branch established on 1999/07/21. Info updated 2007/09/20: Bank assets: $3,517.0 mil, Deposits: $2,598.8 mil, headquarters in Edinburg, TX, negative income in the last year, Commercial Lending Specialization, 58 total offices, Holding Company: First National Bank Group, Inc.
- Texas Regional Bank: at 2019 South 77 Sunshine Strip, branch established on 1987/03/05. Info updated 2010/08/16: Bank assets: $91.0 mil, Deposits: $68.7 mil, local headquarters, negative income in the last year, Commercial Lending Specialization, 2 total offices, Holding Company: Texas State Bankshares, Inc.
- Bank of America, National Association: Harlingen Branch at 222 East Van Buren Street, branch established on 1922/02/01. Info updated 2009/11/18: Bank assets: $1,451,969.3 mil, Deposits: $1,077,176.8 mil, headquarters in Charlotte, NC, positive income, 5782 total offices, Holding Company: Bank Of America Corporation
For population 15 years and over in Harlingen:
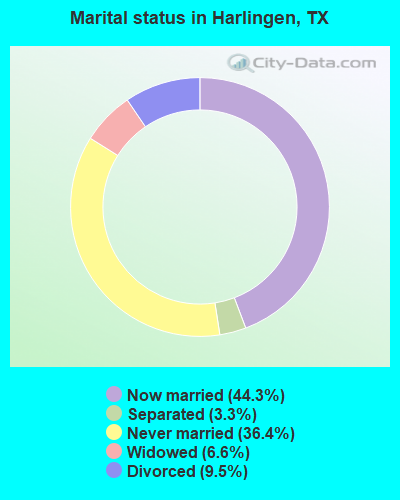
- Never married: 36.4%
- Now married: 44.3%
- Separated: 3.3%
- Widowed: 6.6%
- Divorced: 9.5%
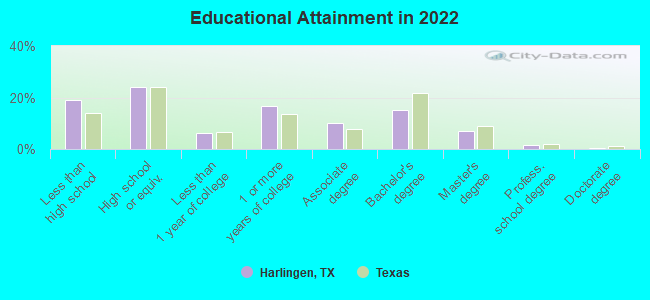
For population 25 years and over in Harlingen:
- High school or higher: 81.0%
- Bachelor's degree or higher: 23.9%
- Graduate or professional degree: 8.7%
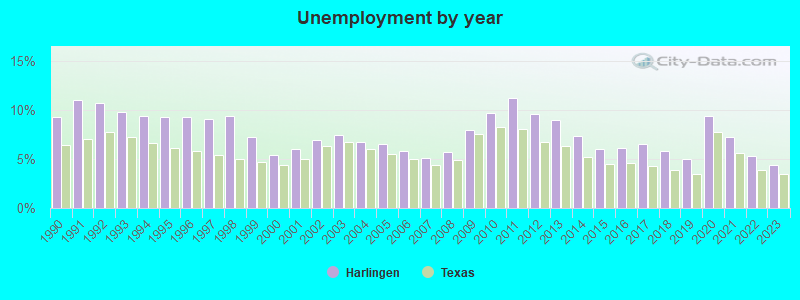
- Unemployed: 8.9%
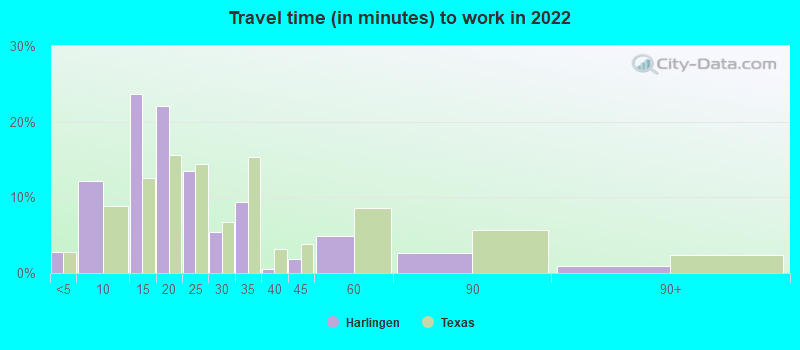
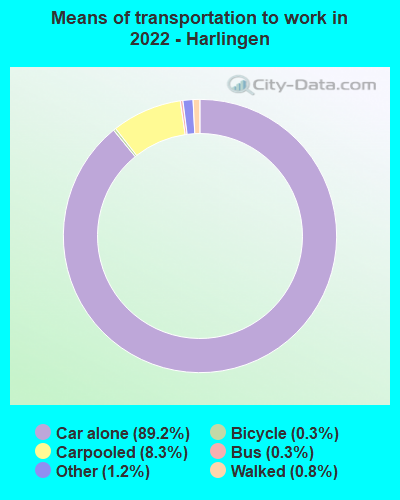
- Mean travel time to work (commute): 14.8 minutes
| Here: | 15.7 |
| Texas average: | 14.0 |
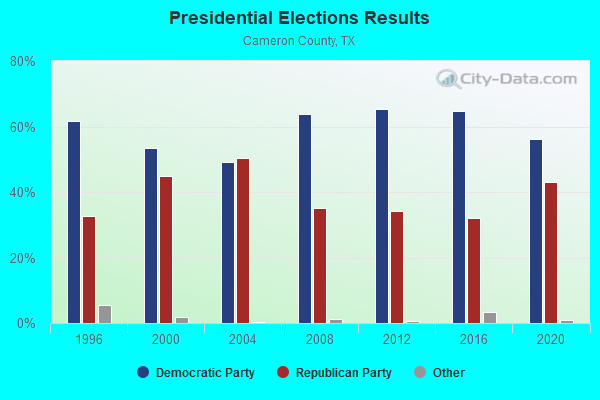
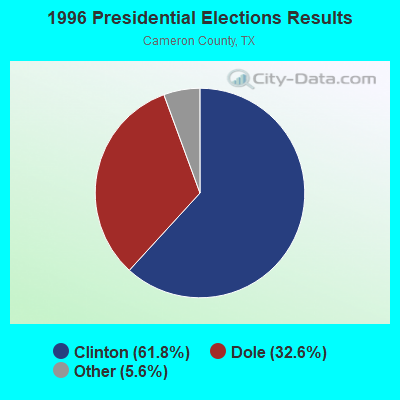
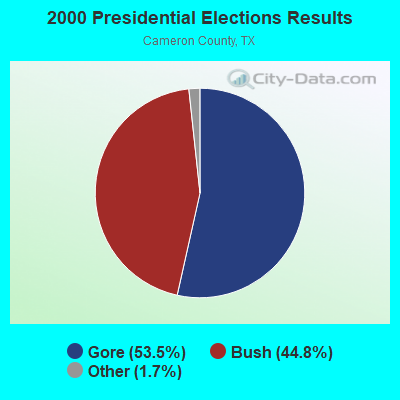
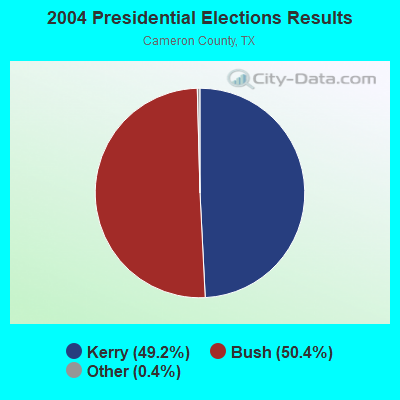
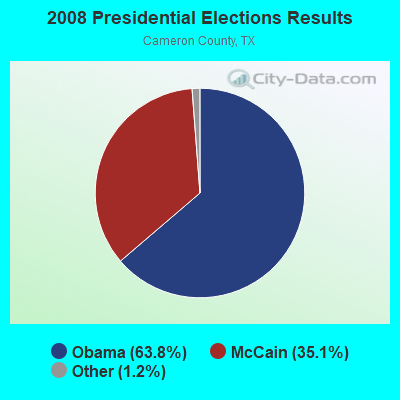
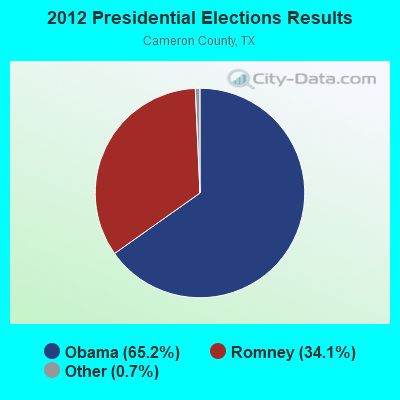
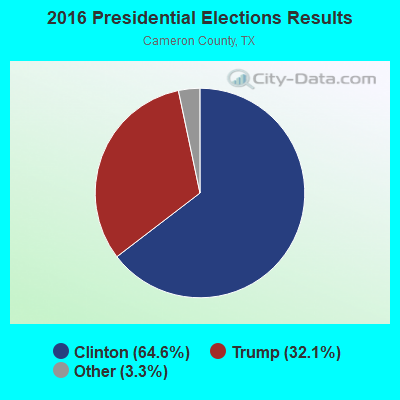
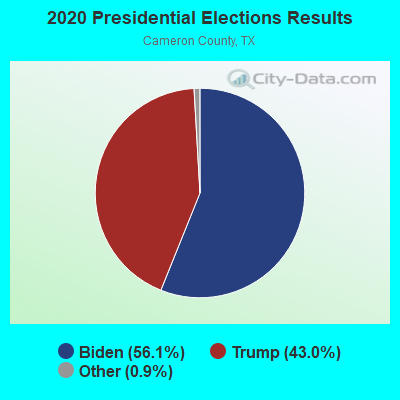
Graphs represent county-level data. Detailed 2008 Election Results
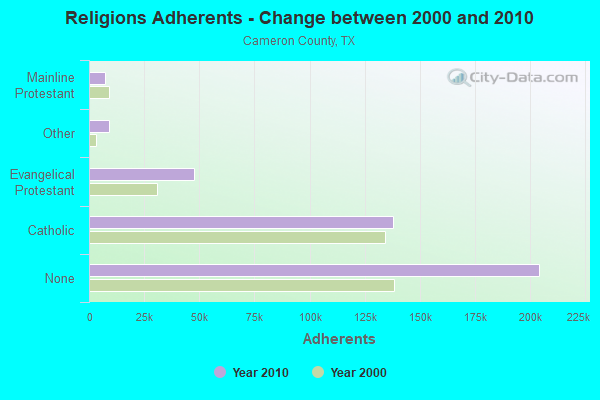
Religion statistics for Harlingen, TX (based on Cameron County data)
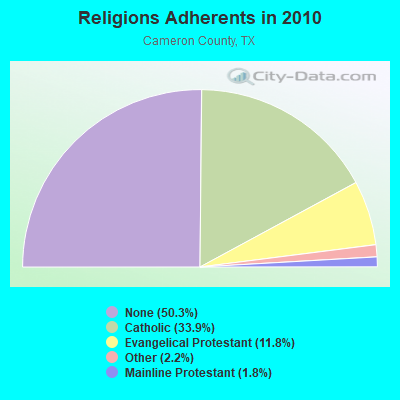
| Religion | Adherents | Congregations |
|---|---|---|
| Catholic | 137,889 | 38 |
| Evangelical Protestant | 47,744 | 225 |
| Other | 9,115 | 33 |
| Mainline Protestant | 7,258 | 32 |
| None | 204,214 | - |
Food Environment Statistics:
| Cameron County: | 1.22 / 10,000 pop. |
| State: | 1.47 / 10,000 pop. |
| This county: | 0.13 / 10,000 pop. |
| Texas: | 0.14 / 10,000 pop. |
| Cameron County: | 0.81 / 10,000 pop. |
| Texas: | 1.11 / 10,000 pop. |
| This county: | 3.46 / 10,000 pop. |
| Texas: | 3.95 / 10,000 pop. |
| Cameron County: | 5.79 / 10,000 pop. |
| Texas: | 6.13 / 10,000 pop. |
| Here: | 8.9% |
| Texas: | 8.9% |
| Cameron County: | 25.4% |
| Texas: | 26.6% |
| Cameron County: | 18.6% |
| Texas: | 15.7% |
Health and Nutrition:
| This city: | 48.5% |
| State: | 48.6% |
| Harlingen: | 48.1% |
| Texas: | 47.4% |
| Harlingen: | 28.3 |
| Texas: | 28.5 |
| This city: | 21.6% |
| Texas: | 20.6% |
| This city: | 11.5% |
| Texas: | 10.3% |
| This city: | 6.8 |
| Texas: | 6.8 |
| Harlingen: | 33.7% |
| State: | 33.1% |
| This city: | 54.1% |
| Texas: | 56.2% |
| Harlingen: | 80.0% |
| Texas: | 80.7% |
More about Health and Nutrition of Harlingen, TX Residents
| Local government employment and payroll (March 2022) | |||||
| Function | Full-time employees | Monthly full-time payroll | Average yearly full-time wage | Part-time employees | Monthly part-time payroll |
|---|---|---|---|---|---|
| Police Protection - Officers | 131 | $788,793 | $72,256 | 0 | $0 |
| Firefighters | 107 | $535,959 | $60,108 | 0 | $0 |
| Other and Unallocable | 87 | $353,471 | $48,755 | 1 | $713 |
| Water Supply | 68 | $243,868 | $43,036 | 0 | $0 |
| Airports | 51 | $171,091 | $40,257 | 9 | $14,008 |
| Solid Waste Management | 47 | $141,721 | $36,184 | 0 | $0 |
| Parks and Recreation | 46 | $140,118 | $36,553 | 19 | $15,124 |
| Police - Other | 40 | $127,437 | $38,231 | 4 | $1,010 |
| Sewerage | 38 | $157,996 | $49,893 | 1 | $878 |
| Streets and Highways | 32 | $108,234 | $40,588 | 0 | $0 |
| Financial Administration | 23 | $95,031 | $49,581 | 0 | $0 |
| Local Libraries | 18 | $70,087 | $46,725 | 6 | $5,314 |
| Other Government Administration | 17 | $108,578 | $76,643 | 0 | $0 |
| Health | 14 | $39,414 | $33,783 | 5 | $3,058 |
| Judicial and Legal | 8 | $26,005 | $39,008 | 1 | $1,180 |
| Housing and Community Development (Local) | 8 | $25,792 | $38,688 | 0 | $0 |
| Fire - Other | 3 | $9,134 | $36,536 | 0 | $0 |
| Totals for Government | 738 | $3,142,726 | $51,101 | 46 | $41,284 |
Harlingen government finances - Expenditure in 2018 (per resident):
- Construction - Air Transportation: $6,714,000 ($93.67)
Parks and Recreation: $1,437,000 ($20.05)
Local Fire Protection: $768,000 ($10.71)
General Public Buildings: $486,000 ($6.78)
Solid Waste Management: $278,000 ($3.88)
Housing and Community Development: $129,000 ($1.80)
Regular Highways: $13,000 ($0.18)
Police Protection: $6,000 ($0.08)
- Current Operations - Police Protection: $14,394,000 ($200.81)
Local Fire Protection: $9,294,000 ($129.66)
Solid Waste Management: $8,387,000 ($117.01)
Parks and Recreation: $5,660,000 ($78.96)
Air Transportation: $5,080,000 ($70.87)
Regular Highways: $4,538,000 ($63.31)
Central Staff Services: $3,683,000 ($51.38)
Housing and Community Development: $1,475,000 ($20.58)
General Public Buildings: $1,351,000 ($18.85)
Health - Other: $1,261,000 ($17.59)
Judicial and Legal Services: $1,154,000 ($16.10)
Libraries: $1,112,000 ($15.51)
Financial Administration: $998,000 ($13.92)
General - Other: $408,000 ($5.69)
Protective Inspection and Regulation - Other: $352,000 ($4.91)
- General - Interest on Debt: $1,584,000 ($22.10)
- Intergovernmental to Local - Other - Air Transportation: $833,000 ($11.62)
Other - General - Other: $134,000 ($1.87)
Other - Transit Utilities: $55,000 ($0.77)
- Other Capital Outlay - General Public Building: $2,028,000 ($28.29)
Police Protection: $500,000 ($6.98)
Solid Waste Management: $378,000 ($5.27)
Air Transportation: $372,000 ($5.19)
Regular Highways: $38,000 ($0.53)
Central Staff Services: $29,000 ($0.40)
Local Fire Protection: $23,000 ($0.32)
Health - Other: $5,000 ($0.07)
- Total Salaries and Wages: $27,790,000 ($387.71)
Harlingen government finances - Revenue in 2018 (per resident):
- Charges - Solid Waste Management: $9,367,000 ($130.68)
Air Transportation: $6,206,000 ($86.58)
Parks and Recreation: $1,174,000 ($16.38)
Other: $805,000 ($11.23)
Regular Highways: $648,000 ($9.04)
Toll Highways: $386,000 ($5.39)
- Federal Intergovernmental - Air Transportation: $5,077,000 ($70.83)
Housing and Community Development: $1,215,000 ($16.95)
Other: $354,000 ($4.94)
- Local Intergovernmental - Other: $3,584,000 ($50.00)
- Miscellaneous - General Revenue - Other: $2,298,000 ($32.06)
Fines and Forfeits: $1,114,000 ($15.54)
Rents: $420,000 ($5.86)
Sale of Property: $309,000 ($4.31)
Interest Earnings: $298,000 ($4.16)
Donations From Private Sources: $30,000 ($0.42)
Special Assessments: $28,000 ($0.39)
- State Intergovernmental - Other: $770,000 ($10.74)
Highways: $310,000 ($4.32)
Health and Hospitals: $78,000 ($1.09)
Housing and Community Development: $3,000 ($0.04)
- Tax - Property: $18,022,000 ($251.43)
General Sales and Gross Receipts: $17,763,000 ($247.82)
Public Utilities Sales: $3,282,000 ($45.79)
Other Selective Sales: $959,000 ($13.38)
Occupation and Business License - Other: $558,000 ($7.78)
Other License: $69,000 ($0.96)
Alcoholic Beverage License: $23,000 ($0.32)
Harlingen government finances - Debt in 2018 (per resident):
- Long Term Debt - Outstanding Unspecified Public Purpose: $47,435,000 ($661.78)
Beginning Outstanding - Unspecified Public Purpose: $37,640,000 ($525.13)
Issue, Unspecified Public Purpose: $12,885,000 ($179.76)
Beginning Outstanding - Public Debt for Private Purpose: $9,002,000 ($125.59)
Outstanding Nonguaranteed - Industrial Revenue: $8,113,000 ($113.19)
Retired Unspecified Public Purpose: $3,090,000 ($43.11)
Retired Nonguaranteed - Public Debt for Private Purpose: $889,000 ($12.40)
Harlingen government finances - Cash and Securities in 2018 (per resident):
- Bond Funds - Cash and Securities: $13,724,000 ($191.47)
- Other Funds - Cash and Securities: $36,021,000 ($502.54)
- Sinking Funds - Cash and Securities: $8,817,000 ($123.01)
3.64% of this county's 2021 resident taxpayers lived in other counties in 2020 ($49,868 average adjusted gross income)
| Here: | 3.64% |
| Texas average: | 8.12% |
0.03% of residents moved from foreign countries ($558 average AGI)
Cameron County: 0.03% Texas average: 0.04%
Top counties from which taxpayers relocated into this county between 2020 and 2021:
| from Hidalgo County, TX | |
| from Harris County, TX | |
| from Bexar County, TX |
3.56% of this county's 2020 resident taxpayers moved to other counties in 2021 ($47,696 average adjusted gross income)
| Here: | 3.56% |
| Texas average: | 7.40% |
0.01% of residents moved to foreign countries ($366 average AGI)
Cameron County: 0.01% Texas average: 0.03%
Top counties to which taxpayers relocated from this county between 2020 and 2021:
| to Hidalgo County, TX | |
| to Bexar County, TX | |
| to Harris County, TX |
| Businesses in Harlingen, TX | ||||
| Name | Count | Name | Count | |
|---|---|---|---|---|
| 99 Cents Only Stores | 1 | La-Z-Boy | 1 | |
| AT&T | 3 | Lane Furniture | 2 | |
| Advance Auto Parts | 1 | LensCrafters | 1 | |
| Aeropostale | 1 | Little Caesars Pizza | 2 | |
| Applebee's | 1 | Long John Silver's | 1 | |
| AutoZone | 2 | Lowe's | 1 | |
| BMW | 1 | Marriott | 1 | |
| Bath & Body Works | 1 | Marshalls | 1 | |
| Bed Bath & Beyond | 1 | Maurices | 1 | |
| Best Western | 1 | Mazda | 1 | |
| Blockbuster | 1 | McDonald's | 5 | |
| Burger King | 2 | Motel 6 | 1 | |
| CVS | 2 | Nike | 10 | |
| Charlotte Russe | 1 | Nissan | 1 | |
| Chevrolet | 1 | Office Depot | 1 | |
| Chick-Fil-A | 2 | Olive Garden | 1 | |
| Church's Chicken | 4 | Payless | 3 | |
| Cricket Wireless | 13 | Penske | 2 | |
| Curves | 1 | PetSmart | 1 | |
| DHL | 1 | Pizza Hut | 3 | |
| Dairy Queen | 2 | Quiznos | 2 | |
| Dennys | 1 | RadioShack | 2 | |
| Discount Tire | 1 | Rodeway Inn | 1 | |
| Domino's Pizza | 1 | Rue21 | 1 | |
| Express | 1 | SONIC Drive-In | 2 | |
| FedEx | 10 | Sears | 3 | |
| Firestone Complete Auto Care | 1 | Shoe Carnival | 1 | |
| Foot Locker | 1 | Sprint Nextel | 2 | |
| Forever 21 | 1 | Starbucks | 4 | |
| GNC | 1 | Subway | 10 | |
| GameStop | 2 | Super 8 | 1 | |
| Goodwill | 2 | T-Mobile | 6 | |
| H&R Block | 4 | Taco Bell | 2 | |
| Hilton | 1 | Target | 1 | |
| Hobby Lobby | 1 | Toyota | 1 | |
| Holiday Inn | 1 | Toys"R"Us | 1 | |
| Home Depot | 1 | True Value | 1 | |
| Hot Topic | 1 | U-Haul | 5 | |
| IHOP | 1 | UPS | 9 | |
| JCPenney | 1 | Vans | 2 | |
| Jack In The Box | 3 | Verizon Wireless | 1 | |
| Journeys | 1 | Victoria's Secret | 1 | |
| KFC | 1 | Walgreens | 2 | |
| Kmart | 1 | Walmart | 1 | |
| Kohl's | 1 | Wendy's | 2 | |
| La Quinta | 1 | |||
Strongest AM radio stations in Harlingen:
- KGBT (1530 AM; 50 kW; HARLINGEN, TX; Owner: TICHENOR LICENSE CORPORATION)
- KQXX (1700 AM; 10 kW; BROWNSVILLE, TX; Owner: LA NUEVA KBOR, INC.)
- KRGE (1290 AM; 5 kW; WESLACO, TX; Owner: CHRISTIAN MINISTRIES OF THE VALLEY)
- KBOR (1600 AM; 10 kW; BROWNSVILLE, TX; Owner: LA NUEVA KBOR, INC.)
- KURV (710 AM; 10 kW; EDINBURG, TX; Owner: VOICE OF VALLEY AGRICULTURE, INC.)
- KUBR (1210 AM; 10 kW; SAN JUAN, TX; Owner: PAULINO BERNAL)
- KVJY (840 AM; 5 kW; PHARR, TX; Owner: RADIO UNICA OF MCALLEN LICENSE CORP.)
- KRIO (910 AM; 5 kW; MCALLEN, TX; Owner: RIO GRANDE BIBLE INSTITUTE, INC.)
- KCTA (1030 AM; 50 kW; CORPUS CHRISTI, TX; Owner: BROADCASTING CORPORATION OF THE SOUTHWEST)
- KSOX (1240 AM; 1 kW; RAYMONDVILLE, TX; Owner: VOICE OF VALLEY AGRICULTURE, INC.)
- KKYX (680 AM; 50 kW; SAN ANTONIO, TX; Owner: CXR HOLDINGS, INC.)
- KTKR (760 AM; 50 kW; SAN ANTONIO, TX; Owner: CCB TEXAS LICENSES, L.P.)
- WOAI (1200 AM; 50 kW; SAN ANTONIO, TX; Owner: CCB TEXAS LICENSES, L.P.)
Strongest FM radio stations in Harlingen:
- KFRQ (94.5 FM; HARLINGEN, TX; Owner: ENTRAVISION HOLDINGS, L.L.C.)
- KTEX (100.3 FM; BROWNSVILLE, TX; Owner: CAPSTAR TX LIMITED PARTNERSHIP)
- KGBT-FM (98.5 FM; MCALLEN, TX; Owner: TICHENOR LICENSE CORPORATION ("TLC"))
- KBTQ (96.1 FM; HARLINGEN, TX; Owner: TICHENOR LICENSE CORPORATION ("TLC"))
- KBFM (104.1 FM; EDINBURG, TX; Owner: CAPSTAR TX LIMITED PARTNERSHIP)
- KVMV (96.9 FM; MCALLEN, TX; Owner: WORLD RADIO NETWORK, INC.)
- KKPS (99.5 FM; BROWNSVILLE, TX; Owner: ENTRAVISION HOLDINGS, L.L.C.)
- KMAZ (106.3 FM; MERCEDES, TX; Owner: LA NUEVA KBOR, INC.)
- KVLY (107.9 FM; EDINBURG, TX; Owner: ENTRAVISION HOLDINGS, L.L.C.)
- KMBH-FM (88.9 FM; HARLINGEN, TX; Owner: RGV EDUCATIONAL BROADCASTING, INC.)
- KBIC (105.7 FM; RAYMONDVILLE, TX; Owner: CHRISTIAN MINISTRIES OF THE VALLEY)
- KILM (102.1 FM; RAYMONDVILLE, TX; Owner: BMP 102.1 FM, LP)
- KNVO-FM (101.1 FM; PORT ISABEL, TX; Owner: ENTRAVISION HOLDINGS, L.L.C.)
- KBNR (88.3 FM; BROWNSVILLE, TX; Owner: WORLD RADIO NETWORK, INC.)
- KJAV (104.9 FM; ALAMO, TX; Owner: PAULINO BERNAL)
TV broadcast stations around Harlingen:
- KTIZ-LP (Channel 52; HARLINGEN, TX; Owner: ORTIZ BROADCASTING CORPORATION)
- KLUJ (Channel 44; HARLINGEN, TX; Owner: COMMUNITY EDUCATIONAL TELEVISION)
- KRGV-TV (Channel 5; WESLACO, TX; Owner: MOBILE VIDEO TAPES, INC.)
- KGBT-TV (Channel 4; HARLINGEN, TX; Owner: LIBCO, INC.)
- KMBH (Channel 60; HARLINGEN, TX; Owner: RGV EDUCATIONAL BROADCASTING, INC.)
- KVEO (Channel 23; BROWNSVILLE, TX; Owner: COMCORP OF TEXAS LICENSE CORP.)
- KFTN-LP (Channel 30; La FERIA, TX; Owner: ORTIZ BROADCASTING CORPORATION)
- KNVO (Channel 48; Mc ALLEN, TX; Owner: ENTRAVISION HOLDINGS, LLC)
- KTLM (Channel 40; RIO GRANDE CITY, TX; Owner: SUNBELT MULTIMEDIA CO.)
- K64FM (Channel 64; BROWNSVILLE, TX; Owner: BROWNSVILLE BROADCASTING, LLC)
- KZAV-LP (Channel 20; BROWNSVILLE, TX; Owner: ZAVALETTA BROADCASTING OF THE RIO GRANDE VALLEY, LLC)
- KXIV-LP (Channel 17; BROWNSVILLE, TX; Owner: FAITH PLEASES GOD CHURCH CORP.)
- National Bridge Inventory (NBI) Statistics
- 112Number of bridges
- 2,766ft / 843mTotal length
- 1,763,454Total average daily traffic
- 158,910Total average daily truck traffic
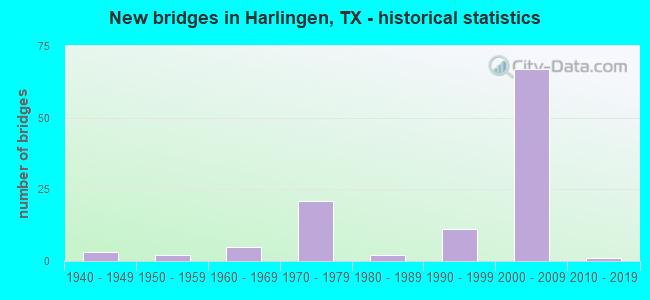
- New bridges - historical statistics
- 31940-1949
- 21950-1959
- 51960-1969
- 211970-1979
- 21980-1989
- 111990-1999
- 672000-2009
- 12010-2019
FCC Registered Antenna Towers: 307 (See the full list of FCC Registered Antenna Towers)
FCC Registered Private Land Mobile Towers: 4 (See the full list of FCC Registered Private Land Mobile Towers in Harlingen, TX)
FCC Registered Broadcast Land Mobile Towers: 36 (See the full list of FCC Registered Broadcast Land Mobile Towers)
FCC Registered Microwave Towers: 64 (See the full list of FCC Registered Microwave Towers in this town)
FCC Registered Paging Towers: 8 (See the full list of FCC Registered Paging Towers)
FCC Registered Maritime Coast & Aviation Ground Towers: 17 (See the full list of FCC Registered Maritime Coast & Aviation Ground Towers)
FCC Registered Amateur Radio Licenses: 298 (See the full list of FCC Registered Amateur Radio Licenses in Harlingen)
FAA Registered Aircraft: 63 (See the full list of FAA Registered Aircraft in Harlingen)
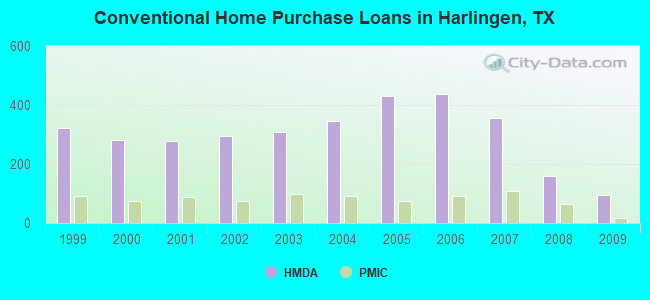
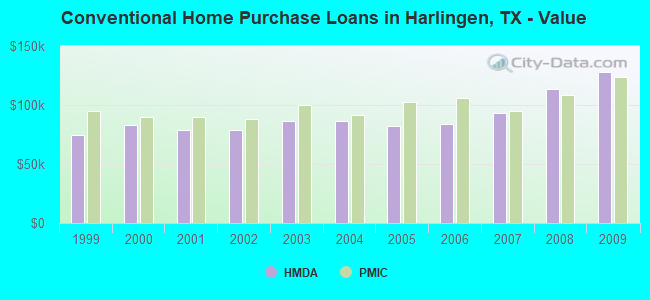
| Home Mortgage Disclosure Act Aggregated Statistics For Year 2009 (Based on 12 full and 4 partial tracts) | ||||||||||||||
| A) FHA, FSA/RHS & VA Home Purchase Loans | B) Conventional Home Purchase Loans | C) Refinancings | D) Home Improvement Loans | E) Loans on Dwellings For 5+ Families | F) Non-occupant Loans on < 5 Family Dwellings (A B C & D) | G) Loans On Manufactured Home Dwelling (A B C & D) | ||||||||
|---|---|---|---|---|---|---|---|---|---|---|---|---|---|---|
| Number | Average Value | Number | Average Value | Number | Average Value | Number | Average Value | Number | Average Value | Number | Average Value | Number | Average Value | |
| LOANS ORIGINATED | 130 | $118,677 | 96 | $128,011 | 173 | $112,425 | 35 | $21,775 | 4 | $494,678 | 46 | $133,114 | 4 | $31,258 |
| APPLICATIONS APPROVED, NOT ACCEPTED | 8 | $93,295 | 10 | $80,374 | 37 | $92,652 | 5 | $20,648 | 0 | $0 | 5 | $128,416 | 2 | $25,290 |
| APPLICATIONS DENIED | 31 | $109,999 | 25 | $80,167 | 148 | $84,011 | 129 | $27,622 | 1 | $354,560 | 23 | $62,726 | 9 | $19,946 |
| APPLICATIONS WITHDRAWN | 10 | $92,363 | 8 | $97,892 | 67 | $106,805 | 9 | $29,659 | 0 | $0 | 6 | $83,397 | 1 | $35,000 |
| FILES CLOSED FOR INCOMPLETENESS | 4 | $80,698 | 2 | $70,585 | 18 | $90,137 | 6 | $28,025 | 0 | $0 | 0 | $0 | 0 | $0 |
Detailed mortgage data for all 16 tracts in Harlingen, TX
| Private Mortgage Insurance Companies Aggregated Statistics For Year 2009 (Based on 7 full and 4 partial tracts) | ||||||
| A) Conventional Home Purchase Loans | B) Refinancings | C) Non-occupant Loans on < 5 Family Dwellings (A & B) | ||||
|---|---|---|---|---|---|---|
| Number | Average Value | Number | Average Value | Number | Average Value | |
| LOANS ORIGINATED | 17 | $124,112 | 4 | $133,288 | 2 | $98,000 |
| APPLICATIONS APPROVED, NOT ACCEPTED | 2 | $124,125 | 3 | $139,350 | 0 | $0 |
| APPLICATIONS DENIED | 3 | $140,570 | 4 | $241,762 | 0 | $0 |
| APPLICATIONS WITHDRAWN | 2 | $116,885 | 0 | $0 | 0 | $0 |
| FILES CLOSED FOR INCOMPLETENESS | 0 | $0 | 0 | $0 | 0 | $0 |
2003 - 2018 National Fire Incident Reporting System (NFIRS) incidents
- Fire incident types reported to NFIRS in Harlingen, TX
- 2,71555.8%Outside Fires
- 1,17824.2%Structure Fires
- 81316.7%Mobile Property/Vehicle Fires
- 1563.2%Other
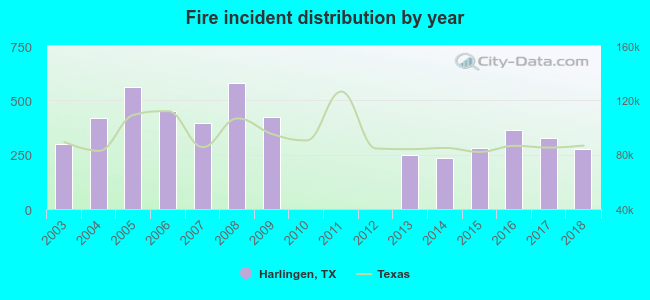 Based on the data from the years 2003 - 2018 the average number of fires per year is 304. The highest number of reported fire incidents - 580 took place in 2008, and the least - 1 in 2010. The data has a declining trend.
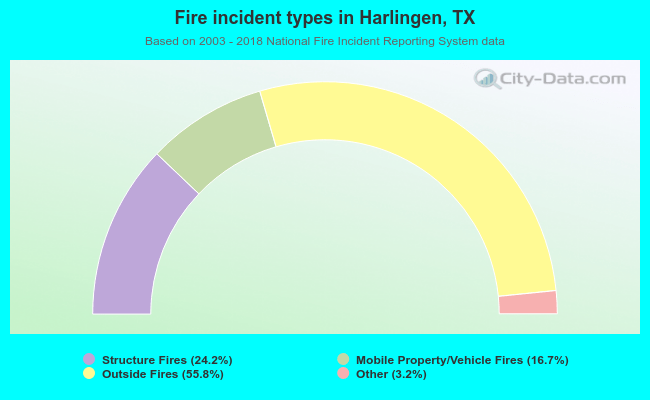 When looking into fire subcategories, the most incidents belonged to: Outside Fires (55.8%), and Structure Fires (24.2%).
Fire-safe hotels and motels in Harlingen, Texas:
- Rodeway Inn Harlingen, 1821 W Tyler, Harlingen, Texas 78550 , Fax: (956) 428-3309
- Country Inn & Suites Harlingen, 3825 South Expy 83, Harlingen, Texas 78550 , Phone: (956) 428-0043, Fax: (956) 428-0053
- Best Western Casa Villa Suites, 4317 South Expy 83, Harlingen, Texas 78550 , Phone: (956) 412-1500, Fax: (956) 412-6228
- Hampton Inn And Suites, 1202 N Ed Carey Dr, Harlingen, Texas 78550 , Phone: (956) 428-9800, Fax: (956) 428-9801
- Econo Lodge Inn & Suites, 1901 W Tyler Ave, Harlingen, Texas 78550 , Phone: (956) 425-1810, Fax: (956) 425-7227
- Value Place, 3905 S Expy 77/83, Harlingen, Texas 78550 , Phone: (956) 423-2200
- Americas Best Value Inn, 4401 S Expy 83, Harlingen, Texas 78550 , Phone: (956) 425-1333, Fax: (956) 425-1457
- RGV Hospitality Group Dba Candlewood Suites, 4319 South Expy 83, Harlingen, Texas 78550 , Phone: (956) 412-6900
- 2 other hotels and motels
| Most common first names in Harlingen, TX among deceased individuals | ||
| Name | Count | Lived (average) |
|---|---|---|
| Maria | 401 | 75.4 years |
| Jose | 274 | 70.6 years |
| John | 252 | 76.2 years |
| Mary | 203 | 79.9 years |
| William | 197 | 76.9 years |
| James | 194 | 73.1 years |
| Guadalupe | 187 | 74.3 years |
| Robert | 185 | 74.1 years |
| Juan | 127 | 72.9 years |
| George | 124 | 77.1 years |
| Most common last names in Harlingen, TX among deceased individuals | ||
| Last name | Count | Lived (average) |
|---|---|---|
| Garcia | 301 | 74.5 years |
| Gonzalez | 210 | 72.8 years |
| Rodriguez | 209 | 74.5 years |
| Martinez | 166 | 73.6 years |
| Garza | 163 | 76.1 years |
| Flores | 128 | 73.8 years |
| Hernandez | 117 | 75.4 years |
| Smith | 112 | 77.2 years |
| Perez | 109 | 71.0 years |
| Lopez | 88 | 72.5 years |
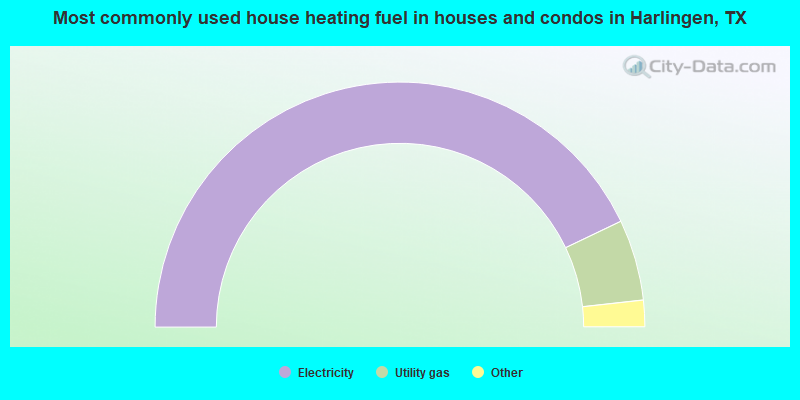
- 85.8%Electricity
- 10.7%Utility gas
- 2.4%Bottled, tank, or LP gas
- 0.7%No fuel used
- 0.2%Solar energy
- 0.1%Wood
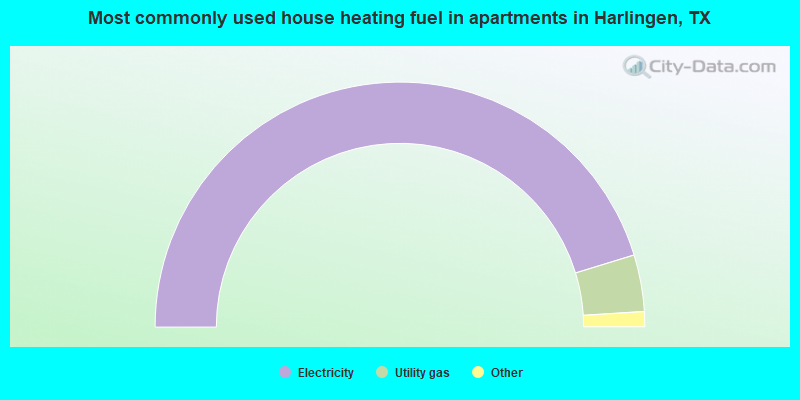
- 90.5%Electricity
- 7.5%Utility gas
- 1.0%No fuel used
- 0.4%Other fuel
- 0.4%Bottled, tank, or LP gas
- 0.1%Solar energy
Harlingen compared to Texas state average:
- Median house value below state average.
- Black race population percentage significantly below state average.
- Hispanic race population percentage above state average.
Harlingen on our top lists:
- #4 on the list of "Top 101 cities with largest percentage of females in occupations: education, training, and library occupations (population 50,000+)"
- #9 on the list of "Top 101 cities with largest percentage of females in occupations: healthcare support occupations (population 50,000+)"
- #10 on the list of "Top 101 cities with largest percentage of females in occupations: community and social service occupations (population 50,000+)"
- #13 on the list of "Top 101 cities with largest percentage of females in industries: educational services (population 50,000+)"
- #14 on the list of "Top 101 cities with largest percentage of females in industries: health care and social assistance (population 50,000+)"
- #17 on the list of "Top 101 cities with the largest city-data.com crime index decrease from 2011 to 2012 (population 50,000+)"
- #18 on the list of "Top 100 cities with shortest commuting times (pop. 50,000+)"
- #22 on the list of "Top 101 cities with largest percentage of males in industries: information (population 50,000+)"
- #23 on the list of "Top 101 cities with the least people having Doctorate degrees (population 50,000+)"
- #35 on the list of "Top 101 cities with largest percentage of males in occupations: health diagnosing and treating practitioners and other technical occupations (population 50,000+)"
- #38 on the list of "Top 101 cities with largest percentage of males in industries: health care and social assistance (population 50,000+)"
- #40 on the list of "Top 101 cities with largest percentage of males in occupations: transportation occupations (population 50,000+)"
- #41 on the list of "Top 101 cities with the largest wind speed differences during a year (population 50,000+)"
- #42 on the list of "Top 101 cities with the highest average humidity (population 50,000+)"
- #46 on the list of "Top 101 cities with largest percentage of males in occupations: health technologists and technicians (population 50,000+)"
- #52 on the list of "Top 101 cities with the hottest summers (population 50,000+)"
- #52 on the list of "Top 101 cities with the least people having Master's or Doctorate degrees (population 50,000+)"
- #53 on the list of "Top 100 cities with lowest ratio of median house value to median household income (pop. 50,000+)"
- #60 on the list of "Top 101 cities with the largest house values disparities (population 50,000+)"
- #62 on the list of "Top 101 cities with the largest percentage of people in unknown juvenile institutions (population 1,000+)"
- #8 on the list of "Top 101 counties with the highest number of births per 1000 residents 2007-2013"
- #13 on the list of "Top 101 counties with the largest increase in the number of infant deaths per 1000 residents 2000-2006 to 2007-2013 (pop. 50,000+)"
- #24 on the list of "Top 101 counties with the largest decrease in the number of births per 1000 residents 2000-2006 to 2007-2013 (pop 50,000+)"
- #49 on the list of "Top 101 counties with the lowest percentage of residents relocating to other counties in 2011"
- #59 on the list of "Top 101 counties with the lowest percentage of residents relocating from other counties between 2010 and 2011 (pop. 50,000+)"

|
|
Total of 42 patent applications in 2008-2024.