Haverhill, Massachusetts Submit your own pictures of this city and show them to the world
OSM Map
General Map
Google Map
MSN Map
OSM Map
General Map
Google Map
MSN Map
OSM Map
General Map
Google Map
MSN Map
OSM Map
General Map
Google Map
MSN Map
Please wait while loading the map...
Population in 2022: 67,153 (99% urban, 1% rural). Population change since 2000: +13.9%Males: 32,266 Females: 34,887
March 2022 cost of living index in Haverhill: 134.3 (high, U.S. average is 100) Percentage of residents living in poverty in 2022: 14.4%for White Non-Hispanic residents , 23.3% for Black residents , 17.4% for Hispanic or Latino residents , 14.9% for American Indian residents , 15.1% for other race residents , 11.8% for two or more races residents )
Profiles of local businesses
Business Search - 14 Million verified businesses
Data:
Median household income ($)
Median household income (% change since 2000)
Household income diversity
Ratio of average income to average house value (%)
Ratio of average income to average rent
Median household income ($) - White
Median household income ($) - Black or African American
Median household income ($) - Asian
Median household income ($) - Hispanic or Latino
Median household income ($) - American Indian and Alaska Native
Median household income ($) - Multirace
Median household income ($) - Other Race
Median household income for houses/condos with a mortgage ($)
Median household income for apartments without a mortgage ($)
Races - White alone (%)
Races - White alone (% change since 2000)
Races - Black alone (%)
Races - Black alone (% change since 2000)
Races - American Indian alone (%)
Races - American Indian alone (% change since 2000)
Races - Asian alone (%)
Races - Asian alone (% change since 2000)
Races - Hispanic (%)
Races - Hispanic (% change since 2000)
Races - Native Hawaiian and Other Pacific Islander alone (%)
Races - Native Hawaiian and Other Pacific Islander alone (% change since 2000)
Races - Two or more races (%)
Races - Two or more races (% change since 2000)
Races - Other race alone (%)
Races - Other race alone (% change since 2000)
Racial diversity
Unemployment (%)
Unemployment (% change since 2000)
Unemployment (%) - White
Unemployment (%) - Black or African American
Unemployment (%) - Asian
Unemployment (%) - Hispanic or Latino
Unemployment (%) - American Indian and Alaska Native
Unemployment (%) - Multirace
Unemployment (%) - Other Race
Population density (people per square mile)
Population - Males (%)
Population - Females (%)
Population - Males (%) - White
Population - Males (%) - Black or African American
Population - Males (%) - Asian
Population - Males (%) - Hispanic or Latino
Population - Males (%) - American Indian and Alaska Native
Population - Males (%) - Multirace
Population - Males (%) - Other Race
Population - Females (%) - White
Population - Females (%) - Black or African American
Population - Females (%) - Asian
Population - Females (%) - Hispanic or Latino
Population - Females (%) - American Indian and Alaska Native
Population - Females (%) - Multirace
Population - Females (%) - Other Race
Coronavirus confirmed cases (Apr 24, 2024)
Deaths caused by coronavirus (Apr 24, 2024)
Coronavirus confirmed cases (per 100k population) (Apr 24, 2024)
Deaths caused by coronavirus (per 100k population) (Apr 24, 2024)
Daily increase in number of cases (Apr 24, 2024)
Weekly increase in number of cases (Apr 24, 2024)
Cases doubled (in days) (Apr 24, 2024)
Hospitalized patients (Apr 18, 2022)
Negative test results (Apr 18, 2022)
Total test results (Apr 18, 2022)
COVID Vaccine doses distributed (per 100k population) (Sep 19, 2023)
COVID Vaccine doses administered (per 100k population) (Sep 19, 2023)
COVID Vaccine doses distributed (Sep 19, 2023)
COVID Vaccine doses administered (Sep 19, 2023)
Likely homosexual households (%)
Likely homosexual households (% change since 2000)
Likely homosexual households - Lesbian couples (%)
Likely homosexual households - Lesbian couples (% change since 2000)
Likely homosexual households - Gay men (%)
Likely homosexual households - Gay men (% change since 2000)
Cost of living index
Median gross rent ($)
Median contract rent ($)
Median monthly housing costs ($)
Median house or condo value ($)
Median house or condo value ($ change since 2000)
Mean house or condo value by units in structure - 1, detached ($)
Mean house or condo value by units in structure - 1, attached ($)
Mean house or condo value by units in structure - 2 ($)
Mean house or condo value by units in structure by units in structure - 3 or 4 ($)
Mean house or condo value by units in structure - 5 or more ($)
Mean house or condo value by units in structure - Boat, RV, van, etc. ($)
Mean house or condo value by units in structure - Mobile home ($)
Median house or condo value ($) - White
Median house or condo value ($) - Black or African American
Median house or condo value ($) - Asian
Median house or condo value ($) - Hispanic or Latino
Median house or condo value ($) - American Indian and Alaska Native
Median house or condo value ($) - Multirace
Median house or condo value ($) - Other Race
Median resident age
Resident age diversity
Median resident age - Males
Median resident age - Females
Median resident age - White
Median resident age - Black or African American
Median resident age - Asian
Median resident age - Hispanic or Latino
Median resident age - American Indian and Alaska Native
Median resident age - Multirace
Median resident age - Other Race
Median resident age - Males - White
Median resident age - Males - Black or African American
Median resident age - Males - Asian
Median resident age - Males - Hispanic or Latino
Median resident age - Males - American Indian and Alaska Native
Median resident age - Males - Multirace
Median resident age - Males - Other Race
Median resident age - Females - White
Median resident age - Females - Black or African American
Median resident age - Females - Asian
Median resident age - Females - Hispanic or Latino
Median resident age - Females - American Indian and Alaska Native
Median resident age - Females - Multirace
Median resident age - Females - Other Race
Commute - mean travel time to work (minutes)
Travel time to work - Less than 5 minutes (%)
Travel time to work - Less than 5 minutes (% change since 2000)
Travel time to work - 5 to 9 minutes (%)
Travel time to work - 5 to 9 minutes (% change since 2000)
Travel time to work - 10 to 19 minutes (%)
Travel time to work - 10 to 19 minutes (% change since 2000)
Travel time to work - 20 to 29 minutes (%)
Travel time to work - 20 to 29 minutes (% change since 2000)
Travel time to work - 30 to 39 minutes (%)
Travel time to work - 30 to 39 minutes (% change since 2000)
Travel time to work - 40 to 59 minutes (%)
Travel time to work - 40 to 59 minutes (% change since 2000)
Travel time to work - 60 to 89 minutes (%)
Travel time to work - 60 to 89 minutes (% change since 2000)
Travel time to work - 90 or more minutes (%)
Travel time to work - 90 or more minutes (% change since 2000)
Marital status - Never married (%)
Marital status - Now married (%)
Marital status - Separated (%)
Marital status - Widowed (%)
Marital status - Divorced (%)
Median family income ($)
Median family income (% change since 2000)
Median non-family income ($)
Median non-family income (% change since 2000)
Median per capita income ($)
Median per capita income (% change since 2000)
Median family income ($) - White
Median family income ($) - Black or African American
Median family income ($) - Asian
Median family income ($) - Hispanic or Latino
Median family income ($) - American Indian and Alaska Native
Median family income ($) - Multirace
Median family income ($) - Other Race
Median year house/condo built
Median year apartment built
Year house built - Built 2005 or later (%)
Year house built - Built 2000 to 2004 (%)
Year house built - Built 1990 to 1999 (%)
Year house built - Built 1980 to 1989 (%)
Year house built - Built 1970 to 1979 (%)
Year house built - Built 1960 to 1969 (%)
Year house built - Built 1950 to 1959 (%)
Year house built - Built 1940 to 1949 (%)
Year house built - Built 1939 or earlier (%)
Average household size
Household density (households per square mile)
Average household size - White
Average household size - Black or African American
Average household size - Asian
Average household size - Hispanic or Latino
Average household size - American Indian and Alaska Native
Average household size - Multirace
Average household size - Other Race
Occupied housing units (%)
Vacant housing units (%)
Owner occupied housing units (%)
Renter occupied housing units (%)
Vacancy status - For rent (%)
Vacancy status - For sale only (%)
Vacancy status - Rented or sold, not occupied (%)
Vacancy status - For seasonal, recreational, or occasional use (%)
Vacancy status - For migrant workers (%)
Vacancy status - Other vacant (%)
Residents with income below the poverty level (%)
Residents with income below 50% of the poverty level (%)
Children below poverty level (%)
Poor families by family type - Married-couple family (%)
Poor families by family type - Male, no wife present (%)
Poor families by family type - Female, no husband present (%)
Poverty status for native-born residents (%)
Poverty status for foreign-born residents (%)
Poverty among high school graduates not in families (%)
Poverty among people who did not graduate high school not in families (%)
Residents with income below the poverty level (%) - White
Residents with income below the poverty level (%) - Black or African American
Residents with income below the poverty level (%) - Asian
Residents with income below the poverty level (%) - Hispanic or Latino
Residents with income below the poverty level (%) - American Indian and Alaska Native
Residents with income below the poverty level (%) - Multirace
Residents with income below the poverty level (%) - Other Race
Air pollution - Air Quality Index (AQI)
Air pollution - CO
Air pollution - NO2
Air pollution - SO2
Air pollution - Ozone
Air pollution - PM10
Air pollution - PM25
Air pollution - Pb
Crime - Murders per 100,000 population
Crime - Rapes per 100,000 population
Crime - Robberies per 100,000 population
Crime - Assaults per 100,000 population
Crime - Burglaries per 100,000 population
Crime - Thefts per 100,000 population
Crime - Auto thefts per 100,000 population
Crime - Arson per 100,000 population
Crime - City-data.com crime index
Crime - Violent crime index
Crime - Property crime index
Crime - Murders per 100,000 population (5 year average)
Crime - Rapes per 100,000 population (5 year average)
Crime - Robberies per 100,000 population (5 year average)
Crime - Assaults per 100,000 population (5 year average)
Crime - Burglaries per 100,000 population (5 year average)
Crime - Thefts per 100,000 population (5 year average)
Crime - Auto thefts per 100,000 population (5 year average)
Crime - Arson per 100,000 population (5 year average)
Crime - City-data.com crime index (5 year average)
Crime - Violent crime index (5 year average)
Crime - Property crime index (5 year average)
1996 Presidential Elections Results (%) - Democratic Party (Clinton)
1996 Presidential Elections Results (%) - Republican Party (Dole)
1996 Presidential Elections Results (%) - Other
2000 Presidential Elections Results (%) - Democratic Party (Gore)
2000 Presidential Elections Results (%) - Republican Party (Bush)
2000 Presidential Elections Results (%) - Other
2004 Presidential Elections Results (%) - Democratic Party (Kerry)
2004 Presidential Elections Results (%) - Republican Party (Bush)
2004 Presidential Elections Results (%) - Other
2008 Presidential Elections Results (%) - Democratic Party (Obama)
2008 Presidential Elections Results (%) - Republican Party (McCain)
2008 Presidential Elections Results (%) - Other
2012 Presidential Elections Results (%) - Democratic Party (Obama)
2012 Presidential Elections Results (%) - Republican Party (Romney)
2012 Presidential Elections Results (%) - Other
2016 Presidential Elections Results (%) - Democratic Party (Clinton)
2016 Presidential Elections Results (%) - Republican Party (Trump)
2016 Presidential Elections Results (%) - Other
2020 Presidential Elections Results (%) - Democratic Party (Biden)
2020 Presidential Elections Results (%) - Republican Party (Trump)
2020 Presidential Elections Results (%) - Other
Ancestries Reported - Arab (%)
Ancestries Reported - Czech (%)
Ancestries Reported - Danish (%)
Ancestries Reported - Dutch (%)
Ancestries Reported - English (%)
Ancestries Reported - French (%)
Ancestries Reported - French Canadian (%)
Ancestries Reported - German (%)
Ancestries Reported - Greek (%)
Ancestries Reported - Hungarian (%)
Ancestries Reported - Irish (%)
Ancestries Reported - Italian (%)
Ancestries Reported - Lithuanian (%)
Ancestries Reported - Norwegian (%)
Ancestries Reported - Polish (%)
Ancestries Reported - Portuguese (%)
Ancestries Reported - Russian (%)
Ancestries Reported - Scotch-Irish (%)
Ancestries Reported - Scottish (%)
Ancestries Reported - Slovak (%)
Ancestries Reported - Subsaharan African (%)
Ancestries Reported - Swedish (%)
Ancestries Reported - Swiss (%)
Ancestries Reported - Ukrainian (%)
Ancestries Reported - United States (%)
Ancestries Reported - Welsh (%)
Ancestries Reported - West Indian (%)
Ancestries Reported - Other (%)
Educational Attainment - No schooling completed (%)
Educational Attainment - Less than high school (%)
Educational Attainment - High school or equivalent (%)
Educational Attainment - Less than 1 year of college (%)
Educational Attainment - 1 or more years of college (%)
Educational Attainment - Associate degree (%)
Educational Attainment - Bachelor's degree (%)
Educational Attainment - Master's degree (%)
Educational Attainment - Professional school degree (%)
Educational Attainment - Doctorate degree (%)
School Enrollment - Nursery, preschool (%)
School Enrollment - Kindergarten (%)
School Enrollment - Grade 1 to 4 (%)
School Enrollment - Grade 5 to 8 (%)
School Enrollment - Grade 9 to 12 (%)
School Enrollment - College undergrad (%)
School Enrollment - Graduate or professional (%)
School Enrollment - Not enrolled in school (%)
School enrollment - Public schools (%)
School enrollment - Private schools (%)
School enrollment - Not enrolled (%)
Median number of rooms in houses and condos
Median number of rooms in apartments
Housing units lacking complete plumbing facilities (%)
Housing units lacking complete kitchen facilities (%)
Density of houses
Urban houses (%)
Rural houses (%)
Households with people 60 years and over (%)
Households with people 65 years and over (%)
Households with people 75 years and over (%)
Households with one or more nonrelatives (%)
Households with no nonrelatives (%)
Population in households (%)
Family households (%)
Nonfamily households (%)
Population in families (%)
Family households with own children (%)
Median number of bedrooms in owner occupied houses
Mean number of bedrooms in owner occupied houses
Median number of bedrooms in renter occupied houses
Mean number of bedrooms in renter occupied houses
Median number of vehichles in owner occupied houses
Mean number of vehichles in owner occupied houses
Median number of vehichles in renter occupied houses
Mean number of vehichles in renter occupied houses
Mortgage status - with mortgage (%)
Mortgage status - with second mortgage (%)
Mortgage status - with home equity loan (%)
Mortgage status - with both second mortgage and home equity loan (%)
Mortgage status - without a mortgage (%)
Average family size
Average family size - White
Average family size - Black or African American
Average family size - Asian
Average family size - Hispanic or Latino
Average family size - American Indian and Alaska Native
Average family size - Multirace
Average family size - Other Race
Geographical mobility - Same house 1 year ago (%)
Geographical mobility - Moved within same county (%)
Geographical mobility - Moved from different county within same state (%)
Geographical mobility - Moved from different state (%)
Geographical mobility - Moved from abroad (%)
Place of birth - Born in state of residence (%)
Place of birth - Born in other state (%)
Place of birth - Native, outside of US (%)
Place of birth - Foreign born (%)
Housing units in structures - 1, detached (%)
Housing units in structures - 1, attached (%)
Housing units in structures - 2 (%)
Housing units in structures - 3 or 4 (%)
Housing units in structures - 5 to 9 (%)
Housing units in structures - 10 to 19 (%)
Housing units in structures - 20 to 49 (%)
Housing units in structures - 50 or more (%)
Housing units in structures - Mobile home (%)
Housing units in structures - Boat, RV, van, etc. (%)
House/condo owner moved in on average (years ago)
Renter moved in on average (years ago)
Year householder moved into unit - Moved in 1999 to March 2000 (%)
Year householder moved into unit - Moved in 1995 to 1998 (%)
Year householder moved into unit - Moved in 1990 to 1994 (%)
Year householder moved into unit - Moved in 1980 to 1989 (%)
Year householder moved into unit - Moved in 1970 to 1979 (%)
Year householder moved into unit - Moved in 1969 or earlier (%)
Means of transportation to work - Drove car alone (%)
Means of transportation to work - Carpooled (%)
Means of transportation to work - Public transportation (%)
Means of transportation to work - Bus or trolley bus (%)
Means of transportation to work - Streetcar or trolley car (%)
Means of transportation to work - Subway or elevated (%)
Means of transportation to work - Railroad (%)
Means of transportation to work - Ferryboat (%)
Means of transportation to work - Taxicab (%)
Means of transportation to work - Motorcycle (%)
Means of transportation to work - Bicycle (%)
Means of transportation to work - Walked (%)
Means of transportation to work - Other means (%)
Working at home (%)
Industry diversity
Most Common Industries - Agriculture, forestry, fishing and hunting, and mining (%)
Most Common Industries - Agriculture, forestry, fishing and hunting (%)
Most Common Industries - Mining, quarrying, and oil and gas extraction (%)
Most Common Industries - Construction (%)
Most Common Industries - Manufacturing (%)
Most Common Industries - Wholesale trade (%)
Most Common Industries - Retail trade (%)
Most Common Industries - Transportation and warehousing, and utilities (%)
Most Common Industries - Transportation and warehousing (%)
Most Common Industries - Utilities (%)
Most Common Industries - Information (%)
Most Common Industries - Finance and insurance, and real estate and rental and leasing (%)
Most Common Industries - Finance and insurance (%)
Most Common Industries - Real estate and rental and leasing (%)
Most Common Industries - Professional, scientific, and management, and administrative and waste management services (%)
Most Common Industries - Professional, scientific, and technical services (%)
Most Common Industries - Management of companies and enterprises (%)
Most Common Industries - Administrative and support and waste management services (%)
Most Common Industries - Educational services, and health care and social assistance (%)
Most Common Industries - Educational services (%)
Most Common Industries - Health care and social assistance (%)
Most Common Industries - Arts, entertainment, and recreation, and accommodation and food services (%)
Most Common Industries - Arts, entertainment, and recreation (%)
Most Common Industries - Accommodation and food services (%)
Most Common Industries - Other services, except public administration (%)
Most Common Industries - Public administration (%)
Occupation diversity
Most Common Occupations - Management, business, science, and arts occupations (%)
Most Common Occupations - Management, business, and financial occupations (%)
Most Common Occupations - Management occupations (%)
Most Common Occupations - Business and financial operations occupations (%)
Most Common Occupations - Computer, engineering, and science occupations (%)
Most Common Occupations - Computer and mathematical occupations (%)
Most Common Occupations - Architecture and engineering occupations (%)
Most Common Occupations - Life, physical, and social science occupations (%)
Most Common Occupations - Education, legal, community service, arts, and media occupations (%)
Most Common Occupations - Community and social service occupations (%)
Most Common Occupations - Legal occupations (%)
Most Common Occupations - Education, training, and library occupations (%)
Most Common Occupations - Arts, design, entertainment, sports, and media occupations (%)
Most Common Occupations - Healthcare practitioners and technical occupations (%)
Most Common Occupations - Health diagnosing and treating practitioners and other technical occupations (%)
Most Common Occupations - Health technologists and technicians (%)
Most Common Occupations - Service occupations (%)
Most Common Occupations - Healthcare support occupations (%)
Most Common Occupations - Protective service occupations (%)
Most Common Occupations - Fire fighting and prevention, and other protective service workers including supervisors (%)
Most Common Occupations - Law enforcement workers including supervisors (%)
Most Common Occupations - Food preparation and serving related occupations (%)
Most Common Occupations - Building and grounds cleaning and maintenance occupations (%)
Most Common Occupations - Personal care and service occupations (%)
Most Common Occupations - Sales and office occupations (%)
Most Common Occupations - Sales and related occupations (%)
Most Common Occupations - Office and administrative support occupations (%)
Most Common Occupations - Natural resources, construction, and maintenance occupations (%)
Most Common Occupations - Farming, fishing, and forestry occupations (%)
Most Common Occupations - Construction and extraction occupations (%)
Most Common Occupations - Installation, maintenance, and repair occupations (%)
Most Common Occupations - Production, transportation, and material moving occupations (%)
Most Common Occupations - Production occupations (%)
Most Common Occupations - Transportation occupations (%)
Most Common Occupations - Material moving occupations (%)
People in Group quarters - Institutionalized population (%)
People in Group quarters - Correctional institutions (%)
People in Group quarters - Federal prisons and detention centers (%)
People in Group quarters - Halfway houses (%)
People in Group quarters - Local jails and other confinement facilities (including police lockups) (%)
People in Group quarters - Military disciplinary barracks (%)
People in Group quarters - State prisons (%)
People in Group quarters - Other types of correctional institutions (%)
People in Group quarters - Nursing homes (%)
People in Group quarters - Hospitals/wards, hospices, and schools for the handicapped (%)
People in Group quarters - Hospitals/wards and hospices for chronically ill (%)
People in Group quarters - Hospices or homes for chronically ill (%)
People in Group quarters - Military hospitals or wards for chronically ill (%)
People in Group quarters - Other hospitals or wards for chronically ill (%)
People in Group quarters - Hospitals or wards for drug/alcohol abuse (%)
People in Group quarters - Mental (Psychiatric) hospitals or wards (%)
People in Group quarters - Schools, hospitals, or wards for the mentally retarded (%)
People in Group quarters - Schools, hospitals, or wards for the physically handicapped (%)
People in Group quarters - Institutions for the deaf (%)
People in Group quarters - Institutions for the blind (%)
People in Group quarters - Orthopedic wards and institutions for the physically handicapped (%)
People in Group quarters - Wards in general hospitals for patients who have no usual home elsewhere (%)
People in Group quarters - Wards in military hospitals for patients who have no usual home elsewhere (%)
People in Group quarters - Juvenile institutions (%)
People in Group quarters - Long-term care (%)
People in Group quarters - Homes for abused, dependent, and neglected children (%)
People in Group quarters - Residential treatment centers for emotionally disturbed children (%)
People in Group quarters - Training schools for juvenile delinquents (%)
People in Group quarters - Short-term care, detention or diagnostic centers for delinquent children (%)
People in Group quarters - Type of juvenile institution unknown (%)
People in Group quarters - Noninstitutionalized population (%)
People in Group quarters - College dormitories (includes college quarters off campus) (%)
People in Group quarters - Military quarters (%)
People in Group quarters - On base (%)
People in Group quarters - Barracks, unaccompanied personnel housing (UPH), (Enlisted/Officer), ;and similar group living quarters for military personnel (%)
People in Group quarters - Transient quarters for temporary residents (%)
People in Group quarters - Military ships (%)
People in Group quarters - Group homes (%)
People in Group quarters - Homes or halfway houses for drug/alcohol abuse (%)
People in Group quarters - Homes for the mentally ill (%)
People in Group quarters - Homes for the mentally retarded (%)
People in Group quarters - Homes for the physically handicapped (%)
People in Group quarters - Other group homes (%)
People in Group quarters - Religious group quarters (%)
People in Group quarters - Dormitories (%)
People in Group quarters - Agriculture workers' dormitories on farms (%)
People in Group quarters - Job Corps and vocational training facilities (%)
People in Group quarters - Other workers' dormitories (%)
People in Group quarters - Crews of maritime vessels (%)
People in Group quarters - Other nonhousehold living situations (%)
People in Group quarters - Other noninstitutional group quarters (%)
Residents speaking English at home (%)
Residents speaking English at home - Born in the United States (%)
Residents speaking English at home - Native, born elsewhere (%)
Residents speaking English at home - Foreign born (%)
Residents speaking Spanish at home (%)
Residents speaking Spanish at home - Born in the United States (%)
Residents speaking Spanish at home - Native, born elsewhere (%)
Residents speaking Spanish at home - Foreign born (%)
Residents speaking other language at home (%)
Residents speaking other language at home - Born in the United States (%)
Residents speaking other language at home - Native, born elsewhere (%)
Residents speaking other language at home - Foreign born (%)
Class of Workers - Employee of private company (%)
Class of Workers - Self-employed in own incorporated business (%)
Class of Workers - Private not-for-profit wage and salary workers (%)
Class of Workers - Local government workers (%)
Class of Workers - State government workers (%)
Class of Workers - Federal government workers (%)
Class of Workers - Self-employed workers in own not incorporated business and Unpaid family workers (%)
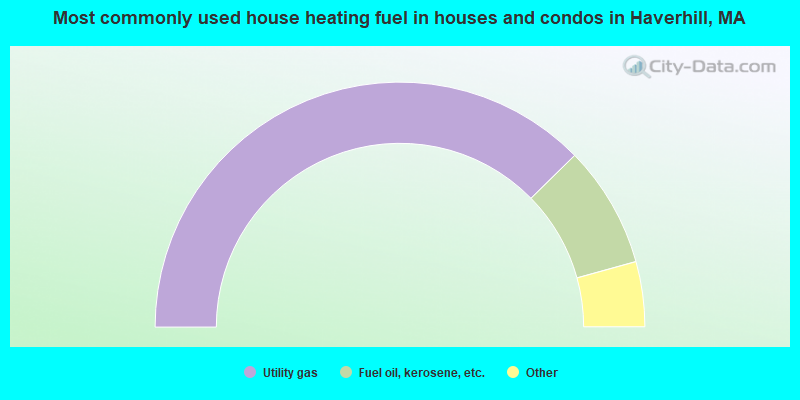
House heating fuel used in houses and condos - Utility gas (%)
House heating fuel used in houses and condos - Bottled, tank, or LP gas (%)
House heating fuel used in houses and condos - Electricity (%)
House heating fuel used in houses and condos - Fuel oil, kerosene, etc. (%)
House heating fuel used in houses and condos - Coal or coke (%)
House heating fuel used in houses and condos - Wood (%)
House heating fuel used in houses and condos - Solar energy (%)
House heating fuel used in houses and condos - Other fuel (%)
House heating fuel used in houses and condos - No fuel used (%)
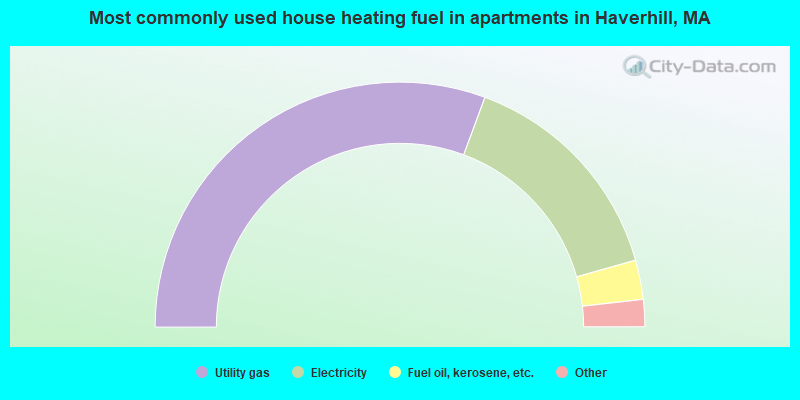
House heating fuel used in apartments - Utility gas (%)
House heating fuel used in apartments - Bottled, tank, or LP gas (%)
House heating fuel used in apartments - Electricity (%)
House heating fuel used in apartments - Fuel oil, kerosene, etc. (%)
House heating fuel used in apartments - Coal or coke (%)
House heating fuel used in apartments - Wood (%)
House heating fuel used in apartments - Solar energy (%)
House heating fuel used in apartments - Other fuel (%)
House heating fuel used in apartments - No fuel used (%)
Armed forces status - In Armed Forces (%)
Armed forces status - Civilian (%)
Armed forces status - Civilian - Veteran (%)
Armed forces status - Civilian - Nonveteran (%)
Fatal accidents locations in years 2005-2021
Fatal accidents locations in 2005
Fatal accidents locations in 2006
Fatal accidents locations in 2007
Fatal accidents locations in 2008
Fatal accidents locations in 2009
Fatal accidents locations in 2010
Fatal accidents locations in 2011
Fatal accidents locations in 2012
Fatal accidents locations in 2013
Fatal accidents locations in 2014
Fatal accidents locations in 2015
Fatal accidents locations in 2016
Fatal accidents locations in 2017
Fatal accidents locations in 2018
Fatal accidents locations in 2019
Fatal accidents locations in 2020
Fatal accidents locations in 2021
Alcohol use - People drinking some alcohol every month (%)
Alcohol use - People not drinking at all (%)
Alcohol use - Average days/month drinking alcohol
Alcohol use - Average drinks/week
Alcohol use - Average days/year people drink much
Audiometry - Average condition of hearing (%)
Audiometry - People that can hear a whisper from across a quiet room (%)
Audiometry - People that can hear normal voice from across a quiet room (%)
Audiometry - Ears ringing, roaring, buzzing (%)
Audiometry - Had a job exposure to loud noise (%)
Audiometry - Had off-work exposure to loud noise (%)
Blood Pressure & Cholesterol - Has high blood pressure (%)
Blood Pressure & Cholesterol - Checking blood pressure at home (%)
Blood Pressure & Cholesterol - Frequently checking blood cholesterol (%)
Blood Pressure & Cholesterol - Has high cholesterol level (%)
Consumer Behavior - Money monthly spent on food at supermarket/grocery store
Consumer Behavior - Money monthly spent on food at other stores
Consumer Behavior - Money monthly spent on eating out
Consumer Behavior - Money monthly spent on carryout/delivered foods
Consumer Behavior - Income spent on food at supermarket/grocery store (%)
Consumer Behavior - Income spent on food at other stores (%)
Consumer Behavior - Income spent on eating out (%)
Consumer Behavior - Income spent on carryout/delivered foods (%)
Current Health Status - General health condition (%)
Current Health Status - Blood donors (%)
Current Health Status - Has blood ever tested for HIV virus (%)
Current Health Status - Left-handed people (%)
Dermatology - People using sunscreen (%)
Diabetes - Diabetics (%)
Diabetes - Had a blood test for high blood sugar (%)
Diabetes - People taking insulin (%)
Diet Behavior & Nutrition - Diet health (%)
Diet Behavior & Nutrition - Milk product consumption (# of products/month)
Diet Behavior & Nutrition - Meals not home prepared (#/week)
Diet Behavior & Nutrition - Meals from fast food or pizza place (#/week)
Diet Behavior & Nutrition - Ready-to-eat foods (#/month)
Diet Behavior & Nutrition - Frozen meals/pizza (#/month)
Drug Use - People that ever used marijuana or hashish (%)
Drug Use - Ever used hard drugs (%)
Drug Use - Ever used any form of cocaine (%)
Drug Use - Ever used heroin (%)
Drug Use - Ever used methamphetamine (%)
Health Insurance - People covered by health insurance (%)
Kidney Conditions-Urology - Avg. # of times urinating at night
Medical Conditions - People with asthma (%)
Medical Conditions - People with anemia (%)
Medical Conditions - People with psoriasis (%)
Medical Conditions - People with overweight (%)
Medical Conditions - Elderly people having difficulties in thinking or remembering (%)
Medical Conditions - People who ever received blood transfusion (%)
Medical Conditions - People having trouble seeing even with glass/contacts (%)
Medical Conditions - People with arthritis (%)
Medical Conditions - People with gout (%)
Medical Conditions - People with congestive heart failure (%)
Medical Conditions - People with coronary heart disease (%)
Medical Conditions - People with angina pectoris (%)
Medical Conditions - People who ever had heart attack (%)
Medical Conditions - People who ever had stroke (%)
Medical Conditions - People with emphysema (%)
Medical Conditions - People with thyroid problem (%)
Medical Conditions - People with chronic bronchitis (%)
Medical Conditions - People with any liver condition (%)
Medical Conditions - People who ever had cancer or malignancy (%)
Mental Health - People who have little interest in doing things (%)
Mental Health - People feeling down, depressed, or hopeless (%)
Mental Health - People who have trouble sleeping or sleeping too much (%)
Mental Health - People feeling tired or having little energy (%)
Mental Health - People with poor appetite or overeating (%)
Mental Health - People feeling bad about themself (%)
Mental Health - People who have trouble concentrating on things (%)
Mental Health - People moving or speaking slowly or too fast (%)
Mental Health - People having thoughts they would be better off dead (%)
Oral Health - Average years since last visit a dentist
Oral Health - People embarrassed because of mouth (%)
Oral Health - People with gum disease (%)
Oral Health - General health of teeth and gums (%)
Oral Health - Average days a week using dental floss/device
Oral Health - Average days a week using mouthwash for dental problem
Oral Health - Average number of teeth
Pesticide Use - Households using pesticides to control insects (%)
Pesticide Use - Households using pesticides to kill weeds (%)
Physical Activity - People doing vigorous-intensity work activities (%)
Physical Activity - People doing moderate-intensity work activities (%)
Physical Activity - People walking or bicycling (%)
Physical Activity - People doing vigorous-intensity recreational activities (%)
Physical Activity - People doing moderate-intensity recreational activities (%)
Physical Activity - Average hours a day doing sedentary activities
Physical Activity - Average hours a day watching TV or videos
Physical Activity - Average hours a day using computer
Physical Functioning - People having limitations keeping them from working (%)
Physical Functioning - People limited in amount of work they can do (%)
Physical Functioning - People that need special equipment to walk (%)
Physical Functioning - People experiencing confusion/memory problems (%)
Physical Functioning - People requiring special healthcare equipment (%)
Prescription Medications - Average number of prescription medicines taking
Preventive Aspirin Use - Adults 40+ taking low-dose aspirin (%)
Reproductive Health - Vaginal deliveries (%)
Reproductive Health - Cesarean deliveries (%)
Reproductive Health - Deliveries resulted in a live birth (%)
Reproductive Health - Pregnancies resulted in a delivery (%)
Reproductive Health - Women breastfeeding newborns (%)
Reproductive Health - Women that had a hysterectomy (%)
Reproductive Health - Women that had both ovaries removed (%)
Reproductive Health - Women that have ever taken birth control pills (%)
Reproductive Health - Women taking birth control pills (%)
Reproductive Health - Women that have ever used Depo-Provera or injectables (%)
Reproductive Health - Women that have ever used female hormones (%)
Sexual Behavior - People 18+ that ever had sex (vaginal, anal, or oral) (%)
Sexual Behavior - Males 18+ that ever had vaginal sex with a woman (%)
Sexual Behavior - Males 18+ that ever performed oral sex on a woman (%)
Sexual Behavior - Males 18+ that ever had anal sex with a woman (%)
Sexual Behavior - Males 18+ that ever had any sex with a man (%)
Sexual Behavior - Females 18+ that ever had vaginal sex with a man (%)
Sexual Behavior - Females 18+ that ever performed oral sex on a man (%)
Sexual Behavior - Females 18+ that ever had anal sex with a man (%)
Sexual Behavior - Females 18+ that ever had any kind of sex with a woman (%)
Sexual Behavior - Average age people first had sex
Sexual Behavior - Average number of female sex partners in lifetime (males 18+)
Sexual Behavior - Average number of female vaginal sex partners in lifetime (males 18+)
Sexual Behavior - Average age people first performed oral sex on a woman (18+)
Sexual Behavior - Average number of woman performed oral sex on in lifetime (18+)
Sexual Behavior - Average number of male sex partners in lifetime (males 18+)
Sexual Behavior - Average number of male anal sex partners in lifetime (males 18+)
Sexual Behavior - Average age people first performed oral sex on a man (18+)
Sexual Behavior - Average number of male oral sex partners in lifetime (18+)
Sexual Behavior - People using protection when performing oral sex (%)
Sexual Behavior - Average number of times people have vaginal or anal sex a year
Sexual Behavior - People having sex without condom (%)
Sexual Behavior - Average number of male sex partners in lifetime (females 18+)
Sexual Behavior - Average number of male vaginal sex partners in lifetime (females 18+)
Sexual Behavior - Average number of female sex partners in lifetime (females 18+)
Sexual Behavior - Circumcised males 18+ (%)
Sleep Disorders - Average hours sleeping at night
Sleep Disorders - People that has trouble sleeping (%)
Smoking-Cigarette Use - People smoking cigarettes (%)
Taste & Smell - People 40+ having problems with smell (%)
Taste & Smell - People 40+ having problems with taste (%)
Taste & Smell - People 40+ that ever had wisdom teeth removed (%)
Taste & Smell - People 40+ that ever had tonsils teeth removed (%)
Taste & Smell - People 40+ that ever had a loss of consciousness because of a head injury (%)
Taste & Smell - People 40+ that ever had a broken nose or other serious injury to face or skull (%)
Taste & Smell - People 40+ that ever had two or more sinus infections (%)
Weight - Average height (inches)
Weight - Average weight (pounds)
Weight - Average BMI
Weight - People that are obese (%)
Weight - People that ever were obese (%)
Weight - People trying to lose weight (%)
The City-Data.com crime index weighs serious crimes and violent crimes more heavily. Higher means more crime, U.S. average is 246.1. It adjusts for the number of visitors and daily workers commuting into cities.
- means the value is smaller than the state average.
- means the value is about the same as the state average.
- means the value is bigger than the state average.
- means the value is much bigger than the state average.
Crime rate in Haverhill detailed stats: murders, rapes, robberies, assaults, burglaries, thefts, arson Officers per 1,000 residents here:
1.62Massachusetts average:
2.53
Latest news from Haverhill, MA collected exclusively by city-data.com from local newspapers, TV, and radio stations
Ancestries: Irish (12.7%), Italian (10.8%), American (5.1%), French (4.8%), French Canadian (3.7%), English (3.4%).
Current Local Time:
Land area: 33.3 square miles.
Population density: 2,015 people per square mile (low).
8,304 residents are foreign born (8.7% Latin America , 1.3% Europe ).
This city:
12.3%Massachusetts:
17.6%
Median real estate property taxes paid for housing units with mortgages in 2022: $4,603 (1.0%)Median real estate property taxes paid for housing units with no mortgage in 2022: $4,357 (1.1%)
Nearest city with pop. 200,000+: Boston, MA
Nearest city with pop. 1,000,000+: Bronx, NY
Nearest cities:
Latitude: 42.78 N, Longitude: 71.08 W
Daytime population change due to commuting: -12,017 (-17.9%)Workers who live and work in this city: 11,683 (33.6%)
Property values in Haverhill, MA
Single-family new house construction building permits:
2022: 23 buildings , average cost: $359,8002021: 35 buildings , average cost: $295,6002020: 32 buildings , average cost: $263,7002019: 44 buildings , average cost: $202,7002018: 57 buildings , average cost: $201,8002017: 42 buildings , average cost: $292,1002016: 61 buildings , average cost: $211,6002015: 23 buildings , average cost: $224,7002014: 37 buildings , average cost: $183,2002013: 35 buildings , average cost: $179,2002012: 30 buildings , average cost: $166,7002011: 27 buildings , average cost: $172,4002010: 44 buildings , average cost: $174,1002009: 33 buildings , average cost: $180,4002008: 47 buildings , average cost: $175,0002007: 69 buildings , average cost: $167,6002006: 95 buildings , average cost: $156,1002005: 105 buildings , average cost: $168,0002004: 90 buildings , average cost: $188,2002003: 98 buildings , average cost: $129,6002002: 112 buildings , average cost: $145,8002001: 102 buildings , average cost: $121,4002000: 112 buildings , average cost: $98,3001999: 167 buildings , average cost: $86,4001998: 234 buildings , average cost: $72,8001997: 248 buildings , average cost: $76,400Unemployment in December 2023: Here:
3.7%Massachusetts:
3.5%
Population change in the 1990s: +7,836 (+15.3%).
Most common occupations in Haverhill, MA (%)
Both Males Females
Cooks and food preparation workers (5.9%)
Other management occupations, except farmers and farm managers (4.9%)
Building and grounds cleaning and maintenance occupations (3.3%)
Cashiers (3.1%)
Nursing, psychiatric, and home health aides (2.6%)
Supervisors and other personal care and service workers, except child care workers (2.6%)
Other office and administrative support workers, including supervisors (2.4%)
Other management occupations, except farmers and farm managers (4.7%)
Cooks and food preparation workers (4.7%)
Building and grounds cleaning and maintenance occupations (4.6%)
Electrical equipment mechanics and other installation, maintenance, and repair workers, including supervisors (3.6%)
Driver/sales workers and truck drivers (3.1%)
Material recording, scheduling, dispatching, and distributing workers (2.9%)
Engineers (2.8%)
Cooks and food preparation workers (7.1%)
Other management occupations, except farmers and farm managers (5.1%)
Nursing, psychiatric, and home health aides (4.7%)
Cashiers (4.2%)
Registered nurses (4.2%)
Other office and administrative support workers, including supervisors (4.1%)
Waiters and waitresses (3.8%)
Tornado activity:
Haverhill-area historical tornado activity is near Massachusetts state average. It is 43% smaller than the overall U.S. average.
On 9/29/1974, a category F3 (max. wind speeds 158-206 mph) tornado 12.4 miles away from the Haverhill city center injured one person and caused between $50,000 and $500,000 in damages.
On 6/9/1953, a category F3 tornado 14.5 miles away from the city center injured 5 people and caused between $5000 and $50,000 in damages.
Earthquake activity:
Haverhill-area historical earthquake activity is significantly above Massachusetts state average. It is 73% smaller than the overall U.S. average. On 4/20/2002 at 10:50:47, a magnitude 5.3 (5.3 ML, Depth: 3.0 mi, Class: Moderate, Intensity: VI - VII) earthquake occurred 177.4 miles away from the city center On 1/19/1982 at 00:14:42, a magnitude 4.7 (4.5 MB, 4.7 MD, 4.5 LG, Class: Light, Intensity: IV - V) earthquake occurred 56.3 miles away from the city center On 10/7/1983 at 10:18:46, a magnitude 5.3 (5.1 MB, 5.3 LG, 5.1 ML) earthquake occurred 182.8 miles away from Haverhill center On 10/16/2012 at 23:12:25, a magnitude 4.7 (4.7 ML, Depth: 10.0 mi) earthquake occurred 60.7 miles away from the city center On 4/20/2002 at 10:50:47, a magnitude 5.2 (5.2 MB, 4.2 MS, 5.2 MW, 5.0 MW) earthquake occurred 177.0 miles away from Haverhill center On 8/22/1992 at 12:20:32, a magnitude 4.8 (4.8 MB, 3.8 MS, 4.7 LG, Depth: 6.2 mi) earthquake occurred 257.1 miles away from Haverhill center Magnitude types: regional Lg-wave magnitude (LG), body-wave magnitude (MB), duration magnitude (MD), local magnitude (ML), surface-wave magnitude (MS), moment magnitude (MW) Natural disasters: The number of natural disasters in Essex County (33) is a lot greater than the US average (15).Major Disasters (Presidential) Declared: 20Emergencies Declared: 13Floods: 14, Storms: 11, Hurricanes: 6, Snowstorms: 5, Winter Storms: 5, Snows: 3, Blizzards: 2, Fire: 1, Heavy Rain: 1, Snowfall: 1, Water Main Break: 1, Wind: 1 (Note: some incidents may be assigned to more than one category). Hospitals in Haverhill: HAVERHILL MUNICIPAL HOSPITAL (provides emergency services, 140 LINCOLN AVENUE) MERRIMACK VALLEY HOSPITAL (Proprietary, 140 LINCOLN AVENUE) WHITTIER REHABILITATION HOSPITAL (76 SUMMER STREET) Home Health Centers in Haverhill: HAVERHILL VNA INC (OXFORD AVE KNIPE SCHOOL) WHITTIER HOME HEALTH CARE AGENCY (145 WARD HILL) Nursing Homes in Haverhill: BAKER-KATZ NH (194 BOARDMAN ST) BAKER-KATZ SKILLED NURSING AND REHABILITATION CTR (194 BOARDMAN STREET) HALE HOSPITAL TCU - OLD (140 LINCOLN AVENUE,3RD FLOOR) HANNAH DUSTON LONG TERM HEALTH CTR (126 MONUMENT ST) HAVERHILL MANOR NURSING HOME (100 LAWRENCE ST) KENOZA MANOR CONV HOME (190 NORTH AVE) LAKEVIEW HOUSE SKLD NRSG AND RESIDENTIAL CARE FAC (87 SHATTUCK STREET) MERRIMACK VALLEY TRANSITIONAL CARE UNIT (140 LINCOLN AVENUE - 3RD FLOOR) OXFORD, THE (689 MAIN STREET) UNION MISSION NURSING HOME (150 WATER ST) Airports located in Haverhill: Amtrak station: HAVERHILL (WASHINGTON ST. @ RAILROAD SQUARE)
.
Services: ticket office.
Operable nuclear power plant near Haverhill:
14 miles: Seabrook in Seabrook, NH.
Colleges/Universities in Haverhill: Northern Essex Community College Full-time enrollment: 4,737; Location: 100 Elliott Street; Public; Website: www.necc.mass.edu/)
Northpoint Bible College Full-time enrollment: 323; Location: 320 South Main Street; Private, not-for-profit; Website: www.northpoint.edu; Offers Master's degree )
Other colleges/universities with over 2000 students near Haverhill:
Merrimack College (about 8 miles; North Andover, MA ; Full-time enrollment: 2,734)
North Shore Community College (about 14 miles; Danvers, MA ; FT enrollment: 5,195)
University of Massachusetts-Lowell (about 15 miles; Lowell, MA ; FT enrollment: 12,341)
Endicott College (about 20 miles; Beverly, MA ; FT enrollment: 4,064)
Middlesex Community College (about 20 miles; Bedford, MA ; FT enrollment: 6,040)
Salem State University (about 22 miles; Salem, MA ; FT enrollment: 8,027)
Mount Washington College (about 24 miles; Manchester, NH ; FT enrollment: 2,187)
Public high schools in Haverhill: HAVERHILL HIGH Students: 2,087, Location: 137 MONUMENT STREET, Grades: 9-12)HAVERHILL ALTERNATIVE SCHOOL Students: 44, Location: 415 PRIMROSE STREET, Grades: 6-12)TEACH Students: 39, Location: 415 PRIMROSE STREET, Grades: 2-12)WHITTIER REGIONAL VOCATIONAL Location: 115 AMESBURY LINE RD, Grades: 9-12)
Biggest public elementary/middle schools in Haverhill: TILTON Students: 635, Location: 70 GROVE STREET, Grades: KG-4)CONSENTINO MIDDLE SCHOOL Students: 598, Location: 685 WASHINGTON STREET, Grades: KG-8)PENTUCKET LAKE ELEMENTARY Students: 556, Location: 252 CONCORD STREET, Grades: KG-4)GOLDEN HILL Students: 490, Location: 140 BOARDMAN STREET, Grades: KG-4)CALEB DUSTIN HUNKING Students: 440, Location: 98 WINCHESTER STREET, Grades: 6-8)DR PAUL NETTLE Students: 392, Location: 150 BOARDMAN STREET, Grades: 5-8)JOHN G WHITTIER Students: 361, Location: 256 CONCORD STREET, Grades: 5-8)GREENLEAF Students: 250, Location: 58 CHADWICK STREET, Grades: KG-2)HILL VIEW MONTESSORI CHARTER PUBLIC SCHOOL Students: 189, Location: 75 FOUNDATION AVENUE, Grades: KG-8, Charter school )WALNUT SQUARE Students: 128, Location: 645 MAIN STREET, Grades: KG-2)Private elementary/middle school in Haverhill: ST JOSEPH SCHOOL OF ALL SAINTS PARISH Students: 291, Location: 56 OAK TER, Grades: PK-8)
See full list of schools located in Haverhill Library in Haverhill: HAVERHILL PUBLIC LIBRARY Operating income: $1,783,499; Location: 99 MAIN ST.; 175,101 books ; 14,237 audio materials ; 11,880 video materials ; 10 local licensed databases ; 34 state licensed databases ; 3 other licensed databases ; 388 print serial subscriptions )
Notable locations in Haverhill: (A) , Bradford Country Club (B) , Haverhill Country Club (C) , Haverhill Station (D) , Crystal Springs Golf Club (E) , Central Plaza (F) , Haverhill City Hall (G) , The Whittier Pavilion (H) , Haverhill Fire Department Station 9 (I) , Haverhill Fire Department Station 1 (J) , Haverhill Fire Department Fire Chief (K) , Haverhill Fire Department Station 8 (L) , Haverhill Fire Department Station 4 (M) , Haverhill Fire Department Station 3 Headquarters (N) , Haverhill Public Library (O) , Haverhill Municipal Hospital Medical Library (P) , Haverhill Fire Department Station 2 (Q) , Golden Hill School Library Library (R) , Bentley Library (S) . Display/hide their locations on the map
Shopping Centers: (1) , Haverhill Plaza Shopping Center (2) . Display/hide their locations on the map
Churches in Haverhill include: (A) , Children of Israel Church (B) , Holy Apostle Peter and Paul Church (C) , Haverhill Community Church (D) , Grace Church (E) , First Presbyterian Church (F) , First Congregational Church (G) , First Church of Christ (H) , First Baptist Church (I) . Display/hide their locations on the map
Cemeteries: (1) , Children of Israel Cemetery (2) , Hilldale Cemetery (3) , Haverhill City Cemetery (4) , Saint James Cemetery (5) , Elmwood Cemetery (6) , Linwood Cemetery (7) . Display/hide their locations on the map
Lakes and reservoirs: (A) , Frye Pond (B) , Lake Pentucket (C) , Chadwick Pond (D) , Kenoza Lake (E) , Millvale Reservoir (F) , Lake Saltonstall (G) , Little River Reservoir (H) . Display/hide their locations on the map
Streams, rivers, and creeks: (A) , Creek Brook (B) , Camp Brook (C) , Fishin Brook (D) , West Meadow Brook (E) , Johnson Creek (F) . Display/hide their locations on the map
Parks in Haverhill include: (1) , Bradford Common Historic District (2) , Winnekenni Park (3) , Riveride Park (4) , Haverhill Stadium (5) . Display/hide their locations on the map
Tourist attractions: (1) , Isabella Stuart Gardner Museum (Cultural Attractions- Events- & Facilities; 145 Essex Street) (2) . Display/hide their approximate locations on the map
Hotels: (1) , Best Western Merrimack Valley Lodge (401 Lowell Avenue) (2) , Best Western Inn (401 Lowell Avenue) (3) , Comfort Suites Hotel (106 Bank Rd) (4) . Display/hide their approximate locations on the map
Court: (1) . Display/hide its approximate location on the map
Birthplace of: Moses Hazen - General, John Greenleaf Whittier - Writer, Rob Zombie - Singer, William Francis Bartlett - Army general, George Ayres Leavitt - Book publisher, Jon Shain - Acoustic guitarist, Donald J. Atwood Jr. - Electrical engineer, Leverett Saltonstall I - Politician, Karen McCarthy - Politician, Mike Ryan (catcher) - Baseball player and coach.
Essex County has a predicted average indoor radon screening level greater than 4 pCi/L (pico curies per liter) - Highest Potential Drinking water stations with addresses in Haverhill and their reported violations in the past:
HAVERHILL WATER DEPT (Population served: 55,422, Surface water):
Past monitoring violations:
40 regular monitoring violations
Serves NH, Population served: 162, Groundwater):
Past monitoring violations:
Monitoring and Reporting (DBP) - Between JUL-01-2010 and OCT-01-2010, Contaminant: Chlorine. Follow-up actions: St Violation/Reminder Notice (OCT-27-2010), St Compliance achieved (MAR-16-2011)
Serves NH, Population served: 150, Groundwater):
Past health violations:
MCL, Average - Between OCT-2011 and DEC-2011, Contaminant: Arsenic. Follow-up actions: St Public Notif requested (NOV-22-2011), St Violation/Reminder Notice (NOV-22-2011), St Public Notif received (DEC-05-2011), St Compliance achieved (MAY-02-2012)
MCL, Average - Between JUL-2011 and SEP-2011, Contaminant: Arsenic. Follow-up actions: St Public Notif requested (JUL-29-2011), St Violation/Reminder Notice (JUL-29-2011), St Public Notif received (AUG-22-2011), St Compliance achieved (MAY-02-2012)
Past monitoring violations:
One regular monitoring violation
Serves NH, Population served: 150, Groundwater):
Past monitoring violations:
5 routine major monitoring violations
Address: 55 EMERSON ST Serves NH, Population served: 110, Groundwater):
Past monitoring violations:
Failure To Address Deficiency - In OCT-24-2010, Contaminant: GROUNDWATER RULE. Follow-up actions: St Public Notif requested (OCT-28-2010), St Violation/Reminder Notice (OCT-28-2010), St Formal NOV issued (NOV-18-2010), St Public Notif received (APR-05-2011), St Compliance achieved (APR-08-2011)
6 routine major monitoring violations
One regular monitoring violation
Serves NH, Population served: 53, Groundwater):
Past health violations:
MCL, Monthly (TCR) - Between JUL-2011 and SEP-2011, Contaminant: Coliform. Follow-up actions: St Public Notif requested (SEP-06-2011), St Violation/Reminder Notice (SEP-06-2011), St Public Notif received (OCT-06-2011), St Compliance achieved (JUN-04-2012)
Serves NH, Population served: 25, Groundwater):
Past monitoring violations:
One routine major monitoring violation
One regular monitoring violation
Drinking water stations with addresses in Haverhill that have no violations reported:
SEASONS BY THE WATER (Serves NH, Population served: 150, Primary Water Source Type: Groundwater)
THREE SONS CAMPING (Address: 5 MIDDLE RD Serves NH, Population served: 150, Primary Water Source Type: Groundwater)
Average household size: This city:
2.5 peopleMassachusetts:
2.5 people
Percentage of family households: This city:
62.8%Whole state:
63.0%
Percentage of households with unmarried partners: This city:
9.0%Whole state:
7.0%
Likely homosexual households (counted as self-reported same-sex unmarried-partner households)
Lesbian couples: 0.7% of all households Gay men: 0.5% of all households
People in group quarters in Haverhill in 2010:
618 people in nursing facilities/skilled-nursing facilities
212 people in other noninstitutional facilities
175 people in college/university student housing
158 people in emergency and transitional shelters (with sleeping facilities) for people experiencing homelessness
50 people in residential treatment centers for adults
34 people in group homes for juveniles (non-correctional)
34 people in group homes intended for adults
19 people in residential treatment centers for juveniles (non-correctional)
People in group quarters in Haverhill in 2000:
794 people in nursing homes
317 people in college dormitories (includes college quarters off campus)
121 people in other noninstitutional group quarters
35 people in orthopedic wards and institutions for the physically handicapped
28 people in homes for the mentally retarded
27 people in other nonhousehold living situations
17 people in residential treatment centers for emotionally disturbed children
15 people in homes or halfway houses for drug/alcohol abuse
14 people in religious group quarters
10 people in homes for the mentally ill
10 people in other group homes
5 people in schools, hospitals, or wards for the intellectually disabled
4 people in homes for the physically handicapped
Banks with branches in Haverhill (2011 data):
Haverhill Bank: Haverhill High Office Branch, Whitter Voc Tech High School Office, at 180 Merrimack Street, Northeast Community Bank Branch, Haverhill Branch, Main Street Haverhill Branch. Info updated 2012/01/20: Bank assets: $260.7 mil, Deposits: $219.7 mil, local headquarters , positive income , Mortgage Lending Specialization, 7 total offices
Pentucket Bank: Lowell Avenue Branch, Stadium Branch, Pentucket Bank. Info updated 2006/11/03: Bank assets: $642.8 mil, Deposits: $550.1 mil, local headquarters , positive income , Commercial Lending Specialization, 5 total offices
Sovereign Bank, National Association: Westgate Branch at 400 Lowell Avenue, branch established on 1987/08/27; Haverhill Branch at 340 Main Street, branch established on 1963/11/18. Info updated 2012/01/31: Bank assets: $78,146.9 mil, Deposits: $48,042.9 mil, headquarters in Wilmington, DE, positive income , Commercial Lending Specialization, 718 total offices , Holding Company: Banco Santander, S.A.
Bank of America, National Association: Boston/Essex Branch at 191 Merrimack Street, branch established on 1836/01/01. Info updated 2009/11/18: Bank assets: $1,451,969.3 mil, Deposits: $1,077,176.8 mil, headquarters in Charlotte, NC, positive income , 5782 total offices , Holding Company: Bank Of America Corporation
TD Bank, National Association: Family Bank Branch at 153 Merrimack Street, branch established on 1828/02/28. Info updated 2010/10/04: Bank assets: $188,912.6 mil, Deposits: $153,149.8 mil, headquarters in Wilmington, DE, positive income , 1314 total offices , Holding Company: Toronto-Dominion Bank, The
Bank of New England: Haverhill Branch at 37 Emerson Street, branch established on 2007/11/15. Info updated 2007/06/12: Bank assets: $470.7 mil, Deposits: $405.4 mil, headquarters in Salem, NH, positive income , Commercial Lending Specialization, 9 total offices
The Lowell Five Cent Savings Bank: Haverhill Branch at 750 Main Street, branch established on 2008/09/12. Info updated 2011/09/19: Bank assets: $738.4 mil, Deposits: $601.2 mil, headquarters in Lowell, MA, positive income , Mortgage Lending Specialization, 13 total offices , Holding Company: Lowell Five Bancorp Mhc
For population 15 years and over in Haverhill:
Never married: 37.5%Now married: 42.2%Separated: 2.6%Widowed: 5.0%Divorced: 12.9% For population 25 years and over in Haverhill:
High school or higher: 90.9%Bachelor's degree or higher: 32.4%Graduate or professional degree: 11.1%Unemployed: 3.8%Mean travel time to work (commute): 23.4 minutes
Education Gini index (Inequality in education) Here:
13.0Massachusetts average:
13.0
Religion statistics for Haverhill, MA (based on Essex County data)
Religion Adherents Congregations Catholic 341,970 55 Mainline Protestant 33,710 140 Evangelical Protestant 20,925 160 Other 15,882 63 Orthodox 11,590 13 Black Protestant 376 3 None 318,706 -
Source: Clifford Grammich, Kirk Hadaway, Richard Houseal, Dale E.Jones, Alexei Krindatch, Richie Stanley and Richard H.Taylor. 2012. 2010 U.S.Religion Census: Religious Congregations & Membership Study. Association of Statisticians of American Religious Bodies. Jones, Dale E., et al. 2002. Congregations and Membership in the United States 2000. Nashville, TN: Glenmary Research Center. Graphs represent county-level data
Food Environment Statistics: Number of grocery stores : 145Here :
1.98 / 10,000 pop.Massachusetts :
1.98 / 10,000 pop.
Number of supercenters and club stores : 3Here :
0.04 / 10,000 pop.State :
0.05 / 10,000 pop.
Number of convenience stores (no gas) : 144Essex County :
1.97 / 10,000 pop.Massachusetts :
2.22 / 10,000 pop.
Number of convenience stores (with gas) : 95This county :
1.30 / 10,000 pop.Massachusetts :
1.77 / 10,000 pop.
Number of full-service restaurants : 557This county :
7.60 / 10,000 pop.Massachusetts :
8.76 / 10,000 pop.
Adult diabetes rate : Essex County :
8.4%Massachusetts :
8.1%
Adult obesity rate : This county :
23.7%Massachusetts :
22.5%
Low-income preschool obesity rate : This county :
20.7%Massachusetts :
16.5%
Health and Nutrition: Healthy diet rate : This city:
49.7%Massachusetts:
50.5%
Average overall health of teeth and gums : This city:
47.3%Massachusetts:
48.0%
Average BMI : Here:
28.8Massachusetts:
28.4
People feeling badly about themselves : Haverhill:
20.9%Massachusetts:
20.7%
People not drinking alcohol at all : This city:
10.5%Massachusetts:
10.4%
Average hours sleeping at night : Overweight people : Haverhill:
34.4%Massachusetts:
33.4%
General health condition : Average condition of hearing : Here:
79.2%Massachusetts:
79.2%
More about Health and Nutrition of Haverhill, MA Residents
Local government employment and payroll (March 2022)
Function
Full-time employees
Monthly full-time payroll
Average yearly full-time wage
Part-time employees
Monthly part-time payroll
Elementary and Secondary - Instruction
1,003 $6,535,695 $78,194 122 $308,112 Elementary and Secondary - Other Total
259 $857,372 $39,724 280 $369,638 Firefighters
97 $904,872 $111,943 0 $0 Police Protection - Officers
86 $869,498 $121,325 2 $1,003 Streets and Highways
38 $276,225 $87,229 0 $0 Financial Administration
36 $255,946 $85,315 2 $2,047 Water Supply
34 $275,679 $97,298 2 $3,276 Health
32 $212,985 $79,869 21 $36,592 Sewerage
29 $232,557 $96,230 0 $0 Other and Unallocable
22 $160,363 $87,471 2 $5,227 Local Libraries
19 $112,812 $71,250 53 $66,275 Other Government Administration
19 $135,486 $85,570 28 $16,359 Parks and Recreation
12 $115,219 $115,219 6 $6,845 Welfare
12 $68,682 $68,682 38 $35,169 Housing and Community Development (Local)
7 $57,873 $99,211 2 $2,600 Police - Other
5 $25,541 $61,298 64 $40,861 Natural Resources
4 $27,397 $82,191 0 $0 Solid Waste Management
2 $8,346 $50,076 0 $0 Fire - Other
2 $11,559 $69,354 2 $4,527 Judicial and Legal
0 $0 6 $24,229
Totals for Government
1,718 $11,144,107 $77,840 630 $922,760
Haverhill government finances - Expenditure in 2021 (per resident):
Construction - Water Utilities: $8,579,000 ($127.75)
Sewerage: $3,412,000 ($50.81)General - Other: $2,385,000 ($35.52)Regular Highways: $1,916,000 ($28.53)Elementary and Secondary Education: $724,000 ($10.78)General Public Buildings: $604,000 ($8.99)Current Operations - Elementary and Secondary Education: $131,458,000 ($1957.59)
General - Other: $37,252,000 ($554.73)Police Protection: $13,275,000 ($197.68)Local Fire Protection: $11,475,000 ($170.88)Sewerage: $8,155,000 ($121.44)Water Utilities: $6,649,000 ($99.01)Solid Waste Management: $4,955,000 ($73.79)Regular Highways: $4,606,000 ($68.59)Housing and Community Development: $2,155,000 ($32.09)Financial Administration: $1,956,000 ($29.13)Libraries: $1,432,000 ($21.32)Parks and Recreation: $952,000 ($14.18)Central Staff Services: $818,000 ($12.18)Public Welfare - Other: $678,000 ($10.10)Health - Other: $480,000 ($7.15)Protective Inspection and Regulation - Other: $399,000 ($5.94)General Public Buildings: $371,000 ($5.52)Judicial and Legal Services: $296,000 ($4.41)Parking Facilities: $288,000 ($4.29)General - Interest on Debt: $2,500,000 ($37.23)
Intergovernmental to Local - Other - Elementary and Secondary Education: $10,283,000 ($153.13)
Other - Health - Other: $154,000 ($2.29)Intergovernmental to State - Transit Utilities: $727,000 ($10.83)
General - Other: $120,000 ($1.79)Other Capital Outlay - Elementary and Secondary Education: $3,379,000 ($50.32)
Total Salaries and Wages: $81,600,000 ($1215.14)
Water Utilities - Interest on Debt: $938,000 ($13.97)
Haverhill government finances - Revenue in 2021 (per resident):
Charges - Sewerage: $13,113,000 ($195.27)
Other: $1,649,000 ($24.56)Elementary and Secondary Education School Lunch: $1,224,000 ($18.23)Elementary and Secondary Education - Other: $90,000 ($1.34)Parking Facilities: $53,000 ($0.79)Federal Intergovernmental - Other: $14,971,000 ($222.94)
Education: $3,698,000 ($55.07)Housing and Community Development: $1,845,000 ($27.47)Local Intergovernmental - Education: $252,000 ($3.75)
Miscellaneous - General Revenue - Other: $14,567,000 ($216.92)
Interest Earnings: $276,000 ($4.11)Fines and Forfeits: $234,000 ($3.48)Donations From Private Sources: $16,000 ($0.24)Revenue - Water Utilities: $9,418,000 ($140.25)
State Intergovernmental - Education: $78,381,000 ($1167.20)
General Local Government Support: $13,128,000 ($195.49)Other: $2,495,000 ($37.15)Public Welfare: $778,000 ($11.59)Highways: $73,000 ($1.09)Tax - Property: $121,407,000 ($1807.92)
Other License: $3,043,000 ($45.31)Other Selective Sales: $2,354,000 ($35.05)
Haverhill government finances - Debt in 2021 (per resident):
Long Term Debt - Outstanding Unspecified Public Purpose: $132,263,000 ($1969.58)
Beginning Outstanding - Unspecified Public Purpose: $121,574,000 ($1810.40)Issue, Unspecified Public Purpose: $18,692,000 ($278.35)Retired Unspecified Public Purpose: $8,004,000 ($119.19)Short Term Debt Outstanding - Beginning: $9,468,000 ($140.99)
End of Fiscal Year: $6,622,000 ($98.61)
Haverhill government finances - Cash and Securities in 2021 (per resident):
Bond Funds - Cash and Securities: $2,430,000 ($36.19)
Other Funds - Cash and Securities: $57,560,000 ($857.15)
5.09% of this county's 2021 resident taxpayers lived in other counties in 2020 ($96,821 average adjusted gross income )
Here:
5.09%Massachusetts average:
6.35%
0.01% of residents moved from foreign countries ($21 average AGI )Essex County:
0.01%Massachusetts average:
0.01%
Top counties from which taxpayers relocated into this county between 2020 and 2021:
5.47% of this county's 2020 resident taxpayers moved to other counties in 2021 ($95,440 average adjusted gross income )
Here:
5.47%Massachusetts average:
7.18%
0.01% of residents moved to foreign countries ($53 average AGI )Essex County:
0.01%Massachusetts average:
0.02%
Top counties to which taxpayers relocated from this county between 2020 and 2021:
Businesses in Haverhill, MA
Name Count Name Count
7-Eleven 1 Marshalls 1 Advance Auto Parts 1 MasterBrand Cabinets 5 Applebee's 1 McDonald's 2 Ashley Furniture 1 Nike 1 Best Western 1 Payless 1 Blockbuster 1 RadioShack 1 Burger King 1 Rite Aid 2 CVS 4 Sprint Nextel 1 Chevrolet 1 Starbucks 2 Circle K 1 Subway 3 Comfort Suites 1 T-Mobile 1 Domino's Pizza 1 Taco Bell 2 Dunkin Donuts 8 Target 1 Fashion Bug 1 Toyota 1 FedEx 6 True Value 1 Ford 1 U-Haul 4 GNC 2 UPS 4 H&R Block 1 Verizon Wireless 1 Jones New York 3 Walgreens 2 KFC 1 Wendy's 1 Little Caesars Pizza 1 YMCA 1 Lowe's 1
Strongest AM radio stations in Haverhill:
WCCM (1490 AM; 1 kW; HAVERHILL, MA; Owner: COSTA-EAGLE RADIO VENTURES LTD P/SHI)
WRKO (680 AM; 50 kW; BOSTON, MA; Owner: ENTERCOM BOSTON LICENSE, LLC)
WDER (1320 AM; 10 kW; DERRY, NH; Owner: BLOUNT COMMUNICATIONS, INC. OF NH)
WCEC (1110 AM; daytime; 5 kW; SALEM, NH; Owner: COSTA-EAGLE RADIO VENTURES LTD PARTNERSHIP)
WEEI (850 AM; 50 kW; BOSTON, MA; Owner: ENTERCOM BOSTON LICENSE, LLC)
WWZN (1510 AM; 50 kW; BOSTON, MA; Owner: ROSE CITY RADIO CORPORATION)
WBZ (1030 AM; 50 kW; BOSTON, MA; Owner: INFINITY BROADCASTING OPERATIONS, INC.)
WKOX (1200 AM; 50 kW; FRAMINGHAM, MA; Owner: CAPSTAR TX LIMITED PARTNERSHIP)
WBIX (1060 AM; 40 kW; NATICK, MA; Owner: LANGER BROADCASTING CORPORATION)
WRCA (1330 AM; 25 kW; WALTHAM, MA; Owner: WRCA LICENSE, LLC)
WCAP (980 AM; 5 kW; LOWELL, MA; Owner: NORTHEAST RADIO, INC.)
WCRN (830 AM; 50 kW; WORCESTER, MA; Owner: CARTER BROADCASTING CORPORATION)
WAMG (890 AM; 25 kW; DEDHAM, MA; Owner: MEGA COMMUNICATIONS OF DEDHAM LICENSEE, LLC)
Strongest FM radio stations in Haverhill:
WXRV (92.5 FM; HAVERHILL, MA; Owner: BEANPOT BROADCASTING CORP.)
WKLB-FM (99.5 FM; LOWELL, MA; Owner: GREATER BOSTON RADIO, INC.)
W227AM (93.3 FM; ANDOVER, MA; Owner: GREATER BOSTON RADIO, INC.)
WNEF (91.7 FM; NEWBURYPORT, MA; Owner: UNIVERSITY OF MASSACHUSETTS)
WQSX (93.7 FM; LAWRENCE, MA; Owner: ENTERCOM BOSTON LICENSE, LLC)
WHOB (106.3 FM; NASHUA, NH; Owner: TELE-MEDIA COMPANY OF NEW HAMPSHIRE, L.L.C.)
WXKS-FM (107.9 FM; MEDFORD, MA; Owner: AMFM RADIO LICENSES, L.L.C.)
WMJX (106.7 FM; BOSTON, MA; Owner: GREATER BOSTON RADIO, INC.)
WSAK (102.1 FM; HAMPTON, NH; Owner: CITADEL BROADCASTING COMPANY)
WGIR-FM (101.1 FM; MANCHESTER, NH; Owner: CAPSTAR TX LIMITED PARTNERSHIP)
WBMX (98.5 FM; BOSTON, MA; Owner: INFINITY RADIO OPERATIONS INC.)
WJMN (94.5 FM; BOSTON, MA; Owner: AMFM RADIO LICENSES, L.L.C.)
WQLL (96.5 FM; BEDFORD, NH; Owner: SAGA COMMUNICATIONS OF NEW ENGLAND, LLC)
WCRB (102.5 FM; WALTHAM, MA; Owner: CHARLES RIVER BROADCASTING WCRB LICE)
WTKK (96.9 FM; BOSTON, MA; Owner: GREATER BOSTON RADIO, INC.)
WROR-FM (105.7 FM; FRAMINGHAM, MA; Owner: GREATER BOSTON RADIO, INC.)
WBOS (92.9 FM; BROOKLINE, MA; Owner: GREATER BOSTON RADIO, INC.)
WLMW (90.7 FM; MANCHESTER, NH; Owner: KNOWLEDGE FOR LIFE)
WZID (95.7 FM; MANCHESTER, NH; Owner: SAGA COMMUNICATIONS OF NEW ENGLAND, LLC)
WFEX (92.1 FM; PETERBOROUGH, NH; Owner: FNX BROADCASTING OF NEW HAMPSHIRE LLC)
TV broadcast stations around Haverhill:
WFXZ-CA (Channel 24; BOSTON, MA; Owner: BOSTON BROADCASTING CORP.)
WHDN-LP (Channel 26; BOSTON, MA; Owner: GUENTER MARKSTEINER)
WCVB-TV (Channel 5; BOSTON, MA; Owner: WCVB HEARST-ARGYLE TV, INC.)
WGBH-TV (Channel 2; BOSTON, MA; Owner: WGBH EDUCATIONAL FOUNDATION)
WHDH-TV (Channel 7; BOSTON, MA; Owner: WHDH-TV)
WMFP (Channel 62; LAWRENCE, MA; Owner: WSAH LICENSE, INC.)
WBZ-TV (Channel 4; BOSTON, MA; Owner: VIACOM INC.)
WGBX-TV (Channel 44; BOSTON, MA; Owner: WGBH EDUCATIONAL FOUNDATION)
WSBK-TV (Channel 38; BOSTON, MA; Owner: VIACOM INC.)
WNDS (Channel 50; DERRY, NH; Owner: CTV OF DERRY, INC)
WLVI-TV (Channel 56; CAMBRIDGE, MA; Owner: WLVI, INC.)
WUTF (Channel 66; MARLBOROUGH, MA; Owner: TELEFUTURA BOSTON LLC)
WBPX (Channel 68; BOSTON, MA; Owner: PAXSON BOSTON-68 LICENSE, INC.)
WFXT (Channel 25; BOSTON, MA; Owner: FOX TELEVISION STATIONS INC.)
WMEA-TV (Channel 26; BIDDEFORD, ME; Owner: MAINE PUBLIC BROADCASTING CORP.)
WTMU-LP (Channel 32; BOSTON, MA; Owner: ZGS BOSTON, INC.)
WCEA-LP (Channel 58; BOSTON, MA; Owner: CHANNEL 19 TV CORPORATION)
WUNI (Channel 27; WORCESTER, MA; Owner: ENTRAVISION HOLDINGS, LLC)
W40BO (Channel 40; BOSTON, MA; Owner: PAXSON COMMUNICATIONS LPTV, INC.)
WENH-TV (Channel 11; DURHAM, NH; Owner: UNIVERSITY OF NEW HAMPSHIRE)
Medal of Honor Recipients
Medal of Honor Recipients born in Haverhill: John Mapes Adams, Walter Newell Hill, William H. Howe.
National Bridge Inventory (NBI) Statistics 49 Number of bridges1,109ft / 338m Total length $315,046,000 Total costs1,581,540 Total average daily traffic120,134 Total average daily truck traffic
New bridges - historical statistics
4 Before 1900 2 1900-1909 1 1920-1929 39 1960-1969 2 2010-2019 1 2020-2022
See full National Bridge Inventory statistics for Haverhill, MA
Home Mortgage Disclosure Act Aggregated Statistics For Year 2009(Based on 14 full tracts) A) FHA, FSA/RHS & VA B) Conventional C) Refinancings D) Home Improvement Loans E) Loans on Dwellings For 5+ Families F) Non-occupant Loans on Number Average Value Number Average Value Number Average Value Number Average Value Number Average Value Number Average Value
LOANS ORIGINATED 263 $213,985 351 $170,311 1,295 $205,130 97 $73,742 11 $834,273 74 $143,797 APPLICATIONS APPROVED, NOT ACCEPTED 12 $217,250 26 $162,231 88 $235,966 8 $85,375 0 $0 6 $137,667 APPLICATIONS DENIED 36 $196,194 80 $138,688 448 $216,902 36 $88,139 2 $300,000 34 $156,147 APPLICATIONS WITHDRAWN 29 $200,862 37 $151,919 275 $218,204 11 $153,545 0 $0 18 $164,111 FILES CLOSED FOR INCOMPLETENESS 4 $153,000 13 $139,077 58 $234,000 2 $132,500 1 $252,000 4 $185,500
Aggregated Statistics For Year 2008(Based on 14 full tracts) A) FHA, FSA/RHS & VA B) Conventional C) Refinancings D) Home Improvement Loans E) Loans on Dwellings For 5+ Families F) Non-occupant Loans on Number Average Value Number Average Value Number Average Value Number Average Value Number Average Value Number Average Value
LOANS ORIGINATED 188 $223,707 461 $184,115 724 $203,215 160 $63,181 9 $663,778 149 $179,517 APPLICATIONS APPROVED, NOT ACCEPTED 16 $218,562 70 $186,557 109 $207,679 24 $43,875 3 $416,667 31 $136,710 APPLICATIONS DENIED 39 $213,897 114 $178,079 403 $221,293 95 $70,095 2 $230,000 52 $145,327 APPLICATIONS WITHDRAWN 13 $223,231 49 $192,388 164 $215,177 22 $99,136 0 $0 20 $182,100 FILES CLOSED FOR INCOMPLETENESS 3 $229,667 19 $223,053 47 $221,298 3 $222,000 1 $600,000 5 $207,600
Aggregated Statistics For Year 2007(Based on 14 full tracts) A) FHA, FSA/RHS & VA B) Conventional C) Refinancings D) Home Improvement Loans E) Loans on Dwellings For 5+ Families F) Non-occupant Loans on G) Loans On Manufactured Number Average Value Number Average Value Number Average Value Number Average Value Number Average Value Number Average Value Number Average Value
LOANS ORIGINATED 29 $252,828 867 $185,344 1,126 $193,616 218 $72,968 26 $280,962 125 $192,760 2 $48,000 APPLICATIONS APPROVED, NOT ACCEPTED 2 $218,500 122 $172,361 212 $205,292 19 $55,737 5 $295,600 22 $150,955 0 $0 APPLICATIONS DENIED 10 $251,300 167 $175,754 863 $224,010 141 $88,383 7 $354,143 66 $196,955 2 $135,500 APPLICATIONS WITHDRAWN 5 $238,200 81 $186,630 362 $204,608 24 $73,833 1 $248,000 23 $158,478 0 $0 FILES CLOSED FOR INCOMPLETENESS 1 $277,000 28 $238,321 133 $246,481 3 $144,667 0 $0 2 $297,000 0 $0
Aggregated Statistics For Year 2006(Based on 14 full tracts) A) FHA, FSA/RHS & VA B) Conventional C) Refinancings D) Home Improvement Loans E) Loans on Dwellings For 5+ Families F) Non-occupant Loans on G) Loans On Manufactured Number Average Value Number Average Value Number Average Value Number Average Value Number Average Value Number Average Value Number Average Value
LOANS ORIGINATED 36 $253,500 1,314 $173,097 1,787 $190,441 325 $71,612 10 $1,833,500 171 $197,298 0 $0 APPLICATIONS APPROVED, NOT ACCEPTED 3 $269,667 154 $161,455 280 $204,293 37 $79,270 0 $0 33 $201,939 0 $0 APPLICATIONS DENIED 9 $247,000 326 $167,344 1,023 $225,435 187 $73,524 7 $342,571 65 $192,508 5 $167,400 APPLICATIONS WITHDRAWN 0 $0 124 $188,226 674 $218,920 31 $146,677 4 $727,250 38 $189,789 4 $178,750 FILES CLOSED FOR INCOMPLETENESS 1 $288,000 31 $186,968 126 $233,944 7 $138,571 0 $0 7 $235,000 0 $0
Aggregated Statistics For Year 2005(Based on 14 full tracts) A) FHA, FSA/RHS & VA B) Conventional C) Refinancings D) Home Improvement Loans E) Loans on Dwellings For 5+ Families F) Non-occupant Loans on G) Loans On Manufactured Number Average Value Number Average Value Number Average Value Number Average Value Number Average Value Number Average Value Number Average Value
LOANS ORIGINATED 33 $243,152 1,704 $176,026 2,123 $203,036 279 $104,699 12 $458,417 233 $190,094 4 $124,500 APPLICATIONS APPROVED, NOT ACCEPTED 4 $268,500 130 $170,577 249 $211,120 36 $65,194 1 $285,000 16 $175,812 0 $0 APPLICATIONS DENIED 11 $201,000 317 $171,656 1,006 $218,183 165 $107,794 5 $361,400 82 $192,037 7 $115,143 APPLICATIONS WITHDRAWN 5 $258,400 306 $185,183 862 $220,833 65 $191,215 2 $178,000 72 $221,667 0 $0 FILES CLOSED FOR INCOMPLETENESS 0 $0 49 $167,673 114 $227,439 7 $63,143 1 $455,000 8 $223,375 1 $250,000
Aggregated Statistics For Year 2004(Based on 14 full tracts) A) FHA, FSA/RHS & VA B) Conventional C) Refinancings D) Home Improvement Loans E) Loans on Dwellings For 5+ Families F) Non-occupant Loans on G) Loans On Manufactured Number Average Value Number Average Value Number Average Value Number Average Value Number Average Value Number Average Value Number Average Value
LOANS ORIGINATED 68 $251,662 1,566 $184,736 2,304 $190,150 295 $100,332 21 $233,333 243 $190,123 3 $17,333 APPLICATIONS APPROVED, NOT ACCEPTED 3 $313,000 137 $202,511 260 $192,654 49 $66,918 0 $0 22 $184,818 0 $0 APPLICATIONS DENIED 10 $247,000 224 $182,589 673 $191,544 169 $58,024 5 $246,000 66 $185,894 3 $103,333 APPLICATIONS WITHDRAWN 9 $207,778 155 $177,535 676 $195,880 56 $80,696 8 $183,500 32 $166,406 0 $0 FILES CLOSED FOR INCOMPLETENESS 0 $0 49 $157,408 297 $205,094 12 $124,417 0 $0 15 $164,000 0 $0
Aggregated Statistics For Year 2003(Based on 14 full tracts) A) FHA, FSA/RHS & VA B) Conventional C) Refinancings D) Home Improvement Loans E) Loans on Dwellings For 5+ Families F) Non-occupant Loans on Number Average Value Number Average Value Number Average Value Number Average Value Number Average Value Number Average Value
LOANS ORIGINATED 123 $233,268 1,191 $188,720 4,874 $167,175 127 $41,008 30 $372,367 304 $168,711 APPLICATIONS APPROVED, NOT ACCEPTED 8 $204,125 93 $181,204 536 $163,789 48 $40,271 2 $423,000 36 $159,361 APPLICATIONS DENIED 13 $208,462 149 $184,188 1,005 $168,525 118 $53,093 2 $352,500 67 $162,851 APPLICATIONS WITHDRAWN 8 $241,125 110 $190,864 678 $174,794 64 $50,859 4 $352,250 37 $158,865 FILES CLOSED FOR INCOMPLETENESS 0 $0 12 $239,083 109 $181,367 7 $35,000 0 $0 6 $146,500
Aggregated Statistics For Year 2002(Based on 8 full tracts) A) FHA, FSA/RHS & VA B) Conventional C) Refinancings D) Home Improvement Loans E) Loans on Dwellings For 5+ Families F) Non-occupant Loans on Number Average Value Number Average Value Number Average Value Number Average Value Number Average Value Number Average Value
LOANS ORIGINATED 91 $208,824 559 $156,916 1,541 $146,597 88 $46,136 11 $189,727 269 $148,584 APPLICATIONS APPROVED, NOT ACCEPTED 1 $133,000 51 $142,510 206 $140,956 25 $29,440 0 $0 35 $151,086 APPLICATIONS DENIED 10 $222,000 62 $163,000 285 $138,404 77 $35,662 3 $396,667 40 $156,950 APPLICATIONS WITHDRAWN 7 $144,000 47 $168,723 247 $143,619 26 $40,154 0 $0 24 $142,000 FILES CLOSED FOR INCOMPLETENESS 2 $216,000 14 $150,429 83 $152,687 1 $30,000 1 $210,000 5 $135,400
Aggregated Statistics For Year 2001(Based on 8 full tracts) A) FHA, FSA/RHS & VA B) Conventional C) Refinancings D) Home Improvement Loans E) Loans on Dwellings For 5+ Families F) Non-occupant Loans on Number Average Value Number Average Value Number Average Value Number Average Value Number Average Value Number Average Value
LOANS ORIGINATED 110 $164,936 457 $135,961 1,249 $130,854 73 $28,301 10 $472,500 126 $141,722 APPLICATIONS APPROVED, NOT ACCEPTED 15 $155,667 43 $130,953 138 $109,594 22 $40,591 1 $140,000 24 $143,958 APPLICATIONS DENIED 13 $151,846 58 $122,914 344 $107,703 95 $18,568 3 $213,000 33 $129,091 APPLICATIONS WITHDRAWN 15 $134,533 45 $139,133 251 $122,538 46 $38,848 1 $107,000 16 $128,438 FILES CLOSED FOR INCOMPLETENESS 5 $143,400 8 $77,375 38 $121,816 2 $20,500 1 $199,000 3 $56,000
Aggregated Statistics For Year 2000(Based on 8 full tracts) A) FHA, FSA/RHS & VA B) Conventional C) Refinancings D) Home Improvement Loans E) Loans on Dwellings For 5+ Families F) Non-occupant Loans on Number Average Value Number Average Value Number Average Value Number Average Value Number Average Value Number Average Value
LOANS ORIGINATED 134 $140,493 390 $119,679 351 $97,544 79 $22,987 7 $1,357,714 73 $95,973 APPLICATIONS APPROVED, NOT ACCEPTED 10 $137,000 36 $118,389 73 $85,000 39 $26,333 0 $0 16 $78,875 APPLICATIONS DENIED 12 $137,417 87 $101,862 225 $76,822 97 $24,866 1 $130,000 25 $88,160 APPLICATIONS WITHDRAWN 8 $140,125 45 $104,444 174 $87,908 19 $41,684 2 $107,500 15 $92,133 FILES CLOSED FOR INCOMPLETENESS 3 $118,667 3 $115,000 40 $104,825 0 $0 0 $0 1 $112,000
Aggregated Statistics For Year 1999(Based on 11 full tracts) A) FHA, FSA/RHS & VA B) Conventional C) Refinancings D) Home Improvement Loans E) Loans on Dwellings For 5+ Families F) Non-occupant Loans on Number Average Value Number Average Value Number Average Value Number Average Value Number Average Value Number Average Value
LOANS ORIGINATED 270 $122,164 952 $118,590 1,170 $106,262 107 $27,165 22 $409,144 123 $83,691 APPLICATIONS APPROVED, NOT ACCEPTED 12 $135,143 66 $113,738 185 $94,267 53 $28,336 2 $230,000 16 $86,002 APPLICATIONS DENIED 27 $119,537 151 $106,619 331 $90,782 133 $25,403 1 $184,000 40 $75,550 APPLICATIONS WITHDRAWN 21 $130,212 104 $112,195 250 $91,141 28 $36,508 3 $2,017,980 16 $68,064 FILES CLOSED FOR INCOMPLETENESS 9 $130,546 14 $103,661 75 $106,733 1 $111,000 0 $0 6 $95,798
Detailed mortgage data for all 14 tracts in Haverhill, MA
Private Mortgage Insurance Companies Aggregated Statistics For Year 2009(Based on 14 full tracts) A) Conventional B) Refinancings C) Non-occupant Loans on Number Average Value Number Average Value Number Average Value
LOANS ORIGINATED 51 $226,863 44 $256,341 1 $92,000 APPLICATIONS APPROVED, NOT ACCEPTED 26 $207,192 16 $249,438 2 $107,000 APPLICATIONS DENIED 11 $175,455 13 $276,923 0 $0 APPLICATIONS WITHDRAWN 3 $256,333 4 $329,000 0 $0 FILES CLOSED FOR INCOMPLETENESS 0 $0 1 $233,000 0 $0
Aggregated Statistics For Year 2008(Based on 14 full tracts) A) Conventional B) Refinancings C) Non-occupant Loans on Number Average Value Number Average Value Number Average Value
LOANS ORIGINATED 165 $221,745 67 $271,836 1 $153,000 APPLICATIONS APPROVED, NOT ACCEPTED 79 $212,987 34 $284,824 4 $210,250 APPLICATIONS DENIED 18 $235,333 11 $333,000 4 $219,500 APPLICATIONS WITHDRAWN 11 $243,182 5 $271,000 0 $0 FILES CLOSED FOR INCOMPLETENESS 6 $204,000 0 $0 0 $0
Aggregated Statistics For Year 2007(Based on 14 full tracts) A) Conventional B) Refinancings C) Non-occupant Loans on Number Average Value Number Average Value Number Average Value
LOANS ORIGINATED 257 $228,183 101 $270,941 9 $214,444 APPLICATIONS APPROVED, NOT ACCEPTED 38 $241,684 31 $265,710 3 $163,667 APPLICATIONS DENIED 4 $160,000 4 $300,750 0 $0 APPLICATIONS WITHDRAWN 12 $256,667 11 $304,091 0 $0 FILES CLOSED FOR INCOMPLETENESS 0 $0 0 $0 0 $0
Aggregated Statistics For Year 2006(Based on 14 full tracts) A) Conventional B) Refinancings C) Non-occupant Loans on D) Loans On Manufactured Number Average Value Number Average Value Number Average Value Number Average Value
LOANS ORIGINATED 147 $233,497 75 $279,920 3 $286,333 0 $0 APPLICATIONS APPROVED, NOT ACCEPTED 28 $241,643 36 $297,306 1 $81,000 0 $0 APPLICATIONS DENIED 1 $247,000 3 $287,667 0 $0 1 $247,000 APPLICATIONS WITHDRAWN 4 $286,000 4 $317,500 0 $0 0 $0 FILES CLOSED FOR INCOMPLETENESS 1 $290,000 1 $261,000 0 $0 0 $0
Aggregated Statistics For Year 2005(Based on 14 full tracts) A) Conventional B) Refinancings C) Non-occupant Loans on Number Average Value Number Average Value Number Average Value
LOANS ORIGINATED 168 $235,071 63 $263,889 6 $244,333 APPLICATIONS APPROVED, NOT ACCEPTED 24 $218,542 26 $238,500 2 $179,000 APPLICATIONS DENIED 3 $227,000 4 $308,500 1 $315,000 APPLICATIONS WITHDRAWN 11 $279,273 5 $279,800 2 $277,000 FILES CLOSED FOR INCOMPLETENESS 0 $0 0 $0 0 $0
Aggregated Statistics For Year 2004(Based on 14 full tracts) A) Conventional B) Refinancings C) Non-occupant Loans on D) Loans On Manufactured Number Average Value Number Average Value Number Average Value Number Average Value
LOANS ORIGINATED 240 $223,742 77 $251,221 16 $228,562 1 $295,000 APPLICATIONS APPROVED, NOT ACCEPTED 48 $234,875 24 $260,125 1 $212,000 0 $0 APPLICATIONS DENIED 4 $220,000 2 $306,000 0 $0 0 $0 APPLICATIONS WITHDRAWN 14 $197,786 3 $205,667 1 $205,000 0 $0 FILES CLOSED FOR INCOMPLETENESS 4 $149,250 0 $0 0 $0 0 $0
Aggregated Statistics For Year 2003(Based on 14 full tracts) A) Conventional B) Refinancings C) Non-occupant Loans on Number Average Value Number Average Value Number Average Value
LOANS ORIGINATED 376 $210,492 155 $217,994 16 $236,125 APPLICATIONS APPROVED, NOT ACCEPTED 73 $230,932 88 $219,239 6 $230,000 APPLICATIONS DENIED 4 $281,750 6 $258,167 0 $0 APPLICATIONS WITHDRAWN 15 $224,733 14 $231,000 1 $266,000 FILES CLOSED FOR INCOMPLETENESS 0 $0 0 $0 0 $0
Aggregated Statistics For Year 2002(Based on 8 full tracts) A) Conventional B) Refinancings C) Non-occupant Loans on Number Average Value Number Average Value Number Average Value
LOANS ORIGINATED 193 $176,845 65 $184,938 25 $177,280 APPLICATIONS APPROVED, NOT ACCEPTED 23 $185,739 13 $173,385 6 $169,500 APPLICATIONS DENIED 5 $175,600 7 $126,000 2 $186,000 APPLICATIONS WITHDRAWN 12 $178,917 3 $162,667 4 $206,250 FILES CLOSED FOR INCOMPLETENESS 0 $0 0 $0 0 $0
Aggregated Statistics For Year 2001(Based on 8 full tracts) A) Conventional B) Refinancings C) Non-occupant Loans on Number Average Value Number Average Value Number Average Value
LOANS ORIGINATED 183 $150,934 55 $161,491 24 $158,333 APPLICATIONS APPROVED, NOT ACCEPTED 24 $135,458 18 $147,833 4 $105,250 APPLICATIONS DENIED 7 $130,714 1 $125,000 2 $121,000 APPLICATIONS WITHDRAWN 5 $152,400 2 $156,000 0 $0 FILES CLOSED FOR INCOMPLETENESS 1 $118,000 0 $0 0 $0
Aggregated Statistics For Year 2000(Based on 8 full tracts) A) Conventional B) Refinancings C) Non-occupant Loans on Number Average Value Number Average Value Number Average Value
LOANS ORIGINATED 180 $130,889 40 $129,800 19 $119,526 APPLICATIONS APPROVED, NOT ACCEPTED 11 $114,455 5 $145,600 1 $106,000 APPLICATIONS DENIED 14 $101,071 1 $60,000 6 $78,000 APPLICATIONS WITHDRAWN 0 $0 1 $134,000 0 $0 FILES CLOSED FOR INCOMPLETENESS 1 $49,000 0 $0 1 $49,000
Aggregated Statistics For Year 1999(Based on 11 full tracts) A) Conventional B) Refinancings C) Non-occupant Loans on Number Average Value Number Average Value Number Average Value
LOANS ORIGINATED 397 $133,222 95 $134,285 18 $109,856 APPLICATIONS APPROVED, NOT ACCEPTED 34 $155,158 22 $140,707 1 $121,000 APPLICATIONS DENIED 20 $109,936 3 $147,630 2 $81,775 APPLICATIONS WITHDRAWN 11 $116,432 5 $144,210 0 $0 FILES CLOSED FOR INCOMPLETENESS 3 $144,420 5 $125,522 0 $0
Fire-safe hotels and motels in Haverhill, Massachusetts:
Hampton Inn-Haverhill, 106 Bank Rd, Haverhill, Massachusetts 01832 Phone: (978) 374-7755, Fax: (978) 521-1894
Best Western Merrimack Valley, 401 Lowell St, Haverhill, Massachusetts 01832 Phone: (978) 373-1511, Fax: (978) 373-1517
All 2 fire-safe hotels and motels in Haverhill, Massachusetts
Most common first names in Haverhill, MA among deceased individuals Name Count Lived (average)
Mary 758 82.0 years John 646 75.2 years Joseph 431 75.2 years William 389 76.4 years Helen 327 81.6 years George 323 76.7 years James 291 74.6 years Charles 250 76.9 years Margaret 240 81.0 years Robert 231 69.4 years
Most common last names in Haverhill, MA among deceased individuals Last name Count Lived (average)
Smith 128 79.1 years Murphy 83 78.5 years Brown 80 76.3 years Sullivan 79 78.8 years Comeau 73 79.3 years Johnson 63 79.1 years Collins 62 78.8 years White 56 78.1 years Mccarthy 53 75.9 years Ryan 50 77.3 years
Haverhill compared to Massachusetts state average:
Unemployed percentage significantly below state average. Hispanic race population percentage above state average. Length of stay since moving in below state average.
#41 on the list of "Top 101 cities with the largest percentage of likely lesbian couples (counted as self-reported female-female unmarried-partner households) (population 50,000+)"
#47 on the list of "Top 101 cities with the smallest precipitation differences during a year (population 50,000+)"
#61 on the list of "Top 101 cities with the highest average wind speeds (population 50,000+)"
#66 on the list of "Top 101 cities with largest percentage of females in occupations: construction and extraction occupations (population 50,000+)"
#68 on the list of "Top 101 cities with the largest percentage of likely homosexual households (counted as self-reported same-sex unmarried-partner households) (population 50,000+)"
#68 on the list of "Top 101 cities with the most people born in the same U.S. state as the city (population 50,000+)"
#74 on the list of "Top 101 cities with the highest number of assaults per 100,000 residents, excludes tourist destinations and others with a lot of outsiders visiting based on city industries data (population 50,000+)"
#75 on the list of "Top 101 cities with the lowest maximum monthly sunshine amount (population 50,000+)"
#85 on the list of "Top 101 cities with the largest percentage of unmarried partner households (population 50,000+)"
#93 on the list of "Top 101 cities with the largest city-data.com crime index increase from 2002 to 2012 (population 50,000+)"
#97 on the list of "Top 101 cities with the biggest property tax revenues per resident (population 10,000+)"
#97 on the list of "Top 100 high-educated but low-earning cities (pop. 50,000+)"
#98 on the list of "Top 101 cities with the highest ratio of rapes to murders between 2002 and 2012 (population 50,000+)"
#21 on the list of "Top 101 counties with the lowest percentage of residents that keep firearms around their homes"
#21 on the list of "Top 101 counties with the most Orthodox adherents"
#23 on the list of "Top 101 counties with the highest carbon monoxide air pollution readings in 2012 (ppm)"
#30 on the list of "Top 101 counties with the most Catholic adherents"
#36 on the list of "Top 101 counties with the most Orthodox congregations (pop. 50,000+)"
Top Patent Applicants
Thomas P. Burrous (27)
Cheri A. Stevenson (23)
Jianru Shi (18)
Shawn Schiller (13)
Douglas Chin (8)
Petter Hedstrom (8)
Martha Sholl (7)
Robert W. Tracy (7)
Justin D. Harris (6)
Timothy Mackey (6)
Total of 388 patent applications in 2008-2024.
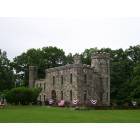

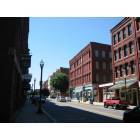
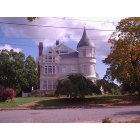

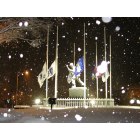
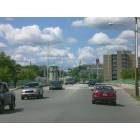
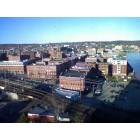
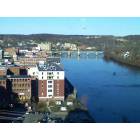
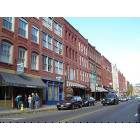


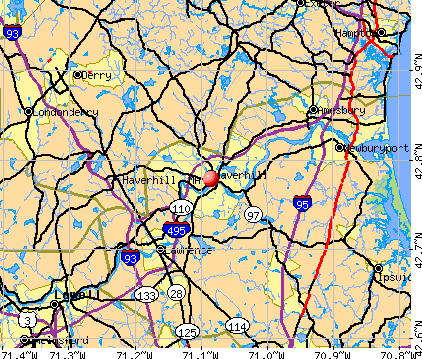


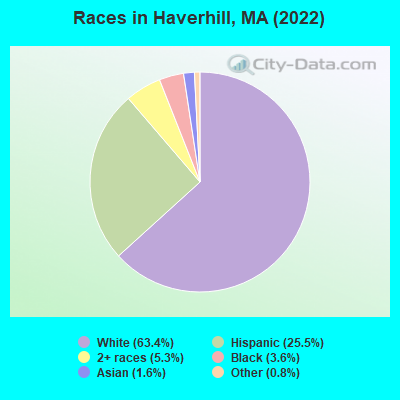
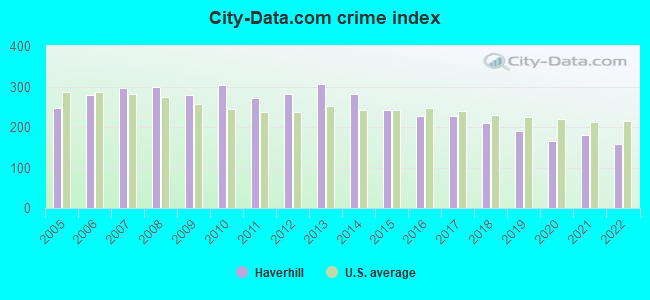
 Recent articles from our blog. Our writers, many of them Ph.D. graduates or candidates, create easy-to-read articles on a wide variety of topics.


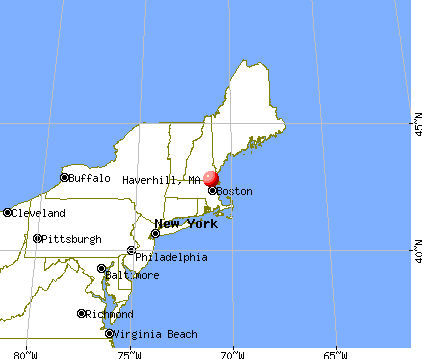
 (31.6 miles
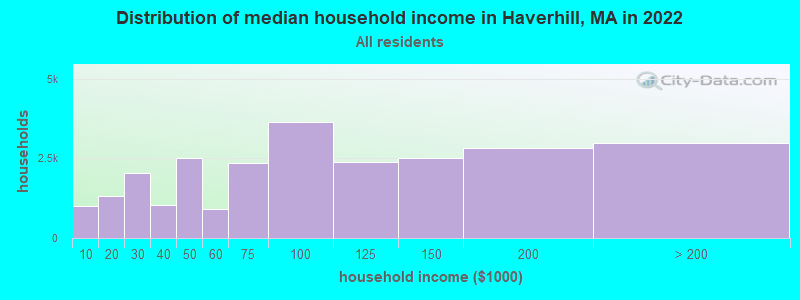
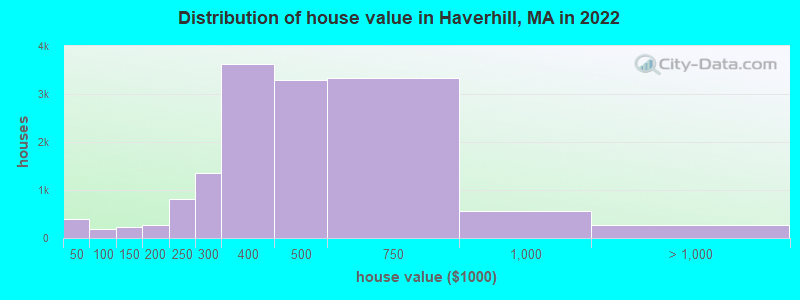

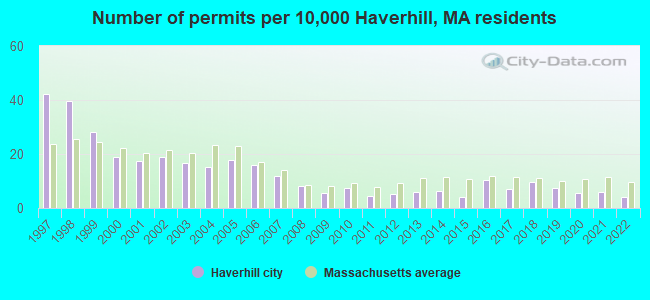
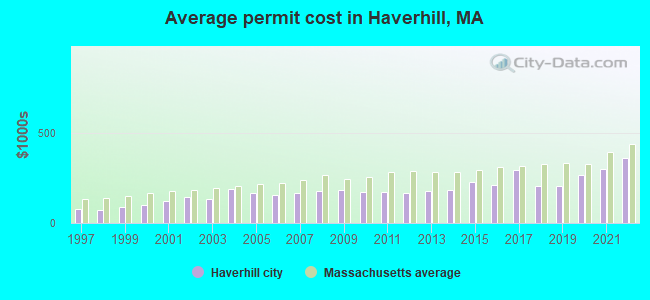
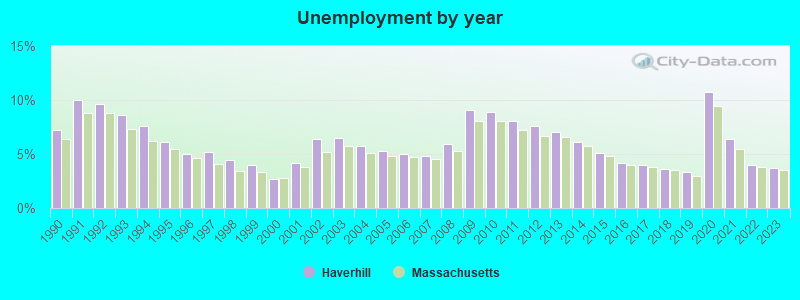
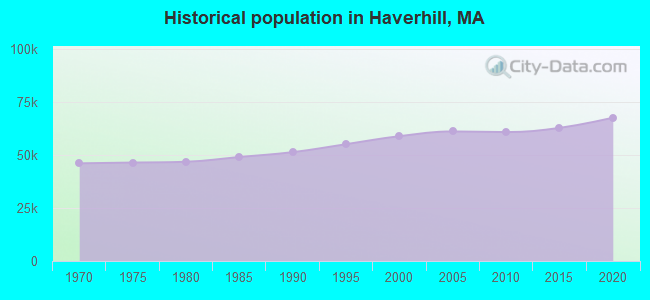
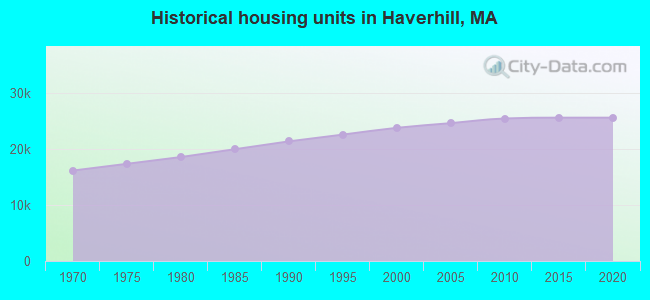
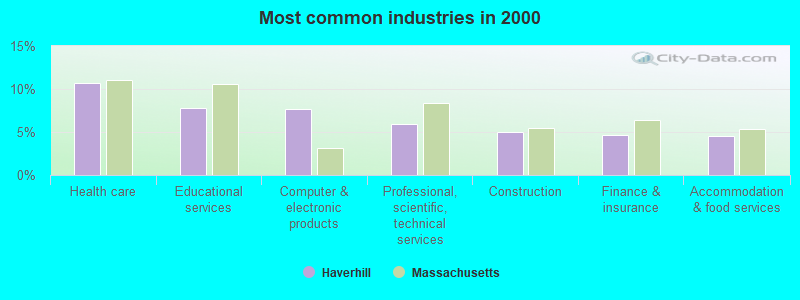
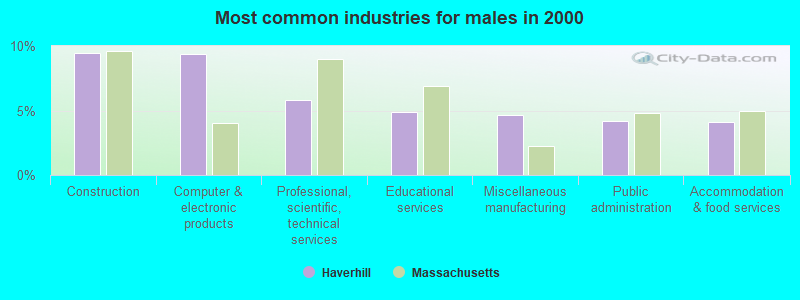
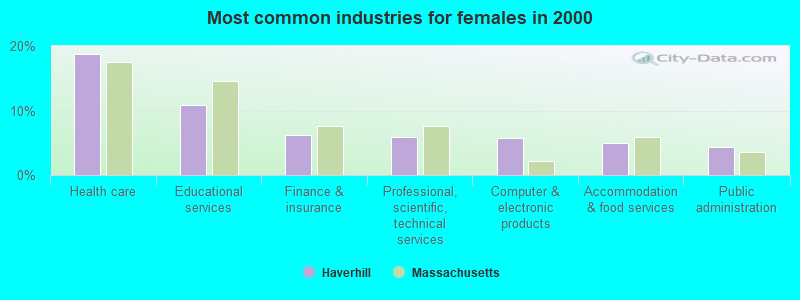
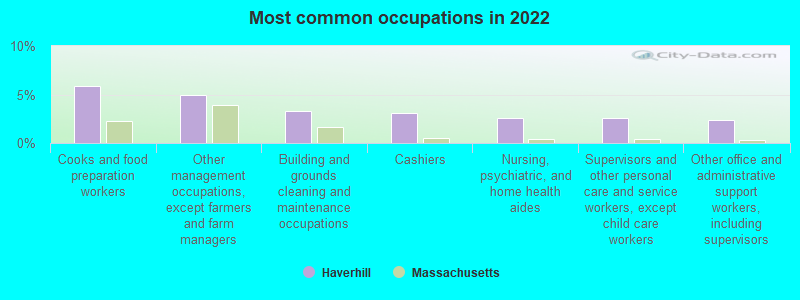
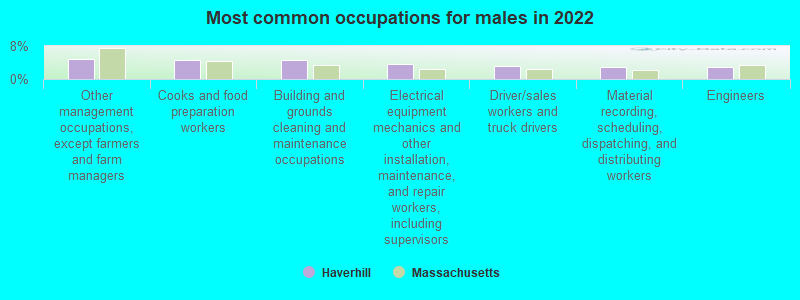
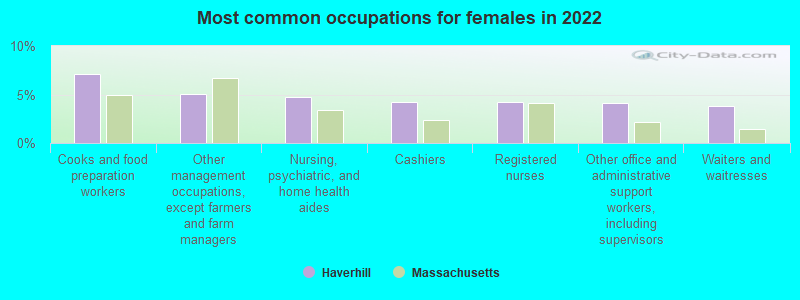
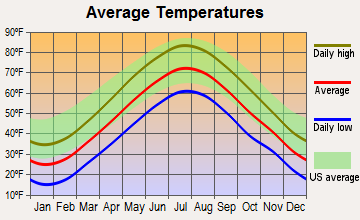
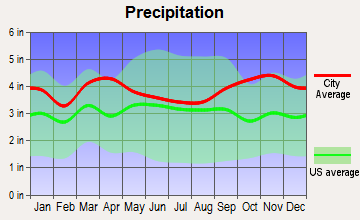
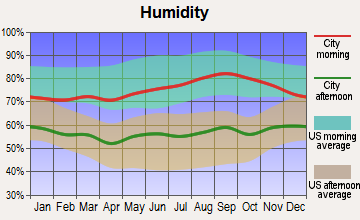
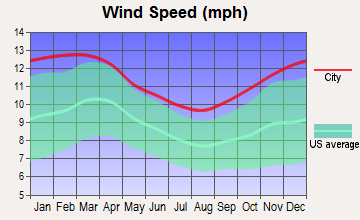
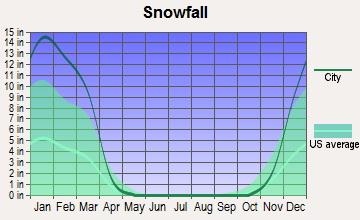
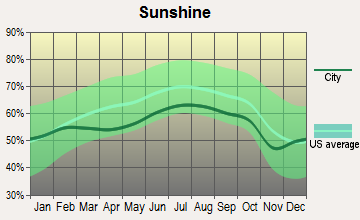
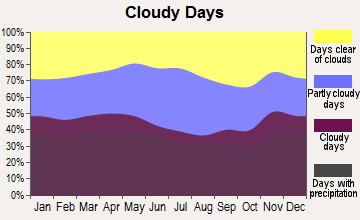


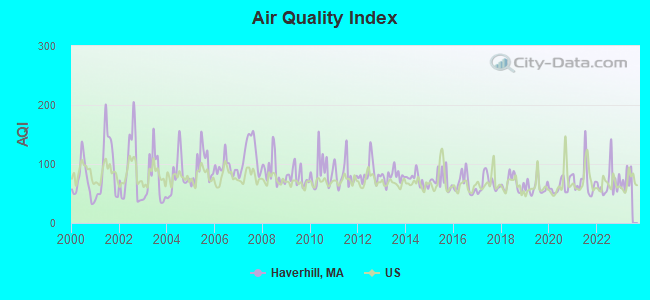
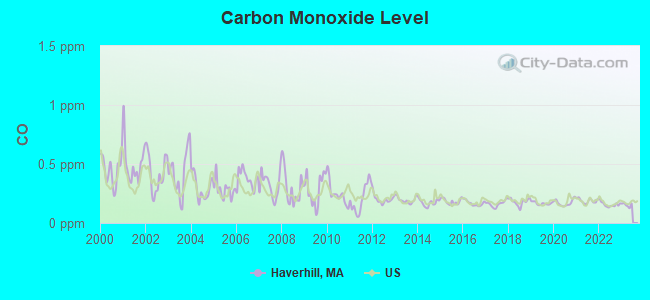
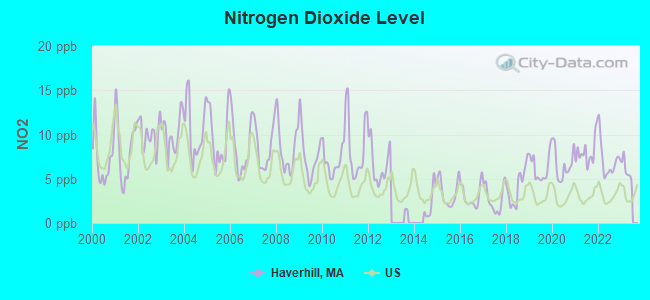
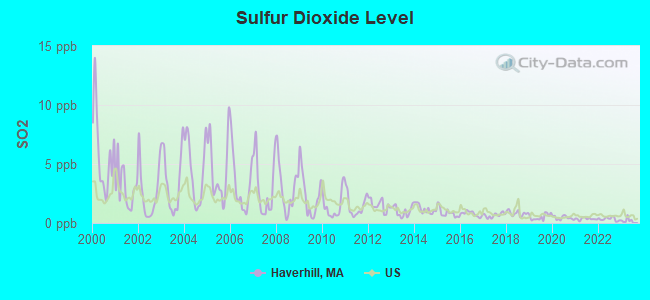

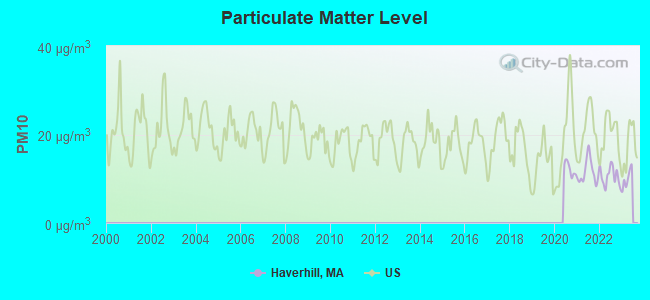
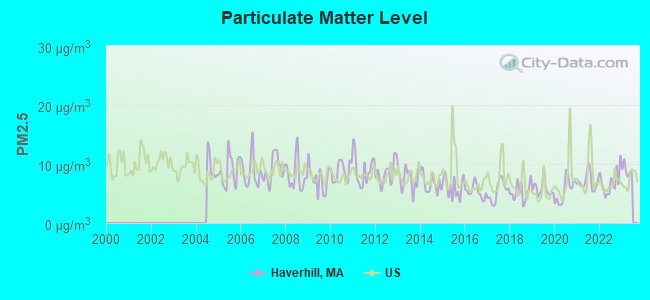
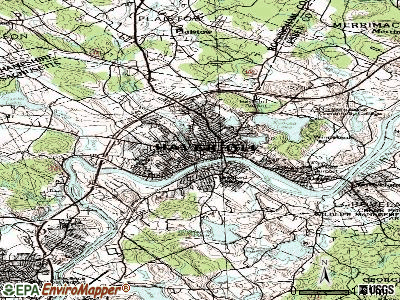
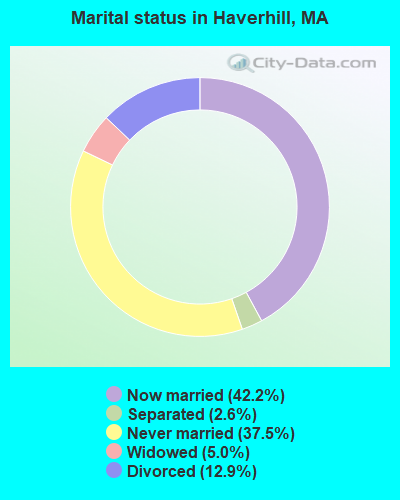
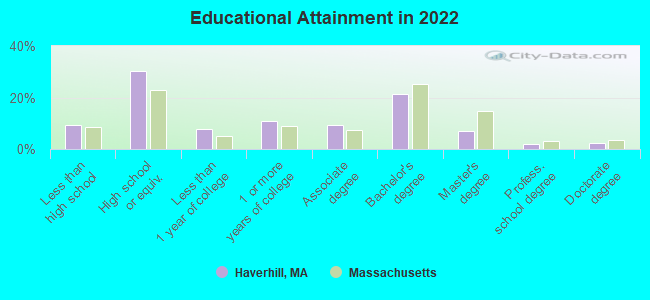
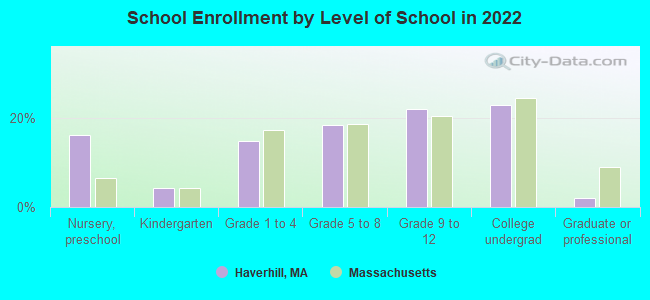
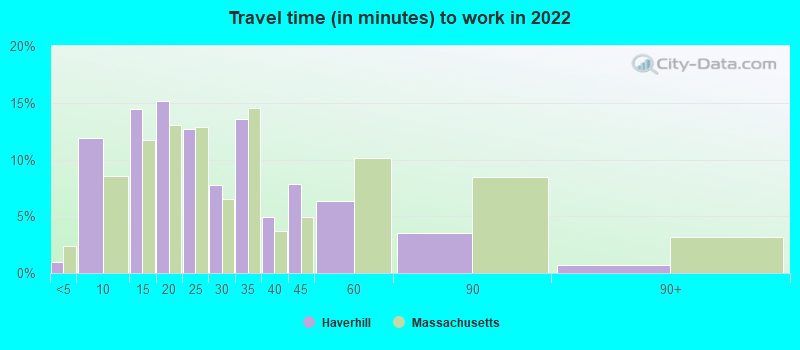
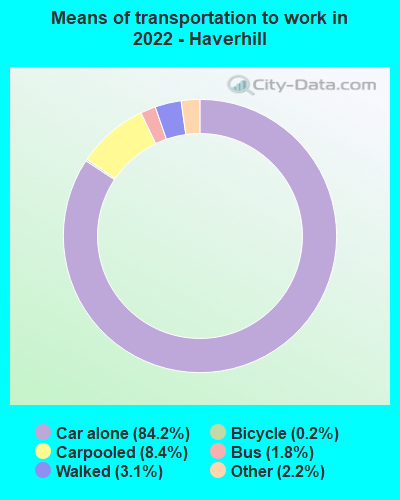
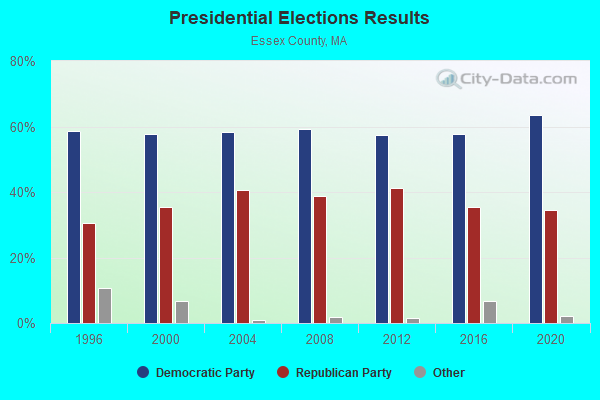
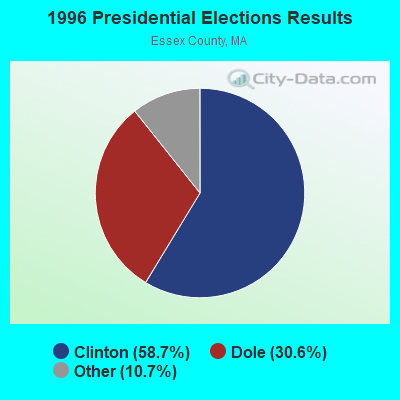
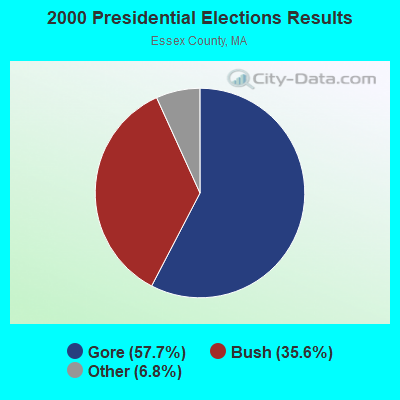
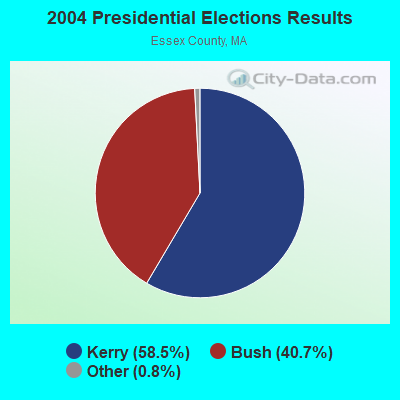
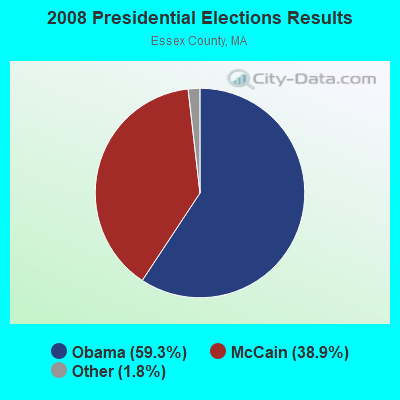
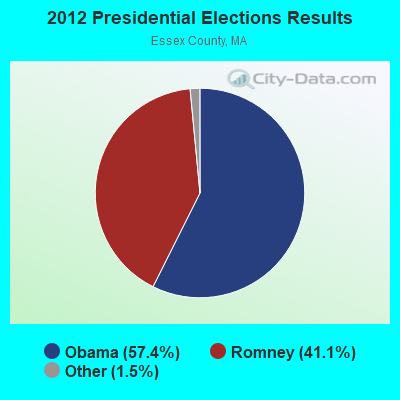
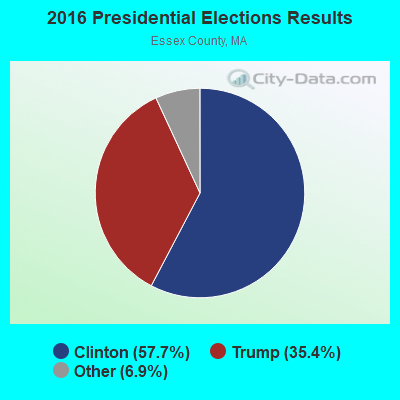
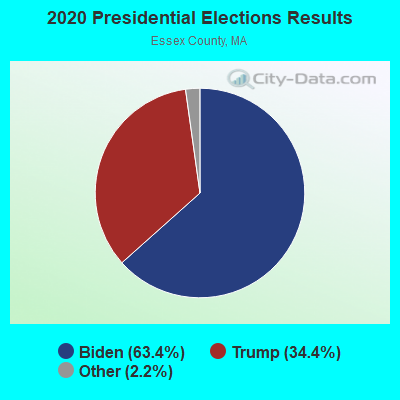
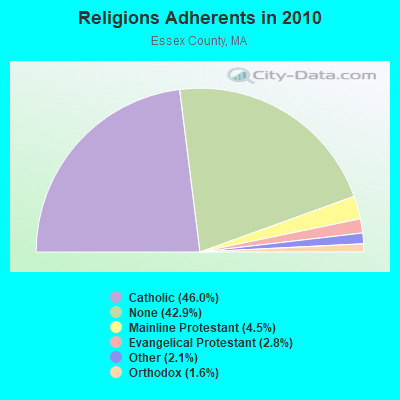
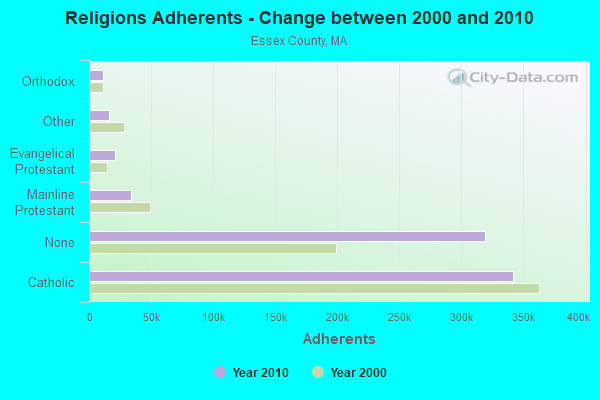
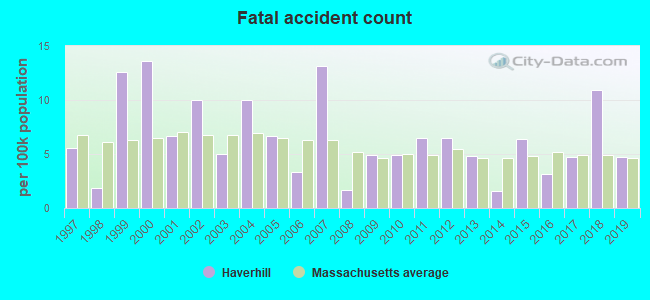
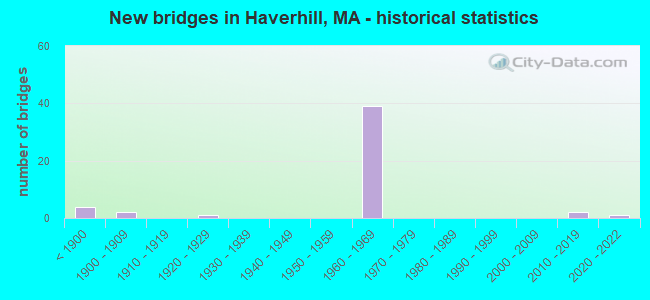
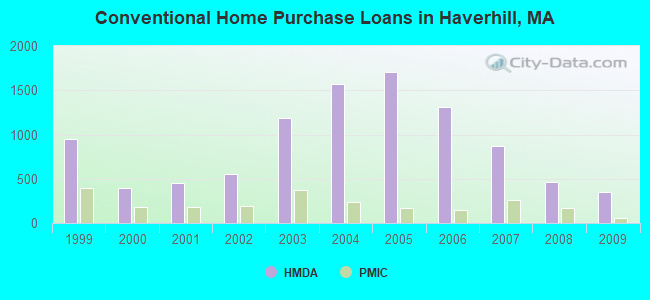
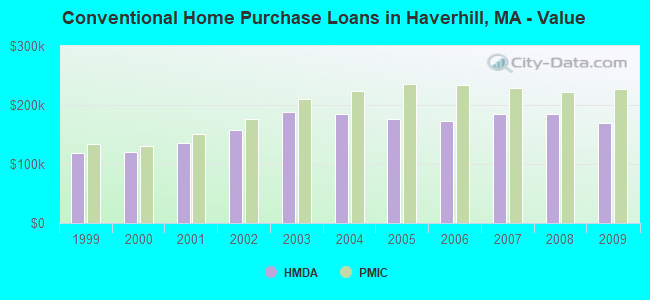
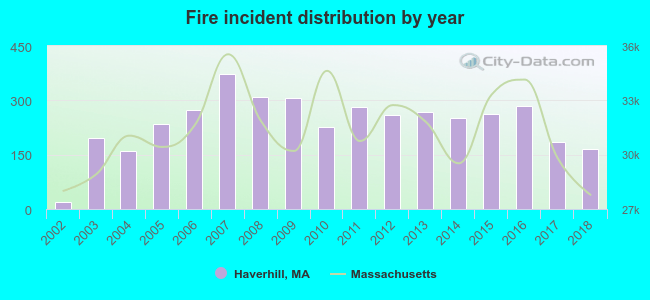 According to the data from the years 2002 - 2018 the average number of fire incidents per year is 238. The highest number of fire incidents - 374 took place in 2007, and the least - 18 in 2002. The data has a growing trend.
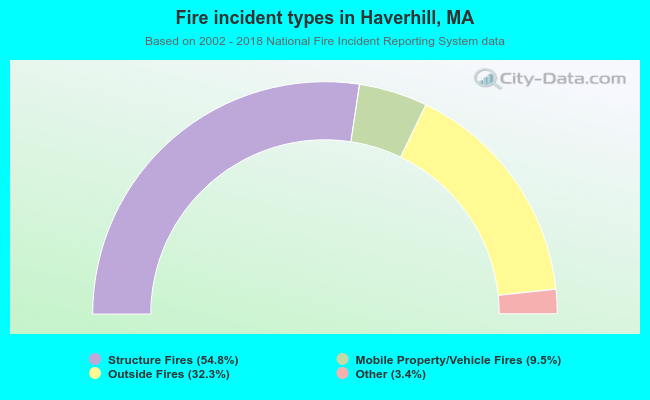 When looking into fire subcategories, the most reports belonged to: Structure Fires (54.8%), and Outside Fires (32.3%).