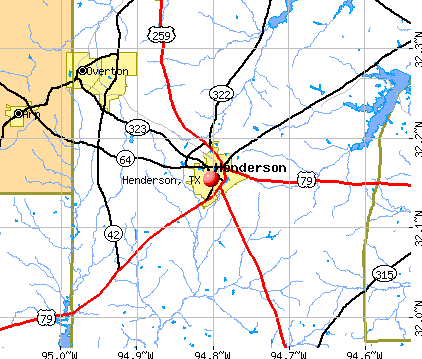
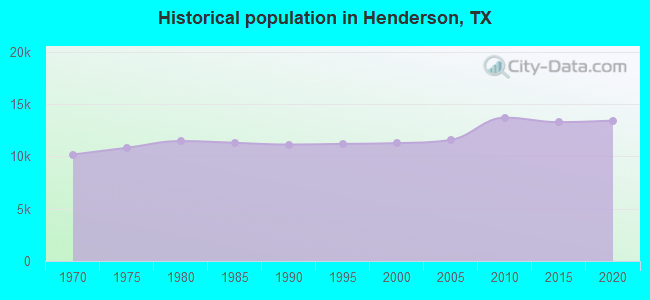
Henderson, Texas
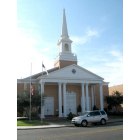
Henderson: First Baptist Church
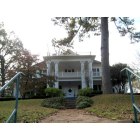
Henderson: Heritage House Bed and Breakfast
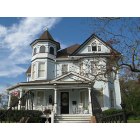
Henderson: Kangerga-McElyea House cira 1901 (Historical Marker)
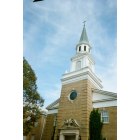
Henderson: church near main st ... taken November 2009 day of the Syrup Festival
- add
your


Submit your own pictures of this city and show them to the world
- OSM Map
- General Map
- Google Map
- MSN Map
Population change since 2000: +18.7%
| Males: 7,449 | |
| Females: 5,936 |
| Median resident age: | 37.8 years |
| Texas median age: | 35.6 years |
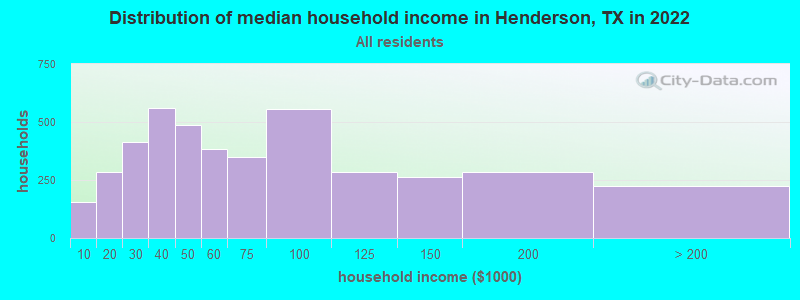
| Henderson: | $54,695 |
| TX: | $72,284 |
Estimated per capita income in 2022: $27,102 (it was $19,491 in 2000)
Henderson city income, earnings, and wages data
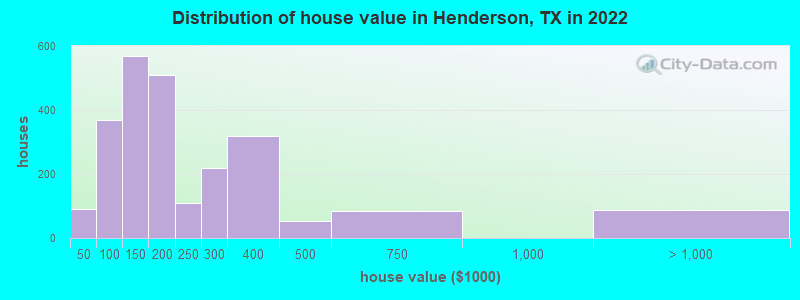
Estimated median house or condo value in 2022: $173,571 (it was $61,000 in 2000)
| Henderson: | $173,571 |
| TX: | $275,400 |
Median gross rent in 2022: $1,018.
(8.8% for White Non-Hispanic residents, 8.6% for Black residents, 13.0% for Hispanic or Latino residents, 28.3% for other race residents, 19.1% for two or more races residents)
Detailed information about poverty and poor residents in Henderson, TX


Compare current foreclosures near Henderson, TX:
| Photo | Address | Area | Beds / Baths | Price | Details |
|---|---|---|---|---|---|

|
#1
S Estates Cir
Henderson, TX 75652
|
- sq. feet
|
- baths - beds |
show details | |

|
#2
Slaydon St
Henderson, TX 75654
|
- sq. feet
|
- baths - beds |
show details | |

|
#3
Rayford Rd
Henderson, TX 75654
|
2,049 sq. feet
|
- baths - beds |
show details | |

|
#4
State Highway 323 W
Henderson, TX 75652
|
2,016 sq. feet
|
- baths - beds |
show details | |

|
#5
County Road 2136 N
Henderson, TX 75652
|
2,128 sq. feet
|
- baths - beds |
show details | |

|
#6
County Road 352 E
Henderson, TX 75654
|
1,144 sq. feet
|
- baths - beds |
show details | |

|
#7
N Marshall St Apt 211
Henderson, TX 75652
|
- sq. feet
|
- baths - beds |
show details | |

|
#8
Lake Cherokee
Henderson, TX 75652
|
- sq. feet
|
- baths - beds |
show details | |

|
#9
County Road 4196d
Henderson, TX 75654
|
- sq. feet
|
- baths - beds |
show details | |

|
#10
Webb St
Henderson, TX 75654
|
1,402 sq. feet
|
- baths - beds |
show details |
| Photo | Address | Area | Beds / Baths | Price | Details |
|---|---|---|---|---|---|

|
#11
County Road 366 E
Henderson, TX 75654
|
1,454 sq. feet
|
- baths - beds |
show details | |

|
#12
State Highway 42 S
Henderson, TX 75654
|
- sq. feet
|
- baths - beds |
show details | |

|
#13
State Highway 42 S
Henderson, TX 75654
|
- sq. feet
|
- baths - beds |
show details | |

|
#14
Sundown Trl
Henderson, TX 75654
|
1,506 sq. feet
|
- baths - beds |
show details | |

|
#15
Main
Henderson, TX 75654
|
1,700 sq. feet
|
- baths - beds |
show details | |

|
#16
Edgewood Rd
Kilgore, TX 75662
|
2,074 sq. feet
|
2 baths 3 beds |
$244,900
|
show details |

|
#17
Bean Ave
Kilgore, TX 75662
|
1,161 sq. feet
|
2 baths 3 beds |
show details | |

|
#18
Royal Dr
Kilgore, TX 75662
|
2,246 sq. feet
|
2 baths - beds |
show details | |

|
#19
Highland Dr
Kilgore, TX 75662
|
1,304 sq. feet
|
- baths - beds |
show details | |

|
#20
Butler St
Arp, TX 75750
|
1,676 sq. feet
|
1 baths - beds |
show details |
| Photo | Address | Area | Beds / Baths | Price | Details |
|---|---|---|---|---|---|

|
#21
James St
Kilgore, TX 75662
|
1,176 sq. feet
|
1 baths - beds |
show details | |

|
#22
Danville Rd
Kilgore, TX 75662
|
4,156 sq. feet
|
- baths - beds |
show details | |

|
#23
County Road 2154
Troup, TX 75789
|
- sq. feet
|
- baths - beds |
show details | |

|
#24
County Road 2159
Troup, TX 75789
|
1,568 sq. feet
|
- baths - beds |
show details | |

|
#25
S Barron St
Arp, TX 75750
|
- sq. feet
|
- baths - beds |
show details | |

|
#26
Us Highway 84 W
Mount Enterprise, TX 75681
|
- sq. feet
|
- baths - beds |
show details | |

|
#27
Crescent Dr Apt 15
Kilgore, TX 75662
|
- sq. feet
|
- baths - beds |
show details | |

|
#28
County Road 3227 S
Mount Enterprise, TX 75681
|
- sq. feet
|
- baths - beds |
show details | |

|
#29
N Garden Club Dr
Overton, TX 75684
|
1,660 sq. feet
|
- baths - beds |
show details | |

|
#30
Jay Dr
Longview, TX 75603
|
1,694 sq. feet
|
- baths - beds |
show details |
| Photo | Address | Area | Beds / Baths | Price | Details |
|---|---|---|---|---|---|

|
#31
County Road 251
Arp, TX 75750
|
- sq. feet
|
- baths - beds |
show details | |

|
#32
Dudley Rd
Kilgore, TX 75662
|
948 sq. feet
|
- baths - beds |
show details | |

|
#33
Camp St
Kilgore, TX 75662
|
1,592 sq. feet
|
- baths - beds |
show details | |

|
#34
N Sherwood Dr
Overton, TX 75684
|
1,581 sq. feet
|
- baths - beds |
show details | |

|
#35
County Road 187d
Kilgore, TX 75662
|
1,597 sq. feet
|
- baths - beds |
show details | |

|
#36
S Bradford St
Overton, TX 75684
|
1,708 sq. feet
|
- baths - beds |
show details | |

|
#37
State Highway 43 E
Tatum, TX 75691
|
- sq. feet
|
- baths - beds |
show details | |

|
#38
County Road 165 N
Overton, TX 75684
|
- sq. feet
|
- baths - beds |
show details | |

|
#39
State Highway 323 E
Overton, TX 75684
|
- sq. feet
|
- baths - beds |
show details | |

|
#40
State Highway 323 W
Overton, TX 75684
|
- sq. feet
|
- baths - beds |
show details |
| Photo | Address | Area | Beds / Baths | Price | Details |
|---|---|---|---|---|---|

|
#41
Fm 95 S
Mount Enterprise, TX 75681
|
1,193 sq. feet
|
- baths - beds |
show details | |

|
#42
State Highway 135
Troup, TX 75789
|
- sq. feet
|
- baths - beds |
show details | |

|
Check over 1 million property listings on Foreclosure.com!
|
browse all offers | |||


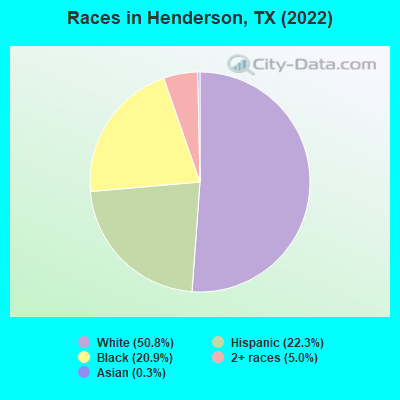
- 6,95850.8%White alone
- 3,05522.3%Hispanic
- 2,86220.9%Black alone
- 6885.0%Two or more races
- 410.3%Asian alone
- 50.04%American Indian alone
Races in Henderson detailed stats: ancestries, foreign born residents, place of birth
According to our research of Texas and other state lists, there were 120 registered sex offenders living in Henderson, Texas as of April 24, 2024.
The ratio of all residents to sex offenders in Henderson is 117 to 1.
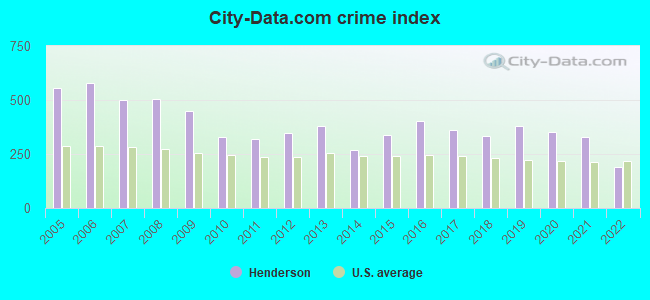
Type |
2009 |
2010 |
2011 |
2012 |
2013 |
2014 |
2015 |
2016 |
2017 |
2018 |
2019 |
2020 |
2021 |
2022 |
|---|---|---|---|---|---|---|---|---|---|---|---|---|---|---|
| Murders (per 100,000) | 0 (0.0) | 0 (0.0) | 0 (0.0) | 0 (0.0) | 1 (7.2) | 0 (0.0) | 0 (0.0) | 1 (7.4) | 0 (0.0) | 0 (0.0) | 4 (30.2) | 1 (7.6) | 2 (15.4) | 0 (0.0) |
| Rapes (per 100,000) | 5 (42.8) | 4 (29.2) | 1 (7.1) | 5 (35.7) | 2 (14.5) | 3 (21.9) | 3 (22.1) | 6 (44.5) | 9 (67.3) | 4 (30.2) | 8 (60.5) | 5 (38.2) | 6 (46.2) | 4 (29.5) |
| Robberies (per 100,000) | 16 (137.0) | 15 (109.4) | 4 (28.6) | 14 (99.9) | 12 (86.7) | 6 (43.8) | 2 (14.7) | 8 (59.3) | 7 (52.4) | 10 (75.5) | 3 (22.7) | 5 (38.2) | 9 (69.3) | 6 (44.2) |
| Assaults (per 100,000) | 65 (556.7) | 66 (481.3) | 74 (528.5) | 77 (549.3) | 81 (585.4) | 53 (387.1) | 89 (655.7) | 92 (681.9) | 84 (628.5) | 72 (543.8) | 59 (446.1) | 62 (473.5) | 71 (546.6) | 41 (302.2) |
| Burglaries (per 100,000) | 115 (985.0) | 77 (561.6) | 130 (928.5) | 79 (563.5) | 77 (556.5) | 78 (569.6) | 81 (596.7) | 85 (630.0) | 53 (396.5) | 62 (468.2) | 60 (453.7) | 93 (710.3) | 40 (308.0) | 36 (265.3) |
| Thefts (per 100,000) | 487 (4,171) | 401 (2,924) | 415 (2,964) | 468 (3,338) | 545 (3,939) | 384 (2,804) | 439 (3,234) | 464 (3,439) | 428 (3,202) | 426 (3,217) | 428 (3,236) | 420 (3,208) | 284 (2,186) | 190 (1,400) |
| Auto thefts (per 100,000) | 38 (325.5) | 31 (226.1) | 31 (221.4) | 13 (92.7) | 25 (180.7) | 12 (87.6) | 19 (140.0) | 28 (207.5) | 16 (119.7) | 28 (211.5) | 24 (181.5) | 32 (244.4) | 36 (277.2) | 27 (199.0) |
| Arson (per 100,000) | 1 (8.6) | 8 (58.3) | 6 (42.9) | 2 (14.3) | 2 (14.5) | 2 (14.6) | 3 (22.1) | 2 (14.8) | 2 (15.0) | 3 (22.7) | 1 (7.6) | 2 (15.3) | 5 (38.5) | 2 (14.7) |
| City-Data.com crime index | 448.6 | 326.8 | 321.3 | 348.7 | 380.1 | 267.1 | 335.6 | 402.9 | 360.7 | 334.0 | 380.6 | 349.6 | 329.0 | 187.8 |
The City-Data.com crime index weighs serious crimes and violent crimes more heavily. Higher means more crime, U.S. average is 246.1. It adjusts for the number of visitors and daily workers commuting into cities.
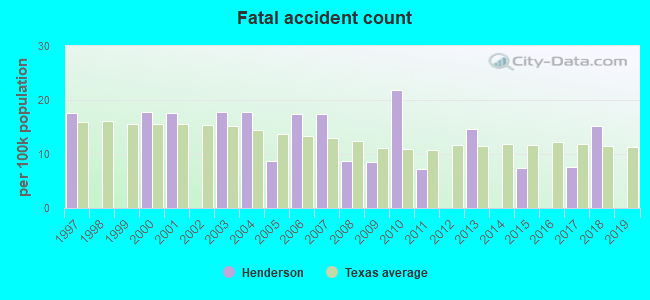
Crime rate in Henderson detailed stats: murders, rapes, robberies, assaults, burglaries, thefts, arson
Full-time law enforcement employees in 2021, including police officers: 45 (36 officers - 29 male; 7 female).
| Officers per 1,000 residents here: | 2.77 |
| Texas average: | 2.07 |
 Recent articles from our blog. Our writers, many of them Ph.D. graduates or candidates, create easy-to-read articles on a wide variety of topics.


Latest news from Henderson, TX collected exclusively by city-data.com from local newspapers, TV, and radio stations
Ancestries: American (20.7%), English (8.0%), Irish (5.0%), German (3.8%).
Current Local Time: CST time zone
Land area: 11.9 square miles.
Population density: 1,125 people per square mile (low).
1,156 residents are foreign born (7.1% Latin America).
| This city: | 8.4% |
| Texas: | 17.1% |
Median real estate property taxes paid for housing units with mortgages in 2022: $2,284 (1.3%)
Median real estate property taxes paid for housing units with no mortgage in 2022: $1,749 (1.0%)
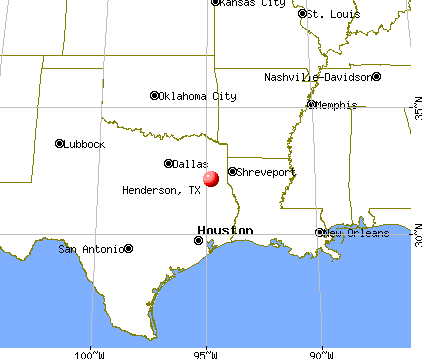
Nearest city with pop. 50,000+: Longview, TX  (24.7 miles , pop. 73,344).
Nearest city with pop. 200,000+: Shreveport, LA (64.1 miles , pop. 200,145).
Nearest city with pop. 1,000,000+: Dallas, TX (124.1 miles , pop. 1,188,580).
Nearest cities:
), ), ), ), ), )Latitude: 32.15 N, Longitude: 94.80 W
Daytime population change due to commuting: +2,710 (+19.8%)
Workers who live and work in this city: 2,885 (60.1%)
Area code: 903
Henderson, Texas accommodation & food services, waste management - Economy and Business Data
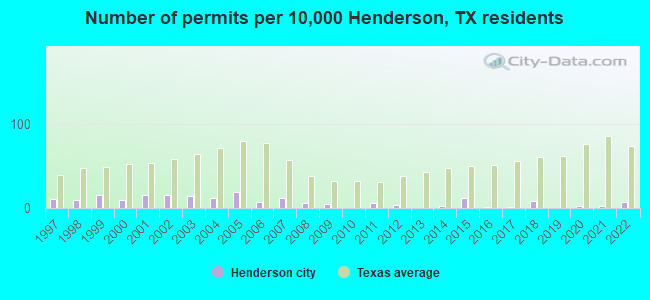
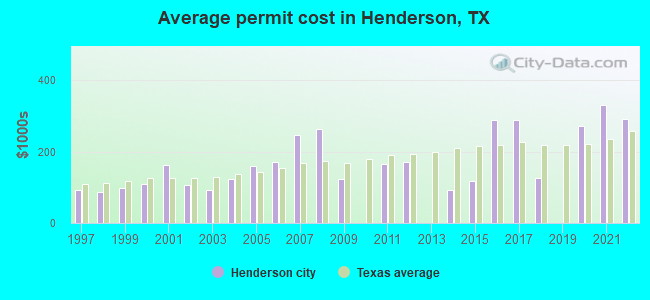
Single-family new house construction building permits:
- 2022: 8 buildings, average cost: $292,100
- 2021: 3 buildings, average cost: $331,400
- 2020: 3 buildings, average cost: $271,600
- 2018: 9 buildings, average cost: $125,400
- 2017: 2 buildings, average cost: $290,300
- 2016: 2 buildings, average cost: $290,300
- 2015: 13 buildings, average cost: $116,600
- 2014: 3 buildings, average cost: $92,500
- 2012: 4 buildings, average cost: $172,000
- 2011: 7 buildings, average cost: $166,300
- 2009: 6 buildings, average cost: $123,000
- 2008: 7 buildings, average cost: $262,500
- 2007: 14 buildings, average cost: $248,400
- 2006: 8 buildings, average cost: $169,700
- 2005: 22 buildings, average cost: $161,400
- 2004: 13 buildings, average cost: $122,900
- 2003: 16 buildings, average cost: $92,100
- 2002: 17 buildings, average cost: $107,300
- 2001: 18 buildings, average cost: $162,000
- 2000: 11 buildings, average cost: $108,100
- 1999: 17 buildings, average cost: $96,600
- 1998: 11 buildings, average cost: $88,100
- 1997: 12 buildings, average cost: $91,900
| Here: | 3.7% |
| Texas: | 3.5% |
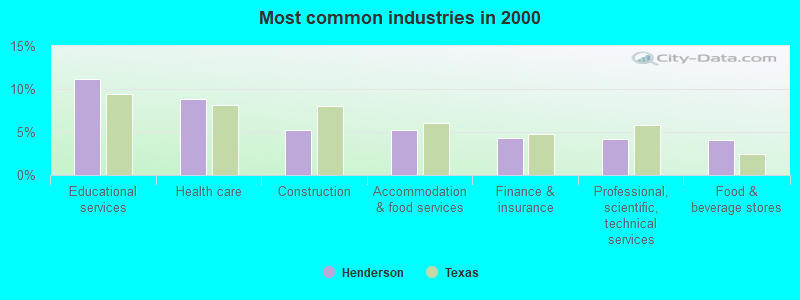
- Educational services (11.1%)
- Health care (8.9%)
- Construction (5.2%)
- Accommodation & food services (5.2%)
- Finance & insurance (4.3%)
- Professional, scientific, technical services (4.2%)
- Food & beverage stores (4.0%)
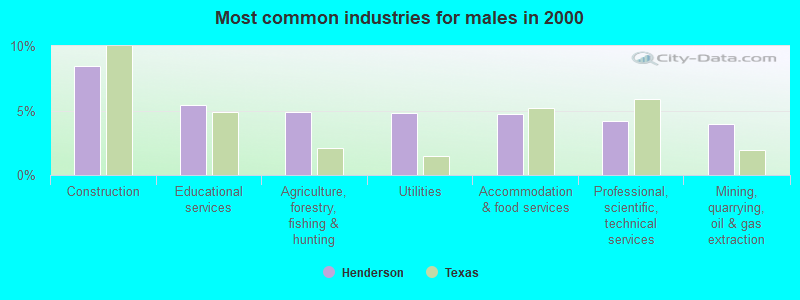
- Construction (8.4%)
- Educational services (5.5%)
- Agriculture, forestry, fishing & hunting (4.9%)
- Utilities (4.8%)
- Accommodation & food services (4.8%)
- Professional, scientific, technical services (4.2%)
- Mining, quarrying, oil & gas extraction (4.0%)
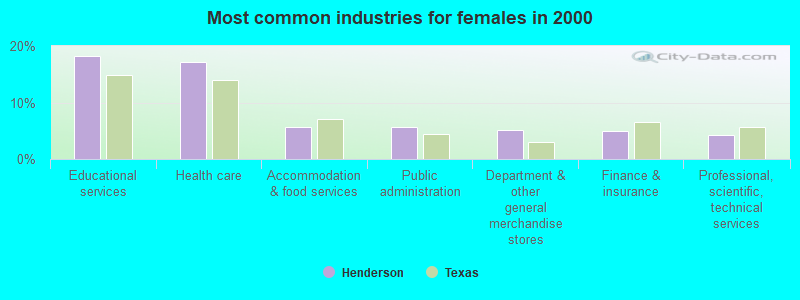
- Educational services (18.2%)
- Health care (17.2%)
- Accommodation & food services (5.7%)
- Public administration (5.6%)
- Department & other general merchandise stores (5.1%)
- Finance & insurance (4.9%)
- Professional, scientific, technical services (4.2%)
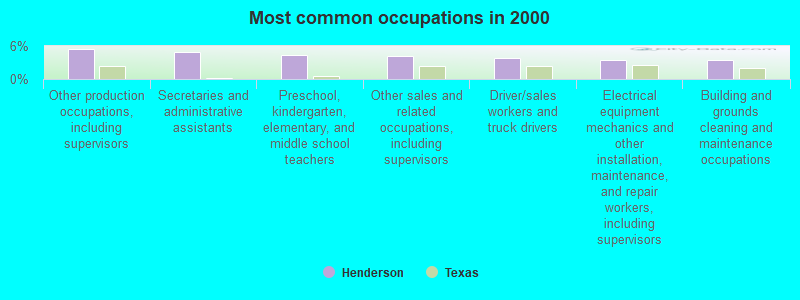
- Other production occupations, including supervisors (5.5%)
- Secretaries and administrative assistants (5.0%)
- Preschool, kindergarten, elementary, and middle school teachers (4.3%)
- Other sales and related occupations, including supervisors (4.1%)
- Driver/sales workers and truck drivers (3.8%)
- Electrical equipment mechanics and other installation, maintenance, and repair workers, including supervisors (3.5%)
- Building and grounds cleaning and maintenance occupations (3.5%)
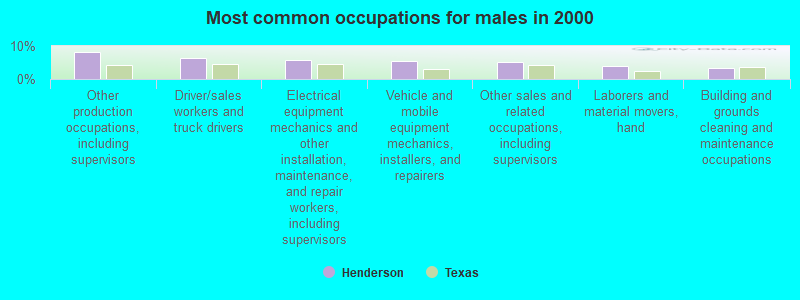
- Other production occupations, including supervisors (8.1%)
- Driver/sales workers and truck drivers (6.4%)
- Electrical equipment mechanics and other installation, maintenance, and repair workers, including supervisors (5.7%)
- Vehicle and mobile equipment mechanics, installers, and repairers (5.6%)
- Other sales and related occupations, including supervisors (5.0%)
- Laborers and material movers, hand (3.9%)
- Building and grounds cleaning and maintenance occupations (3.4%)
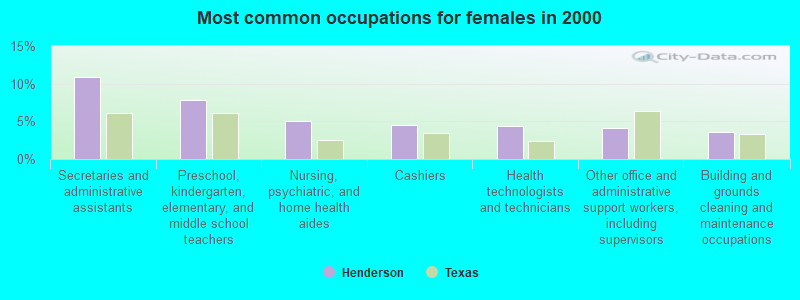
- Secretaries and administrative assistants (10.8%)
- Preschool, kindergarten, elementary, and middle school teachers (7.8%)
- Nursing, psychiatric, and home health aides (5.1%)
- Cashiers (4.5%)
- Health technologists and technicians (4.4%)
- Other office and administrative support workers, including supervisors (4.1%)
- Building and grounds cleaning and maintenance occupations (3.6%)
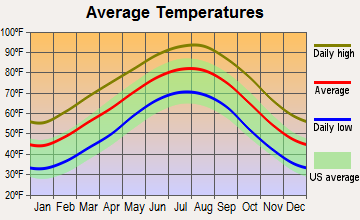
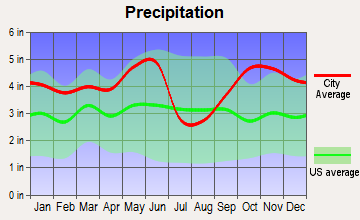
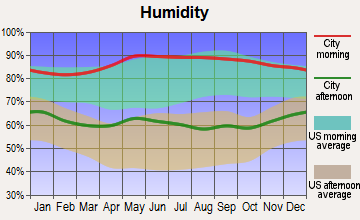
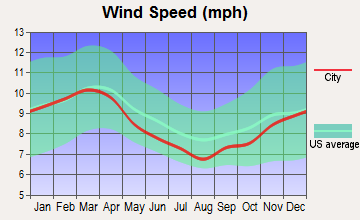
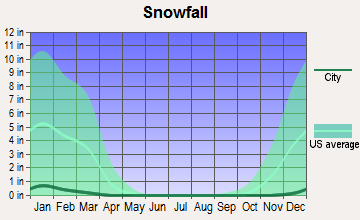
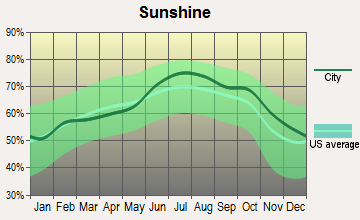
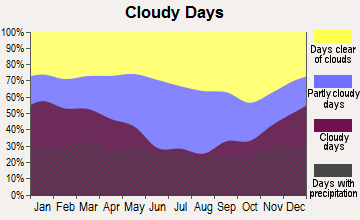
Average climate in Henderson, Texas
Based on data reported by over 4,000 weather stations
|
|

(lower is better)
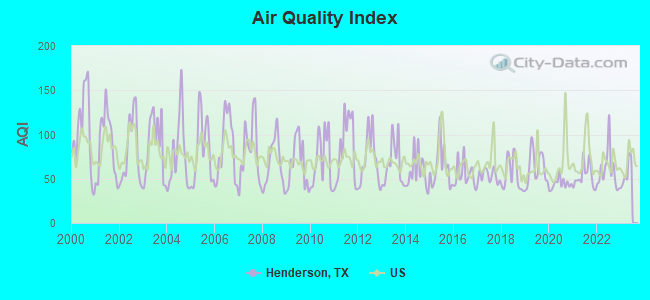
Air Quality Index (AQI) level in 2022 was 59.3. This is better than average.
| City: | 59.3 |
| U.S.: | 72.6 |
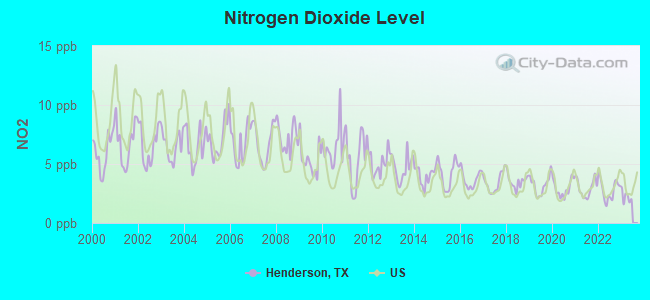
Nitrogen Dioxide (NO2) [ppb] level in 2022 was 2.83. This is significantly better than average. Closest monitor was 16.4 miles away from the city center.
| City: | 2.83 |
| U.S.: | 5.11 |
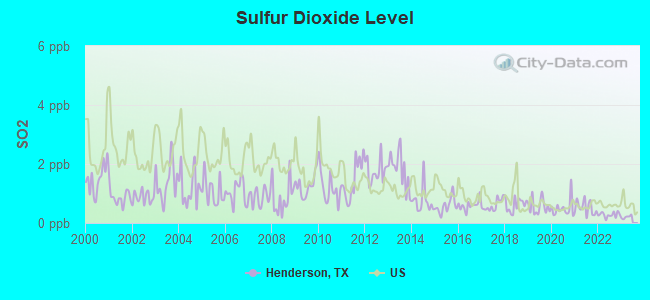
Sulfur Dioxide (SO2) [ppb] level in 2022 was 0.277. This is significantly better than average. Closest monitor was 16.4 miles away from the city center.
| City: | 0.277 |
| U.S.: | 1.515 |
Ozone [ppb] level in 2022 was 27.8. This is about average. Closest monitor was 16.4 miles away from the city center.
| City: | 27.8 |
| U.S.: | 33.3 |
Tornado activity:
Henderson-area historical tornado activity is above Texas state average. It is 117% greater than the overall U.S. average.
On 4/6/2003, a category F3 (max. wind speeds 158-206 mph) tornado 9.8 miles away from the Henderson city center caused $9 million in damages.
On 3/3/1970, a category F3 tornado 14.5 miles away from the city center caused between $5000 and $50,000 in damages.
Earthquake activity:
Henderson-area historical earthquake activity is significantly above Texas state average. It is 352% greater than the overall U.S. average.On 5/17/2012 at 08:12:00, a magnitude 4.8 (4.8 MW, Depth: 3.1 mi, Class: Light, Intensity: IV - V) earthquake occurred 29.9 miles away from the city center
On 11/6/2011 at 03:53:10, a magnitude 5.7 (5.7 MW, Depth: 3.2 mi, Class: Moderate, Intensity: VI - VII) earthquake occurred 259.4 miles away from the city center
On 9/3/2016 at 12:02:44, a magnitude 5.8 (5.8 MW, Depth: 3.5 mi) earthquake occurred 319.4 miles away from Henderson center
On 9/2/2013 at 23:51:15, a magnitude 4.3 (4.3 MW, Depth: 2.9 mi) earthquake occurred 27.7 miles away from Henderson center
On 9/2/2013 at 21:52:38, a magnitude 4.2 (4.2 MW, Depth: 3.0 mi) earthquake occurred 20.8 miles away from Henderson center
On 1/25/2013 at 07:01:19, a magnitude 4.1 (4.1 MB, Depth: 3.1 mi) earthquake occurred 36.5 miles away from Henderson center
Magnitude types: body-wave magnitude (MB), moment magnitude (MW)
Natural disasters:
The number of natural disasters in Rusk County (18) is near the US average (15).Major Disasters (Presidential) Declared: 11
Emergencies Declared: 6
Causes of natural disasters: Storms: 6, Floods: 5, Fires: 4, Hurricanes: 4, Tornadoes: 4, Wind: 1, Winter Storm: 1, Other: 2 (Note: some incidents may be assigned to more than one category).
Hospitals in Henderson:
- CROSBY COMMUNITY HOME (102 CROSBY DR)
- ETMC HENDERSON (Voluntary non-profit - Private, provides emergency services, 300 WILSON STREET)
- PETERSON COMMUNITY HOME (1522 PETERSON)
- TRUMAN DRIVE COMMUNITY HOME (103 TRUMAN)
Nursing Homes in Henderson:
- AUTUMN LEAVES NURSING AND REHAB INC (321 KILGORE DRIVE)
- FAIR PARK HEALTHCARE AND REHABILITATION CENTER (701 FAIR PARK DR)
- HENDERSON HEALTH AND REHABILITATION CENTER (1010 W MAIN ST)
- LEISURE LODGE HENDERSON (1010 W MAIN)
Dialysis Facilities in Henderson:
Home Health Centers in Henderson:
Airports located in Henderson:
- Rusk County Airport (RFI) (Runways: 2, Itinerant Ops: 3,200, Local Ops: 6,400, Military Ops: 400)
Colleges/universities with over 2000 students nearest to Henderson:
- Kilgore College (about 17 miles; Kilgore, TX; Full-time enrollment: 3,127)
- LeTourneau University (about 23 miles; Longview, TX; FT enrollment: 2,357)
- The University of Texas at Tyler (about 29 miles; Tyler, TX; FT enrollment: 5,774)
- Tyler Junior College (about 31 miles; Tyler, TX; FT enrollment: 8,104)
- Stephen F Austin State University (about 42 miles; Nacogdoches, TX; FT enrollment: 11,542)
- Angelina College (about 61 miles; Lufkin, TX; FT enrollment: 3,478)
- Trinity Valley Community College (about 62 miles; Athens, TX; FT enrollment: 5,333)
Public high school in Henderson:
- HENDERSON H S (Students: 896, Location: 1900 HWY 64, Grades: 9-12)
Public elementary/middle schools in Henderson:
- WILLIAM E WYLIE EL (Students: 754, Location: 1735 HWY 259 S, Grades: KG-3)
- HENDERSON MIDDLE (Students: 726, Location: 501 RICHARDSON DR, Grades: 6-8)
- NORTHSIDE EL (Students: 546, Location: 800 N VAN BUREN, Grades: 4-5)
Private elementary/middle school in Henderson:
User-submitted facts and corrections:
- There is a hospital in Tyler, TX, Trinity Mother Frances Health System. For more information, see their web site at www.tmfhs.org. - Thanks
Points of interest:
Notable locations in Henderson: Henderson Commercial Historic District (A), Depot Museum (B), Howard-Dickinson House (C), Depot Museum Complex (D), Henderson Fire Department Station 2 (E), Henderson Fire Department Central Station 1 (F), Texas Forest Service Henderson Office (G), Poe-Jones-Richardson House (H). Display/hide their locations on the map
Churches in Henderson include: First Presbyterian Church (A), First United Pentecostal Church (B), The Church of Jesus Christ of Latter Day Saints (C), Saint Matthews Episcopal Church (D), Church of the Nazarene (E), Wayside Church of God in Christ (F), South Oak Saint Church of Christ (G), Saint Judes Catholic Church (H), Southside Baptist Church (I). Display/hide their locations on the map
Cemeteries: Oberthier Cemetery (1), Old City Cemetery (2), Lakewood Memorial Park (3). Display/hide their locations on the map
Reservoirs: Willow Lake (A), Lake Forrest (B). Display/hide their locations on the map
Creek: Dutch Creek (A). Display/hide its location on the map
Parks in Henderson include: Yates Park (1), Fair Park (2), Lake Forest Park (3). Display/hide their locations on the map
Hotels: Applejacks Inc (1204 US Highway 79 North), Budget Inn (100 State Highway 43 East), Best Western Inn Of Henderson (1500 Highway 259 South).
Court: Rusk County - County Court At Law Judge (Courthouse).
Birthplace of: Joe Delaney - Football player, Drew Coleman - Football player, Eddie Jones (American football) - Football player, Rickey Dudley - 2005 NFL player (Oakland Raiders, born: Jul 15, 1972), Ricky Lynn Gregg - Country singer, Archie Bell - Singer, Sandy Duncan - (born 1946), actress, Gary Jones (manager) - Baseball player, Jason Harris - College basketball player (Sacramento State Hornets), Mark White - (1983-1987), governor of Texas.
Drinking water stations with addresses in Henderson and their reported violations in the past:
CHALK HILL SUD (Population served: 4,239, Groundwater):Past health violations:
- MCL, Average - Between APR-2014 and JUN-2014, Contaminant: TTHM. Follow-up actions: St Violation/Reminder Notice (AUG-26-2014), St Public Notif requested (AUG-26-2014)
| This city: | 2.6 people |
| Texas: | 2.8 people |
| This city: | 68.9% |
| Whole state: | 69.9% |
| This city: | 5.6% |
| Whole state: | 6.0% |
Likely homosexual households (counted as self-reported same-sex unmarried-partner households)
- Lesbian couples: 0.2% of all households
- Gay men: 0.2% of all households
People in group quarters in Henderson in 2010:
- 2,046 people in correctional residential facilities
- 328 people in nursing facilities/skilled-nursing facilities
- 21 people in group homes intended for adults
People in group quarters in Henderson in 2000:
- 240 people in nursing homes
- 64 people in local jails and other confinement facilities (including police lockups)
- 4 people in college dormitories (includes college quarters off campus)
Banks with branches in Henderson (2011 data):
- Citizens National Bank: South 79 Branch at 2320 Highway 79 South, branch established on 1981/05/26; at 201 West Main Street, branch established on 1930/03/28. Info updated 2006/11/03: Bank assets: $896.9 mil, Deposits: $784.3 mil, local headquarters, positive income, 18 total offices, Holding Company: Henderson Citizens Bancshares, Inc.
- Texas Bank: Convenience Center Branch at 1815 Hwy 79 S., branch established on 2004/08/23; at 1120 Highway 79 North, branch established on 1973/05/05. Info updated 2006/11/03: Bank assets: $290.5 mil, Deposits: $255.5 mil, local headquarters, positive income, 6 total offices, Holding Company: Henderson Texas Bancshares, Inc.
- Bank of America, National Association: Henderson Branch at 605 South Main Street, branch established on 1902/01/01. Info updated 2009/11/18: Bank assets: $1,451,969.3 mil, Deposits: $1,077,176.8 mil, headquarters in Charlotte, NC, positive income, 5782 total offices, Holding Company: Bank Of America Corporation
- Woodforest National Bank: Henderson Wal-Mart Branch at 2121 Highway 79 South, branch established on 2001/07/02. Info updated 2011/05/10: Bank assets: $3,488.9 mil, Deposits: $3,097.6 mil, headquarters in Houston, TX, positive income, Commercial Lending Specialization, 766 total offices, Holding Company: Woodforest Financial Group Employee Stock Ownership Plan (With 401(K) Provisions)
- Henderson Federal Savings Bank: at 130 North Marshall Street, branch established on 1934/11/01. Info updated 2011/07/21: Bank assets: $108.5 mil, Deposits: $85.8 mil, local headquarters, positive income, Mortgage Lending Specialization, 1 total offices
For population 15 years and over in Henderson:
- Never married: 33.3%
- Now married: 39.8%
- Separated: 3.4%
- Widowed: 8.4%
- Divorced: 15.1%
For population 25 years and over in Henderson:
- High school or higher: 82.6%
- Bachelor's degree or higher: 19.8%
- Graduate or professional degree: 9.5%
- Unemployed: 5.5%
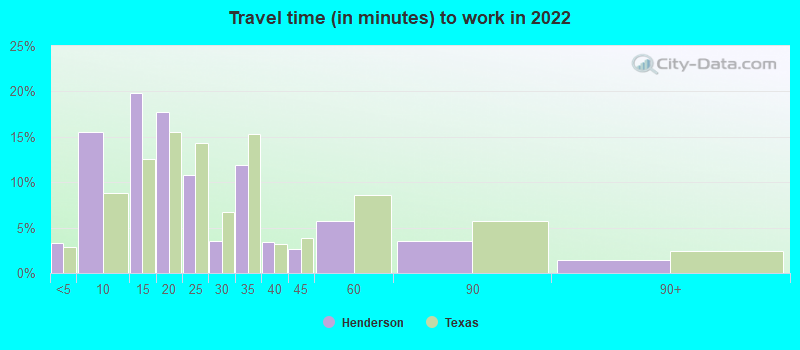
- Mean travel time to work (commute): 22.1 minutes
| Here: | 12.0 |
| Texas average: | 14.0 |

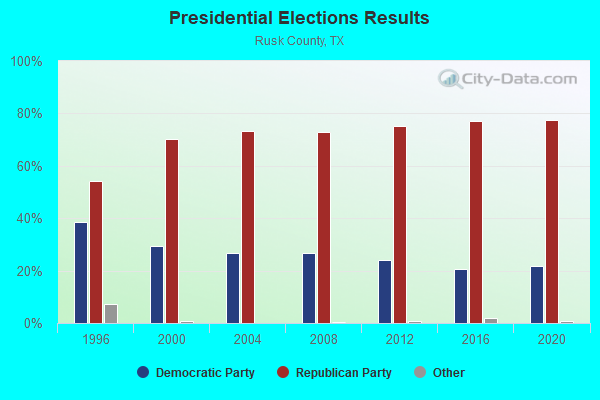
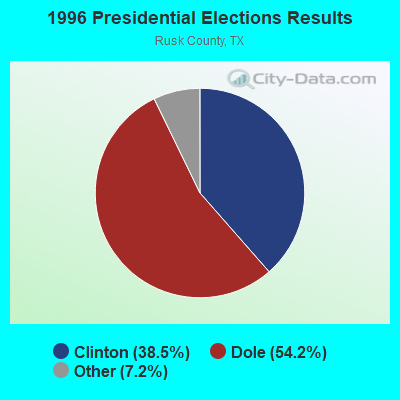
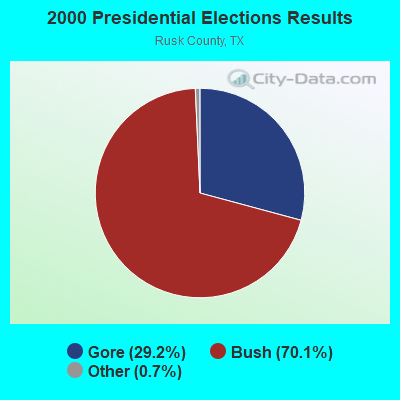
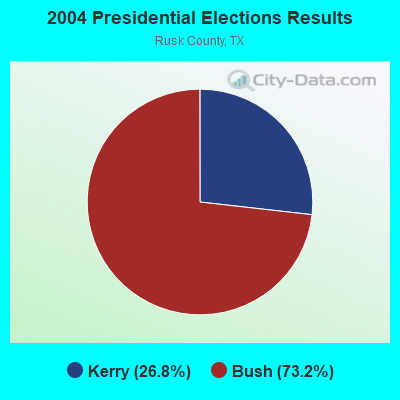
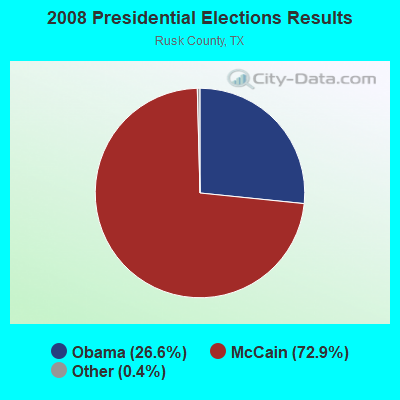
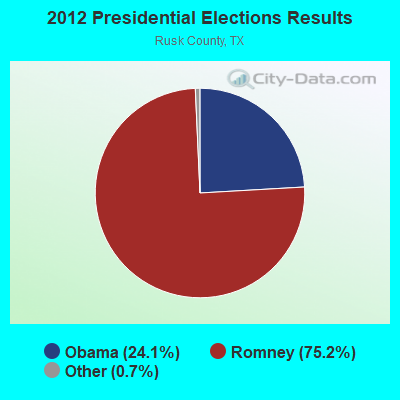
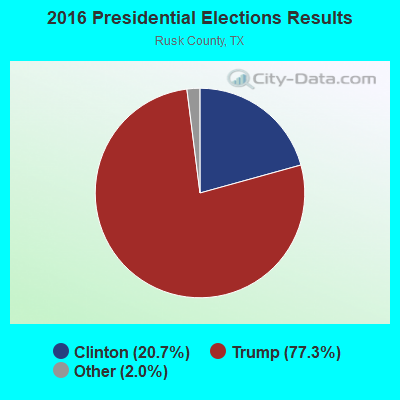
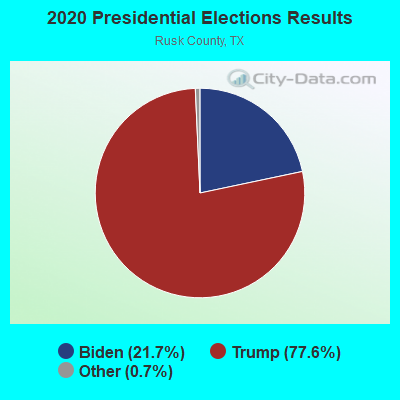
Graphs represent county-level data. Detailed 2008 Election Results
Religion statistics for Henderson, TX (based on Rusk County data)
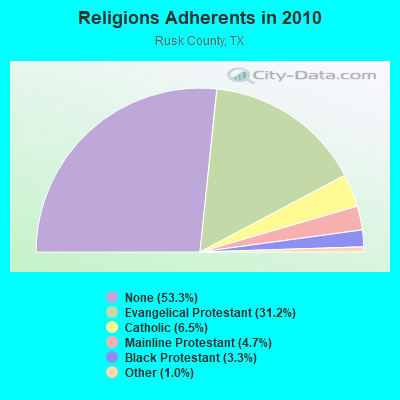
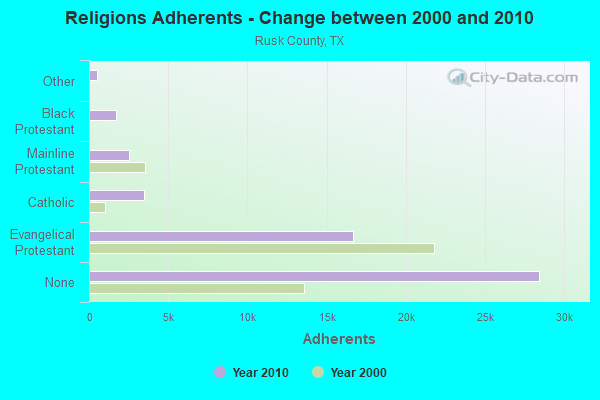
| Religion | Adherents | Congregations |
|---|---|---|
| Evangelical Protestant | 16,651 | 76 |
| Catholic | 3,458 | 3 |
| Mainline Protestant | 2,524 | 23 |
| Black Protestant | 1,736 | 12 |
| Other | 525 | 1 |
| None | 28,436 | - |
Food Environment Statistics:
| This county: | 1.65 / 10,000 pop. |
| Texas: | 1.47 / 10,000 pop. |
| Rusk County: | 0.21 / 10,000 pop. |
| State: | 0.14 / 10,000 pop. |
| This county: | 0.41 / 10,000 pop. |
| Texas: | 1.11 / 10,000 pop. |
| Rusk County: | 5.78 / 10,000 pop. |
| Texas: | 3.95 / 10,000 pop. |
| Here: | 3.92 / 10,000 pop. |
| Texas: | 6.13 / 10,000 pop. |
| Here: | 11.0% |
| State: | 8.9% |
| Rusk County: | 28.9% |
| Texas: | 26.6% |
| Rusk County: | 16.1% |
| State: | 15.7% |
Health and Nutrition:
| Henderson: | 47.1% |
| Texas: | 48.6% |
| Here: | 43.2% |
| Texas: | 47.4% |
| Here: | 28.8 |
| Texas: | 28.5 |
| This city: | 22.1% |
| Texas: | 20.6% |
| Here: | 11.8% |
| Texas: | 10.3% |
| This city: | 6.8 |
| Texas: | 6.8 |
| Here: | 32.8% |
| State: | 33.1% |
| Henderson: | 52.4% |
| Texas: | 56.2% |
| Henderson: | 77.5% |
| Texas: | 80.7% |
More about Health and Nutrition of Henderson, TX Residents
| Local government employment and payroll (March 2022) | |||||
| Function | Full-time employees | Monthly full-time payroll | Average yearly full-time wage | Part-time employees | Monthly part-time payroll |
|---|---|---|---|---|---|
| Police Protection - Officers | 34 | $174,601 | $61,624 | 0 | $0 |
| Firefighters | 20 | $100,939 | $60,563 | 0 | $0 |
| Solid Waste Management | 14 | $56,666 | $48,571 | 0 | $0 |
| Streets and Highways | 13 | $47,082 | $43,460 | 1 | $908 |
| Other Government Administration | 12 | $47,614 | $47,614 | 2 | $2,099 |
| Parks and Recreation | 9 | $39,284 | $52,379 | 2 | $211 |
| Police - Other | 9 | $38,310 | $51,080 | 0 | $0 |
| Housing and Community Development (Local) | 5 | $21,412 | $51,389 | 0 | $0 |
| Water Supply | 5 | $20,066 | $48,158 | 0 | $0 |
| Sewerage | 4 | $17,868 | $53,604 | 0 | $0 |
| Judicial and Legal | 4 | $13,979 | $41,937 | 0 | $0 |
| Health | 4 | $15,101 | $45,303 | 4 | $3,809 |
| Other and Unallocable | 2 | $9,589 | $57,534 | 0 | $0 |
| Financial Administration | 2 | $10,517 | $63,102 | 0 | $0 |
| Fire - Other | 1 | $3,498 | $41,976 | 0 | $0 |
| Totals for Government | 138 | $616,527 | $53,611 | 9 | $7,027 |
Henderson government finances - Expenditure in 2018 (per resident):
- Construction - Regular Highways: $1,448,000 ($108.18)
Water Utilities: $408,000 ($30.48)
Sewerage: $137,000 ($10.24)
Parks and Recreation: $102,000 ($7.62)
Central Staff Services: $42,000 ($3.14)
Police Protection: $22,000 ($1.64)
- Current Operations - Police Protection: $2,909,000 ($217.33)
Sewerage: $2,379,000 ($177.74)
Water Utilities: $1,947,000 ($145.46)
Solid Waste Management: $1,735,000 ($129.62)
Local Fire Protection: $1,596,000 ($119.24)
Regular Highways: $1,343,000 ($100.34)
General - Other: $1,222,000 ($91.30)
Central Staff Services: $538,000 ($40.19)
Protective Inspection and Regulation - Other: $359,000 ($26.82)
Judicial and Legal Services: $313,000 ($23.38)
Financial Administration: $292,000 ($21.82)
Parks and Recreation: $71,000 ($5.30)
- General - Interest on Debt: $334,000 ($24.95)
- Other Capital Outlay - Local Fire Protection: $240,000 ($17.93)
Police Protection: $141,000 ($10.53)
Sewerage: $86,000 ($6.43)
Regular Highways: $57,000 ($4.26)
Water Utilities: $55,000 ($4.11)
Central Staff Services: $23,000 ($1.72)
Protective Inspection and Regulation - Other: $2,000 ($0.15)
- Total Salaries and Wages: $5,696,000 ($425.55)
Henderson government finances - Revenue in 2018 (per resident):
- Charges - Solid Waste Management: $2,147,000 ($160.40)
Sewerage: $1,769,000 ($132.16)
Parks and Recreation: $4,000 ($0.30)
- Miscellaneous - General Revenue - Other: $724,000 ($54.09)
Fines and Forfeits: $435,000 ($32.50)
Interest Earnings: $27,000 ($2.02)
Rents: $24,000 ($1.79)
Royalties: $3,000 ($0.22)
- Revenue - Water Utilities: $2,699,000 ($201.64)
- State Intergovernmental - General Local Government Support: $9,000 ($0.67)
- Tax - General Sales and Gross Receipts: $3,906,000 ($291.82)
Property: $3,539,000 ($264.40)
Public Utilities Sales: $939,000 ($70.15)
Other License: $73,000 ($5.45)
Henderson government finances - Debt in 2018 (per resident):
- Long Term Debt - Beginning Outstanding - Unspecified Public Purpose: $8,362,000 ($624.73)
Outstanding Unspecified Public Purpose: $7,034,000 ($525.51)
Retired Unspecified Public Purpose: $1,328,000 ($99.22)
Henderson government finances - Cash and Securities in 2018 (per resident):
- Other Funds - Cash and Securities: $9,584,000 ($716.03)
- Sinking Funds - Cash and Securities: $169,000 ($12.63)
| Businesses in Henderson, TX | ||||
| Name | Count | Name | Count | |
|---|---|---|---|---|
| AT&T | 1 | Kroger | 1 | |
| AutoZone | 1 | Lane Furniture | 1 | |
| Baymont Inn | 1 | Little Caesars Pizza | 1 | |
| Best Western | 1 | Lowe's | 1 | |
| Burger King | 1 | McDonald's | 1 | |
| CVS | 1 | Nike | 2 | |
| Chevrolet | 1 | Pizza Hut | 1 | |
| Circle K | 2 | SONIC Drive-In | 2 | |
| Curves | 1 | Sears | 1 | |
| Dairy Queen | 1 | Taco Bell | 1 | |
| Domino's Pizza | 1 | U-Haul | 2 | |
| FedEx | 3 | UPS | 6 | |
| Goodwill | 1 | Verizon Wireless | 1 | |
| H&R Block | 1 | Walgreens | 1 | |
| Holiday Inn | 1 | Walmart | 1 | |
| KFC | 1 | |||
Strongest AM radio stations in Henderson:
- KWRD (1470 AM; 5 kW; HENDERSON, TX; Owner: JERRY RUSSELL D/B/A THE RUSSELL COMPANY)
- KOFY (1060 AM; daytime; 10 kW; GILMER, TX; Owner: JERRY RUSSELL D/B/A THE RUSSELL COMPANY)
- KEEL (710 AM; 50 kW; SHREVEPORT, LA; Owner: CITICASTERS LICENSES, L.P.)
- KTBB (600 AM; 5 kW; TYLER, TX; Owner: CITADEL BROADCASTING COMPANY)
- KWKH (1130 AM; 50 kW; SHREVEPORT, LA; Owner: CITICASTERS LICENSES, L.P.)
- KEES (1430 AM; 5 kW; GLADEWATER, TX; Owner: CITADEL BROADCASTING COMPANY)
- KFXR (1190 AM; 50 kW; DALLAS, TX; Owner: CLEAR CHANNEL BROADCASTING LICENSES, INC.)
- KRLD (1080 AM; 50 kW; DALLAS, TX; Owner: TEXAS INFINITY BROADCASTING L.P.)
- WBAP (820 AM; 50 kW; FORT WORTH, TX; Owner: WBAP-KSCS OPERATING, LTD.)
- KTRH (740 AM; 50 kW; HOUSTON, TX; Owner: AMFM TEXAS LICENSES LIMITED PARTNERSHIP)
- KBGE (1240 AM; 1 kW; KILGORE, TX; Owner: CAPSTAR TX LIMITED PARTNERSHIP)
- KGOL (1180 AM; 50 kW; HUMBLE, TX; Owner: ENTRAVISION HOLDINGS, LLC)
- KSKY (660 AM; 20 kW; BALCH SPRINGS, TX; Owner: BISON MEDIA, INC.)
Strongest FM radio stations in Henderson:
- KXAL-FM (100.3 FM; TATUM, TX; Owner: HUNT BROADCASTING, INC.)
- KNUE (101.5 FM; TYLER, TX; Owner: CAPSTAR TX LIMITED PARTNERSHIP)
- KPXI (100.7 FM; OVERTON, TX; Owner: INSPIRATION MEDIA OF TEXAS, LLC)
- KOOI (106.5 FM; JACKSONVILLE, TX; Owner: WALLER BROADCASTING, INC.)
- KKTX-FM (96.1 FM; KILGORE, TX; Owner: CAPSTAR TX LIMITED PARTNERSHIP)
- KBJS (90.3 FM; JACKSONVILLE, TX; Owner: EAST TEXAS MEDIA ASSOCIATION, INC.)
- KTYL-FM (93.1 FM; TYLER, TX; Owner: CAPSTAR TX LIMITED PARTNERSHIP)
- KYKX (105.7 FM; LONGVIEW, TX; Owner: WALLER MEDIA, LLC)
- KTPB (88.7 FM; KILGORE, TX; Owner: KILGORE JUNIOR COLLEGE)
- KVNE (89.5 FM; TYLER, TX; Owner: EDUC. RADIO FOUND. OF E. TEXAS, INC.)
- KBLZ (102.7 FM; WINONA, TX; Owner: S.O. 2,000, LC)
- KIXK (99.3 FM; WHITE OAK, TX; Owner: REYNOLDS RADIO, INC.)
- KISX (107.3 FM; WHITEHOUSE, TX; Owner: CAPSTAR TX LIMITED PARTNERSHIP)
- KFRO-FM (95.3 FM; GILMER, TX; Owner: WALLER MEDIA, LLC)
- KGLY (91.3 FM; TYLER, TX; Owner: EDUC. RADIO FOUND. OF E. TEXAS, INC.)
- KLJT (102.3 FM; JACKSONVILLE, TX; Owner: WALLER BROADCASTING, INC.)
TV broadcast stations around Henderson:
- KFXK (Channel 51; LONGVIEW, TX; Owner: WARWICK COMMUNICATIONS, INC.)
- KLSB-TV (Channel 19; NACOGDOCHES, TX; Owner: KLSB ACQUISITION CORP.)
- KETK-TV (Channel 56; JACKSONVILLE, TX; Owner: KETK LICENSEE L.P.)
- KLPN-LP (Channel 58; LONGVIEW, TX; Owner: WARWICK COMMUNICATIONS, INC.)
- KLTV (Channel 7; TYLER, TX; Owner: CIVCO, INC.)
- K26GA (Channel 26; TYLER/JACKSONVILLE, TX; Owner: THREE ANGELS BROADCASTING NETWORK)
- KLGV-LP (Channel 10; LONGVIEW, TX; Owner: INTERNATIONAL BROADCASTING NETWORK)
- National Bridge Inventory (NBI) Statistics
- 43Number of bridges
- 285ft / 87.2mTotal length
- $258,000Total costs
- 139,330Total average daily traffic
- 15,848Total average daily truck traffic
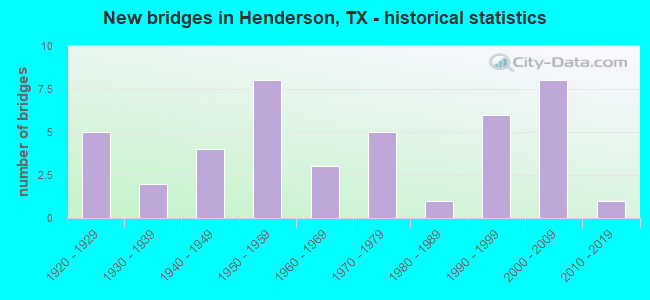
- New bridges - historical statistics
- 51920-1929
- 21930-1939
- 41940-1949
- 81950-1959
- 31960-1969
- 51970-1979
- 11980-1989
- 61990-1999
- 82000-2009
- 12010-2019
FCC Registered Antenna Towers: 286 (See the full list of FCC Registered Antenna Towers)
FCC Registered Commercial Land Mobile Towers: 1 (See the full list of FCC Registered Commercial Land Mobile Towers in Henderson, TX)
FCC Registered Broadcast Land Mobile Towers: 32 (See the full list of FCC Registered Broadcast Land Mobile Towers)
FCC Registered Microwave Towers: 55 (See the full list of FCC Registered Microwave Towers in this town)
FCC Registered Paging Towers: 4 (See the full list of FCC Registered Paging Towers)
FCC Registered Maritime Coast & Aviation Ground Towers: 4 (See the full list of FCC Registered Maritime Coast & Aviation Ground Towers)
FCC Registered Amateur Radio Licenses: 129 (See the full list of FCC Registered Amateur Radio Licenses in Henderson)
FAA Registered Aircraft Manufacturers and Dealers: 6 (See the full list of FAA Registered Manufacturers and Dealers in Henderson)
FAA Registered Aircraft: 38 (See the full list of FAA Registered Aircraft)
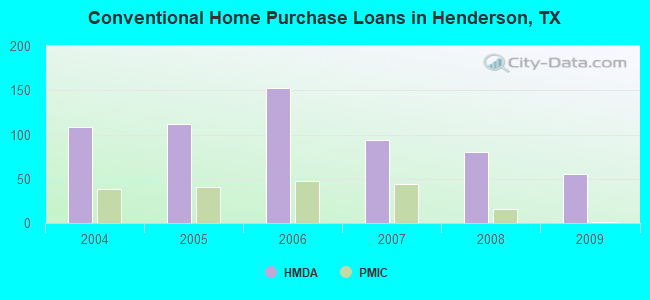
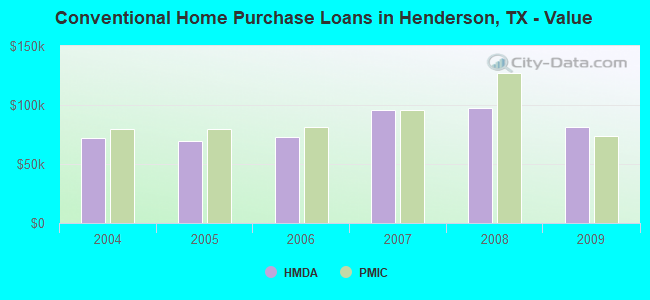
| Home Mortgage Disclosure Act Aggregated Statistics For Year 2009 (Based on 3 partial tracts) | ||||||||||||
| A) FHA, FSA/RHS & VA Home Purchase Loans | B) Conventional Home Purchase Loans | C) Refinancings | D) Home Improvement Loans | F) Non-occupant Loans on < 5 Family Dwellings (A B C & D) | G) Loans On Manufactured Home Dwelling (A B C & D) | |||||||
|---|---|---|---|---|---|---|---|---|---|---|---|---|
| Number | Average Value | Number | Average Value | Number | Average Value | Number | Average Value | Number | Average Value | Number | Average Value | |
| LOANS ORIGINATED | 23 | $112,536 | 55 | $81,131 | 54 | $102,145 | 48 | $28,701 | 28 | $55,946 | 1 | $47,180 |
| APPLICATIONS APPROVED, NOT ACCEPTED | 0 | $0 | 2 | $61,935 | 4 | $103,970 | 2 | $13,935 | 2 | $29,980 | 0 | $0 |
| APPLICATIONS DENIED | 7 | $96,301 | 14 | $113,510 | 22 | $78,633 | 13 | $35,018 | 4 | $94,575 | 2 | $115,925 |
| APPLICATIONS WITHDRAWN | 2 | $85,875 | 3 | $59,750 | 17 | $110,040 | 1 | $16,890 | 3 | $47,927 | 0 | $0 |
| FILES CLOSED FOR INCOMPLETENESS | 1 | $52,980 | 2 | $71,360 | 4 | $83,250 | 1 | $124,110 | 0 | $0 | 0 | $0 |
Detailed HMDA statistics for the following Tracts: 9507.00 , 9508.00, 9509.00
| Private Mortgage Insurance Companies Aggregated Statistics For Year 2009 (Based on 2 partial tracts) | ||||
| A) Conventional Home Purchase Loans | B) Refinancings | |||
|---|---|---|---|---|
| Number | Average Value | Number | Average Value | |
| LOANS ORIGINATED | 1 | $73,470 | 2 | $142,105 |
| APPLICATIONS APPROVED, NOT ACCEPTED | 1 | $163,830 | 0 | $0 |
| APPLICATIONS DENIED | 0 | $0 | 2 | $134,080 |
| APPLICATIONS WITHDRAWN | 0 | $0 | 0 | $0 |
| FILES CLOSED FOR INCOMPLETENESS | 0 | $0 | 0 | $0 |
Detailed PMIC statistics for the following Tracts: 9507.00 , 9508.00, 9509.00
2002 - 2018 National Fire Incident Reporting System (NFIRS) incidents
- Fire incident types reported to NFIRS in Henderson, TX
- 2,28959.2%Outside Fires
- 93224.1%Structure Fires
- 3739.6%Mobile Property/Vehicle Fires
- 2747.1%Other
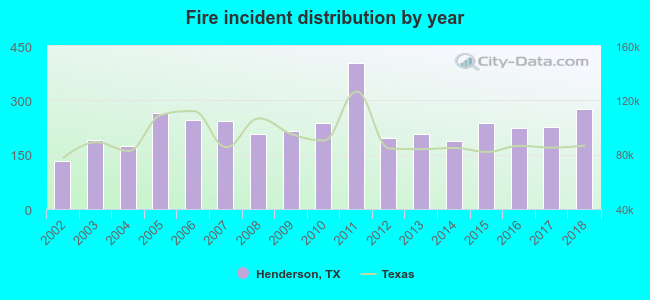 According to the data from the years 2002 - 2018 the average number of fires per year is 228. The highest number of reported fire incidents - 404 took place in 2011, and the least - 133 in 2002. The data has a rising trend.
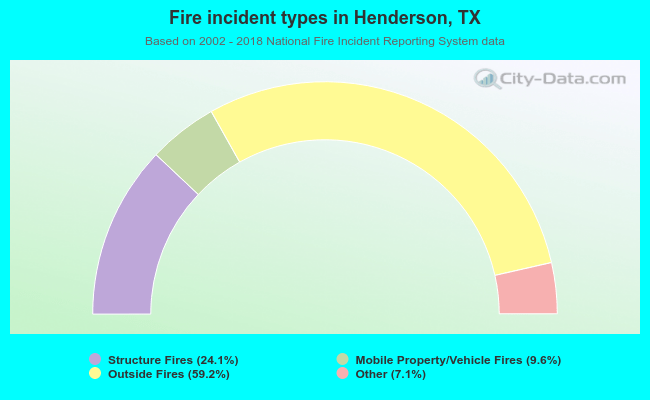 When looking into fire subcategories, the most incidents belonged to: Outside Fires (59.2%), and Structure Fires (24.1%).
Fire-safe hotels and motels in Henderson, Texas:
- Baymont Inn & Suites, 410 Hwy 79 S, Henderson, Texas 75652 , Phone: (903) 657-7900, Fax: (903) 657-7903
- Holiday Inn Express & Suites, 300 N Kilgore Dr, Henderson, Texas 75652 , Phone: (903) 657-5250, Fax: (903) 657-5231
- Best Western Inn Of Henderson, 1500 Us Hwy 259 S, Henderson, Texas 75654 , Phone: (903) 657-9561
| Most common first names in Henderson, TX among deceased individuals | ||
| Name | Count | Lived (average) |
|---|---|---|
| James | 210 | 74.0 years |
| Mary | 203 | 79.2 years |
| William | 200 | 76.6 years |
| John | 199 | 75.4 years |
| Robert | 109 | 75.8 years |
| Willie | 98 | 74.2 years |
| Annie | 85 | 80.6 years |
| George | 84 | 75.4 years |
| Charles | 77 | 72.1 years |
| Joe | 69 | 73.0 years |
| Most common last names in Henderson, TX among deceased individuals | ||
| Last name | Count | Lived (average) |
|---|---|---|
| Jones | 129 | 76.2 years |
| Smith | 111 | 77.0 years |
| Brown | 96 | 78.0 years |
| Johnson | 89 | 76.8 years |
| Williams | 69 | 74.0 years |
| Davis | 59 | 75.6 years |
| Sanders | 58 | 70.7 years |
| Wallace | 52 | 75.7 years |
| Thompson | 50 | 79.3 years |
| Harris | 50 | 80.8 years |
Henderson compared to Texas state average:
- Median house value below state average.
- Unemployed percentage below state average.
- Black race population percentage above state average.
- Median age above state average.
- Foreign-born population percentage below state average.
- Length of stay since moving in significantly above state average.
- House age above state average.
- Institutionalized population percentage significantly above state average.
Henderson on our top lists:
- #16 on the list of "Top 101 cities with the largest percentage of people in dormitories (population 1,000+)"
- #16 on the list of "Top 101 cities with the largest percentage of people in group homes (population 1,000+)"
- #16 on the list of "Top 101 cities with the largest percentage of people in hospitals/wards, hospices, and schools for the handicapped (population 1,000+)"
- #16 on the list of "Top 101 cities with the largest percentage of people in long-term care (population 1,000+)"
- #16 on the list of "Top 101 cities with the largest percentage of people in military quarters (population 1,000+)"
- #16 on the list of "Top 101 cities with the largest percentage of people in noninstitutionalized settings (population 1,000+)"
- #16 on the list of "Top 101 cities with the largest percentage of people in on base quarters (population 1,000+)"
- #16 on the list of "Top 101 cities with the largest percentage of people in schools, hospitals, or wards for the physically handicapped (population 1,000+)"
- #31 on the list of "Top 101 cities with the largest percentage of people in military disciplinary barracks (population 1,000+)"
- #28 on the list of "Top 101 counties with the lowest surface withdrawal of fresh water for public supply"

|
|
Total of 22 patent applications in 2008-2024.