Jeffersonville, Indiana Submit your own pictures of this city and show them to the world
OSM Map
General Map
Google Map
MSN Map
OSM Map
General Map
Google Map
MSN Map
OSM Map
General Map
Google Map
MSN Map
OSM Map
General Map
Google Map
MSN Map
Please wait while loading the map...
Population in 2022: 51,030 (100% urban, 0% rural). Population change since 2000: +86.5%Males: 25,205 Females: 25,825
March 2022 cost of living index in Jeffersonville: 86.5 (less than average, U.S. average is 100) Percentage of residents living in poverty in 2022: 10.5%for White Non-Hispanic residents , 14.2% for Black residents , 22.1% for Hispanic or Latino residents , 13.1% for other race residents , 15.6% for two or more races residents )
Profiles of local businesses
Business Search - 14 Million verified businesses
Data:
Median household income ($)
Median household income (% change since 2000)
Household income diversity
Ratio of average income to average house value (%)
Ratio of average income to average rent
Median household income ($) - White
Median household income ($) - Black or African American
Median household income ($) - Asian
Median household income ($) - Hispanic or Latino
Median household income ($) - American Indian and Alaska Native
Median household income ($) - Multirace
Median household income ($) - Other Race
Median household income for houses/condos with a mortgage ($)
Median household income for apartments without a mortgage ($)
Races - White alone (%)
Races - White alone (% change since 2000)
Races - Black alone (%)
Races - Black alone (% change since 2000)
Races - American Indian alone (%)
Races - American Indian alone (% change since 2000)
Races - Asian alone (%)
Races - Asian alone (% change since 2000)
Races - Hispanic (%)
Races - Hispanic (% change since 2000)
Races - Native Hawaiian and Other Pacific Islander alone (%)
Races - Native Hawaiian and Other Pacific Islander alone (% change since 2000)
Races - Two or more races (%)
Races - Two or more races (% change since 2000)
Races - Other race alone (%)
Races - Other race alone (% change since 2000)
Racial diversity
Unemployment (%)
Unemployment (% change since 2000)
Unemployment (%) - White
Unemployment (%) - Black or African American
Unemployment (%) - Asian
Unemployment (%) - Hispanic or Latino
Unemployment (%) - American Indian and Alaska Native
Unemployment (%) - Multirace
Unemployment (%) - Other Race
Population density (people per square mile)
Population - Males (%)
Population - Females (%)
Population - Males (%) - White
Population - Males (%) - Black or African American
Population - Males (%) - Asian
Population - Males (%) - Hispanic or Latino
Population - Males (%) - American Indian and Alaska Native
Population - Males (%) - Multirace
Population - Males (%) - Other Race
Population - Females (%) - White
Population - Females (%) - Black or African American
Population - Females (%) - Asian
Population - Females (%) - Hispanic or Latino
Population - Females (%) - American Indian and Alaska Native
Population - Females (%) - Multirace
Population - Females (%) - Other Race
Coronavirus confirmed cases (Apr 23, 2024)
Deaths caused by coronavirus (Apr 23, 2024)
Coronavirus confirmed cases (per 100k population) (Apr 23, 2024)
Deaths caused by coronavirus (per 100k population) (Apr 23, 2024)
Daily increase in number of cases (Apr 23, 2024)
Weekly increase in number of cases (Apr 23, 2024)
Cases doubled (in days) (Apr 23, 2024)
Hospitalized patients (Apr 18, 2022)
Negative test results (Apr 18, 2022)
Total test results (Apr 18, 2022)
COVID Vaccine doses distributed (per 100k population) (Sep 19, 2023)
COVID Vaccine doses administered (per 100k population) (Sep 19, 2023)
COVID Vaccine doses distributed (Sep 19, 2023)
COVID Vaccine doses administered (Sep 19, 2023)
Likely homosexual households (%)
Likely homosexual households (% change since 2000)
Likely homosexual households - Lesbian couples (%)
Likely homosexual households - Lesbian couples (% change since 2000)
Likely homosexual households - Gay men (%)
Likely homosexual households - Gay men (% change since 2000)
Cost of living index
Median gross rent ($)
Median contract rent ($)
Median monthly housing costs ($)
Median house or condo value ($)
Median house or condo value ($ change since 2000)
Mean house or condo value by units in structure - 1, detached ($)
Mean house or condo value by units in structure - 1, attached ($)
Mean house or condo value by units in structure - 2 ($)
Mean house or condo value by units in structure by units in structure - 3 or 4 ($)
Mean house or condo value by units in structure - 5 or more ($)
Mean house or condo value by units in structure - Boat, RV, van, etc. ($)
Mean house or condo value by units in structure - Mobile home ($)
Median house or condo value ($) - White
Median house or condo value ($) - Black or African American
Median house or condo value ($) - Asian
Median house or condo value ($) - Hispanic or Latino
Median house or condo value ($) - American Indian and Alaska Native
Median house or condo value ($) - Multirace
Median house or condo value ($) - Other Race
Median resident age
Resident age diversity
Median resident age - Males
Median resident age - Females
Median resident age - White
Median resident age - Black or African American
Median resident age - Asian
Median resident age - Hispanic or Latino
Median resident age - American Indian and Alaska Native
Median resident age - Multirace
Median resident age - Other Race
Median resident age - Males - White
Median resident age - Males - Black or African American
Median resident age - Males - Asian
Median resident age - Males - Hispanic or Latino
Median resident age - Males - American Indian and Alaska Native
Median resident age - Males - Multirace
Median resident age - Males - Other Race
Median resident age - Females - White
Median resident age - Females - Black or African American
Median resident age - Females - Asian
Median resident age - Females - Hispanic or Latino
Median resident age - Females - American Indian and Alaska Native
Median resident age - Females - Multirace
Median resident age - Females - Other Race
Commute - mean travel time to work (minutes)
Travel time to work - Less than 5 minutes (%)
Travel time to work - Less than 5 minutes (% change since 2000)
Travel time to work - 5 to 9 minutes (%)
Travel time to work - 5 to 9 minutes (% change since 2000)
Travel time to work - 10 to 19 minutes (%)
Travel time to work - 10 to 19 minutes (% change since 2000)
Travel time to work - 20 to 29 minutes (%)
Travel time to work - 20 to 29 minutes (% change since 2000)
Travel time to work - 30 to 39 minutes (%)
Travel time to work - 30 to 39 minutes (% change since 2000)
Travel time to work - 40 to 59 minutes (%)
Travel time to work - 40 to 59 minutes (% change since 2000)
Travel time to work - 60 to 89 minutes (%)
Travel time to work - 60 to 89 minutes (% change since 2000)
Travel time to work - 90 or more minutes (%)
Travel time to work - 90 or more minutes (% change since 2000)
Marital status - Never married (%)
Marital status - Now married (%)
Marital status - Separated (%)
Marital status - Widowed (%)
Marital status - Divorced (%)
Median family income ($)
Median family income (% change since 2000)
Median non-family income ($)
Median non-family income (% change since 2000)
Median per capita income ($)
Median per capita income (% change since 2000)
Median family income ($) - White
Median family income ($) - Black or African American
Median family income ($) - Asian
Median family income ($) - Hispanic or Latino
Median family income ($) - American Indian and Alaska Native
Median family income ($) - Multirace
Median family income ($) - Other Race
Median year house/condo built
Median year apartment built
Year house built - Built 2005 or later (%)
Year house built - Built 2000 to 2004 (%)
Year house built - Built 1990 to 1999 (%)
Year house built - Built 1980 to 1989 (%)
Year house built - Built 1970 to 1979 (%)
Year house built - Built 1960 to 1969 (%)
Year house built - Built 1950 to 1959 (%)
Year house built - Built 1940 to 1949 (%)
Year house built - Built 1939 or earlier (%)
Average household size
Household density (households per square mile)
Average household size - White
Average household size - Black or African American
Average household size - Asian
Average household size - Hispanic or Latino
Average household size - American Indian and Alaska Native
Average household size - Multirace
Average household size - Other Race
Occupied housing units (%)
Vacant housing units (%)
Owner occupied housing units (%)
Renter occupied housing units (%)
Vacancy status - For rent (%)
Vacancy status - For sale only (%)
Vacancy status - Rented or sold, not occupied (%)
Vacancy status - For seasonal, recreational, or occasional use (%)
Vacancy status - For migrant workers (%)
Vacancy status - Other vacant (%)
Residents with income below the poverty level (%)
Residents with income below 50% of the poverty level (%)
Children below poverty level (%)
Poor families by family type - Married-couple family (%)
Poor families by family type - Male, no wife present (%)
Poor families by family type - Female, no husband present (%)
Poverty status for native-born residents (%)
Poverty status for foreign-born residents (%)
Poverty among high school graduates not in families (%)
Poverty among people who did not graduate high school not in families (%)
Residents with income below the poverty level (%) - White
Residents with income below the poverty level (%) - Black or African American
Residents with income below the poverty level (%) - Asian
Residents with income below the poverty level (%) - Hispanic or Latino
Residents with income below the poverty level (%) - American Indian and Alaska Native
Residents with income below the poverty level (%) - Multirace
Residents with income below the poverty level (%) - Other Race
Air pollution - Air Quality Index (AQI)
Air pollution - CO
Air pollution - NO2
Air pollution - SO2
Air pollution - Ozone
Air pollution - PM10
Air pollution - PM25
Air pollution - Pb
Crime - Murders per 100,000 population
Crime - Rapes per 100,000 population
Crime - Robberies per 100,000 population
Crime - Assaults per 100,000 population
Crime - Burglaries per 100,000 population
Crime - Thefts per 100,000 population
Crime - Auto thefts per 100,000 population
Crime - Arson per 100,000 population
Crime - City-data.com crime index
Crime - Violent crime index
Crime - Property crime index
Crime - Murders per 100,000 population (5 year average)
Crime - Rapes per 100,000 population (5 year average)
Crime - Robberies per 100,000 population (5 year average)
Crime - Assaults per 100,000 population (5 year average)
Crime - Burglaries per 100,000 population (5 year average)
Crime - Thefts per 100,000 population (5 year average)
Crime - Auto thefts per 100,000 population (5 year average)
Crime - Arson per 100,000 population (5 year average)
Crime - City-data.com crime index (5 year average)
Crime - Violent crime index (5 year average)
Crime - Property crime index (5 year average)
1996 Presidential Elections Results (%) - Democratic Party (Clinton)
1996 Presidential Elections Results (%) - Republican Party (Dole)
1996 Presidential Elections Results (%) - Other
2000 Presidential Elections Results (%) - Democratic Party (Gore)
2000 Presidential Elections Results (%) - Republican Party (Bush)
2000 Presidential Elections Results (%) - Other
2004 Presidential Elections Results (%) - Democratic Party (Kerry)
2004 Presidential Elections Results (%) - Republican Party (Bush)
2004 Presidential Elections Results (%) - Other
2008 Presidential Elections Results (%) - Democratic Party (Obama)
2008 Presidential Elections Results (%) - Republican Party (McCain)
2008 Presidential Elections Results (%) - Other
2012 Presidential Elections Results (%) - Democratic Party (Obama)
2012 Presidential Elections Results (%) - Republican Party (Romney)
2012 Presidential Elections Results (%) - Other
2016 Presidential Elections Results (%) - Democratic Party (Clinton)
2016 Presidential Elections Results (%) - Republican Party (Trump)
2016 Presidential Elections Results (%) - Other
2020 Presidential Elections Results (%) - Democratic Party (Biden)
2020 Presidential Elections Results (%) - Republican Party (Trump)
2020 Presidential Elections Results (%) - Other
Ancestries Reported - Arab (%)
Ancestries Reported - Czech (%)
Ancestries Reported - Danish (%)
Ancestries Reported - Dutch (%)
Ancestries Reported - English (%)
Ancestries Reported - French (%)
Ancestries Reported - French Canadian (%)
Ancestries Reported - German (%)
Ancestries Reported - Greek (%)
Ancestries Reported - Hungarian (%)
Ancestries Reported - Irish (%)
Ancestries Reported - Italian (%)
Ancestries Reported - Lithuanian (%)
Ancestries Reported - Norwegian (%)
Ancestries Reported - Polish (%)
Ancestries Reported - Portuguese (%)
Ancestries Reported - Russian (%)
Ancestries Reported - Scotch-Irish (%)
Ancestries Reported - Scottish (%)
Ancestries Reported - Slovak (%)
Ancestries Reported - Subsaharan African (%)
Ancestries Reported - Swedish (%)
Ancestries Reported - Swiss (%)
Ancestries Reported - Ukrainian (%)
Ancestries Reported - United States (%)
Ancestries Reported - Welsh (%)
Ancestries Reported - West Indian (%)
Ancestries Reported - Other (%)
Educational Attainment - No schooling completed (%)
Educational Attainment - Less than high school (%)
Educational Attainment - High school or equivalent (%)
Educational Attainment - Less than 1 year of college (%)
Educational Attainment - 1 or more years of college (%)
Educational Attainment - Associate degree (%)
Educational Attainment - Bachelor's degree (%)
Educational Attainment - Master's degree (%)
Educational Attainment - Professional school degree (%)
Educational Attainment - Doctorate degree (%)
School Enrollment - Nursery, preschool (%)
School Enrollment - Kindergarten (%)
School Enrollment - Grade 1 to 4 (%)
School Enrollment - Grade 5 to 8 (%)
School Enrollment - Grade 9 to 12 (%)
School Enrollment - College undergrad (%)
School Enrollment - Graduate or professional (%)
School Enrollment - Not enrolled in school (%)
School enrollment - Public schools (%)
School enrollment - Private schools (%)
School enrollment - Not enrolled (%)
Median number of rooms in houses and condos
Median number of rooms in apartments
Housing units lacking complete plumbing facilities (%)
Housing units lacking complete kitchen facilities (%)
Density of houses
Urban houses (%)
Rural houses (%)
Households with people 60 years and over (%)
Households with people 65 years and over (%)
Households with people 75 years and over (%)
Households with one or more nonrelatives (%)
Households with no nonrelatives (%)
Population in households (%)
Family households (%)
Nonfamily households (%)
Population in families (%)
Family households with own children (%)
Median number of bedrooms in owner occupied houses
Mean number of bedrooms in owner occupied houses
Median number of bedrooms in renter occupied houses
Mean number of bedrooms in renter occupied houses
Median number of vehichles in owner occupied houses
Mean number of vehichles in owner occupied houses
Median number of vehichles in renter occupied houses
Mean number of vehichles in renter occupied houses
Mortgage status - with mortgage (%)
Mortgage status - with second mortgage (%)
Mortgage status - with home equity loan (%)
Mortgage status - with both second mortgage and home equity loan (%)
Mortgage status - without a mortgage (%)
Average family size
Average family size - White
Average family size - Black or African American
Average family size - Asian
Average family size - Hispanic or Latino
Average family size - American Indian and Alaska Native
Average family size - Multirace
Average family size - Other Race
Geographical mobility - Same house 1 year ago (%)
Geographical mobility - Moved within same county (%)
Geographical mobility - Moved from different county within same state (%)
Geographical mobility - Moved from different state (%)
Geographical mobility - Moved from abroad (%)
Place of birth - Born in state of residence (%)
Place of birth - Born in other state (%)
Place of birth - Native, outside of US (%)
Place of birth - Foreign born (%)
Housing units in structures - 1, detached (%)
Housing units in structures - 1, attached (%)
Housing units in structures - 2 (%)
Housing units in structures - 3 or 4 (%)
Housing units in structures - 5 to 9 (%)
Housing units in structures - 10 to 19 (%)
Housing units in structures - 20 to 49 (%)
Housing units in structures - 50 or more (%)
Housing units in structures - Mobile home (%)
Housing units in structures - Boat, RV, van, etc. (%)
House/condo owner moved in on average (years ago)
Renter moved in on average (years ago)
Year householder moved into unit - Moved in 1999 to March 2000 (%)
Year householder moved into unit - Moved in 1995 to 1998 (%)
Year householder moved into unit - Moved in 1990 to 1994 (%)
Year householder moved into unit - Moved in 1980 to 1989 (%)
Year householder moved into unit - Moved in 1970 to 1979 (%)
Year householder moved into unit - Moved in 1969 or earlier (%)
Means of transportation to work - Drove car alone (%)
Means of transportation to work - Carpooled (%)
Means of transportation to work - Public transportation (%)
Means of transportation to work - Bus or trolley bus (%)
Means of transportation to work - Streetcar or trolley car (%)
Means of transportation to work - Subway or elevated (%)
Means of transportation to work - Railroad (%)
Means of transportation to work - Ferryboat (%)
Means of transportation to work - Taxicab (%)
Means of transportation to work - Motorcycle (%)
Means of transportation to work - Bicycle (%)
Means of transportation to work - Walked (%)
Means of transportation to work - Other means (%)
Working at home (%)
Industry diversity
Most Common Industries - Agriculture, forestry, fishing and hunting, and mining (%)
Most Common Industries - Agriculture, forestry, fishing and hunting (%)
Most Common Industries - Mining, quarrying, and oil and gas extraction (%)
Most Common Industries - Construction (%)
Most Common Industries - Manufacturing (%)
Most Common Industries - Wholesale trade (%)
Most Common Industries - Retail trade (%)
Most Common Industries - Transportation and warehousing, and utilities (%)
Most Common Industries - Transportation and warehousing (%)
Most Common Industries - Utilities (%)
Most Common Industries - Information (%)
Most Common Industries - Finance and insurance, and real estate and rental and leasing (%)
Most Common Industries - Finance and insurance (%)
Most Common Industries - Real estate and rental and leasing (%)
Most Common Industries - Professional, scientific, and management, and administrative and waste management services (%)
Most Common Industries - Professional, scientific, and technical services (%)
Most Common Industries - Management of companies and enterprises (%)
Most Common Industries - Administrative and support and waste management services (%)
Most Common Industries - Educational services, and health care and social assistance (%)
Most Common Industries - Educational services (%)
Most Common Industries - Health care and social assistance (%)
Most Common Industries - Arts, entertainment, and recreation, and accommodation and food services (%)
Most Common Industries - Arts, entertainment, and recreation (%)
Most Common Industries - Accommodation and food services (%)
Most Common Industries - Other services, except public administration (%)
Most Common Industries - Public administration (%)
Occupation diversity
Most Common Occupations - Management, business, science, and arts occupations (%)
Most Common Occupations - Management, business, and financial occupations (%)
Most Common Occupations - Management occupations (%)
Most Common Occupations - Business and financial operations occupations (%)
Most Common Occupations - Computer, engineering, and science occupations (%)
Most Common Occupations - Computer and mathematical occupations (%)
Most Common Occupations - Architecture and engineering occupations (%)
Most Common Occupations - Life, physical, and social science occupations (%)
Most Common Occupations - Education, legal, community service, arts, and media occupations (%)
Most Common Occupations - Community and social service occupations (%)
Most Common Occupations - Legal occupations (%)
Most Common Occupations - Education, training, and library occupations (%)
Most Common Occupations - Arts, design, entertainment, sports, and media occupations (%)
Most Common Occupations - Healthcare practitioners and technical occupations (%)
Most Common Occupations - Health diagnosing and treating practitioners and other technical occupations (%)
Most Common Occupations - Health technologists and technicians (%)
Most Common Occupations - Service occupations (%)
Most Common Occupations - Healthcare support occupations (%)
Most Common Occupations - Protective service occupations (%)
Most Common Occupations - Fire fighting and prevention, and other protective service workers including supervisors (%)
Most Common Occupations - Law enforcement workers including supervisors (%)
Most Common Occupations - Food preparation and serving related occupations (%)
Most Common Occupations - Building and grounds cleaning and maintenance occupations (%)
Most Common Occupations - Personal care and service occupations (%)
Most Common Occupations - Sales and office occupations (%)
Most Common Occupations - Sales and related occupations (%)
Most Common Occupations - Office and administrative support occupations (%)
Most Common Occupations - Natural resources, construction, and maintenance occupations (%)
Most Common Occupations - Farming, fishing, and forestry occupations (%)
Most Common Occupations - Construction and extraction occupations (%)
Most Common Occupations - Installation, maintenance, and repair occupations (%)
Most Common Occupations - Production, transportation, and material moving occupations (%)
Most Common Occupations - Production occupations (%)
Most Common Occupations - Transportation occupations (%)
Most Common Occupations - Material moving occupations (%)
People in Group quarters - Institutionalized population (%)
People in Group quarters - Correctional institutions (%)
People in Group quarters - Federal prisons and detention centers (%)
People in Group quarters - Halfway houses (%)
People in Group quarters - Local jails and other confinement facilities (including police lockups) (%)
People in Group quarters - Military disciplinary barracks (%)
People in Group quarters - State prisons (%)
People in Group quarters - Other types of correctional institutions (%)
People in Group quarters - Nursing homes (%)
People in Group quarters - Hospitals/wards, hospices, and schools for the handicapped (%)
People in Group quarters - Hospitals/wards and hospices for chronically ill (%)
People in Group quarters - Hospices or homes for chronically ill (%)
People in Group quarters - Military hospitals or wards for chronically ill (%)
People in Group quarters - Other hospitals or wards for chronically ill (%)
People in Group quarters - Hospitals or wards for drug/alcohol abuse (%)
People in Group quarters - Mental (Psychiatric) hospitals or wards (%)
People in Group quarters - Schools, hospitals, or wards for the mentally retarded (%)
People in Group quarters - Schools, hospitals, or wards for the physically handicapped (%)
People in Group quarters - Institutions for the deaf (%)
People in Group quarters - Institutions for the blind (%)
People in Group quarters - Orthopedic wards and institutions for the physically handicapped (%)
People in Group quarters - Wards in general hospitals for patients who have no usual home elsewhere (%)
People in Group quarters - Wards in military hospitals for patients who have no usual home elsewhere (%)
People in Group quarters - Juvenile institutions (%)
People in Group quarters - Long-term care (%)
People in Group quarters - Homes for abused, dependent, and neglected children (%)
People in Group quarters - Residential treatment centers for emotionally disturbed children (%)
People in Group quarters - Training schools for juvenile delinquents (%)
People in Group quarters - Short-term care, detention or diagnostic centers for delinquent children (%)
People in Group quarters - Type of juvenile institution unknown (%)
People in Group quarters - Noninstitutionalized population (%)
People in Group quarters - College dormitories (includes college quarters off campus) (%)
People in Group quarters - Military quarters (%)
People in Group quarters - On base (%)
People in Group quarters - Barracks, unaccompanied personnel housing (UPH), (Enlisted/Officer), ;and similar group living quarters for military personnel (%)
People in Group quarters - Transient quarters for temporary residents (%)
People in Group quarters - Military ships (%)
People in Group quarters - Group homes (%)
People in Group quarters - Homes or halfway houses for drug/alcohol abuse (%)
People in Group quarters - Homes for the mentally ill (%)
People in Group quarters - Homes for the mentally retarded (%)
People in Group quarters - Homes for the physically handicapped (%)
People in Group quarters - Other group homes (%)
People in Group quarters - Religious group quarters (%)
People in Group quarters - Dormitories (%)
People in Group quarters - Agriculture workers' dormitories on farms (%)
People in Group quarters - Job Corps and vocational training facilities (%)
People in Group quarters - Other workers' dormitories (%)
People in Group quarters - Crews of maritime vessels (%)
People in Group quarters - Other nonhousehold living situations (%)
People in Group quarters - Other noninstitutional group quarters (%)
Residents speaking English at home (%)
Residents speaking English at home - Born in the United States (%)
Residents speaking English at home - Native, born elsewhere (%)
Residents speaking English at home - Foreign born (%)
Residents speaking Spanish at home (%)
Residents speaking Spanish at home - Born in the United States (%)
Residents speaking Spanish at home - Native, born elsewhere (%)
Residents speaking Spanish at home - Foreign born (%)
Residents speaking other language at home (%)
Residents speaking other language at home - Born in the United States (%)
Residents speaking other language at home - Native, born elsewhere (%)
Residents speaking other language at home - Foreign born (%)
Class of Workers - Employee of private company (%)
Class of Workers - Self-employed in own incorporated business (%)
Class of Workers - Private not-for-profit wage and salary workers (%)
Class of Workers - Local government workers (%)
Class of Workers - State government workers (%)
Class of Workers - Federal government workers (%)
Class of Workers - Self-employed workers in own not incorporated business and Unpaid family workers (%)
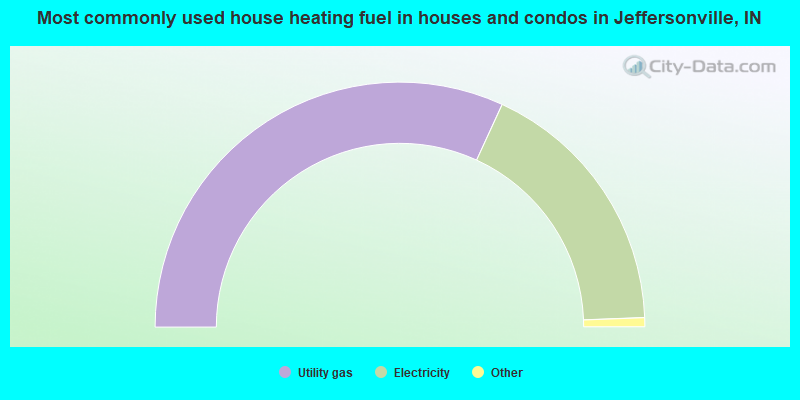
House heating fuel used in houses and condos - Utility gas (%)
House heating fuel used in houses and condos - Bottled, tank, or LP gas (%)
House heating fuel used in houses and condos - Electricity (%)
House heating fuel used in houses and condos - Fuel oil, kerosene, etc. (%)
House heating fuel used in houses and condos - Coal or coke (%)
House heating fuel used in houses and condos - Wood (%)
House heating fuel used in houses and condos - Solar energy (%)
House heating fuel used in houses and condos - Other fuel (%)
House heating fuel used in houses and condos - No fuel used (%)
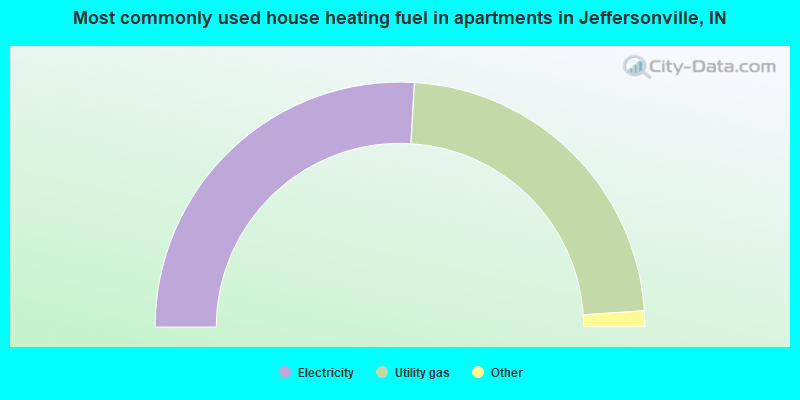
House heating fuel used in apartments - Utility gas (%)
House heating fuel used in apartments - Bottled, tank, or LP gas (%)
House heating fuel used in apartments - Electricity (%)
House heating fuel used in apartments - Fuel oil, kerosene, etc. (%)
House heating fuel used in apartments - Coal or coke (%)
House heating fuel used in apartments - Wood (%)
House heating fuel used in apartments - Solar energy (%)
House heating fuel used in apartments - Other fuel (%)
House heating fuel used in apartments - No fuel used (%)
Armed forces status - In Armed Forces (%)
Armed forces status - Civilian (%)
Armed forces status - Civilian - Veteran (%)
Armed forces status - Civilian - Nonveteran (%)
Fatal accidents locations in years 2005-2021
Fatal accidents locations in 2005
Fatal accidents locations in 2006
Fatal accidents locations in 2007
Fatal accidents locations in 2008
Fatal accidents locations in 2009
Fatal accidents locations in 2010
Fatal accidents locations in 2011
Fatal accidents locations in 2012
Fatal accidents locations in 2013
Fatal accidents locations in 2014
Fatal accidents locations in 2015
Fatal accidents locations in 2016
Fatal accidents locations in 2017
Fatal accidents locations in 2018
Fatal accidents locations in 2019
Fatal accidents locations in 2020
Fatal accidents locations in 2021
Alcohol use - People drinking some alcohol every month (%)
Alcohol use - People not drinking at all (%)
Alcohol use - Average days/month drinking alcohol
Alcohol use - Average drinks/week
Alcohol use - Average days/year people drink much
Audiometry - Average condition of hearing (%)
Audiometry - People that can hear a whisper from across a quiet room (%)
Audiometry - People that can hear normal voice from across a quiet room (%)
Audiometry - Ears ringing, roaring, buzzing (%)
Audiometry - Had a job exposure to loud noise (%)
Audiometry - Had off-work exposure to loud noise (%)
Blood Pressure & Cholesterol - Has high blood pressure (%)
Blood Pressure & Cholesterol - Checking blood pressure at home (%)
Blood Pressure & Cholesterol - Frequently checking blood cholesterol (%)
Blood Pressure & Cholesterol - Has high cholesterol level (%)
Consumer Behavior - Money monthly spent on food at supermarket/grocery store
Consumer Behavior - Money monthly spent on food at other stores
Consumer Behavior - Money monthly spent on eating out
Consumer Behavior - Money monthly spent on carryout/delivered foods
Consumer Behavior - Income spent on food at supermarket/grocery store (%)
Consumer Behavior - Income spent on food at other stores (%)
Consumer Behavior - Income spent on eating out (%)
Consumer Behavior - Income spent on carryout/delivered foods (%)
Current Health Status - General health condition (%)
Current Health Status - Blood donors (%)
Current Health Status - Has blood ever tested for HIV virus (%)
Current Health Status - Left-handed people (%)
Dermatology - People using sunscreen (%)
Diabetes - Diabetics (%)
Diabetes - Had a blood test for high blood sugar (%)
Diabetes - People taking insulin (%)
Diet Behavior & Nutrition - Diet health (%)
Diet Behavior & Nutrition - Milk product consumption (# of products/month)
Diet Behavior & Nutrition - Meals not home prepared (#/week)
Diet Behavior & Nutrition - Meals from fast food or pizza place (#/week)
Diet Behavior & Nutrition - Ready-to-eat foods (#/month)
Diet Behavior & Nutrition - Frozen meals/pizza (#/month)
Drug Use - People that ever used marijuana or hashish (%)
Drug Use - Ever used hard drugs (%)
Drug Use - Ever used any form of cocaine (%)
Drug Use - Ever used heroin (%)
Drug Use - Ever used methamphetamine (%)
Health Insurance - People covered by health insurance (%)
Kidney Conditions-Urology - Avg. # of times urinating at night
Medical Conditions - People with asthma (%)
Medical Conditions - People with anemia (%)
Medical Conditions - People with psoriasis (%)
Medical Conditions - People with overweight (%)
Medical Conditions - Elderly people having difficulties in thinking or remembering (%)
Medical Conditions - People who ever received blood transfusion (%)
Medical Conditions - People having trouble seeing even with glass/contacts (%)
Medical Conditions - People with arthritis (%)
Medical Conditions - People with gout (%)
Medical Conditions - People with congestive heart failure (%)
Medical Conditions - People with coronary heart disease (%)
Medical Conditions - People with angina pectoris (%)
Medical Conditions - People who ever had heart attack (%)
Medical Conditions - People who ever had stroke (%)
Medical Conditions - People with emphysema (%)
Medical Conditions - People with thyroid problem (%)
Medical Conditions - People with chronic bronchitis (%)
Medical Conditions - People with any liver condition (%)
Medical Conditions - People who ever had cancer or malignancy (%)
Mental Health - People who have little interest in doing things (%)
Mental Health - People feeling down, depressed, or hopeless (%)
Mental Health - People who have trouble sleeping or sleeping too much (%)
Mental Health - People feeling tired or having little energy (%)
Mental Health - People with poor appetite or overeating (%)
Mental Health - People feeling bad about themself (%)
Mental Health - People who have trouble concentrating on things (%)
Mental Health - People moving or speaking slowly or too fast (%)
Mental Health - People having thoughts they would be better off dead (%)
Oral Health - Average years since last visit a dentist
Oral Health - People embarrassed because of mouth (%)
Oral Health - People with gum disease (%)
Oral Health - General health of teeth and gums (%)
Oral Health - Average days a week using dental floss/device
Oral Health - Average days a week using mouthwash for dental problem
Oral Health - Average number of teeth
Pesticide Use - Households using pesticides to control insects (%)
Pesticide Use - Households using pesticides to kill weeds (%)
Physical Activity - People doing vigorous-intensity work activities (%)
Physical Activity - People doing moderate-intensity work activities (%)
Physical Activity - People walking or bicycling (%)
Physical Activity - People doing vigorous-intensity recreational activities (%)
Physical Activity - People doing moderate-intensity recreational activities (%)
Physical Activity - Average hours a day doing sedentary activities
Physical Activity - Average hours a day watching TV or videos
Physical Activity - Average hours a day using computer
Physical Functioning - People having limitations keeping them from working (%)
Physical Functioning - People limited in amount of work they can do (%)
Physical Functioning - People that need special equipment to walk (%)
Physical Functioning - People experiencing confusion/memory problems (%)
Physical Functioning - People requiring special healthcare equipment (%)
Prescription Medications - Average number of prescription medicines taking
Preventive Aspirin Use - Adults 40+ taking low-dose aspirin (%)
Reproductive Health - Vaginal deliveries (%)
Reproductive Health - Cesarean deliveries (%)
Reproductive Health - Deliveries resulted in a live birth (%)
Reproductive Health - Pregnancies resulted in a delivery (%)
Reproductive Health - Women breastfeeding newborns (%)
Reproductive Health - Women that had a hysterectomy (%)
Reproductive Health - Women that had both ovaries removed (%)
Reproductive Health - Women that have ever taken birth control pills (%)
Reproductive Health - Women taking birth control pills (%)
Reproductive Health - Women that have ever used Depo-Provera or injectables (%)
Reproductive Health - Women that have ever used female hormones (%)
Sexual Behavior - People 18+ that ever had sex (vaginal, anal, or oral) (%)
Sexual Behavior - Males 18+ that ever had vaginal sex with a woman (%)
Sexual Behavior - Males 18+ that ever performed oral sex on a woman (%)
Sexual Behavior - Males 18+ that ever had anal sex with a woman (%)
Sexual Behavior - Males 18+ that ever had any sex with a man (%)
Sexual Behavior - Females 18+ that ever had vaginal sex with a man (%)
Sexual Behavior - Females 18+ that ever performed oral sex on a man (%)
Sexual Behavior - Females 18+ that ever had anal sex with a man (%)
Sexual Behavior - Females 18+ that ever had any kind of sex with a woman (%)
Sexual Behavior - Average age people first had sex
Sexual Behavior - Average number of female sex partners in lifetime (males 18+)
Sexual Behavior - Average number of female vaginal sex partners in lifetime (males 18+)
Sexual Behavior - Average age people first performed oral sex on a woman (18+)
Sexual Behavior - Average number of woman performed oral sex on in lifetime (18+)
Sexual Behavior - Average number of male sex partners in lifetime (males 18+)
Sexual Behavior - Average number of male anal sex partners in lifetime (males 18+)
Sexual Behavior - Average age people first performed oral sex on a man (18+)
Sexual Behavior - Average number of male oral sex partners in lifetime (18+)
Sexual Behavior - People using protection when performing oral sex (%)
Sexual Behavior - Average number of times people have vaginal or anal sex a year
Sexual Behavior - People having sex without condom (%)
Sexual Behavior - Average number of male sex partners in lifetime (females 18+)
Sexual Behavior - Average number of male vaginal sex partners in lifetime (females 18+)
Sexual Behavior - Average number of female sex partners in lifetime (females 18+)
Sexual Behavior - Circumcised males 18+ (%)
Sleep Disorders - Average hours sleeping at night
Sleep Disorders - People that has trouble sleeping (%)
Smoking-Cigarette Use - People smoking cigarettes (%)
Taste & Smell - People 40+ having problems with smell (%)
Taste & Smell - People 40+ having problems with taste (%)
Taste & Smell - People 40+ that ever had wisdom teeth removed (%)
Taste & Smell - People 40+ that ever had tonsils teeth removed (%)
Taste & Smell - People 40+ that ever had a loss of consciousness because of a head injury (%)
Taste & Smell - People 40+ that ever had a broken nose or other serious injury to face or skull (%)
Taste & Smell - People 40+ that ever had two or more sinus infections (%)
Weight - Average height (inches)
Weight - Average weight (pounds)
Weight - Average BMI
Weight - People that are obese (%)
Weight - People that ever were obese (%)
Weight - People trying to lose weight (%)
According to our research of Indiana and other state lists, there were 7 registered sex offenders living in Jeffersonville, Indiana as of April 23, 2024 . The ratio of all residents to sex offenders in Jeffersonville is 6,674 to 1.The ratio of registered sex offenders to all residents in this city is much lower than the state average.
The City-Data.com crime index weighs serious crimes and violent crimes more heavily. Higher means more crime, U.S. average is 246.1. It adjusts for the number of visitors and daily workers commuting into cities.
- means the value is smaller than the state average.
- means the value is about the same as the state average.
- means the value is bigger than the state average.
- means the value is much bigger than the state average.
Crime rate in Jeffersonville detailed stats: murders, rapes, robberies, assaults, burglaries, thefts, arson Officers per 1,000 residents here:
1.76Indiana average:
2.18
Latest news from Jeffersonville, IN collected exclusively by city-data.com from local newspapers, TV, and radio stations
Jeffersonville, IN City Guides: Ancestries: German (13.3%), American (12.5%), English (11.6%), Irish (10.2%), Italian (2.1%), French (2.0%).
Current Local Time:
Land area: 13.6 square miles.
Population density: 3,757 people per square mile (average).
1,886 residents are foreign born (1.8% Latin America , 1.0% Asia ).
This city:
3.7%Indiana:
5.6%
Median real estate property taxes paid for housing units with mortgages in 2022: $1,627 (0.8%)Median real estate property taxes paid for housing units with no mortgage in 2022: $1,959 (1.0%)
Nearest city with pop. 50,000+: Louisville, KY
Nearest city with pop. 1,000,000+: Chicago, IL
Nearest cities:
Mockingbird Valley, KY (1.8 miles),
Latitude: 38.30 N, Longitude: 85.73 W
Daytime population change due to commuting: +6,417 (+12.6%)Workers who live and work in this city: 13,253 (50.1%)
Single-family new house construction building permits:
2022: 289 buildings , average cost: $287,6002021: 293 buildings , average cost: $202,2002020: 264 buildings , average cost: $170,3002019: 157 buildings , average cost: $171,1002018: 153 buildings , average cost: $175,8002017: 192 buildings , average cost: $158,0002016: 182 buildings , average cost: $158,1002015: 123 buildings , average cost: $152,2002014: 118 buildings , average cost: $155,1002013: 110 buildings , average cost: $149,9002012: 97 buildings , average cost: $132,3002011: 91 buildings , average cost: $115,0002010: 90 buildings , average cost: $127,7002009: 145 buildings , average cost: $115,6002008: 95 buildings , average cost: $144,4002007: 88 buildings , average cost: $145,6002006: 103 buildings , average cost: $123,4002005: 195 buildings , average cost: $124,9002004: 173 buildings , average cost: $113,9002003: 176 buildings , average cost: $119,4002002: 227 buildings , average cost: $112,6002001: 212 buildings , average cost: $111,7002000: 197 buildings , average cost: $110,2001999: 177 buildings , average cost: $110,2001998: 231 buildings , average cost: $101,0001997: 161 buildings , average cost: $117,300Unemployment in December 2023:
Population change in the 1990s: +2,632 (+10.6%).
Most common occupations in Jeffersonville, IN (%)
Both Males Females
Other office and administrative support workers, including supervisors (6.6%)
Other production occupations, including supervisors (4.8%)
Other sales and related occupations, including supervisors (4.4%)
Other management occupations, except farmers and farm managers (3.9%)
Laborers and material movers, hand (3.3%)
Building and grounds cleaning and maintenance occupations (3.3%)
Material recording, scheduling, dispatching, and distributing workers (3.2%)
Other production occupations, including supervisors (7.2%)
Driver/sales workers and truck drivers (5.3%)
Electrical equipment mechanics and other installation, maintenance, and repair workers, including supervisors (5.1%)
Metal workers and plastic workers (4.8%)
Laborers and material movers, hand (4.6%)
Other sales and related occupations, including supervisors (4.6%)
Other management occupations, except farmers and farm managers (4.4%)
Other office and administrative support workers, including supervisors (9.7%)
Secretaries and administrative assistants (4.9%)
Other sales and related occupations, including supervisors (4.1%)
Registered nurses (3.5%)
Other management occupations, except farmers and farm managers (3.4%)
Preschool, kindergarten, elementary, and middle school teachers (3.4%)
Information and record clerks, except customer service representatives (3.4%)
Tornado activity:
Jeffersonville-area historical tornado activity is slightly below Indiana state average. It is 68% greater than the overall U.S. average.
On 4/3/1974, a category F5 (max. wind speeds 261-318 mph) tornado 23.2 miles away from the Jeffersonville city center killed 6 people and injured 86 people and caused between $50,000,000 and $500,000,000 in damages.
On 4/3/1974, a category F5 tornado 26.3 miles away from the city center killed 31 people and injured 270 people and caused between $500,000 and $5,000,000 in damages.
Earthquake activity:
Jeffersonville-area historical earthquake activity is significantly above Indiana state average. It is 111% greater than the overall U.S. average. On 4/18/2008 at 09:36:59, a magnitude 5.4 (5.1 MB, 4.8 MS, 5.4 MW, 5.2 MW, Class: Moderate, Intensity: VI - VII) earthquake occurred 117.3 miles away from Jeffersonville center On 7/27/1980 at 18:52:21, a magnitude 5.2 (5.1 MB, 4.7 MS, 5.0 UK, 5.2 UK) earthquake occurred 97.3 miles away from Jeffersonville center On 4/18/2008 at 09:36:59, a magnitude 5.2 (5.2 MW, Depth: 8.9 mi) earthquake occurred 117.3 miles away from the city center On 6/10/1987 at 23:48:54, a magnitude 5.1 (4.9 MB, 4.4 MS, 4.6 MS, 5.1 LG) earthquake occurred 122.0 miles away from Jeffersonville center On 6/18/2002 at 17:37:15, a magnitude 5.0 (4.3 MB, 4.6 MW, 5.0 LG) earthquake occurred 113.5 miles away from the city center On 4/18/2008 at 15:14:16, a magnitude 4.8 (4.5 MB, 4.8 MW, 4.6 MW, Class: Light, Intensity: IV - V) earthquake occurred 115.4 miles away from Jeffersonville center Magnitude types: regional Lg-wave magnitude (LG), body-wave magnitude (MB), surface-wave magnitude (MS), moment magnitude (MW) Natural disasters: The number of natural disasters in Clark County (17) is near the US average (15).Major Disasters (Presidential) Declared: 13Emergencies Declared: 2Floods: 9, Storms: 9, Tornadoes: 6, Winds: 2, Winter Storms: 2, Blizzard: 1, Flash Flood: 1, Hurricane: 1, Snow: 1, Other: 1 (Note: some incidents may be assigned to more than one category). Hospitals in Jeffersonville: CHARTER BEHAVIORAL HLTH SYS JFFRSN INC (2700 RIVER CITY PARK ROAD) CLARK MEMORIAL HOSPITAL (Voluntary non-profit - Other, provides emergency services, 1220 MISSOURI AVE) LIFESPRING MENTAL HEALTH CENTER (207 W 13TH ST) QUALITY COMMUNITY SERVICES INC (4 SYLVAN LANE) VISTACARE (391 QUARTERMASTER COURT) VNA HOSPITAL OF SOUTHEASTERN INDIANA (1806 E 10TH ST) WELLSTONE REGIONAL HOSPITAL (2700 VISSING PARK RD) Nursing Homes in Jeffersonville: HILLCREST VILLAGE (203 SPARKS AVE) JEFFERSONVILLE NURSING HOME (1720 EAST 8TH STREET) Dialysis Facilities in Jeffersonville: DAVITA - JEFFERSONVILLE DIALYSIS (365 QUARTER MASTER COURT) FMC - SOUTHERN INDIANA (525 BROADWAY ST.) Home Health Centers in Jeffersonville: AMEDISYS HOME HEALTH OF JEFFERSONVILLE (303 QUARTERMASTER CT) MEDSHARES HOME CARE OF SOUTHERN IN INC (590 MISSOURI AVENUE SUITE 202) Airports located in Jeffersonville: Amtrak station: LOUISVILLE/JEFFERSONVILLE (500 WILLINGER LANE)
.
Services: enclosed waiting area, public payphones, snack bar, taxi stand, intercity bus service.
Colleges/Universities in Jeffersonville: Mid-America College of Funeral Service Full-time enrollment: 334; Location: 3111 Hamburg Pke; Private, not-for-profit; Website: www.mid-america.edu)
Ottawa University-Jeffersonville Full-time enrollment: 124; Location: 287 Quarter Master Court; Private, not-for-profit; Website: www.ottawa.edu; Offers Master's degree )
Ideal Beauty Academy Full-time enrollment: 44; Location: 1401 Youngstown Dr; Private, for-profit; Website: idealbeautyacademy.net)
Colleges/universities with over 2000 students nearest to Jeffersonville:
Jefferson Community and Technical College (about 4 miles; Louisville, KY ; Full-time enrollment: 7,950)
The Southern Baptist Theological Seminary (about 5 miles; Louisville, KY ; FT enrollment: 2,360)
Bellarmine University (about 6 miles; Louisville, KY ; FT enrollment: 3,180)
University of Louisville (about 6 miles; Louisville, KY ; FT enrollment: 16,640)
Indiana University-Southeast (about 6 miles; New Albany, IN ; FT enrollment: 5,050)
Sullivan University (about 7 miles; Louisville, KY ; FT enrollment: 5,129)
Elizabethtown Community and Technical College (about 42 miles; Elizabethtown, KY ; FT enrollment: 3,762)
Public high schools in Jeffersonville: JEFFERSONVILLE HIGH SCHOOL Students: 2,079, Location: 2315 ALLISON LN, Grades: 9-12)OLD CORDEN PORTER SCHOOL Location: 630 MEIGS AVE, Grades: 4-12)
CLARK COUNTY MIDDLE/HIGH SCHOOL Location: 2710 E 10TH ST, Grades: 7-12)
Biggest public elementary/middle schools in Jeffersonville: RIVER VALLEY MIDDLE SCHOOL Students: 921, Location: 2220 VETERANS PKY, Grades: 6-8)PARKVIEW MIDDLE SCHOOL Students: 809, Location: 1600 BRIGMAN AVE, Grades: 6-8)W E WILSON ELEMENTARY Students: 571, Location: 2915 CHARLESTOWN PK, Grades: PK-5)UTICA ELEMENTARY SCHOOL Students: 549, Location: 210 MAPLEHURST DR, Grades: KG-5)RIVERSIDE ELEMENTARY SCHOOL Students: 441, Location: 17 LAUREL DR, Grades: PK-5)NORTHAVEN ELEMENTARY SCHOOL Students: 429, Location: 1907 OAK RIDGE DR, Grades: KG-5)BRIDGEPOINT ELEMENTARY SCHOOL Students: 421, Location: 420 EWING LN, Grades: PK-5)THOMAS JEFFERSON ELEM SCH Students: 357, Location: 2710 HAMBURG PIKE, Grades: KG-5)MAPLE ELEMENTARY SCHOOL Students: 306, Location: 429 DIVISION ST, Grades: KG-5)SPRING HILL ELEMENTARY SCHOOL Students: 185, Location: 201 E 15TH ST, Grades: PK-5)Private elementary/middle school in Jeffersonville:
See full list of schools located in Jeffersonville Library in Jeffersonville: JEFFERSONVILLE TOWNSHIP PUBLIC LIBRARY Operating income: $1,941,782; Location: 211 EAST COURT AVENUE; 180,453 books ; 10,783 audio materials ; 11,456 video materials ; 2 local licensed databases ; 37 state licensed databases ; 317 print serial subscriptions )
User-submitted facts and corrections:
First Presbyterian Church is at 222 Walnut Street
Notable locations in Jeffersonville: (A) , Jeffersonville City Fire Department Station 2 Headquarters (B) , Jeffersonville City Fire Department (C) , Jeffersonville Fire Department (D) , Jeffersonville Fire Department Station 2 (E) , Wellstone Regional Hospital (F) , McCulloch Volunteer Fire Department (G) , Jeffersonville City Fire Department Station 3 (H) , Jeffersonville Fire Department Station 1 (I) . Display/hide their locations on the map
Shopping Centers: (1) , Trader Baker Mall (2) . Display/hide their locations on the map
Churches in Jeffersonville include: (A) , Northside Church (B) , Oak Park Church (C) , Park Place Church (D) , Rolling Fields Church (E) , Eastern Hights Chapel (F) , Faith Church (G) . Display/hide their locations on the map
Cemeteries: (1) , Walnut Ridge Cemetery (2) , Saint Anthonys Cemetery (3) . Display/hide their locations on the map
Lake: (A) . Display/hide its location on the map
Creek: (A) . Display/hide its location on the map
Parks in Jeffersonville include: (1) , Wathen Park (2) , Memorial Park (3) , River City Park (4) , Sylvan Park (5) . Display/hide their locations on the map
Tourist attractions:
Hotels:
Courts:
Birthplace of: Nick Dinsmore - Professional wrestler, Edmond H. Barmore - Football player, Jason Hilliard - 2005 NFL player (New York Giants, born : Jun 29, 1981), Jonas H. Ingram - Navy Medal of Honor recipient, Travis Meeks - Acoustic guitarist, Winfield Scott Stratton - Discovered the Independence Lode that began the Cripple Creek Gold Rush, John Schnatter - Entrepreneur, Terri Hollowell - Female singer, Charlie Wacker - Baseball player, Dirk Haire - Lawyer.
Clark County has a predicted average indoor radon screening level greater than 4 pCi/L (pico curies per liter) - Highest Potential Drinking water stations with addresses in Jeffersonville and their reported violations in the past:
CHARLESTOWN/RIVER RIDGE (Population served: 5,025, Groundwater):
Past monitoring violations:
Monitoring and Reporting (DBP) - Between JAN-2010 and DEC-2010, Contaminant: Total Haloacetic Acids (HAA5). Follow-up actions: St Public Notif requested (DEC-02-2010), St Violation/Reminder Notice (DEC-02-2010), St Compliance achieved (JAN-18-2011), St Public Notif received (JAN-18-2011)
Monitoring and Reporting (DBP) - Between JAN-2010 and DEC-2010, Contaminant: TTHM. Follow-up actions: St Public Notif requested (DEC-02-2010), St Violation/Reminder Notice (DEC-02-2010), St Compliance achieved (JAN-18-2011), St Public Notif received (JAN-18-2011)
One regular monitoring violation
Average household size: This city:
2.4 peopleIndiana:
2.5 people
Percentage of family households: This city:
63.0%Whole state:
66.9%
Percentage of households with unmarried partners: This city:
7.6%Whole state:
6.9%
Likely homosexual households (counted as self-reported same-sex unmarried-partner households)
Lesbian couples: 0.5% of all households Gay men: 0.4% of all households
People in group quarters in Jeffersonville in 2010:
381 people in local jails and other municipal confinement facilities
179 people in other noninstitutional facilities
109 people in nursing facilities/skilled-nursing facilities
65 people in emergency and transitional shelters (with sleeping facilities) for people experiencing homelessness
64 people in residential treatment centers for adults
35 people in group homes intended for adults
21 people in residential treatment centers for juveniles (non-correctional)
15 people in correctional facilities intended for juveniles
9 people in group homes for juveniles (non-correctional)
People in group quarters in Jeffersonville in 2000:
236 people in local jails and other confinement facilities (including police lockups)
198 people in nursing homes
83 people in other noninstitutional group quarters
60 people in other group homes
23 people in homes for the mentally retarded
16 people in hospitals or wards for drug/alcohol abuse
11 people in unknown juvenile institutions
Banks with most branches in Jeffersonville (2011 data):
JPMorgan Chase Bank, National Association: Jeffersonville Branch, Jeffersonville Main Branch, Allison Lane Branch, Springdale Branch, Court Wall Drive-Up Branch. Info updated 2011/11/10: Bank assets: $1,811,678.0 mil, Deposits: $1,190,738.0 mil, headquarters in Columbus, OH, positive income , International Specialization, 5577 total offices , Holding Company: Jpmorgan Chase & Co.
Your Community Bank: 5112 Highway 62 Branch, Jeffersonville Branch, Jeffersonville East Branch. Info updated 2006/11/03: Bank assets: $661.1 mil, Deposits: $475.7 mil, headquarters in New Albany, IN, positive income , Commercial Lending Specialization, 17 total offices , Holding Company: Community Bank Shares Of Indiana, Inc.
PNC Bank, National Association: 10th Street Branch, Williamsburg Station Branch, East Court Branch. Info updated 2012/03/20: Bank assets: $263,309.6 mil, Deposits: $197,343.0 mil, headquarters in Wilmington, DE, positive income , Commercial Lending Specialization, 3085 total offices , Holding Company: Pnc Financial Services Group, Inc., The
First Savings Bank, F.S.B.: 2213 Allison Lane Branch at 2213 Allison Lane, branch established on 1938/01/07; 202 Court Avenue Branch at 202 E Court Ave, branch established on 1938/01/07. Info updated 2011/07/21: Bank assets: $539.9 mil, Deposits: $372.8 mil, headquarters in Clarksville, IN, positive income , Commercial Lending Specialization, 12 total offices
MainSource Bank: Allison Lane Branch at 1802 Allison Lane, branch established on 1996/06/30; Jeffersonville Branch at 1711 East Tenth Street, branch established on 2002/01/02. Info updated 2009/12/09: Bank assets: $2,729.1 mil, Deposits: $2,167.0 mil, headquarters in Greensburg, IN, positive income , 86 total offices , Holding Company: Mainsource Financial Group, Inc.
First Harrison Bank: Jeffersonville Branch at 2754 Allison Lane, branch established on 2003/05/08. Info updated 2011/07/21: Bank assets: $439.6 mil, Deposits: $364.8 mil, headquarters in Corydon, IN, positive income , 13 total offices
Stock Yards Bank & Trust Company: Jeffersonville Branch at 3230 East Highway 62, branch established on 2001/11/06. Info updated 2011/11/29: Bank assets: $2,045.7 mil, Deposits: $1,643.0 mil, headquarters in Louisville, KY, positive income , Commercial Lending Specialization, 31 total offices , Holding Company: S. Y. Bancorp, Inc.
Regions Bank: Spring Street Branch at 1401 Spring Street, branch established on 2005/04/11. Info updated 2011/02/24: Bank assets: $123,368.2 mil, Deposits: $98,301.3 mil, headquarters in Birmingham, AL, positive income , Commercial Lending Specialization, 1778 total offices , Holding Company: Regions Financial Corporation
Fifth Third Bank: Jeffersonville Branch at 2932 E. 10th Street, branch established on 2000/01/24. Info updated 2009/10/05: Bank assets: $114,540.4 mil, Deposits: $89,689.1 mil, headquarters in Cincinnati, OH, positive income , Commercial Lending Specialization, 1378 total offices , Holding Company: Fifth Third Bancorp
4 other banks with 4 local branches
For population 15 years and over in Jeffersonville:
Never married: 30.4%Now married: 47.9%Separated: 1.0%Widowed: 7.5%Divorced: 13.2% For population 25 years and over in Jeffersonville:
High school or higher: 92.3%Bachelor's degree or higher: 24.6%Graduate or professional degree: 8.6%Unemployed: 5.9%Mean travel time to work (commute): 16.7 minutes
Education Gini index (Inequality in education) Here:
10.5Indiana average:
11.3
Religion statistics for Jeffersonville, IN (based on Clark County data)
Religion Adherents Congregations Evangelical Protestant 18,804 76 Catholic 10,150 8 Mainline Protestant 7,663 46 Black Protestant 661 4 Other 340 2 None 72,614 -
Source: Clifford Grammich, Kirk Hadaway, Richard Houseal, Dale E.Jones, Alexei Krindatch, Richie Stanley and Richard H.Taylor. 2012. 2010 U.S.Religion Census: Religious Congregations & Membership Study. Association of Statisticians of American Religious Bodies. Jones, Dale E., et al. 2002. Congregations and Membership in the United States 2000. Nashville, TN: Glenmary Research Center. Graphs represent county-level data
Food Environment Statistics: Number of grocery stores : 20Here :
1.90 / 10,000 pop.Indiana :
1.73 / 10,000 pop.
Number of supercenters and club stores : 2This county :
0.19 / 10,000 pop.State :
0.21 / 10,000 pop.
Number of convenience stores (no gas) : 6Here :
0.57 / 10,000 pop.State :
0.50 / 10,000 pop.
Number of convenience stores (with gas) : 36Here :
3.43 / 10,000 pop.Indiana :
3.57 / 10,000 pop.
Number of full-service restaurants : 65Clark County :
6.19 / 10,000 pop.Indiana :
6.78 / 10,000 pop.
Adult diabetes rate : Clark County :
9.8%Indiana :
9.2%
Adult obesity rate : This county :
29.8%Indiana :
29.0%
Low-income preschool obesity rate : Clark County :
17.4%State :
14.3%
Health and Nutrition: Healthy diet rate : Jeffersonville:
49.8%Indiana:
49.3%
Average overall health of teeth and gums : People feeling badly about themselves : Jeffersonville:
20.7%Indiana:
21.3%
People not drinking alcohol at all : Jeffersonville:
10.3%Indiana:
10.6%
Average hours sleeping at night : Jeffersonville:
6.8Indiana:
6.8
Overweight people : This city:
34.3%State:
33.9%
General health condition : Jeffersonville:
56.6%Indiana:
56.1%
Average condition of hearing : Jeffersonville:
79.3%Indiana:
78.7%
More about Health and Nutrition of Jeffersonville, IN Residents
Local government employment and payroll (March 2022)
Function
Full-time employees
Monthly full-time payroll
Average yearly full-time wage
Part-time employees
Monthly part-time payroll
Firefighters
91 $537,284 $70,851 0 $0 Police Protection - Officers
91 $602,207 $79,412 0 $0 Water Supply
50 $208,820 $50,117 0 $0 Parks and Recreation
36 $112,140 $37,380 0 $0 Solid Waste Management
25 $91,611 $43,973 0 $0 Other and Unallocable
22 $92,442 $50,423 0 $0 Streets and Highways
19 $93,415 $58,999 0 $0 Other Government Administration
14 $71,475 $61,264 1 $233 Sewerage
11 $63,484 $69,255 0 $0 Financial Administration
10 $47,677 $57,212 0 $0 Health
7 $26,846 $46,022 4 $4,422 Police - Other
5 $19,845 $47,628 0 $0 Judicial and Legal
2 $13,028 $78,168 0 $0 Fire - Other
1 $4,916 $58,992 0 $0
Totals for Government
384 $1,985,190 $62,037 5 $4,655
Jeffersonville government finances - Expenditure in 2021 (per resident):
Construction - General - Other: $7,241,000 ($141.90)
Sewerage: $2,081,000 ($40.78)Regular Highways: $845,000 ($16.56)Parks and Recreation: $339,000 ($6.64)General Public Buildings: $65,000 ($1.27)Health - Other: $42,000 ($0.82)Current Operations - Sewerage: $16,016,000 ($313.85)
Central Staff Services: $11,711,000 ($229.49)Local Fire Protection: $10,701,000 ($209.70)Police Protection: $8,168,000 ($160.06)General - Other: $4,752,000 ($93.12)Parks and Recreation: $3,253,000 ($63.75)Solid Waste Management: $2,489,000 ($48.78)Regular Highways: $1,172,000 ($22.97)General Public Buildings: $806,000 ($15.79)Health - Other: $690,000 ($13.52)Financial Administration: $536,000 ($10.50)General - Interest on Debt: $3,432,000 ($67.25)
Other Capital Outlay - Solid Waste Management: $1,197,000 ($23.46)
Police Protection: $1,143,000 ($22.40)Sewerage: $833,000 ($16.32)Local Fire Protection: $688,000 ($13.48)Central Staff Services: $394,000 ($7.72)Regular Highways: $331,000 ($6.49)General - Other: $219,000 ($4.29)Parks and Recreation: $203,000 ($3.98)Financial Administration: $6,000 ($0.12)General Public Building: $1,000 ($0.02)Total Salaries and Wages: $21,226,000 ($415.95)
Jeffersonville government finances - Revenue in 2021 (per resident):
Charges - Sewerage: $15,630,000 ($306.29)
Other: $2,269,000 ($44.46)Miscellaneous - General Revenue - Other: $20,139,000 ($394.65)
Interest Earnings: $881,000 ($17.26)Rents: $514,000 ($10.07)Fines and Forfeits: $379,000 ($7.43)Donations From Private Sources: $105,000 ($2.06)Sale of Property: $6,000 ($0.12)State Intergovernmental - Highways: $2,544,000 ($49.85)
Other: $8,000 ($0.16)General Local Government Support: $4,000 ($0.08)Tax - Property: $40,903,000 ($801.55)
Individual Income: $18,208,000 ($356.81)General Sales and Gross Receipts: $13,000 ($0.25)
Jeffersonville government finances - Debt in 2021 (per resident):
Long Term Debt - Outstanding Unspecified Public Purpose: $122,128,000 ($2393.26)
Beginning Outstanding - Unspecified Public Purpose: $92,430,000 ($1811.29)Issue, Unspecified Public Purpose: $44,324,000 ($868.59)Retired Unspecified Public Purpose: $14,626,000 ($286.62)Retired Nonguaranteed - Public Debt for Private Purpose: $25,000 ($0.49)Beginning Outstanding - Public Debt for Private Purpose: $25,000 ($0.49)
Jeffersonville government finances - Cash and Securities in 2021 (per resident):
Bond Funds - Cash and Securities: $36,744,000 ($720.05)
Other Funds - Cash and Securities: $90,152,000 ($1766.65)
Sinking Funds - Cash and Securities: $15,007,000 ($294.08)
Businesses in Jeffersonville, IN
Name Count Name Count
AT&T 1 Marriott 2 Advance Auto Parts 1 McDonald's 2 Arby's 1 Meijer 1 AutoZone 1 Motel 6 1 Big O Tires 1 Nike 1 Burger King 1 Papa John's Pizza 1 Circle K 3 Penske 1 Comfort Suites 1 Pizza Hut 1 Cricket Wireless 1 Popeyes 1 DHL 1 Quiznos 1 Dairy Queen 2 Rite Aid 2 Domino's Pizza 1 Ryder Rental & Truck Leasing 1 Dunkin Donuts 3 SONIC Drive-In 1 FedEx 9 Sheraton 1 GNC 1 Subway 3 Goodwill 1 Super 8 1 H&R Block 3 Taco Bell 1 Hardee's 1 U-Haul 2 Hyundai 1 UPS 9 KFC 1 Vans 2 Knights Inn 1 Waffle House 1 Kohl's 1 Walgreens 2 Kroger 1 Wendy's 1 La-Z-Boy 1 White Castle 1 Lane Furniture 1 YMCA 1 Little Caesars Pizza 1
Strongest AM radio stations in Jeffersonville:
WGTK (970 AM; 5 kW; LOUISVILLE, KY; Owner: SALEM MEDIA OF KENTUCKY, INC.)
WAVG (1450 AM; 1 kW; JEFFERSONVILLE, IN; Owner: SUNNYSIDE COMMUNICATIONS, INC)
WKJK (1080 AM; 10 kW; LOUISVILLE, KY; Owner: CLEAR CHANNEL BROADCASTING LICENSES, INC.)
WFIA (900 AM; 1 kW; LOUISVILLE, KY; Owner: SCA LICENSE CORPORATION)
WHAS (840 AM; 50 kW; LOUISVILLE, KY; Owner: CLEAR CHANNEL BROADCASTING LICENSES, INC.)
WTMT (620 AM; 0 kW; LOUISVILLE, KY; Owner: JEFFERSON B/CASTING CMPANY, INC.)
WXLN (1570 AM; 2 kW; NEW ALBANY, IN; Owner: MORTENSON BROADCASTING COMPANY)
WLLV (1240 AM; 1 kW; LOUISVILLE, KY; Owner: MORTENSON BROADCASTING COMPANY)
WLOU (1350 AM; 2 kW; LOUISVILLE, KY; Owner: MORTENSON BROADCASTING CO., INC.)
WXXA (790 AM; 5 kW; LOUISVILLE, KY)
WDRD (680 AM; 1 kW; NEWBURG, KY; Owner: ABC, INC.)
WLW (700 AM; 50 kW; CINCINNATI, OH; Owner: JACOR BROADCASTING CORPORATION)
WSAI (1530 AM; 50 kW; CINCINNATI, OH; Owner: JACOR BROADCASTING CORPORATION)
Strongest FM radio stations in Jeffersonville:
WFPL (89.3 FM; LOUISVILLE, KY; Owner: KENTUCKY PUBLIC RADIO, INC.)
WPTI (103.9 FM; LOUISVILLE, KY; Owner: CXR HOLDINGS, INC.)
WRKA (103.1 FM; ST. MATTHEWS, KY; Owner: CXR HOLDINGS, INC.)
WFPK (91.9 FM; LOUISVILLE, KY; Owner: KENTUCKY PUBLIC RADIO, INC.)
WUOL-FM (90.5 FM; LOUISVILLE, KY; Owner: KENTUCKY PUBLIC RADIO, INC.)
WDJX (99.7 FM; LOUISVILLE, KY; Owner: BLUE CHIP BROADCASTING LICENSES II, LTD.)
WVEZ (106.9 FM; LOUISVILLE, KY; Owner: CXR HOLDINGS, INC.)
WXMA (102.3 FM; LOUISVILLE, KY; Owner: BLUE CHIP BROADCASTING LICENSES II, LTD.)
WMJM (101.3 FM; JEFFERSONTOWN, KY; Owner: BLUE CHIP BROADCASTING LICENSES II, LTD.)
WRVI (105.9 FM; VALLEY STATION, KY; Owner: SALEM MEDIA OF KENTUCKY, INC.)
WFIA-FM (94.7 FM; NEW ALBANY, IN; Owner: SALEM MEDIA OF KENTUCKY, INC.)
W284AD (104.7 FM; NEW ALBANY, IN; Owner: LIFETALK RADIO, INC.)
WTFX-FM (100.5 FM; LOUISVILLE, KY; Owner: CLEAR CHANNEL BROADCASTING LICENSES, INC.)
WJZL (93.1 FM; CLARKSVILLE, IN; Owner: CLEAR CHANNEL BROADCASTING LICENSES, INC.)
WSFR (107.7 FM; CORYDON, IN; Owner: CXR HOLDINGS, INC.)
WAMZ (97.5 FM; LOUISVILLE, KY; Owner: CLEAR CHANNEL BROADCASTING LICENSES, INC.)
WQMF (95.7 FM; JEFFERSONVILLE, IN; Owner: CLEAR CHANNEL BROADCASTING LICENSES, INC.)
WJIE-FM (88.5 FM; OKOLONA, KY; Owner: EVANGEL SCHOOLS, INC.)
WZKF (98.9 FM; SALEM, IN; Owner: CLEAR CHANNEL BROADCASTING LICENSES, INC.)
WLRS (105.1 FM; SHEPHERDSVILLE, KY; Owner: BLUE CHIP BROADCASTING LICENSES II, LTD.)
TV broadcast stations around Jeffersonville:
W24BW (Channel 24; LOUISVILLE, KY; Owner: GREATER LOUISVILLE COMMUNICATIONS)
WVHF-LP (Channel 5; JEFFERSONVILLE, ETC., IN; Owner: JOHN W. SMITH, JR.)
WBXV-CA (Channel 13; LOUISVILLE, KY; Owner: THE BOX WORLDWIDE LLC)
WHAS-TV (Channel 11; LOUISVILLE, KY; Owner: BELO KENTUCKY, INC.)
WDRB (Channel 41; LOUISVILLE, KY; Owner: INDEPENDENCE TELEVISION COMPANY)
WFTE (Channel 58; SALEM, IN; Owner: INDEPENDENCE TELEVISION COMPANY)
WLKY-TV (Channel 32; LOUISVILLE, KY; Owner: WLKY HEARST-ARGYLE TELEVISION, INC.)
WJYL-CA (Channel 45; CLARKSVILLE, IN; Owner: JOHN W. SMITH, JR.)
WAVE (Channel 3; LOUISVILLE, KY; Owner: LIBCO, INC.)
WKPC-TV (Channel 15; LOUISVILLE, KY; Owner: KENTUCKY AUTHORITY FOR EDUC'L. TV)
WKMJ-TV (Channel 68; LOUISVILLE, KY; Owner: KENTUCKY AUTHORITY FOR EDUCATIONAL TV)
WBNA (Channel 21; LOUISVILLE, KY; Owner: WORD BROADCASTING NETWORK, INC.)
W50CI (Channel 50; LOUISVILLE, KY; Owner: SOUTH CENTRAL COMMUNICATIONS CORP.)
WBKI-CA (Channel 28; LOUISVILLE, KY; Owner: LOUISVILLE COMMUNICATIONS, LLC)
WHAN-LP (Channel 17; SALEM, IN; Owner: REBECCA L. WHITE)
Medal of Honor Recipients
Medal of Honor Recipient born in Jeffersonville: Jonas Howard Ingram.
National Bridge Inventory (NBI) Statistics 100 Number of bridges1,864ft / 568m Total length $1,179,000 Total costs1,741,219 Total average daily traffic244,676 Total average daily truck traffic
New bridges - historical statistics
6 1920-1929 1 1950-1959 4 1960-1969 7 1970-1979 2 1980-1989 12 1990-1999 13 2000-2009 54 2010-2019 1 2020-2022
See full National Bridge Inventory statistics for Jeffersonville, IN
Home Mortgage Disclosure Act Aggregated Statistics For Year 2009(Based on 6 full and 5 partial tracts) A) FHA, FSA/RHS & VA B) Conventional C) Refinancings D) Home Improvement Loans E) Loans on Dwellings For 5+ Families F) Non-occupant Loans on G) Loans On Manufactured Number Average Value Number Average Value Number Average Value Number Average Value Number Average Value Number Average Value Number Average Value
LOANS ORIGINATED 205 $109,969 131 $103,541 648 $112,268 31 $43,837 1 $2,384,110 69 $88,084 2 $70,450 APPLICATIONS APPROVED, NOT ACCEPTED 13 $107,600 9 $91,890 70 $109,210 2 $25,825 0 $0 2 $42,490 1 $59,100 APPLICATIONS DENIED 43 $104,978 31 $101,472 285 $113,280 32 $29,098 0 $0 15 $82,129 4 $22,272 APPLICATIONS WITHDRAWN 20 $111,768 14 $121,817 169 $109,347 3 $38,600 0 $0 7 $78,740 0 $0 FILES CLOSED FOR INCOMPLETENESS 5 $91,908 5 $89,682 38 $117,253 0 $0 0 $0 0 $0 1 $46,590
Aggregated Statistics For Year 2008(Based on 6 full and 5 partial tracts) A) FHA, FSA/RHS & VA B) Conventional C) Refinancings D) Home Improvement Loans E) Loans on Dwellings For 5+ Families F) Non-occupant Loans on G) Loans On Manufactured Number Average Value Number Average Value Number Average Value Number Average Value Number Average Value Number Average Value Number Average Value
LOANS ORIGINATED 163 $110,447 188 $104,669 483 $102,606 51 $28,619 4 $470,392 130 $79,998 6 $31,010 APPLICATIONS APPROVED, NOT ACCEPTED 10 $103,805 25 $88,746 58 $106,821 10 $25,131 1 $1,459,090 2 $75,240 10 $26,544 APPLICATIONS DENIED 46 $107,516 48 $108,956 338 $111,509 68 $38,317 0 $0 14 $70,625 5 $51,096 APPLICATIONS WITHDRAWN 20 $119,038 23 $124,613 142 $118,311 11 $63,384 0 $0 6 $96,982 1 $102,000 FILES CLOSED FOR INCOMPLETENESS 4 $127,310 10 $102,752 32 $109,179 1 $91,000 0 $0 3 $87,163 0 $0
Aggregated Statistics For Year 2007(Based on 6 full and 5 partial tracts) A) FHA, FSA/RHS & VA B) Conventional C) Refinancings D) Home Improvement Loans E) Loans on Dwellings For 5+ Families F) Non-occupant Loans on G) Loans On Manufactured Number Average Value Number Average Value Number Average Value Number Average Value Number Average Value Number Average Value Number Average Value
LOANS ORIGINATED 98 $113,017 478 $99,259 518 $89,011 77 $35,824 5 $2,086,440 129 $77,481 10 $31,138 APPLICATIONS APPROVED, NOT ACCEPTED 6 $90,012 61 $94,131 114 $94,192 19 $47,217 0 $0 10 $75,809 9 $29,156 APPLICATIONS DENIED 21 $108,582 90 $89,755 471 $103,177 125 $44,410 0 $0 28 $67,696 13 $45,768 APPLICATIONS WITHDRAWN 17 $124,243 35 $104,935 152 $112,833 18 $71,581 0 $0 28 $89,260 1 $118,530 FILES CLOSED FOR INCOMPLETENESS 2 $138,280 20 $108,174 66 $111,880 5 $45,612 1 $677,470 5 $88,438 0 $0
Aggregated Statistics For Year 2006(Based on 6 full and 5 partial tracts) A) FHA, FSA/RHS & VA B) Conventional C) Refinancings D) Home Improvement Loans E) Loans on Dwellings For 5+ Families F) Non-occupant Loans on G) Loans On Manufactured Number Average Value Number Average Value Number Average Value Number Average Value Number Average Value Number Average Value Number Average Value
LOANS ORIGINATED 136 $109,417 599 $90,392 602 $87,229 108 $27,773 3 $849,353 144 $77,556 6 $41,627 APPLICATIONS APPROVED, NOT ACCEPTED 8 $115,165 84 $77,544 130 $89,191 22 $30,870 1 $924,750 23 $66,508 9 $18,736 APPLICATIONS DENIED 23 $103,714 161 $81,380 499 $98,933 101 $33,516 0 $0 33 $92,580 12 $36,965 APPLICATIONS WITHDRAWN 16 $102,888 82 $88,607 251 $101,310 13 $42,727 1 $624,630 15 $78,855 1 $77,000 FILES CLOSED FOR INCOMPLETENESS 2 $106,425 27 $100,512 88 $97,492 3 $65,963 0 $0 5 $79,590 0 $0
Aggregated Statistics For Year 2005(Based on 6 full and 5 partial tracts) A) FHA, FSA/RHS & VA B) Conventional C) Refinancings D) Home Improvement Loans E) Loans on Dwellings For 5+ Families F) Non-occupant Loans on G) Loans On Manufactured Number Average Value Number Average Value Number Average Value Number Average Value Number Average Value Number Average Value Number Average Value
LOANS ORIGINATED 115 $108,203 612 $86,912 752 $84,329 109 $43,343 1 $174,700 137 $74,716 11 $47,833 APPLICATIONS APPROVED, NOT ACCEPTED 8 $122,869 95 $69,788 157 $87,089 24 $29,277 0 $0 13 $64,991 9 $26,488 APPLICATIONS DENIED 15 $121,338 167 $82,247 563 $93,110 110 $33,660 0 $0 28 $70,592 21 $48,918 APPLICATIONS WITHDRAWN 12 $83,396 78 $93,314 284 $103,081 27 $175,002 0 $0 22 $82,674 1 $30,910 FILES CLOSED FOR INCOMPLETENESS 4 $94,928 28 $86,902 107 $99,794 2 $57,405 0 $0 3 $98,343 0 $0
Aggregated Statistics For Year 2004(Based on 6 full and 5 partial tracts) A) FHA, FSA/RHS & VA B) Conventional C) Refinancings D) Home Improvement Loans E) Loans on Dwellings For 5+ Families F) Non-occupant Loans on G) Loans On Manufactured Number Average Value Number Average Value Number Average Value Number Average Value Number Average Value Number Average Value Number Average Value
LOANS ORIGINATED 132 $101,310 551 $96,411 841 $105,831 79 $25,457 3 $717,363 167 $159,098 14 $48,697 APPLICATIONS APPROVED, NOT ACCEPTED 7 $93,616 76 $87,970 149 $88,241 15 $32,045 0 $0 11 $72,072 9 $50,030 APPLICATIONS DENIED 11 $98,303 128 $74,662 522 $90,450 94 $25,243 0 $0 33 $60,211 23 $38,691 APPLICATIONS WITHDRAWN 16 $91,037 81 $104,498 270 $99,317 18 $66,561 0 $0 10 $106,592 2 $46,500 FILES CLOSED FOR INCOMPLETENESS 1 $90,640 28 $92,848 81 $105,238 4 $48,728 0 $0 2 $67,655 3 $25,227
Aggregated Statistics For Year 2003(Based on 6 full and 5 partial tracts) A) FHA, FSA/RHS & VA B) Conventional C) Refinancings D) Home Improvement Loans E) Loans on Dwellings For 5+ Families F) Non-occupant Loans on Number Average Value Number Average Value Number Average Value Number Average Value Number Average Value Number Average Value
LOANS ORIGINATED 158 $101,143 527 $96,613 1,711 $88,529 65 $25,750 5 $1,205,512 175 $82,379 APPLICATIONS APPROVED, NOT ACCEPTED 13 $97,328 53 $78,706 265 $84,080 15 $39,107 0 $0 22 $59,961 APPLICATIONS DENIED 25 $103,864 108 $78,774 614 $84,199 70 $21,653 0 $0 25 $59,962 APPLICATIONS WITHDRAWN 12 $94,018 71 $106,530 309 $90,931 8 $33,169 1 $2,235,650 20 $62,372 FILES CLOSED FOR INCOMPLETENESS 6 $117,270 24 $86,343 87 $96,352 5 $25,482 0 $0 3 $68,047
Aggregated Statistics For Year 2002(Based on 6 full and 5 partial tracts) A) FHA, FSA/RHS & VA B) Conventional C) Refinancings D) Home Improvement Loans E) Loans on Dwellings For 5+ Families F) Non-occupant Loans on Number Average Value Number Average Value Number Average Value Number Average Value Number Average Value Number Average Value
LOANS ORIGINATED 168 $98,685 499 $88,548 1,366 $85,439 90 $28,385 3 $2,511,087 177 $83,507 APPLICATIONS APPROVED, NOT ACCEPTED 11 $80,330 57 $78,122 247 $72,721 29 $43,386 0 $0 8 $67,669 APPLICATIONS DENIED 22 $89,255 111 $77,375 413 $73,591 66 $19,475 0 $0 22 $47,652 APPLICATIONS WITHDRAWN 14 $95,124 52 $91,458 226 $83,850 13 $13,510 0 $0 14 $66,388 FILES CLOSED FOR INCOMPLETENESS 6 $87,042 24 $97,033 70 $88,112 1 $26,140 0 $0 1 $50,130
Aggregated Statistics For Year 2001(Based on 6 full and 5 partial tracts) A) FHA, FSA/RHS & VA B) Conventional C) Refinancings D) Home Improvement Loans E) Loans on Dwellings For 5+ Families F) Non-occupant Loans on Number Average Value Number Average Value Number Average Value Number Average Value Number Average Value Number Average Value
LOANS ORIGINATED 193 $94,432 485 $82,838 1,205 $75,845 107 $19,224 2 $735,925 205 $74,434 APPLICATIONS APPROVED, NOT ACCEPTED 17 $88,328 46 $71,903 202 $64,447 36 $20,271 0 $0 11 $53,331 APPLICATIONS DENIED 9 $82,021 127 $54,678 423 $64,093 92 $14,293 0 $0 23 $63,594 APPLICATIONS WITHDRAWN 12 $94,871 47 $93,114 213 $74,052 8 $20,049 0 $0 12 $73,602 FILES CLOSED FOR INCOMPLETENESS 6 $75,252 3 $79,393 58 $79,167 1 $11,740 0 $0 3 $53,593
Aggregated Statistics For Year 2000(Based on 6 full and 5 partial tracts) A) FHA, FSA/RHS & VA B) Conventional C) Refinancings D) Home Improvement Loans E) Loans on Dwellings For 5+ Families F) Non-occupant Loans on Number Average Value Number Average Value Number Average Value Number Average Value Number Average Value Number Average Value
LOANS ORIGINATED 201 $90,432 416 $78,341 458 $57,655 142 $14,662 1 $2,096,400 84 $67,734 APPLICATIONS APPROVED, NOT ACCEPTED 9 $79,553 55 $65,578 171 $54,265 47 $18,320 0 $0 7 $39,324 APPLICATIONS DENIED 16 $85,242 221 $44,872 359 $53,873 108 $20,591 0 $0 18 $45,999 APPLICATIONS WITHDRAWN 17 $86,271 53 $77,209 167 $55,428 17 $21,131 0 $0 6 $69,217 FILES CLOSED FOR INCOMPLETENESS 5 $101,018 5 $81,816 28 $67,329 1 $4,800 0 $0 0 $0
Aggregated Statistics For Year 1999(Based on 6 full and 5 partial tracts) A) FHA, FSA/RHS & VA B) Conventional C) Refinancings D) Home Improvement Loans E) Loans on Dwellings For 5+ Families F) Non-occupant Loans on Number Average Value Number Average Value Number Average Value Number Average Value Number Average Value Number Average Value
LOANS ORIGINATED 195 $84,720 419 $74,541 649 $60,381 150 $14,819 2 $236,275 143 $58,821 APPLICATIONS APPROVED, NOT ACCEPTED 1 $32,440 41 $62,212 178 $51,670 43 $21,310 0 $0 5 $45,154 APPLICATIONS DENIED 15 $72,617 142 $47,631 359 $53,592 91 $11,115 1 $85,170 19 $35,822 APPLICATIONS WITHDRAWN 15 $78,778 67 $62,930 243 $60,968 12 $31,578 0 $0 12 $53,702 FILES CLOSED FOR INCOMPLETENESS 2 $66,950 11 $74,352 42 $72,152 3 $22,977 0 $0 0 $0
Detailed mortgage data for all 11 tracts in Jeffersonville, IN
Private Mortgage Insurance Companies Aggregated Statistics For Year 2009(Based on 6 full and 4 partial tracts) A) Conventional B) Refinancings C) Non-occupant Loans on Number Average Value Number Average Value Number Average Value
LOANS ORIGINATED 25 $113,661 29 $127,937 1 $54,420 APPLICATIONS APPROVED, NOT ACCEPTED 8 $100,002 8 $126,840 0 $0 APPLICATIONS DENIED 3 $90,143 3 $187,043 0 $0 APPLICATIONS WITHDRAWN 3 $110,687 6 $100,895 0 $0 FILES CLOSED FOR INCOMPLETENESS 1 $57,000 0 $0 0 $0
Aggregated Statistics For Year 2008(Based on 6 full and 5 partial tracts) A) Conventional B) Refinancings C) Non-occupant Loans on Number Average Value Number Average Value Number Average Value
LOANS ORIGINATED 75 $111,917 46 $121,514 15 $74,561 APPLICATIONS APPROVED, NOT ACCEPTED 19 $126,214 23 $142,294 2 $101,795 APPLICATIONS DENIED 7 $117,777 10 $126,279 5 $131,842 APPLICATIONS WITHDRAWN 5 $65,672 1 $130,420 0 $0 FILES CLOSED FOR INCOMPLETENESS 5 $87,798 2 $127,000 2 $76,810
Aggregated Statistics For Year 2007(Based on 6 full and 5 partial tracts) A) Conventional B) Refinancings C) Non-occupant Loans on Number Average Value Number Average Value Number Average Value
LOANS ORIGINATED 209 $107,790 73 $109,874 23 $70,214 APPLICATIONS APPROVED, NOT ACCEPTED 24 $108,408 19 $119,361 3 $74,197 APPLICATIONS DENIED 1 $94,960 4 $124,235 0 $0 APPLICATIONS WITHDRAWN 8 $111,039 5 $113,954 0 $0 FILES CLOSED FOR INCOMPLETENESS 0 $0 1 $84,000 0 $0
Aggregated Statistics For Year 2006(Based on 6 full and 5 partial tracts) A) Conventional B) Refinancings C) Non-occupant Loans on D) Loans On Manufactured Number Average Value Number Average Value Number Average Value Number Average Value
LOANS ORIGINATED 142 $101,936 46 $105,626 8 $67,349 1 $43,750 APPLICATIONS APPROVED, NOT ACCEPTED 17 $108,106 22 $109,183 2 $73,490 0 $0 APPLICATIONS DENIED 4 $89,590 1 $86,000 0 $0 0 $0 APPLICATIONS WITHDRAWN 9 $92,951 4 $118,385 1 $52,410 0 $0 FILES CLOSED FOR INCOMPLETENESS 1 $68,290 1 $180,000 0 $0 0 $0
Aggregated Statistics For Year 2005(Based on 6 full and 5 partial tracts) A) Conventional B) Refinancings C) Non-occupant Loans on Number Average Value Number Average Value Number Average Value
LOANS ORIGINATED 105 $110,443 87 $104,064 11 $86,440 APPLICATIONS APPROVED, NOT ACCEPTED 13 $119,888 20 $102,196 1 $110,960 APPLICATIONS DENIED 1 $39,370 2 $143,745 1 $39,370 APPLICATIONS WITHDRAWN 6 $144,075 5 $103,230 0 $0 FILES CLOSED FOR INCOMPLETENESS 0 $0 2 $79,750 0 $0
Aggregated Statistics For Year 2004(Based on 6 full and 5 partial tracts) A) Conventional B) Refinancings C) Non-occupant Loans on D) Loans On Manufactured Number Average Value Number Average Value Number Average Value Number Average Value
LOANS ORIGINATED 105 $102,218 76 $100,741 5 $90,094 1 $42,680 APPLICATIONS APPROVED, NOT ACCEPTED 28 $107,329 30 $97,563 2 $78,180 0 $0 APPLICATIONS DENIED 3 $79,487 0 $0 1 $56,760 0 $0 APPLICATIONS WITHDRAWN 5 $109,738 5 $121,468 1 $50,310 0 $0 FILES CLOSED FOR INCOMPLETENESS 0 $0 0 $0 0 $0 0 $0
Aggregated Statistics For Year 2003(Based on 6 full and 5 partial tracts) A) Conventional B) Refinancings C) Non-occupant Loans on Number Average Value Number Average Value Number Average Value
LOANS ORIGINATED 106 $101,828 200 $101,249 10 $70,559 APPLICATIONS APPROVED, NOT ACCEPTED 23 $92,820 42 $95,479 3 $71,667 APPLICATIONS DENIED 2 $138,000 2 $86,000 1 $88,000 APPLICATIONS WITHDRAWN 2 $179,495 12 $103,170 0 $0 FILES CLOSED FOR INCOMPLETENESS 0 $0 1 $81,960 0 $0
Aggregated Statistics For Year 2002(Based on 6 full and 5 partial tracts) A) Conventional B) Refinancings C) Non-occupant Loans on Number Average Value Number Average Value Number Average Value
LOANS ORIGINATED 132 $102,192 178 $98,078 9 $69,303 APPLICATIONS APPROVED, NOT ACCEPTED 26 $96,222 33 $101,367 0 $0 APPLICATIONS DENIED 5 $95,078 2 $99,235 2 $45,445 APPLICATIONS WITHDRAWN 4 $90,392 12 $90,522 2 $49,945 FILES CLOSED FOR INCOMPLETENESS 1 $51,220 0 $0 0 $0
Aggregated Statistics For Year 2001(Based on 6 full and 5 partial tracts) A) Conventional B) Refinancings C) Non-occupant Loans on Number Average Value Number Average Value Number Average Value
LOANS ORIGINATED 125 $95,150 136 $98,254 5 $53,310 APPLICATIONS APPROVED, NOT ACCEPTED 16 $108,743 24 $110,171 1 $61,890 APPLICATIONS DENIED 3 $84,417 6 $74,803 3 $74,140 APPLICATIONS WITHDRAWN 0 $0 1 $46,950 0 $0 FILES CLOSED FOR INCOMPLETENESS 1 $52,820 0 $0 0 $0
Aggregated Statistics For Year 2000(Based on 6 full and 4 partial tracts) A) Conventional B) Refinancings C) Non-occupant Loans on Number Average Value Number Average Value Number Average Value
LOANS ORIGINATED 99 $92,150 39 $80,056 2 $51,500 APPLICATIONS APPROVED, NOT ACCEPTED 6 $78,663 3 $107,660 0 $0 APPLICATIONS DENIED 2 $110,760 1 $54,000 1 $54,000 APPLICATIONS WITHDRAWN 3 $97,547 1 $54,000 0 $0 FILES CLOSED FOR INCOMPLETENESS 2 $54,710 0 $0 0 $0
Aggregated Statistics For Year 1999(Based on 6 full and 5 partial tracts) A) Conventional B) Refinancings C) Non-occupant Loans on Number Average Value Number Average Value Number Average Value
LOANS ORIGINATED 117 $86,521 49 $78,994 5 $58,478 APPLICATIONS APPROVED, NOT ACCEPTED 12 $73,793 4 $76,142 4 $45,358 APPLICATIONS DENIED 2 $135,675 5 $94,134 0 $0 APPLICATIONS WITHDRAWN 5 $51,264 2 $77,245 3 $45,767 FILES CLOSED FOR INCOMPLETENESS 0 $0 1 $99,440 0 $0
Fire-safe hotels and motels in Jeffersonville, Indiana:
Super 8 Motel Jeffersonville, 2102 Old Hwy 31 E, Jeffersonville, Indiana 47130 Phone: (812) 282-8000, Fax: (812) 282-4675
Comfort Suites, 360 Eastern Blvd, Jeffersonville, Indiana 47130 Phone: (812) 282-2100
Sheraton Louisville Riverside Hotel, 700 W Riverside Dr, Jeffersonville, Indiana 47130 Phone: (812) 284-6711, Fax: (812) 283-3686
Hawthorn Suites by Wyndham Louisville North, 703 N Shore Dr, Jeffersonville, Indiana 47130 Phone: (812) 280-8200
TowenPlace Suites Louisville North, 301 W Maple St, Jeffersonville, Indiana 47130 Phone: (812) 914-4100, Fax: (812) 914-4200
Towneplace Suites Jeffersonville, 703 N Shore Dr, Jeffersonville, Indiana 47130 Phone: (812) 280-8200, Fax: (812) 280-8211
Fairfield Inn & Suites Louisville North, 619 N Shore Dr, Jeffersonville, Indiana 47130 Phone: (812) 280-8220, Fax: (812) 280-8211
All 7 fire-safe hotels and motels in Jeffersonville, Indiana
Most common first names in Jeffersonville, IN among deceased individuals Name Count Lived (average)
Mary 441 77.5 years William 418 72.0 years John 361 72.8 years James 360 70.6 years Charles 316 72.3 years Robert 228 67.8 years George 171 74.5 years Margaret 141 78.0 years Anna 139 82.1 years Helen 127 77.8 years
Most common last names in Jeffersonville, IN among deceased individuals Last name Count Lived (average)
Smith 183 74.4 years Brown 98 77.2 years Johnson 95 74.6 years Jones 87 75.6 years Miller 87 76.0 years Williams 82 75.1 years Davis 70 77.0 years Wilson 58 72.0 years Thompson 55 74.6 years Taylor 50 70.9 years
Jeffersonville compared to Indiana state average:
Unemployed percentage below state average. Black race population percentage above state average. Length of stay since moving in significantly above state average. Jeffersonville on our top lists :
#78 on the list of "Top 101 cities with the most residents born in Other Eastern Asia (population 500+)"
#35 on the list of "Top 101 counties with the lowest surface withdrawal of fresh water for public supply (pop. 50,000+)"
#53 on the list of "Top 101 counties with the highest Particulate Matter (PM2.5 ) Annual air pollution readings in 2012 (µg/m3 )"
#89 on the list of "Top 101 counties with the smallest number of people without health insurance coverage in 2000 (pop. 50,000+)"
Top Patent Applicants
Benjamin E. Morris (17)
Mark David Brennan (15)
Mark D. Brennan (8)
Ben Morris (7)
Dennis Mcandrews (6)
Alan George Constance (5)
Adam E. Gaweda (3)
Edward D. Thompson (3)
Mark R. Coward (3)
Bryan Babb (3)
Total of 134 patent applications in 2008-2024.


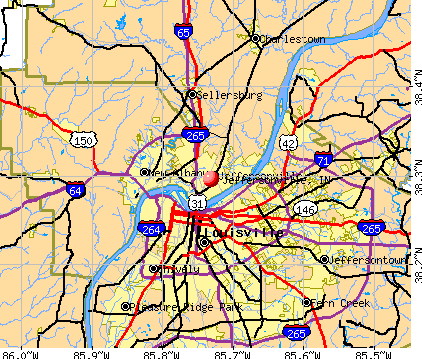


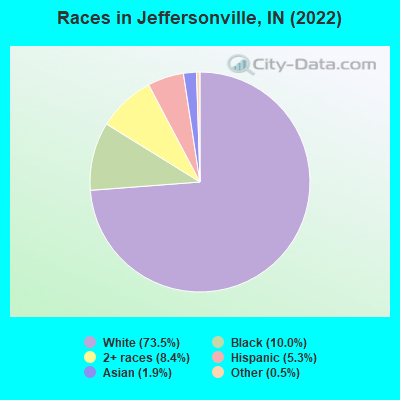
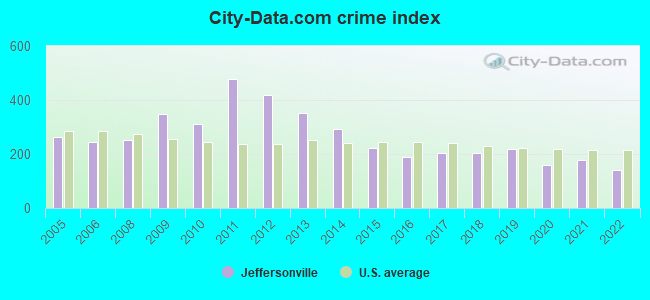
 Recent articles from our blog. Our writers, many of them Ph.D. graduates or candidates, create easy-to-read articles on a wide variety of topics.


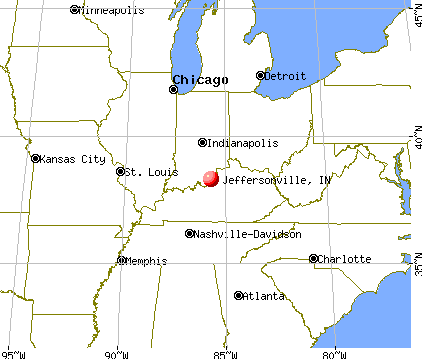
 (4.7 miles
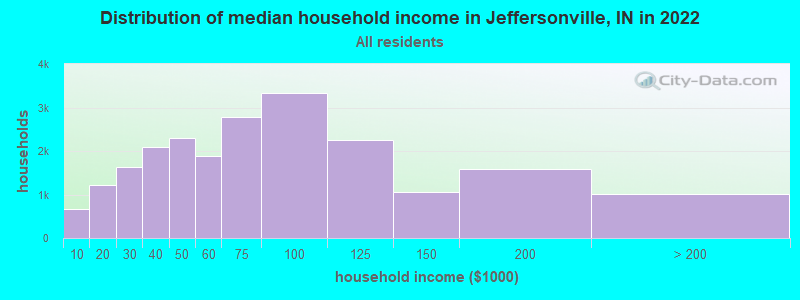
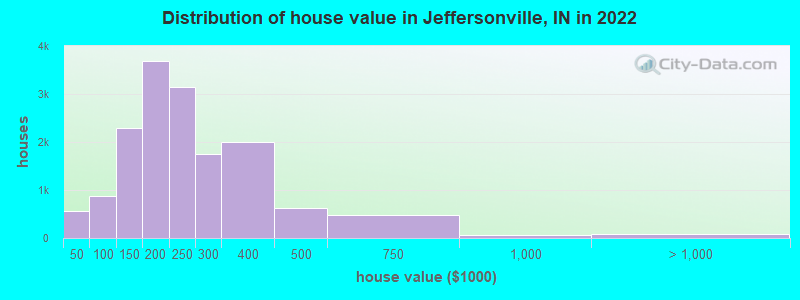
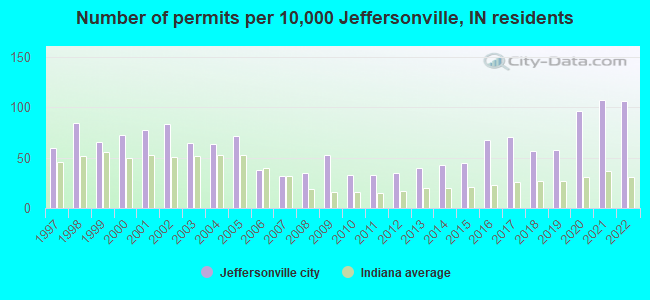
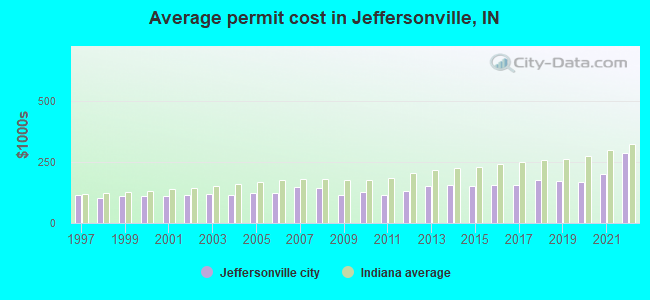
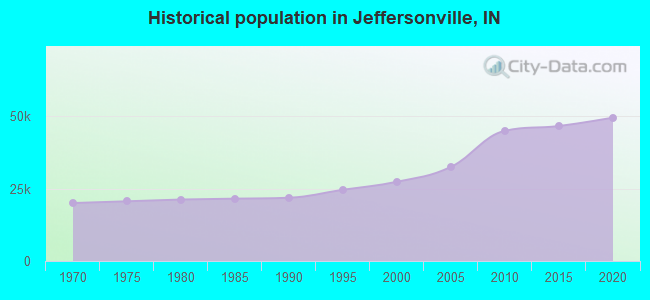
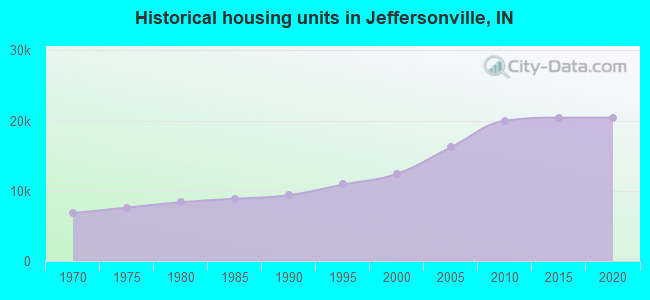
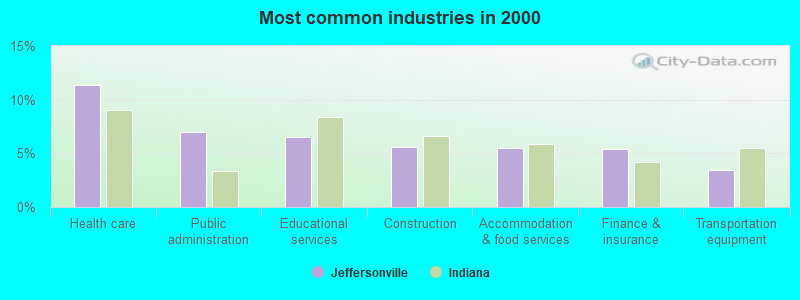
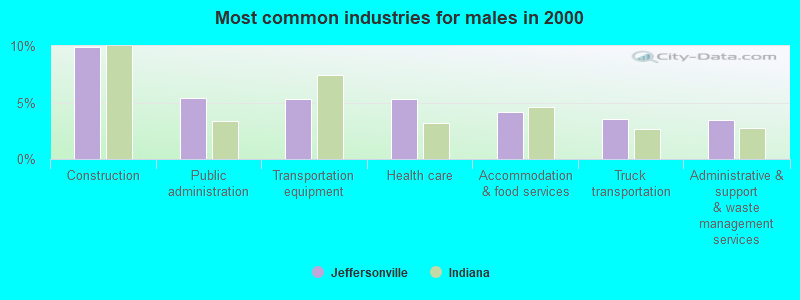
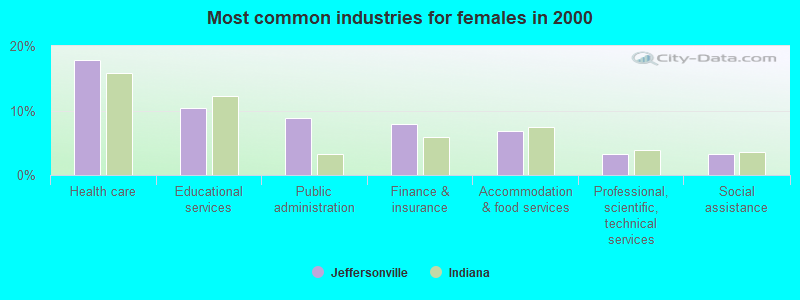
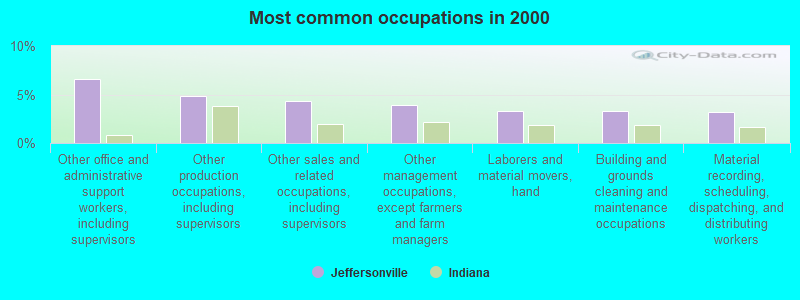
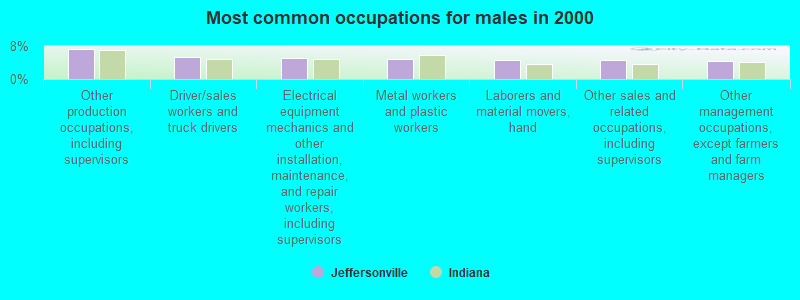
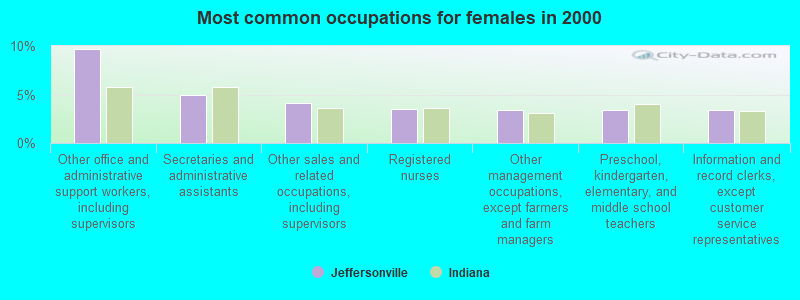
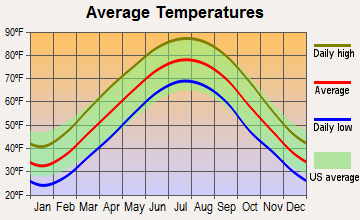
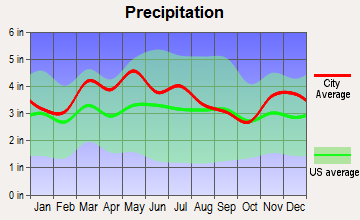
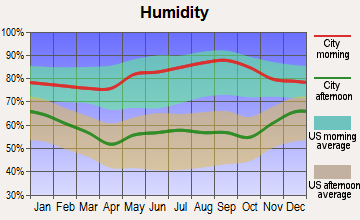
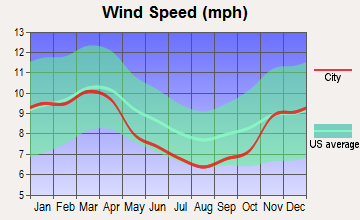
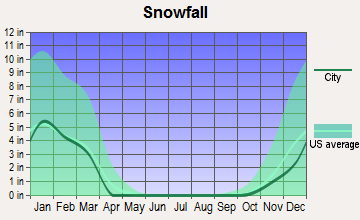
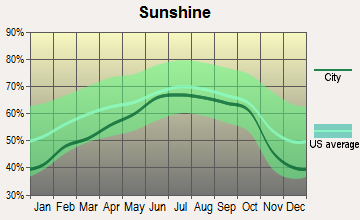
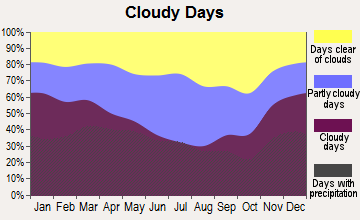
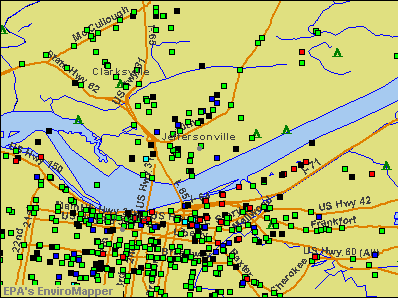

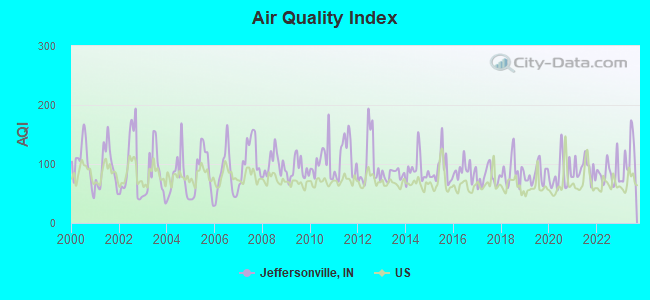
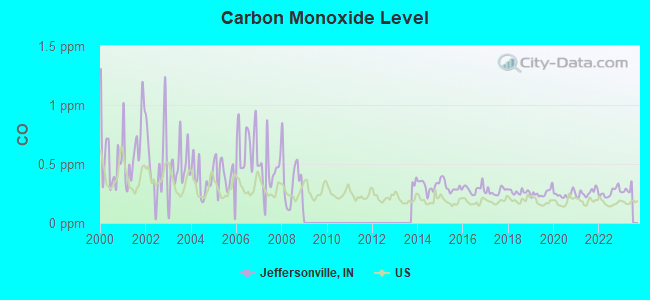
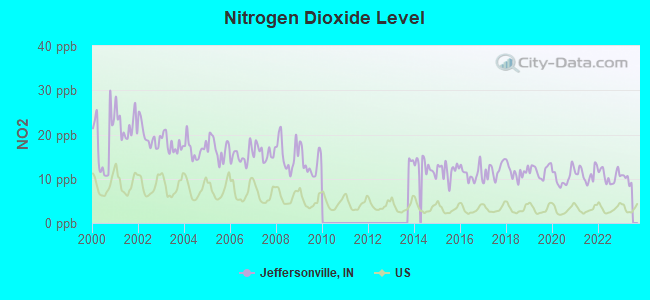
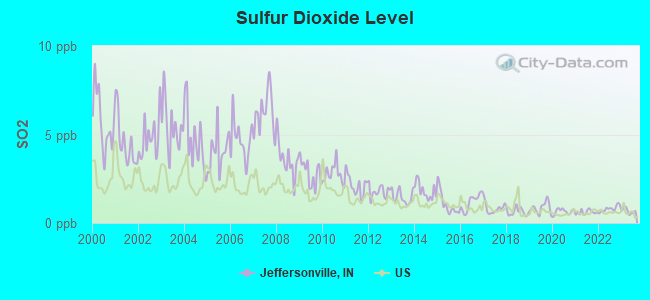
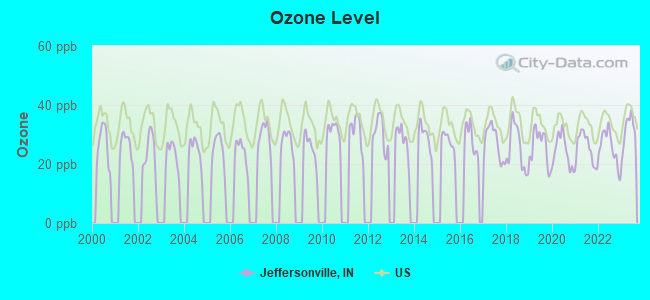
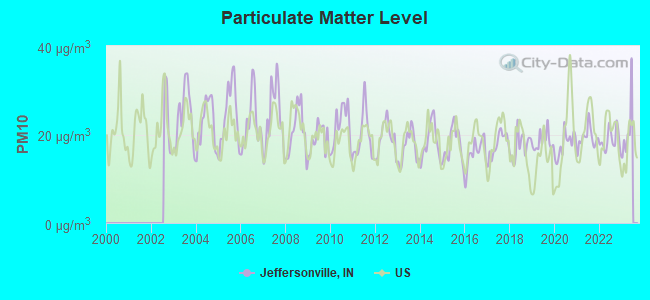
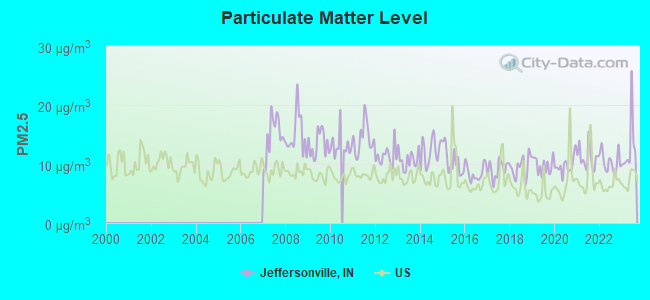
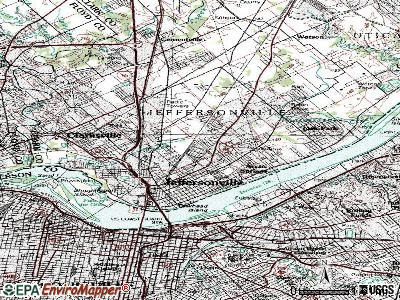
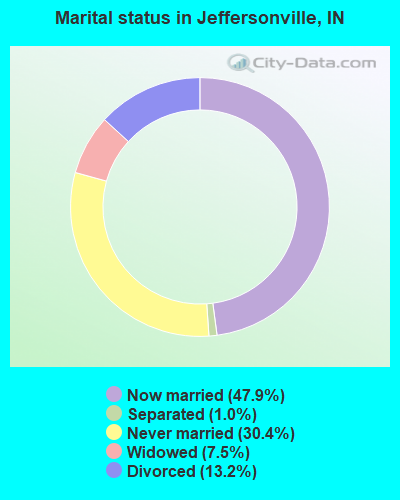
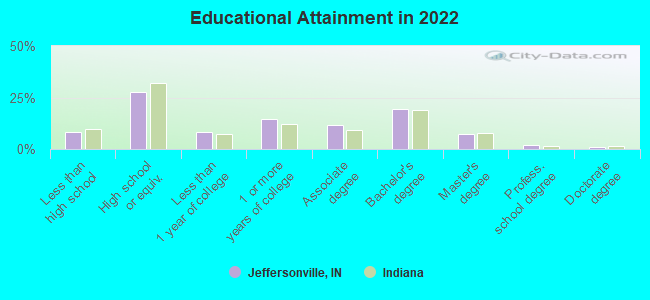
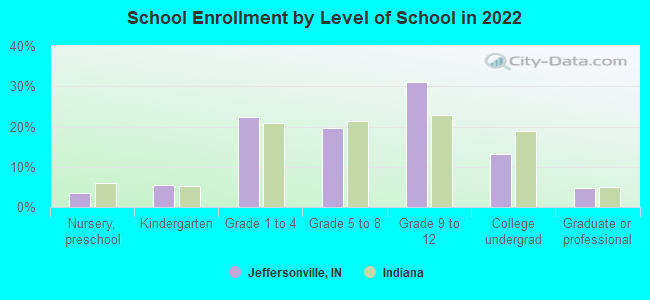
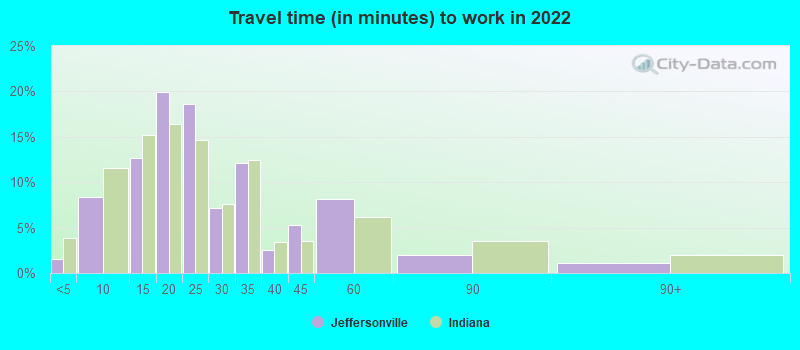
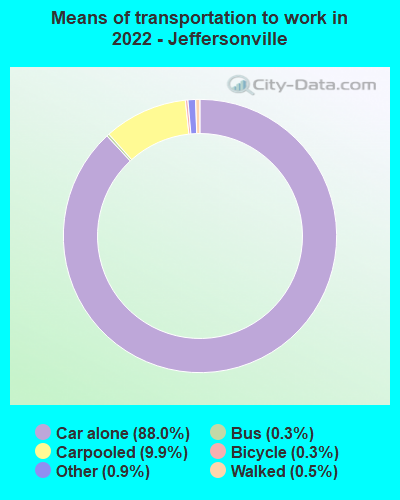
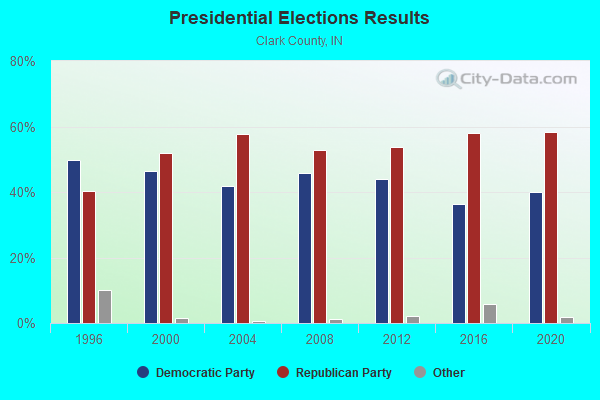
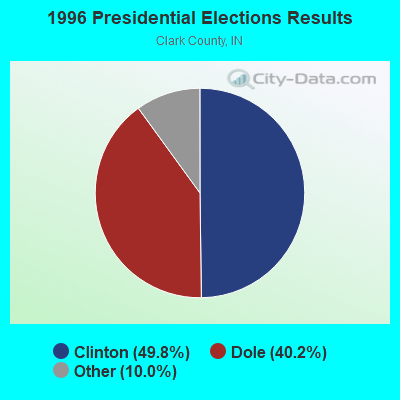
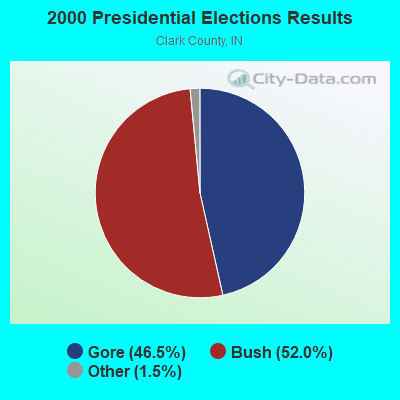
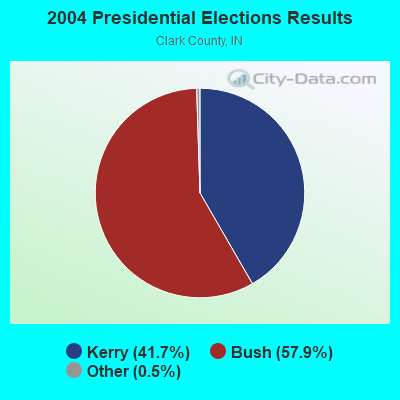
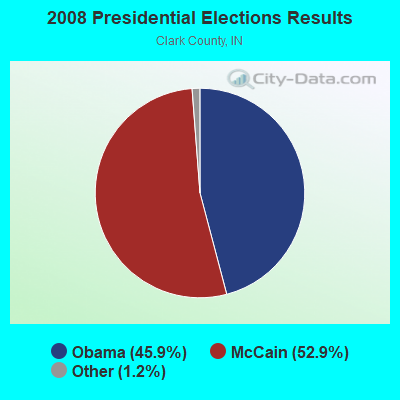
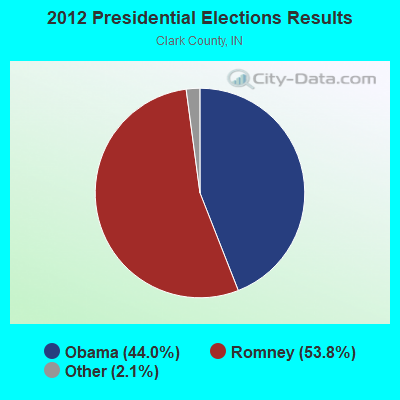
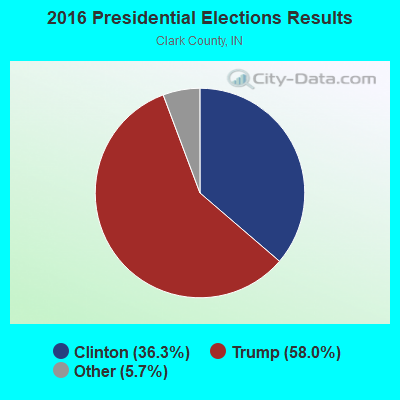
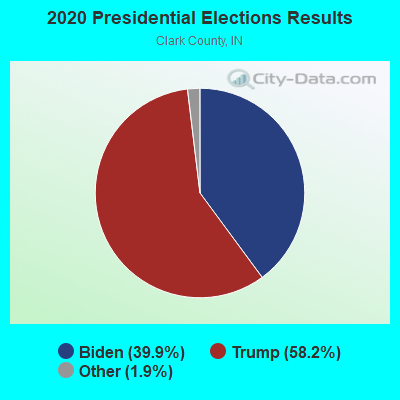
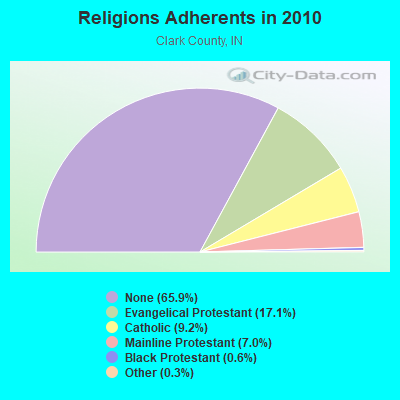
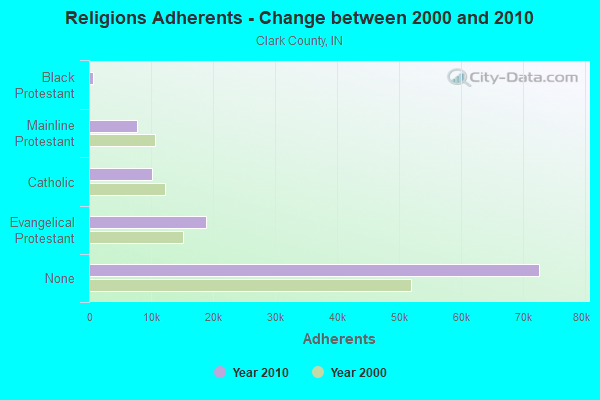
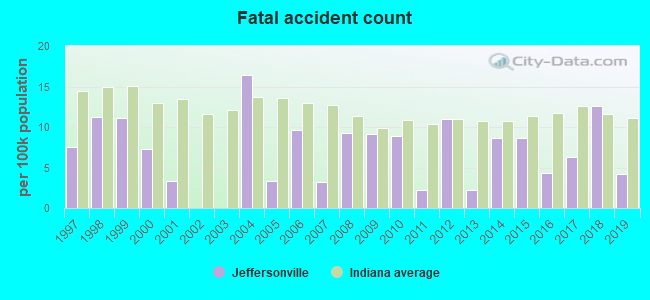
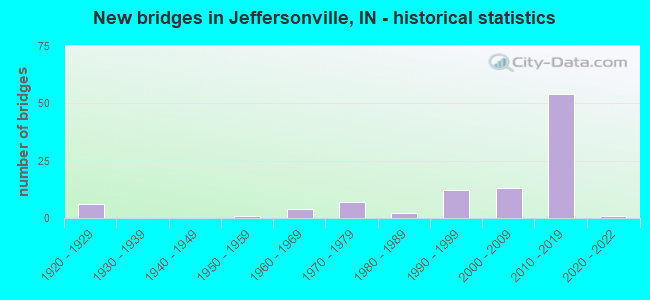
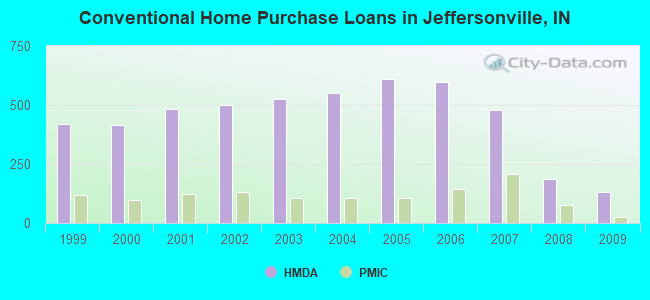
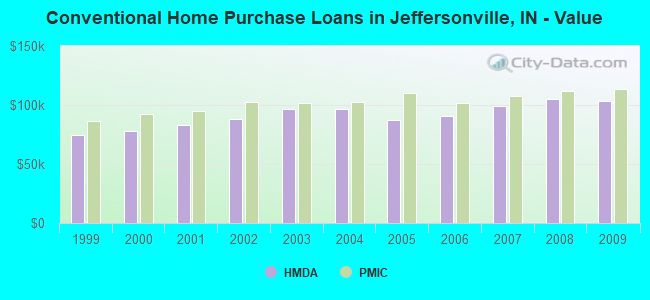
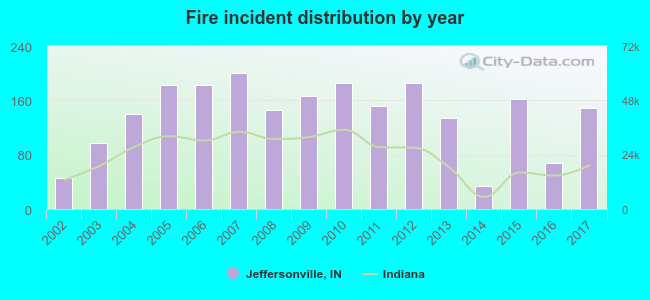 According to the data from the years 2002 - 2017 the average number of fires per year is 139. The highest number of fire incidents - 200 took place in 2007, and the least - 34 in 2014. The data has a growing trend.
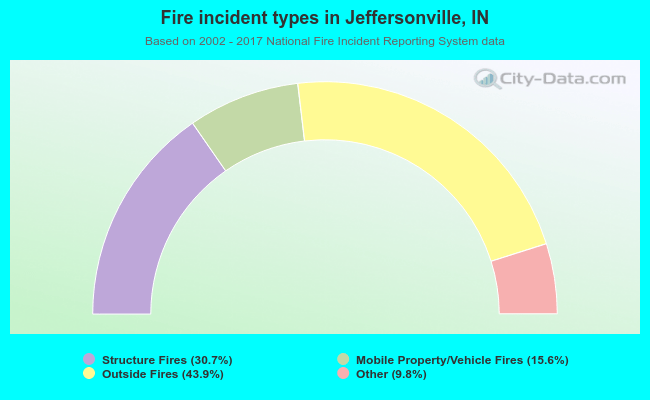 When looking into fire subcategories, the most incidents belonged to: Outside Fires (43.9%), and Structure Fires (30.7%).