Percentage of residents living in poverty in 2022: 22.6%
(22.3% for White Non-Hispanic residents, 15.8% for Black residents, 28.0% for Hispanic or Latino residents, 31.2% for American Indian residents, 23.6% for Native Hawaiian and other Pacific Islander residents, 13.9% for other race residents, 26.8% for two or more races residents)
1740.7%Native Hawaiian and Other Pacific Islander alone
According to our research of California and other state lists, there were 11 registered sex offenders living in Linda, California as of April 25, 2024. The ratio of all residents to sex offenders in Linda is 1,722 to 1. The ratio of registered sex offenders to all residents in this city is lower than the state average.
Recent articles from our blog. Our writers, many of them Ph.D. graduates or candidates, create easy-to-read articles on a wide variety of topics.
Latest news from Linda, CA collected exclusively by city-data.com from local newspapers, TV, and radio stations
Ancestries: English (4.6%), Irish (2.7%), German (2.7%), European (2.4%), American (2.2%), Russian (1.2%).
Current Local Time: PST time zone
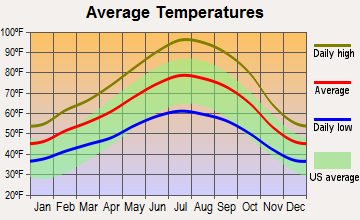
Elevation: 65 feet
Land area: 5.64 square miles.
Population density: 3,150 people per square mile (average).
3,906 residents are foreign born (10.3% Latin America, 5.6% Asia).
This place:
16.3%
California:
26.5%
Median real estate property taxes paid for housing units with mortgages in 2022: $3,138 (0.8%) Median real estate property taxes paid for housing units with no mortgage in 2022: $1,485 (0.5%)
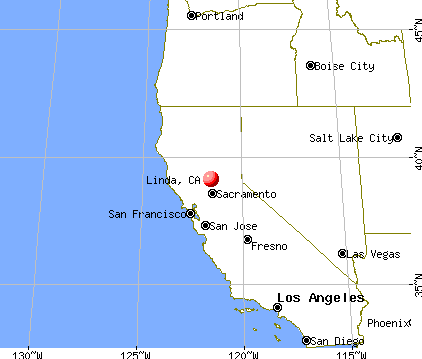
Nearest city with pop. 50,000+: Roseville, CA (29.7 miles , pop. 79,921).
Nearest city with pop. 200,000+: Sacramento, CA (39.7 miles , pop. 407,018).
Nearest city with pop. 1,000,000+: Los Angeles, CA (390.8 miles , pop. 3,694,820).
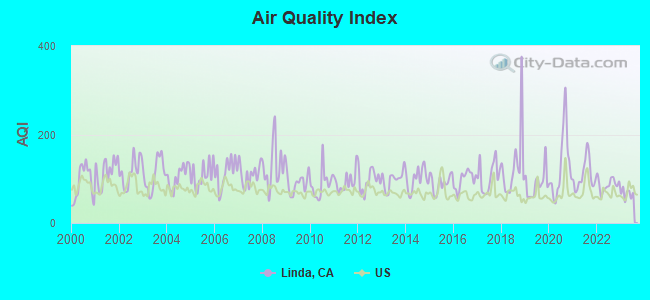
Air Quality Index (AQI) level in 2023 was 66.2. This is about average.
City:
66.2
U.S.:
72.6
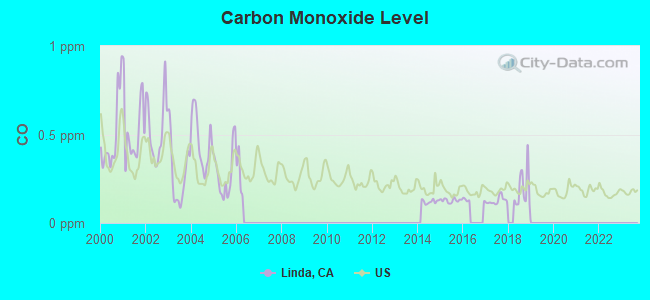
Carbon Monoxide (CO) [ppm] level in 2018 was 0.191. This is better than average.Closest monitor was 3.1 miles away from the city center.
City:
0.191
U.S.:
0.251
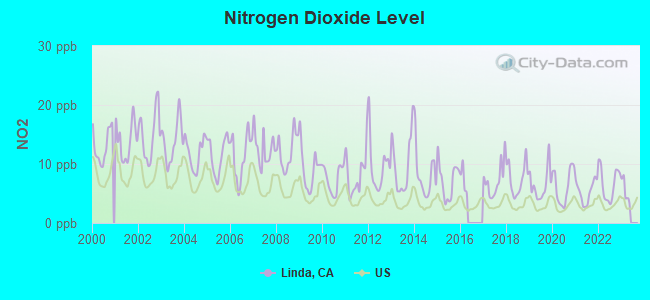
Nitrogen Dioxide (NO2) [ppb] level in 2022 was 6.65. This is worse than average.Closest monitor was 3.1 miles away from the city center.
City:
6.65
U.S.:
5.11
Ozone [ppb] level in 2023 was 32.3. This is about average.Closest monitor was 2.2 miles away from the city center.
City:
32.3
U.S.:
33.3
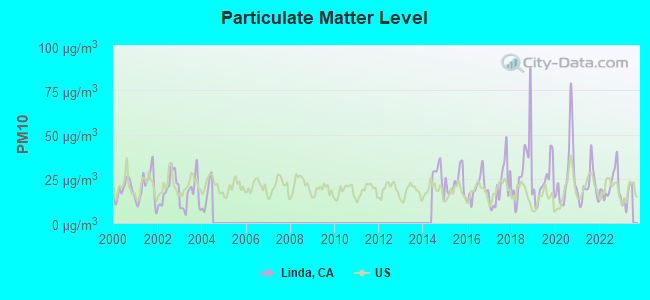
Particulate Matter (PM10) [µg/m3] level in 2022 was 21.5. This is about average.Closest monitor was 2.2 miles away from the city center.
City:
21.5
U.S.:
19.2
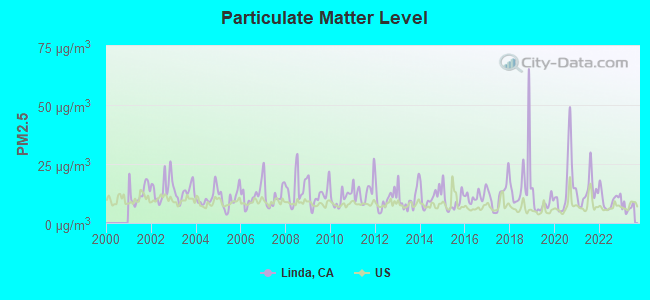
Particulate Matter (PM2.5) [µg/m3] level in 2023 was 6.53. This is better than average.Closest monitor was 3.1 miles away from the city center.
City:
6.53
U.S.:
8.11
Earthquake activity:
Linda-area historical earthquake activity is significantly above California state average. It is 7266% greater than the overall U.S. average.
On 4/18/1906 at 13:12:21, a magnitude 7.9 (7.9 UK, Class: Major, Intensity: VIII - XII) earthquake occurred 110.0 miles away from the city center, causing $524,000,000 total damage On 10/3/1915 at 06:52:48, a magnitude 7.6 (7.6 UK) earthquake occurred 235.9 miles away from the city center On 1/31/1922 at 13:17:28, a magnitude 7.6 (7.6 UK) earthquake occurred 238.0 miles away from the city center On 4/25/1992 at 18:06:04, a magnitude 7.2 (6.3 MB, 7.1 MS, 7.2 MW, 7.1 MW, Depth: 9.4 mi) earthquake occurred 157.9 miles away from Linda center, causing $75,000,000 total damage On 10/18/1989 at 00:04:15, a magnitude 7.1 (6.5 MB, 7.1 MS, 6.9 MW, 7.0 ML) earthquake occurred 139.8 miles away from Linda center, causing 62 deaths (62 shaking deaths) and 3757 injuries, causing $1,305,032,704 total damage On 12/21/1932 at 06:10:09, a magnitude 7.2 (7.2 UK) earthquake occurred 192.2 miles away from the city center Magnitude types: body-wave magnitude (MB), local magnitude (ML), surface-wave magnitude (MS), moment magnitude (MW)
Natural disasters:
The number of natural disasters in Yuba County (22) is greater than the US average (15). Major Disasters (Presidential) Declared: 12 Emergencies Declared: 3
Causes of natural disasters: Floods: 12, Fires: 6, Storms: 6, Winter Storms: 5, Landslides: 3, Mudslides: 3, Drought: 1, Freeze: 1, Heavy Rain: 1, Hurricane: 1, Tornado: 1, Other: 1 (Note: some incidents may be assigned to more than one category).
Hospitals and medical centers near Linda:
RIDEOUT MEMORIAL HOSPITAL Acute Care Hospitals (about 2 miles away; MARYSVILLE, CA)
MARYSVILLE CARE CENTER (Nursing Home, about 3 miles away; MARYSVILLE, CA)
MARYSVILLE DIALYSIS CENTER (Dialysis Facility, about 3 miles away; MARYSVILLE, CA)
SUTTER NORTH HOME HEALTH (Home Health Center, about 3 miles away; YUBA CITY, CA)
SUTTER SURGICAL HOSPITAL - NORTH VALLEY Acute Care Hospitals (about 3 miles away; YUBA CITY, CA)
FREMONT MEDICAL CENTER (Hospital, about 4 miles away; YUBA CITY, CA)
FREMONT-RIDEOUT HOME HEALTH (Home Health Center, about 4 miles away; YUBA CITY, CA)
Amtrak station near Linda:
2 miles: MARYSVILLE (6TH & A STS.) - Bus Station
Colleges/universities with over 2000 students nearest to Linda:
Yuba College (about 2 miles; Marysville, CA; Full-time enrollment: 4,737)
Sierra College (about 30 miles; Rocklin, CA; FT enrollment: 11,488)
Universal Technical Institute of Northern California Inc (about 34 miles; Sacramento, CA; FT enrollment: 3,193)
American River College (about 35 miles; Sacramento, CA; FT enrollment: 20,452)
University of Phoenix-Sacramento Valley Campus (about 35 miles; Sacramento, CA; FT enrollment: 2,855)
Butte College (about 37 miles; Oroville, CA; FT enrollment: 8,649)
Folsom Lake College (about 40 miles; Folsom, CA; FT enrollment: 5,308)
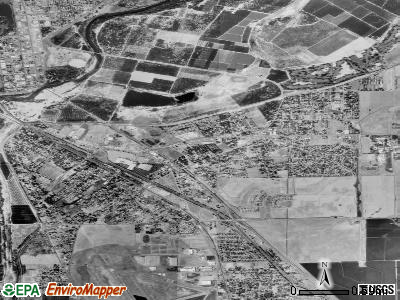
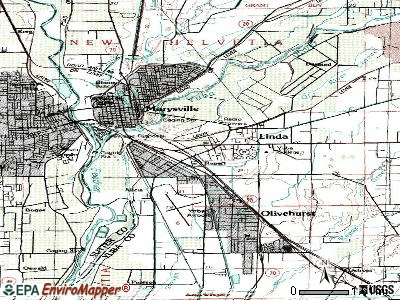
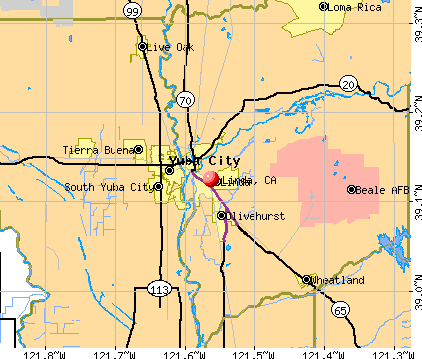
Notable locations in Linda: Rupert Siding (A), Library Learning Center Yuba Community College (B), Linda Fire Protection District Station 1 (C). Display/hide their locations on the map
Birthplace of: Marshall Miles - Contract bridge player and author, Gabe Long - Football player, Jeremy Ito - Football player, Malia Jones - Surfer.
Yuba County has a predicted average indoor radon screening level between 2 and 4 pCi/L (pico curies per liter) - Moderate Potential
Average household size:
This place:
3.3 people
California:
2.9 people
Percentage of family households:
This place:
76.0%
Whole state:
68.7%
Percentage of households with unmarried partners:
This place:
10.7%
Whole state:
7.2%
Likely homosexual households (counted as self-reported same-sex unmarried-partner households)
Lesbian couples: 0.5% of all households
Gay men: 0.3% of all households
21 people in group homes intended for adults in 2010
24 people in college dormitories (includes college quarters off campus) in 2000
6 people in nursing homes in 2000
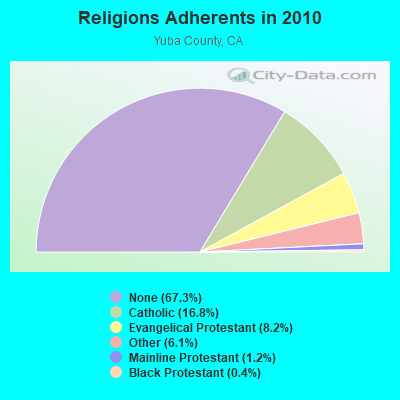
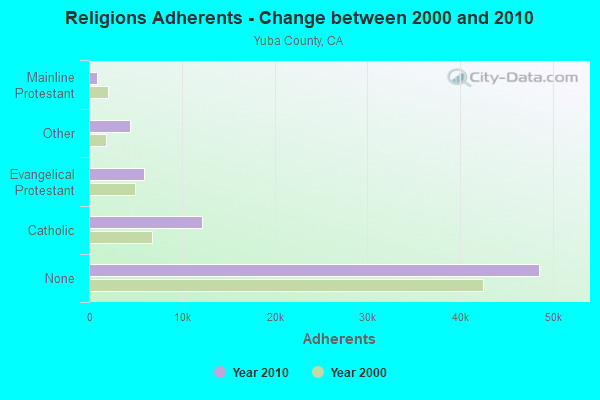
Religion statistics for Linda, CA (based on Yuba County data)
Religion
Adherents
Congregations
Catholic
12,138
3
Evangelical Protestant
5,904
46
Other
4,406
9
Mainline Protestant
891
7
Black Protestant
266
1
None
48,550
-
Source: Clifford Grammich, Kirk Hadaway, Richard Houseal, Dale E.Jones, Alexei Krindatch, Richie Stanley and Richard H.Taylor. 2012. 2010 U.S.Religion Census: Religious Congregations & Membership Study. Association of Statisticians of American Religious Bodies. Jones, Dale E., et al. 2002. Congregations and Membership in the United States 2000. Nashville, TN: Glenmary Research Center. Graphs represent county-level data
Call Sign: WB6EVH, Licensee ID: L01020649, Grant Date: 04/24/2014, Expiration Date: 05/31/2024, Certifier: Victor E Borgnis, Registrant: Victor E Borgnis, 5539 Newcastle Way, Linda, CA 95901
Call Sign: KI6UJX, Licensee ID: L01446621, Grant Date: 10/02/2018, Expiration Date: 11/19/2028, Certifier: Michael C Kopf, Registrant: Michael C Kopf, 2369 N. Beale Rd., Apt. 8, Linda, CA 95901-8008
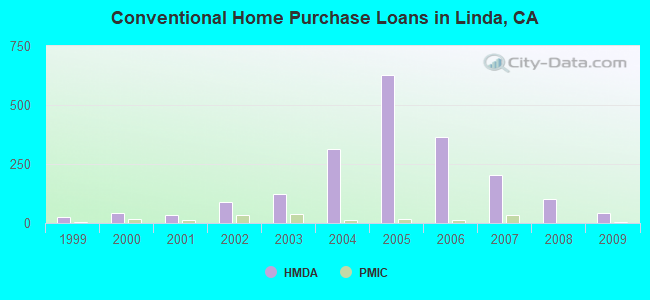
Home Mortgage Disclosure Act Aggregated Statistics For Year 2009 (Based on 1 full and 1 partial tracts)
A) FHA, FSA/RHS & VA Home Purchase Loans
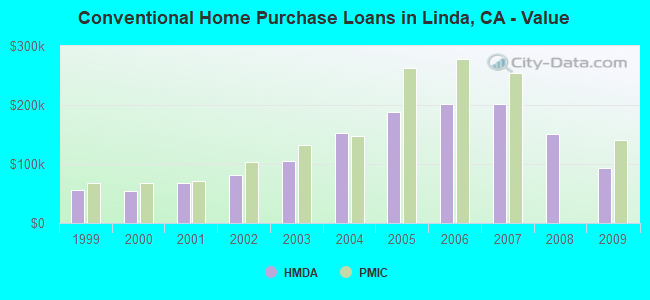
B) Conventional Home Purchase Loans
C) Refinancings
D) Home Improvement Loans
E) Loans on Dwellings For 5+ Families
F) Non-occupant Loans on < 5 Family Dwellings (A B C & D)
G) Loans On Manufactured Home Dwelling (A B C & D)
Number
Average Value
Number
Average Value
Number
Average Value
Number
Average Value
Number
Average Value
Number
Average Value
Number
Average Value
LOANS ORIGINATED
168
$156,711
42
$93,434
70
$175,269
4
$42,688
1
$199,940
26
$87,823
0
$0
APPLICATIONS APPROVED, NOT ACCEPTED
9
$151,710
3
$84,420
12
$190,932
1
$14,280
0
$0
3
$126,313
0
$0
APPLICATIONS DENIED
16
$159,700
14
$114,120
46
$148,593
2
$45,885
2
$566,500
15
$126,801
1
$39,040
APPLICATIONS WITHDRAWN
13
$158,859
9
$110,759
23
$146,625
1
$32,370
0
$0
5
$80,544
0
$0
FILES CLOSED FOR INCOMPLETENESS
2
$133,295
0
$0
2
$211,365
0
$0
0
$0
0
$0
0
$0
Aggregated Statistics For Year 2008 (Based on 1 full and 1 partial tracts)
A) FHA, FSA/RHS & VA Home Purchase Loans
B) Conventional Home Purchase Loans
C) Refinancings
D) Home Improvement Loans
E) Loans on Dwellings For 5+ Families
F) Non-occupant Loans on < 5 Family Dwellings (A B C & D)
G) Loans On Manufactured Home Dwelling (A B C & D)
Number
Average Value
Number
Average Value
Number
Average Value
Number
Average Value
Number
Average Value
Number
Average Value
Number
Average Value
LOANS ORIGINATED
134
$193,512
103
$150,931
45
$187,098
6
$89,180
1
$303,720
44
$137,610
1
$19,040
APPLICATIONS APPROVED, NOT ACCEPTED
7
$225,250
18
$191,294
13
$240,860
0
$0
0
$0
5
$118,060
0
$0
APPLICATIONS DENIED
20
$189,996
24
$175,091
80
$196,470
19
$92,117
1
$3,178,110
20
$179,439
2
$75,960
APPLICATIONS WITHDRAWN
12
$192,784
17
$159,431
35
$170,739
3
$80,003
0
$0
5
$133,912
0
$0
FILES CLOSED FOR INCOMPLETENESS
1
$154,960
2
$188,515
10
$191,848
1
$47,600
0
$0
1
$148,530
0
$0
Aggregated Statistics For Year 2007 (Based on 1 full and 1 partial tracts)
A) FHA, FSA/RHS & VA Home Purchase Loans
B) Conventional Home Purchase Loans
C) Refinancings
D) Home Improvement Loans
E) Loans on Dwellings For 5+ Families
F) Non-occupant Loans on < 5 Family Dwellings (A B C & D)
G) Loans On Manufactured Home Dwelling (A B C & D)
Number
Average Value
Number
Average Value
Number
Average Value
Number
Average Value
Number
Average Value
Number
Average Value
Number
Average Value
LOANS ORIGINATED
37
$272,686
202
$201,437
156
$186,100
26
$86,359
1
$1,964,280
37
$169,789
2
$129,960
APPLICATIONS APPROVED, NOT ACCEPTED
4
$287,058
43
$203,756
44
$184,808
6
$71,925
0
$0
8
$142,384
1
$56,170
APPLICATIONS DENIED
7
$255,843
77
$191,266
218
$213,516
45
$84,356
0
$0
30
$160,060
3
$87,780
APPLICATIONS WITHDRAWN
4
$205,572
28
$189,349
93
$208,624
8
$124,506
0
$0
12
$184,009
1
$125,680
FILES CLOSED FOR INCOMPLETENESS
0
$0
10
$164,015
37
$225,208
2
$141,865
0
$0
2
$161,860
0
$0
Aggregated Statistics For Year 2006 (Based on 1 full and 1 partial tracts)
A) FHA, FSA/RHS & VA Home Purchase Loans
B) Conventional Home Purchase Loans
C) Refinancings
D) Home Improvement Loans
E) Loans on Dwellings For 5+ Families
F) Non-occupant Loans on < 5 Family Dwellings (A B C & D)
G) Loans On Manufactured Home Dwelling (A B C & D)
Number
Average Value
Number
Average Value
Number
Average Value
Number
Average Value
Number
Average Value
Number
Average Value
Number
Average Value
LOANS ORIGINATED
7
$296,760
364
$201,965
319
$178,872
62
$77,910
1
$504,780
64
$187,157
5
$92,836
APPLICATIONS APPROVED, NOT ACCEPTED
1
$288,490
81
$191,239
81
$199,890
13
$98,308
0
$0
11
$186,718
0
$0
APPLICATIONS DENIED
2
$270,395
97
$189,975
250
$198,374
65
$75,404
0
$0
34
$186,814
5
$69,644
APPLICATIONS WITHDRAWN
1
$388,090
71
$204,725
212
$206,484
13
$139,915
0
$0
14
$211,176
0
$0
FILES CLOSED FOR INCOMPLETENESS
1
$159,000
10
$113,494
32
$221,988
4
$85,690
0
$0
2
$195,440
1
$219,200
Aggregated Statistics For Year 2005 (Based on 1 full and 1 partial tracts)
A) FHA, FSA/RHS & VA Home Purchase Loans
B) Conventional Home Purchase Loans
C) Refinancings
D) Home Improvement Loans
E) Loans on Dwellings For 5+ Families
F) Non-occupant Loans on < 5 Family Dwellings (A B C & D)
G) Loans On Manufactured Home Dwelling (A B C & D)
Number
Average Value
Number
Average Value
Number
Average Value
Number
Average Value
Number
Average Value
Number
Average Value
Number
Average Value
LOANS ORIGINATED
9
$276,003
628
$188,686
353
$166,115
60
$108,695
8
$614,569
102
$178,145
7
$99,143
APPLICATIONS APPROVED, NOT ACCEPTED
1
$266,590
128
$189,094
79
$159,558
20
$76,740
0
$0
26
$146,129
5
$63,412
APPLICATIONS DENIED
3
$251,037
153
$177,378
229
$171,377
46
$88,064
2
$334,530
44
$150,978
12
$93,484
APPLICATIONS WITHDRAWN
2
$140,910
135
$207,781
191
$176,334
22
$142,261
0
$0
21
$197,523
6
$123,985
FILES CLOSED FOR INCOMPLETENESS
0
$0
17
$198,587
38
$181,937
2
$133,295
0
$0
6
$164,147
0
$0
Aggregated Statistics For Year 2004 (Based on 1 full and 1 partial tracts)
A) FHA, FSA/RHS & VA Home Purchase Loans
B) Conventional Home Purchase Loans
C) Refinancings
D) Home Improvement Loans
E) Loans on Dwellings For 5+ Families
F) Non-occupant Loans on < 5 Family Dwellings (A B C & D)
G) Loans On Manufactured Home Dwelling (A B C & D)
Number
Average Value
Number
Average Value
Number
Average Value
Number
Average Value
Number
Average Value
Number
Average Value
Number
Average Value
LOANS ORIGINATED
9
$176,951
313
$153,055
279
$127,601
35
$71,565
1
$1,361,680
74
$142,502
3
$54,070
APPLICATIONS APPROVED, NOT ACCEPTED
1
$249,450
91
$147,307
62
$119,209
6
$80,207
0
$0
10
$90,427
7
$66,989
APPLICATIONS DENIED
1
$170,340
121
$164,323
191
$121,036
40
$57,499
1
$396,200
27
$111,193
5
$67,344
APPLICATIONS WITHDRAWN
4
$142,725
154
$244,470
116
$126,209
10
$94,668
0
$0
11
$172,715
1
$148,580
FILES CLOSED FOR INCOMPLETENESS
1
$56,170
13
$6,116,226
39
$130,291
1
$64,710
0
$0
0
$0
0
$0
Aggregated Statistics For Year 2003 (Based on 1 full and 1 partial tracts)
A) FHA, FSA/RHS & VA Home Purchase Loans
B) Conventional Home Purchase Loans
C) Refinancings
D) Home Improvement Loans
E) Loans on Dwellings For 5+ Families
F) Non-occupant Loans on < 5 Family Dwellings (A B C & D)
Number
Average Value
Number
Average Value
Number
Average Value
Number
Average Value
Number
Average Value
Number
Average Value
LOANS ORIGINATED
17
$133,666
125
$104,240
338
$95,342
13
$31,922
5
$777,620
60
$97,216
APPLICATIONS APPROVED, NOT ACCEPTED
1
$197,920
26
$118,414
64
$95,204
5
$86,606
0
$0
19
$102,623
APPLICATIONS DENIED
3
$124,197
42
$115,777
130
$102,153
11
$42,115
0
$0
14
$106,094
APPLICATIONS WITHDRAWN
2
$107,585
15
$101,464
121
$106,370
2
$9,995
0
$0
11
$117,663
FILES CLOSED FOR INCOMPLETENESS
1
$94,260
4
$126,650
15
$102,713
0
$0
0
$0
2
$77,595
Aggregated Statistics For Year 2002 (Based on 1 full and 1 partial tracts)
A) FHA, FSA/RHS & VA Home Purchase Loans
B) Conventional Home Purchase Loans
C) Refinancings
D) Home Improvement Loans
E) Loans on Dwellings For 5+ Families
F) Non-occupant Loans on < 5 Family Dwellings (A B C & D)
Number
Average Value
Number
Average Value
Number
Average Value
Number
Average Value
Number
Average Value
Number
Average Value
LOANS ORIGINATED
38
$112,977
90
$81,214
161
$82,471
12
$26,847
1
$862,590
31
$63,401
APPLICATIONS APPROVED, NOT ACCEPTED
2
$93,955
24
$79,338
22
$85,546
1
$33,600
0
$0
9
$67,917
APPLICATIONS DENIED
7
$100,320
23
$71,111
103
$84,697
12
$21,552
1
$257,070
13
$79,697
APPLICATIONS WITHDRAWN
7
$108,403
6
$84,268
58
$88,513
1
$9,550
0
$0
5
$91,564
FILES CLOSED FOR INCOMPLETENESS
1
$92,670
3
$80,610
13
$76,610
0
$0
0
$0
2
$55,700
Aggregated Statistics For Year 2001 (Based on 1 full and 1 partial tracts)
A) FHA, FSA/RHS & VA Home Purchase Loans
B) Conventional Home Purchase Loans
C) Refinancings
D) Home Improvement Loans
E) Loans on Dwellings For 5+ Families
F) Non-occupant Loans on < 5 Family Dwellings (A B C & D)
Number
Average Value
Number
Average Value
Number
Average Value
Number
Average Value
Number
Average Value
Number
Average Value
LOANS ORIGINATED
42
$99,192
32
$68,199
97
$76,115
1
$45,310
2
$688,845
27
$62,351
APPLICATIONS APPROVED, NOT ACCEPTED
2
$103,580
8
$70,974
18
$85,934
0
$0
0
$0
4
$71,798
APPLICATIONS DENIED
6
$94,112
17
$58,604
74
$66,991
14
$23,909
0
$0
9
$73,640
APPLICATIONS WITHDRAWN
0
$0
2
$63,970
57
$77,660
4
$32,688
0
$0
5
$46,916
FILES CLOSED FOR INCOMPLETENESS
0
$0
0
$0
13
$98,485
1
$28,560
0
$0
0
$0
Aggregated Statistics For Year 2000 (Based on 1 full and 1 partial tracts)
A) FHA, FSA/RHS & VA Home Purchase Loans
B) Conventional Home Purchase Loans
C) Refinancings
D) Home Improvement Loans
E) Loans on Dwellings For 5+ Families
F) Non-occupant Loans on < 5 Family Dwellings (A B C & D)
Number
Average Value
Number
Average Value
Number
Average Value
Number
Average Value
Number
Average Value
Number
Average Value
LOANS ORIGINATED
52
$81,382
42
$54,868
36
$56,554
5
$23,866
2
$1,011,370
19
$56,622
APPLICATIONS APPROVED, NOT ACCEPTED
1
$99,020
2
$69,530
15
$72,555
5
$41,382
0
$0
4
$61,980
APPLICATIONS DENIED
12
$84,008
25
$64,260
65
$48,350
12
$25,263
0
$0
5
$49,606
APPLICATIONS WITHDRAWN
3
$66,963
6
$85,855
24
$65,885
4
$27,552
0
$0
0
$0
FILES CLOSED FOR INCOMPLETENESS
1
$76,210
1
$85,690
9
$74,181
0
$0
0
$0
0
$0
Aggregated Statistics For Year 1999 (Based on 2 partial tracts)
A) FHA, FSA/RHS & VA Home Purchase Loans
B) Conventional Home Purchase Loans
C) Refinancings
D) Home Improvement Loans
E) Loans on Dwellings For 5+ Families
F) Non-occupant Loans on < 5 Family Dwellings (A B C & D)
#65 on the list of "Top 101 cities with the most residents born in Laos (population 500+)"
#69 on the list of "Top 101 cities with the most residents born in Thailand (population 500+)"
#75 on the list of "Top 101 cities with the least people having Master's or Doctorate degrees (population 5,000+)"
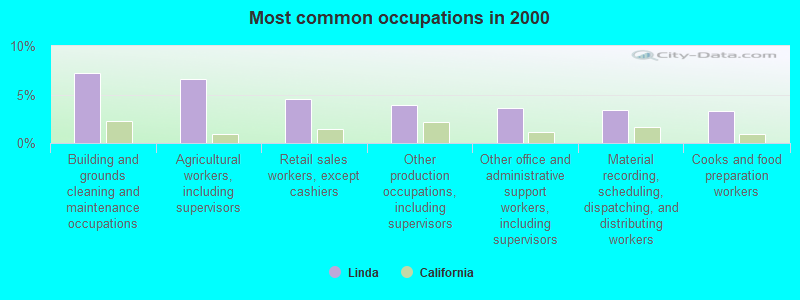
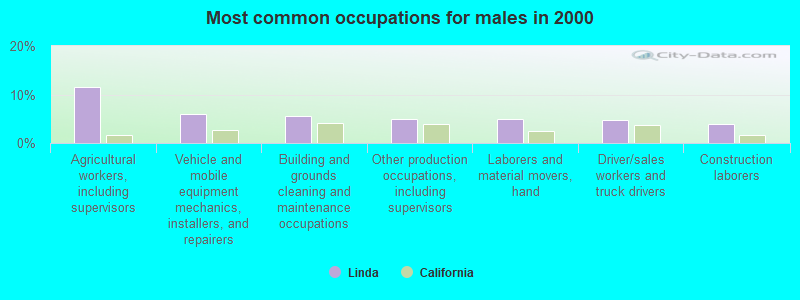
#99 on the list of "Top 101 cities with largest percentage of males in occupations: farming, fishing, and forestry occupations (population 5,000+)"
#30 on the list of "Top 101 counties with the highest percentage of residents relocating to other counties in 2011 (pop. 50,000+)"
#33 on the list of "Top 101 counties with the highest percentage of residents relocating from foreign countries between 2010 and 2011 (pop. 50,000+)"
#34 on the list of "Top 101 counties with the highest percentage of residents relocating to foreign countries in 2011 (pop. 50,000+)"
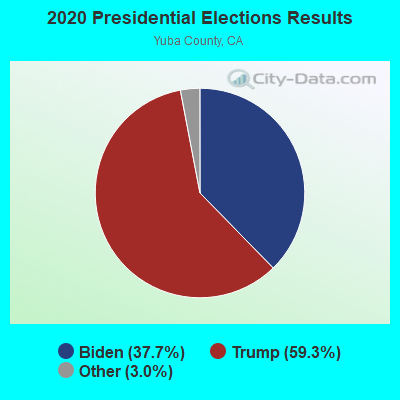
#35 on the list of "Top 101 counties with highest percentage of residents voting for 3rd party candidates in the 2012 Presidential Election (pop. 50,000+)"
#40 on the list of "Top 101 counties with the lowest surface withdrawal of fresh water for public supply (pop. 50,000+)"


 Recent articles from our blog. Our writers, many of them Ph.D. graduates or candidates, create easy-to-read articles on a wide variety of topics.


 (29.7 miles