Lisle, Illinois Submit your own pictures of this village and show them to the world
OSM Map
General Map
Google Map
MSN Map
OSM Map
General Map
Google Map
MSN Map
OSM Map
General Map
Google Map
MSN Map
OSM Map
General Map
Google Map
MSN Map
Please wait while loading the map...
Population in 2022: 23,258 (100% urban, 0% rural). Population change since 2000: +9.8%Males: 12,179 Females: 11,079
March 2022 cost of living index in Lisle: 101.8 (near average, U.S. average is 100) Percentage of residents living in poverty in 2022: 5.8%for White Non-Hispanic residents , 4.3% for Black residents , 6.2% for Hispanic or Latino residents , 1.6% for two or more races residents )
Profiles of local businesses
Business Search - 14 Million verified businesses
Data:
Median household income ($)
Median household income (% change since 2000)
Household income diversity
Ratio of average income to average house value (%)
Ratio of average income to average rent
Median household income ($) - White
Median household income ($) - Black or African American
Median household income ($) - Asian
Median household income ($) - Hispanic or Latino
Median household income ($) - American Indian and Alaska Native
Median household income ($) - Multirace
Median household income ($) - Other Race
Median household income for houses/condos with a mortgage ($)
Median household income for apartments without a mortgage ($)
Races - White alone (%)
Races - White alone (% change since 2000)
Races - Black alone (%)
Races - Black alone (% change since 2000)
Races - American Indian alone (%)
Races - American Indian alone (% change since 2000)
Races - Asian alone (%)
Races - Asian alone (% change since 2000)
Races - Hispanic (%)
Races - Hispanic (% change since 2000)
Races - Native Hawaiian and Other Pacific Islander alone (%)
Races - Native Hawaiian and Other Pacific Islander alone (% change since 2000)
Races - Two or more races (%)
Races - Two or more races (% change since 2000)
Races - Other race alone (%)
Races - Other race alone (% change since 2000)
Racial diversity
Unemployment (%)
Unemployment (% change since 2000)
Unemployment (%) - White
Unemployment (%) - Black or African American
Unemployment (%) - Asian
Unemployment (%) - Hispanic or Latino
Unemployment (%) - American Indian and Alaska Native
Unemployment (%) - Multirace
Unemployment (%) - Other Race
Population density (people per square mile)
Population - Males (%)
Population - Females (%)
Population - Males (%) - White
Population - Males (%) - Black or African American
Population - Males (%) - Asian
Population - Males (%) - Hispanic or Latino
Population - Males (%) - American Indian and Alaska Native
Population - Males (%) - Multirace
Population - Males (%) - Other Race
Population - Females (%) - White
Population - Females (%) - Black or African American
Population - Females (%) - Asian
Population - Females (%) - Hispanic or Latino
Population - Females (%) - American Indian and Alaska Native
Population - Females (%) - Multirace
Population - Females (%) - Other Race
Coronavirus confirmed cases (Apr 19, 2024)
Deaths caused by coronavirus (Apr 19, 2024)
Coronavirus confirmed cases (per 100k population) (Apr 19, 2024)
Deaths caused by coronavirus (per 100k population) (Apr 19, 2024)
Daily increase in number of cases (Apr 19, 2024)
Weekly increase in number of cases (Apr 19, 2024)
Cases doubled (in days) (Apr 19, 2024)
Hospitalized patients (Apr 18, 2022)
Negative test results (Apr 18, 2022)
Total test results (Apr 18, 2022)
COVID Vaccine doses distributed (per 100k population) (Sep 19, 2023)
COVID Vaccine doses administered (per 100k population) (Sep 19, 2023)
COVID Vaccine doses distributed (Sep 19, 2023)
COVID Vaccine doses administered (Sep 19, 2023)
Likely homosexual households (%)
Likely homosexual households (% change since 2000)
Likely homosexual households - Lesbian couples (%)
Likely homosexual households - Lesbian couples (% change since 2000)
Likely homosexual households - Gay men (%)
Likely homosexual households - Gay men (% change since 2000)
Cost of living index
Median gross rent ($)
Median contract rent ($)
Median monthly housing costs ($)
Median house or condo value ($)
Median house or condo value ($ change since 2000)
Mean house or condo value by units in structure - 1, detached ($)
Mean house or condo value by units in structure - 1, attached ($)
Mean house or condo value by units in structure - 2 ($)
Mean house or condo value by units in structure by units in structure - 3 or 4 ($)
Mean house or condo value by units in structure - 5 or more ($)
Mean house or condo value by units in structure - Boat, RV, van, etc. ($)
Mean house or condo value by units in structure - Mobile home ($)
Median house or condo value ($) - White
Median house or condo value ($) - Black or African American
Median house or condo value ($) - Asian
Median house or condo value ($) - Hispanic or Latino
Median house or condo value ($) - American Indian and Alaska Native
Median house or condo value ($) - Multirace
Median house or condo value ($) - Other Race
Median resident age
Resident age diversity
Median resident age - Males
Median resident age - Females
Median resident age - White
Median resident age - Black or African American
Median resident age - Asian
Median resident age - Hispanic or Latino
Median resident age - American Indian and Alaska Native
Median resident age - Multirace
Median resident age - Other Race
Median resident age - Males - White
Median resident age - Males - Black or African American
Median resident age - Males - Asian
Median resident age - Males - Hispanic or Latino
Median resident age - Males - American Indian and Alaska Native
Median resident age - Males - Multirace
Median resident age - Males - Other Race
Median resident age - Females - White
Median resident age - Females - Black or African American
Median resident age - Females - Asian
Median resident age - Females - Hispanic or Latino
Median resident age - Females - American Indian and Alaska Native
Median resident age - Females - Multirace
Median resident age - Females - Other Race
Commute - mean travel time to work (minutes)
Travel time to work - Less than 5 minutes (%)
Travel time to work - Less than 5 minutes (% change since 2000)
Travel time to work - 5 to 9 minutes (%)
Travel time to work - 5 to 9 minutes (% change since 2000)
Travel time to work - 10 to 19 minutes (%)
Travel time to work - 10 to 19 minutes (% change since 2000)
Travel time to work - 20 to 29 minutes (%)
Travel time to work - 20 to 29 minutes (% change since 2000)
Travel time to work - 30 to 39 minutes (%)
Travel time to work - 30 to 39 minutes (% change since 2000)
Travel time to work - 40 to 59 minutes (%)
Travel time to work - 40 to 59 minutes (% change since 2000)
Travel time to work - 60 to 89 minutes (%)
Travel time to work - 60 to 89 minutes (% change since 2000)
Travel time to work - 90 or more minutes (%)
Travel time to work - 90 or more minutes (% change since 2000)
Marital status - Never married (%)
Marital status - Now married (%)
Marital status - Separated (%)
Marital status - Widowed (%)
Marital status - Divorced (%)
Median family income ($)
Median family income (% change since 2000)
Median non-family income ($)
Median non-family income (% change since 2000)
Median per capita income ($)
Median per capita income (% change since 2000)
Median family income ($) - White
Median family income ($) - Black or African American
Median family income ($) - Asian
Median family income ($) - Hispanic or Latino
Median family income ($) - American Indian and Alaska Native
Median family income ($) - Multirace
Median family income ($) - Other Race
Median year house/condo built
Median year apartment built
Year house built - Built 2005 or later (%)
Year house built - Built 2000 to 2004 (%)
Year house built - Built 1990 to 1999 (%)
Year house built - Built 1980 to 1989 (%)
Year house built - Built 1970 to 1979 (%)
Year house built - Built 1960 to 1969 (%)
Year house built - Built 1950 to 1959 (%)
Year house built - Built 1940 to 1949 (%)
Year house built - Built 1939 or earlier (%)
Average household size
Household density (households per square mile)
Average household size - White
Average household size - Black or African American
Average household size - Asian
Average household size - Hispanic or Latino
Average household size - American Indian and Alaska Native
Average household size - Multirace
Average household size - Other Race
Occupied housing units (%)
Vacant housing units (%)
Owner occupied housing units (%)
Renter occupied housing units (%)
Vacancy status - For rent (%)
Vacancy status - For sale only (%)
Vacancy status - Rented or sold, not occupied (%)
Vacancy status - For seasonal, recreational, or occasional use (%)
Vacancy status - For migrant workers (%)
Vacancy status - Other vacant (%)
Residents with income below the poverty level (%)
Residents with income below 50% of the poverty level (%)
Children below poverty level (%)
Poor families by family type - Married-couple family (%)
Poor families by family type - Male, no wife present (%)
Poor families by family type - Female, no husband present (%)
Poverty status for native-born residents (%)
Poverty status for foreign-born residents (%)
Poverty among high school graduates not in families (%)
Poverty among people who did not graduate high school not in families (%)
Residents with income below the poverty level (%) - White
Residents with income below the poverty level (%) - Black or African American
Residents with income below the poverty level (%) - Asian
Residents with income below the poverty level (%) - Hispanic or Latino
Residents with income below the poverty level (%) - American Indian and Alaska Native
Residents with income below the poverty level (%) - Multirace
Residents with income below the poverty level (%) - Other Race
Air pollution - Air Quality Index (AQI)
Air pollution - CO
Air pollution - NO2
Air pollution - SO2
Air pollution - Ozone
Air pollution - PM10
Air pollution - PM25
Air pollution - Pb
Crime - Murders per 100,000 population
Crime - Rapes per 100,000 population
Crime - Robberies per 100,000 population
Crime - Assaults per 100,000 population
Crime - Burglaries per 100,000 population
Crime - Thefts per 100,000 population
Crime - Auto thefts per 100,000 population
Crime - Arson per 100,000 population
Crime - City-data.com crime index
Crime - Violent crime index
Crime - Property crime index
Crime - Murders per 100,000 population (5 year average)
Crime - Rapes per 100,000 population (5 year average)
Crime - Robberies per 100,000 population (5 year average)
Crime - Assaults per 100,000 population (5 year average)
Crime - Burglaries per 100,000 population (5 year average)
Crime - Thefts per 100,000 population (5 year average)
Crime - Auto thefts per 100,000 population (5 year average)
Crime - Arson per 100,000 population (5 year average)
Crime - City-data.com crime index (5 year average)
Crime - Violent crime index (5 year average)
Crime - Property crime index (5 year average)
1996 Presidential Elections Results (%) - Democratic Party (Clinton)
1996 Presidential Elections Results (%) - Republican Party (Dole)
1996 Presidential Elections Results (%) - Other
2000 Presidential Elections Results (%) - Democratic Party (Gore)
2000 Presidential Elections Results (%) - Republican Party (Bush)
2000 Presidential Elections Results (%) - Other
2004 Presidential Elections Results (%) - Democratic Party (Kerry)
2004 Presidential Elections Results (%) - Republican Party (Bush)
2004 Presidential Elections Results (%) - Other
2008 Presidential Elections Results (%) - Democratic Party (Obama)
2008 Presidential Elections Results (%) - Republican Party (McCain)
2008 Presidential Elections Results (%) - Other
2012 Presidential Elections Results (%) - Democratic Party (Obama)
2012 Presidential Elections Results (%) - Republican Party (Romney)
2012 Presidential Elections Results (%) - Other
2016 Presidential Elections Results (%) - Democratic Party (Clinton)
2016 Presidential Elections Results (%) - Republican Party (Trump)
2016 Presidential Elections Results (%) - Other
2020 Presidential Elections Results (%) - Democratic Party (Biden)
2020 Presidential Elections Results (%) - Republican Party (Trump)
2020 Presidential Elections Results (%) - Other
Ancestries Reported - Arab (%)
Ancestries Reported - Czech (%)
Ancestries Reported - Danish (%)
Ancestries Reported - Dutch (%)
Ancestries Reported - English (%)
Ancestries Reported - French (%)
Ancestries Reported - French Canadian (%)
Ancestries Reported - German (%)
Ancestries Reported - Greek (%)
Ancestries Reported - Hungarian (%)
Ancestries Reported - Irish (%)
Ancestries Reported - Italian (%)
Ancestries Reported - Lithuanian (%)
Ancestries Reported - Norwegian (%)
Ancestries Reported - Polish (%)
Ancestries Reported - Portuguese (%)
Ancestries Reported - Russian (%)
Ancestries Reported - Scotch-Irish (%)
Ancestries Reported - Scottish (%)
Ancestries Reported - Slovak (%)
Ancestries Reported - Subsaharan African (%)
Ancestries Reported - Swedish (%)
Ancestries Reported - Swiss (%)
Ancestries Reported - Ukrainian (%)
Ancestries Reported - United States (%)
Ancestries Reported - Welsh (%)
Ancestries Reported - West Indian (%)
Ancestries Reported - Other (%)
Educational Attainment - No schooling completed (%)
Educational Attainment - Less than high school (%)
Educational Attainment - High school or equivalent (%)
Educational Attainment - Less than 1 year of college (%)
Educational Attainment - 1 or more years of college (%)
Educational Attainment - Associate degree (%)
Educational Attainment - Bachelor's degree (%)
Educational Attainment - Master's degree (%)
Educational Attainment - Professional school degree (%)
Educational Attainment - Doctorate degree (%)
School Enrollment - Nursery, preschool (%)
School Enrollment - Kindergarten (%)
School Enrollment - Grade 1 to 4 (%)
School Enrollment - Grade 5 to 8 (%)
School Enrollment - Grade 9 to 12 (%)
School Enrollment - College undergrad (%)
School Enrollment - Graduate or professional (%)
School Enrollment - Not enrolled in school (%)
School enrollment - Public schools (%)
School enrollment - Private schools (%)
School enrollment - Not enrolled (%)
Median number of rooms in houses and condos
Median number of rooms in apartments
Housing units lacking complete plumbing facilities (%)
Housing units lacking complete kitchen facilities (%)
Density of houses
Urban houses (%)
Rural houses (%)
Households with people 60 years and over (%)
Households with people 65 years and over (%)
Households with people 75 years and over (%)
Households with one or more nonrelatives (%)
Households with no nonrelatives (%)
Population in households (%)
Family households (%)
Nonfamily households (%)
Population in families (%)
Family households with own children (%)
Median number of bedrooms in owner occupied houses
Mean number of bedrooms in owner occupied houses
Median number of bedrooms in renter occupied houses
Mean number of bedrooms in renter occupied houses
Median number of vehichles in owner occupied houses
Mean number of vehichles in owner occupied houses
Median number of vehichles in renter occupied houses
Mean number of vehichles in renter occupied houses
Mortgage status - with mortgage (%)
Mortgage status - with second mortgage (%)
Mortgage status - with home equity loan (%)
Mortgage status - with both second mortgage and home equity loan (%)
Mortgage status - without a mortgage (%)
Average family size
Average family size - White
Average family size - Black or African American
Average family size - Asian
Average family size - Hispanic or Latino
Average family size - American Indian and Alaska Native
Average family size - Multirace
Average family size - Other Race
Geographical mobility - Same house 1 year ago (%)
Geographical mobility - Moved within same county (%)
Geographical mobility - Moved from different county within same state (%)
Geographical mobility - Moved from different state (%)
Geographical mobility - Moved from abroad (%)
Place of birth - Born in state of residence (%)
Place of birth - Born in other state (%)
Place of birth - Native, outside of US (%)
Place of birth - Foreign born (%)
Housing units in structures - 1, detached (%)
Housing units in structures - 1, attached (%)
Housing units in structures - 2 (%)
Housing units in structures - 3 or 4 (%)
Housing units in structures - 5 to 9 (%)
Housing units in structures - 10 to 19 (%)
Housing units in structures - 20 to 49 (%)
Housing units in structures - 50 or more (%)
Housing units in structures - Mobile home (%)
Housing units in structures - Boat, RV, van, etc. (%)
House/condo owner moved in on average (years ago)
Renter moved in on average (years ago)
Year householder moved into unit - Moved in 1999 to March 2000 (%)
Year householder moved into unit - Moved in 1995 to 1998 (%)
Year householder moved into unit - Moved in 1990 to 1994 (%)
Year householder moved into unit - Moved in 1980 to 1989 (%)
Year householder moved into unit - Moved in 1970 to 1979 (%)
Year householder moved into unit - Moved in 1969 or earlier (%)
Means of transportation to work - Drove car alone (%)
Means of transportation to work - Carpooled (%)
Means of transportation to work - Public transportation (%)
Means of transportation to work - Bus or trolley bus (%)
Means of transportation to work - Streetcar or trolley car (%)
Means of transportation to work - Subway or elevated (%)
Means of transportation to work - Railroad (%)
Means of transportation to work - Ferryboat (%)
Means of transportation to work - Taxicab (%)
Means of transportation to work - Motorcycle (%)
Means of transportation to work - Bicycle (%)
Means of transportation to work - Walked (%)
Means of transportation to work - Other means (%)
Working at home (%)
Industry diversity
Most Common Industries - Agriculture, forestry, fishing and hunting, and mining (%)
Most Common Industries - Agriculture, forestry, fishing and hunting (%)
Most Common Industries - Mining, quarrying, and oil and gas extraction (%)
Most Common Industries - Construction (%)
Most Common Industries - Manufacturing (%)
Most Common Industries - Wholesale trade (%)
Most Common Industries - Retail trade (%)
Most Common Industries - Transportation and warehousing, and utilities (%)
Most Common Industries - Transportation and warehousing (%)
Most Common Industries - Utilities (%)
Most Common Industries - Information (%)
Most Common Industries - Finance and insurance, and real estate and rental and leasing (%)
Most Common Industries - Finance and insurance (%)
Most Common Industries - Real estate and rental and leasing (%)
Most Common Industries - Professional, scientific, and management, and administrative and waste management services (%)
Most Common Industries - Professional, scientific, and technical services (%)
Most Common Industries - Management of companies and enterprises (%)
Most Common Industries - Administrative and support and waste management services (%)
Most Common Industries - Educational services, and health care and social assistance (%)
Most Common Industries - Educational services (%)
Most Common Industries - Health care and social assistance (%)
Most Common Industries - Arts, entertainment, and recreation, and accommodation and food services (%)
Most Common Industries - Arts, entertainment, and recreation (%)
Most Common Industries - Accommodation and food services (%)
Most Common Industries - Other services, except public administration (%)
Most Common Industries - Public administration (%)
Occupation diversity
Most Common Occupations - Management, business, science, and arts occupations (%)
Most Common Occupations - Management, business, and financial occupations (%)
Most Common Occupations - Management occupations (%)
Most Common Occupations - Business and financial operations occupations (%)
Most Common Occupations - Computer, engineering, and science occupations (%)
Most Common Occupations - Computer and mathematical occupations (%)
Most Common Occupations - Architecture and engineering occupations (%)
Most Common Occupations - Life, physical, and social science occupations (%)
Most Common Occupations - Education, legal, community service, arts, and media occupations (%)
Most Common Occupations - Community and social service occupations (%)
Most Common Occupations - Legal occupations (%)
Most Common Occupations - Education, training, and library occupations (%)
Most Common Occupations - Arts, design, entertainment, sports, and media occupations (%)
Most Common Occupations - Healthcare practitioners and technical occupations (%)
Most Common Occupations - Health diagnosing and treating practitioners and other technical occupations (%)
Most Common Occupations - Health technologists and technicians (%)
Most Common Occupations - Service occupations (%)
Most Common Occupations - Healthcare support occupations (%)
Most Common Occupations - Protective service occupations (%)
Most Common Occupations - Fire fighting and prevention, and other protective service workers including supervisors (%)
Most Common Occupations - Law enforcement workers including supervisors (%)
Most Common Occupations - Food preparation and serving related occupations (%)
Most Common Occupations - Building and grounds cleaning and maintenance occupations (%)
Most Common Occupations - Personal care and service occupations (%)
Most Common Occupations - Sales and office occupations (%)
Most Common Occupations - Sales and related occupations (%)
Most Common Occupations - Office and administrative support occupations (%)
Most Common Occupations - Natural resources, construction, and maintenance occupations (%)
Most Common Occupations - Farming, fishing, and forestry occupations (%)
Most Common Occupations - Construction and extraction occupations (%)
Most Common Occupations - Installation, maintenance, and repair occupations (%)
Most Common Occupations - Production, transportation, and material moving occupations (%)
Most Common Occupations - Production occupations (%)
Most Common Occupations - Transportation occupations (%)
Most Common Occupations - Material moving occupations (%)
People in Group quarters - Institutionalized population (%)
People in Group quarters - Correctional institutions (%)
People in Group quarters - Federal prisons and detention centers (%)
People in Group quarters - Halfway houses (%)
People in Group quarters - Local jails and other confinement facilities (including police lockups) (%)
People in Group quarters - Military disciplinary barracks (%)
People in Group quarters - State prisons (%)
People in Group quarters - Other types of correctional institutions (%)
People in Group quarters - Nursing homes (%)
People in Group quarters - Hospitals/wards, hospices, and schools for the handicapped (%)
People in Group quarters - Hospitals/wards and hospices for chronically ill (%)
People in Group quarters - Hospices or homes for chronically ill (%)
People in Group quarters - Military hospitals or wards for chronically ill (%)
People in Group quarters - Other hospitals or wards for chronically ill (%)
People in Group quarters - Hospitals or wards for drug/alcohol abuse (%)
People in Group quarters - Mental (Psychiatric) hospitals or wards (%)
People in Group quarters - Schools, hospitals, or wards for the mentally retarded (%)
People in Group quarters - Schools, hospitals, or wards for the physically handicapped (%)
People in Group quarters - Institutions for the deaf (%)
People in Group quarters - Institutions for the blind (%)
People in Group quarters - Orthopedic wards and institutions for the physically handicapped (%)
People in Group quarters - Wards in general hospitals for patients who have no usual home elsewhere (%)
People in Group quarters - Wards in military hospitals for patients who have no usual home elsewhere (%)
People in Group quarters - Juvenile institutions (%)
People in Group quarters - Long-term care (%)
People in Group quarters - Homes for abused, dependent, and neglected children (%)
People in Group quarters - Residential treatment centers for emotionally disturbed children (%)
People in Group quarters - Training schools for juvenile delinquents (%)
People in Group quarters - Short-term care, detention or diagnostic centers for delinquent children (%)
People in Group quarters - Type of juvenile institution unknown (%)
People in Group quarters - Noninstitutionalized population (%)
People in Group quarters - College dormitories (includes college quarters off campus) (%)
People in Group quarters - Military quarters (%)
People in Group quarters - On base (%)
People in Group quarters - Barracks, unaccompanied personnel housing (UPH), (Enlisted/Officer), ;and similar group living quarters for military personnel (%)
People in Group quarters - Transient quarters for temporary residents (%)
People in Group quarters - Military ships (%)
People in Group quarters - Group homes (%)
People in Group quarters - Homes or halfway houses for drug/alcohol abuse (%)
People in Group quarters - Homes for the mentally ill (%)
People in Group quarters - Homes for the mentally retarded (%)
People in Group quarters - Homes for the physically handicapped (%)
People in Group quarters - Other group homes (%)
People in Group quarters - Religious group quarters (%)
People in Group quarters - Dormitories (%)
People in Group quarters - Agriculture workers' dormitories on farms (%)
People in Group quarters - Job Corps and vocational training facilities (%)
People in Group quarters - Other workers' dormitories (%)
People in Group quarters - Crews of maritime vessels (%)
People in Group quarters - Other nonhousehold living situations (%)
People in Group quarters - Other noninstitutional group quarters (%)
Residents speaking English at home (%)
Residents speaking English at home - Born in the United States (%)
Residents speaking English at home - Native, born elsewhere (%)
Residents speaking English at home - Foreign born (%)
Residents speaking Spanish at home (%)
Residents speaking Spanish at home - Born in the United States (%)
Residents speaking Spanish at home - Native, born elsewhere (%)
Residents speaking Spanish at home - Foreign born (%)
Residents speaking other language at home (%)
Residents speaking other language at home - Born in the United States (%)
Residents speaking other language at home - Native, born elsewhere (%)
Residents speaking other language at home - Foreign born (%)
Class of Workers - Employee of private company (%)
Class of Workers - Self-employed in own incorporated business (%)
Class of Workers - Private not-for-profit wage and salary workers (%)
Class of Workers - Local government workers (%)
Class of Workers - State government workers (%)
Class of Workers - Federal government workers (%)
Class of Workers - Self-employed workers in own not incorporated business and Unpaid family workers (%)
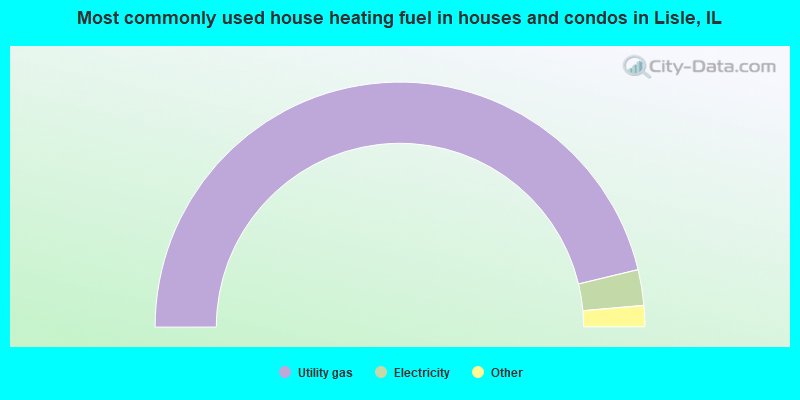
House heating fuel used in houses and condos - Utility gas (%)
House heating fuel used in houses and condos - Bottled, tank, or LP gas (%)
House heating fuel used in houses and condos - Electricity (%)
House heating fuel used in houses and condos - Fuel oil, kerosene, etc. (%)
House heating fuel used in houses and condos - Coal or coke (%)
House heating fuel used in houses and condos - Wood (%)
House heating fuel used in houses and condos - Solar energy (%)
House heating fuel used in houses and condos - Other fuel (%)
House heating fuel used in houses and condos - No fuel used (%)
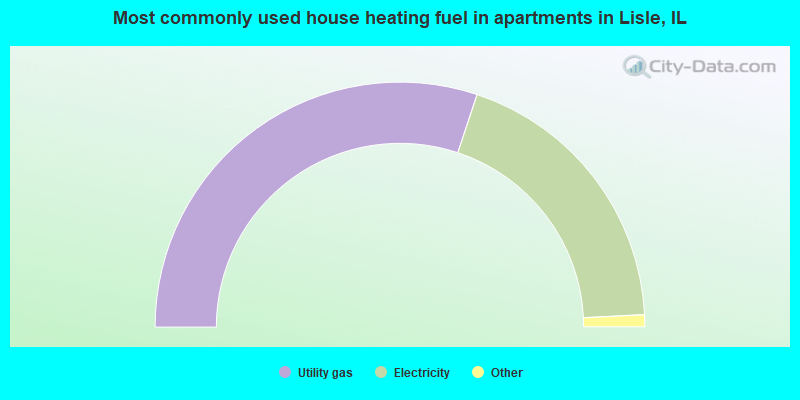
House heating fuel used in apartments - Utility gas (%)
House heating fuel used in apartments - Bottled, tank, or LP gas (%)
House heating fuel used in apartments - Electricity (%)
House heating fuel used in apartments - Fuel oil, kerosene, etc. (%)
House heating fuel used in apartments - Coal or coke (%)
House heating fuel used in apartments - Wood (%)
House heating fuel used in apartments - Solar energy (%)
House heating fuel used in apartments - Other fuel (%)
House heating fuel used in apartments - No fuel used (%)
Armed forces status - In Armed Forces (%)
Armed forces status - Civilian (%)
Armed forces status - Civilian - Veteran (%)
Armed forces status - Civilian - Nonveteran (%)
Fatal accidents locations in years 2005-2021
Fatal accidents locations in 2005
Fatal accidents locations in 2006
Fatal accidents locations in 2007
Fatal accidents locations in 2008
Fatal accidents locations in 2009
Fatal accidents locations in 2010
Fatal accidents locations in 2011
Fatal accidents locations in 2012
Fatal accidents locations in 2013
Fatal accidents locations in 2014
Fatal accidents locations in 2015
Fatal accidents locations in 2016
Fatal accidents locations in 2017
Fatal accidents locations in 2018
Fatal accidents locations in 2019
Fatal accidents locations in 2020
Fatal accidents locations in 2021
Alcohol use - People drinking some alcohol every month (%)
Alcohol use - People not drinking at all (%)
Alcohol use - Average days/month drinking alcohol
Alcohol use - Average drinks/week
Alcohol use - Average days/year people drink much
Audiometry - Average condition of hearing (%)
Audiometry - People that can hear a whisper from across a quiet room (%)
Audiometry - People that can hear normal voice from across a quiet room (%)
Audiometry - Ears ringing, roaring, buzzing (%)
Audiometry - Had a job exposure to loud noise (%)
Audiometry - Had off-work exposure to loud noise (%)
Blood Pressure & Cholesterol - Has high blood pressure (%)
Blood Pressure & Cholesterol - Checking blood pressure at home (%)
Blood Pressure & Cholesterol - Frequently checking blood cholesterol (%)
Blood Pressure & Cholesterol - Has high cholesterol level (%)
Consumer Behavior - Money monthly spent on food at supermarket/grocery store
Consumer Behavior - Money monthly spent on food at other stores
Consumer Behavior - Money monthly spent on eating out
Consumer Behavior - Money monthly spent on carryout/delivered foods
Consumer Behavior - Income spent on food at supermarket/grocery store (%)
Consumer Behavior - Income spent on food at other stores (%)
Consumer Behavior - Income spent on eating out (%)
Consumer Behavior - Income spent on carryout/delivered foods (%)
Current Health Status - General health condition (%)
Current Health Status - Blood donors (%)
Current Health Status - Has blood ever tested for HIV virus (%)
Current Health Status - Left-handed people (%)
Dermatology - People using sunscreen (%)
Diabetes - Diabetics (%)
Diabetes - Had a blood test for high blood sugar (%)
Diabetes - People taking insulin (%)
Diet Behavior & Nutrition - Diet health (%)
Diet Behavior & Nutrition - Milk product consumption (# of products/month)
Diet Behavior & Nutrition - Meals not home prepared (#/week)
Diet Behavior & Nutrition - Meals from fast food or pizza place (#/week)
Diet Behavior & Nutrition - Ready-to-eat foods (#/month)
Diet Behavior & Nutrition - Frozen meals/pizza (#/month)
Drug Use - People that ever used marijuana or hashish (%)
Drug Use - Ever used hard drugs (%)
Drug Use - Ever used any form of cocaine (%)
Drug Use - Ever used heroin (%)
Drug Use - Ever used methamphetamine (%)
Health Insurance - People covered by health insurance (%)
Kidney Conditions-Urology - Avg. # of times urinating at night
Medical Conditions - People with asthma (%)
Medical Conditions - People with anemia (%)
Medical Conditions - People with psoriasis (%)
Medical Conditions - People with overweight (%)
Medical Conditions - Elderly people having difficulties in thinking or remembering (%)
Medical Conditions - People who ever received blood transfusion (%)
Medical Conditions - People having trouble seeing even with glass/contacts (%)
Medical Conditions - People with arthritis (%)
Medical Conditions - People with gout (%)
Medical Conditions - People with congestive heart failure (%)
Medical Conditions - People with coronary heart disease (%)
Medical Conditions - People with angina pectoris (%)
Medical Conditions - People who ever had heart attack (%)
Medical Conditions - People who ever had stroke (%)
Medical Conditions - People with emphysema (%)
Medical Conditions - People with thyroid problem (%)
Medical Conditions - People with chronic bronchitis (%)
Medical Conditions - People with any liver condition (%)
Medical Conditions - People who ever had cancer or malignancy (%)
Mental Health - People who have little interest in doing things (%)
Mental Health - People feeling down, depressed, or hopeless (%)
Mental Health - People who have trouble sleeping or sleeping too much (%)
Mental Health - People feeling tired or having little energy (%)
Mental Health - People with poor appetite or overeating (%)
Mental Health - People feeling bad about themself (%)
Mental Health - People who have trouble concentrating on things (%)
Mental Health - People moving or speaking slowly or too fast (%)
Mental Health - People having thoughts they would be better off dead (%)
Oral Health - Average years since last visit a dentist
Oral Health - People embarrassed because of mouth (%)
Oral Health - People with gum disease (%)
Oral Health - General health of teeth and gums (%)
Oral Health - Average days a week using dental floss/device
Oral Health - Average days a week using mouthwash for dental problem
Oral Health - Average number of teeth
Pesticide Use - Households using pesticides to control insects (%)
Pesticide Use - Households using pesticides to kill weeds (%)
Physical Activity - People doing vigorous-intensity work activities (%)
Physical Activity - People doing moderate-intensity work activities (%)
Physical Activity - People walking or bicycling (%)
Physical Activity - People doing vigorous-intensity recreational activities (%)
Physical Activity - People doing moderate-intensity recreational activities (%)
Physical Activity - Average hours a day doing sedentary activities
Physical Activity - Average hours a day watching TV or videos
Physical Activity - Average hours a day using computer
Physical Functioning - People having limitations keeping them from working (%)
Physical Functioning - People limited in amount of work they can do (%)
Physical Functioning - People that need special equipment to walk (%)
Physical Functioning - People experiencing confusion/memory problems (%)
Physical Functioning - People requiring special healthcare equipment (%)
Prescription Medications - Average number of prescription medicines taking
Preventive Aspirin Use - Adults 40+ taking low-dose aspirin (%)
Reproductive Health - Vaginal deliveries (%)
Reproductive Health - Cesarean deliveries (%)
Reproductive Health - Deliveries resulted in a live birth (%)
Reproductive Health - Pregnancies resulted in a delivery (%)
Reproductive Health - Women breastfeeding newborns (%)
Reproductive Health - Women that had a hysterectomy (%)
Reproductive Health - Women that had both ovaries removed (%)
Reproductive Health - Women that have ever taken birth control pills (%)
Reproductive Health - Women taking birth control pills (%)
Reproductive Health - Women that have ever used Depo-Provera or injectables (%)
Reproductive Health - Women that have ever used female hormones (%)
Sexual Behavior - People 18+ that ever had sex (vaginal, anal, or oral) (%)
Sexual Behavior - Males 18+ that ever had vaginal sex with a woman (%)
Sexual Behavior - Males 18+ that ever performed oral sex on a woman (%)
Sexual Behavior - Males 18+ that ever had anal sex with a woman (%)
Sexual Behavior - Males 18+ that ever had any sex with a man (%)
Sexual Behavior - Females 18+ that ever had vaginal sex with a man (%)
Sexual Behavior - Females 18+ that ever performed oral sex on a man (%)
Sexual Behavior - Females 18+ that ever had anal sex with a man (%)
Sexual Behavior - Females 18+ that ever had any kind of sex with a woman (%)
Sexual Behavior - Average age people first had sex
Sexual Behavior - Average number of female sex partners in lifetime (males 18+)
Sexual Behavior - Average number of female vaginal sex partners in lifetime (males 18+)
Sexual Behavior - Average age people first performed oral sex on a woman (18+)
Sexual Behavior - Average number of woman performed oral sex on in lifetime (18+)
Sexual Behavior - Average number of male sex partners in lifetime (males 18+)
Sexual Behavior - Average number of male anal sex partners in lifetime (males 18+)
Sexual Behavior - Average age people first performed oral sex on a man (18+)
Sexual Behavior - Average number of male oral sex partners in lifetime (18+)
Sexual Behavior - People using protection when performing oral sex (%)
Sexual Behavior - Average number of times people have vaginal or anal sex a year
Sexual Behavior - People having sex without condom (%)
Sexual Behavior - Average number of male sex partners in lifetime (females 18+)
Sexual Behavior - Average number of male vaginal sex partners in lifetime (females 18+)
Sexual Behavior - Average number of female sex partners in lifetime (females 18+)
Sexual Behavior - Circumcised males 18+ (%)
Sleep Disorders - Average hours sleeping at night
Sleep Disorders - People that has trouble sleeping (%)
Smoking-Cigarette Use - People smoking cigarettes (%)
Taste & Smell - People 40+ having problems with smell (%)
Taste & Smell - People 40+ having problems with taste (%)
Taste & Smell - People 40+ that ever had wisdom teeth removed (%)
Taste & Smell - People 40+ that ever had tonsils teeth removed (%)
Taste & Smell - People 40+ that ever had a loss of consciousness because of a head injury (%)
Taste & Smell - People 40+ that ever had a broken nose or other serious injury to face or skull (%)
Taste & Smell - People 40+ that ever had two or more sinus infections (%)
Weight - Average height (inches)
Weight - Average weight (pounds)
Weight - Average BMI
Weight - People that are obese (%)
Weight - People that ever were obese (%)
Weight - People trying to lose weight (%)
According to our research of Illinois and other state lists, there were 16 registered sex offenders living in Lisle, Illinois as of April 19, 2024 . The ratio of all residents to sex offenders in Lisle is 1,435 to 1.The ratio of registered sex offenders to all residents in this city is lower than the state average.
Officers per 1,000 residents here:
1.51Illinois average:
2.84
Latest news from Lisle, IL collected exclusively by city-data.com from local newspapers, TV, and radio stations
Ancestries: Italian (7.5%), Polish (7.5%), German (7.1%), Irish (6.1%), American (4.2%), European (4.1%).
Current Local Time:
Incorporated on 09/07/1956
Land area: 6.37 square miles.
Population density: 3,649 people per square mile (average).
3,817 residents are foreign born (10.7% Asia , 3.1% Europe ).
This village:
16.4%Illinois:
14.1%
Median real estate property taxes paid for housing units with mortgages in 2022: $9,275 (2.2%)Median real estate property taxes paid for housing units with no mortgage in 2022: $6,733 (1.9%)
Nearest city with pop. 50,000+: Naperville, IL
Nearest city with pop. 200,000+: Chicago, IL
Nearest cities:
Latitude: 41.79 N, Longitude: 88.09 W
Daytime population change due to commuting: +9,652 (+41.5%)Workers who live and work in this village: 3,922 (31.2%)
Area code commonly used in this area: 630
Lisle tourist attractions:
Single-family new house construction building permits:
2022: 2 buildings , average cost: $1,021,3002021: 3 buildings , average cost: $440,0002020: 5 buildings , average cost: $379,0002019: 7 buildings , average cost: $359,3002018: 19 buildings , average cost: $132,7002017: 35 buildings , average cost: $215,0002016: 12 buildings , average cost: $419,2002015: 51 buildings , average cost: $228,1002014: 93 buildings , average cost: $210,7002013: 55 buildings , average cost: $203,9002012: 9 buildings , average cost: $259,4002011: 10 buildings , average cost: $306,0002010: 6 buildings , average cost: $391,7002009: 2 buildings , average cost: $643,5002008: 8 buildings , average cost: $379,7002007: 28 buildings , average cost: $297,5002006: 36 buildings , average cost: $258,1002005: 46 buildings , average cost: $280,8002004: 98 buildings , average cost: $177,2002003: 67 buildings , average cost: $189,5002002: 44 buildings , average cost: $191,0002001: 144 buildings , average cost: $180,2002000: 137 buildings , average cost: $184,8001999: 45 buildings , average cost: $151,4001998: 103 buildings , average cost: $143,8001997: 98 buildings , average cost: $136,700Unemployment in December 2023:
Population change in the 1990s: +1,473 (+7.5%).
Most common occupations in Lisle, IL (%)
Both Males Females
Computer specialists (8.3%)
Sales representatives, services, wholesale and manufacturing (4.9%)
Other management occupations, except farmers and farm managers (4.7%)
Other sales and related occupations, including supervisors (3.8%)
Retail sales workers, except cashiers (3.7%)
Engineers (3.7%)
Secretaries and administrative assistants (3.5%)
Computer specialists (11.6%)
Sales representatives, services, wholesale and manufacturing (5.9%)
Engineers (5.5%)
Top executives (4.6%)
Retail sales workers, except cashiers (4.5%)
Other management occupations, except farmers and farm managers (4.4%)
Operations specialties managers, except financial managers (4.4%)
Secretaries and administrative assistants (7.2%)
Registered nurses (5.1%)
Other management occupations, except farmers and farm managers (4.9%)
Preschool, kindergarten, elementary, and middle school teachers (4.4%)
Computer specialists (4.4%)
Other office and administrative support workers, including supervisors (4.3%)
Other sales and related occupations, including supervisors (3.7%)
Tornado activity:
Lisle-area historical tornado activity is near Illinois state average. It is 51% greater than the overall U.S. average.
On 8/28/1990, a category F5 (max. wind speeds 261-318 mph) tornado 15.6 miles away from the Lisle village center killed 29 people and injured 350 people and caused between $50,000 and $500,000 in damages.
On 6/13/1976, a category F4 (max. wind speeds 207-260 mph) tornado 9.6 miles away from the village center killed 2 people and injured 23 people and caused between $500,000 and $5,000,000 in damages.
Earthquake activity:
Lisle-area historical earthquake activity is significantly above Illinois state average. It is 48% greater than the overall U.S. average. On 4/18/2008 at 09:36:59, a magnitude 5.4 (5.1 MB, 4.8 MS, 5.4 MW, 5.2 MW, Class: Moderate, Intensity: VI - VII) earthquake occurred 231.3 miles away from Lisle center On 6/10/1987 at 23:48:54, a magnitude 5.1 (4.9 MB, 4.4 MS, 4.6 MS, 5.1 LG) earthquake occurred 205.8 miles away from the city center On 4/18/2008 at 09:36:59, a magnitude 5.2 (5.2 MW, Depth: 8.9 mi) earthquake occurred 231.3 miles away from Lisle center On 6/28/2004 at 06:10:52, a magnitude 4.2 (4.2 MW, Depth: 6.2 mi, Class: Light, Intensity: IV - V) earthquake occurred 47.9 miles away from Lisle center On 2/10/2010 at 09:59:35, a magnitude 3.8 (3.8 MW, Depth: 6.2 mi, Class: Light, Intensity: II - III) earthquake occurred 24.4 miles away from the city center On 6/18/2002 at 17:37:15, a magnitude 5.0 (4.3 MB, 4.6 MW, 5.0 LG) earthquake occurred 263.7 miles away from the city center Magnitude types: regional Lg-wave magnitude (LG), body-wave magnitude (MB), surface-wave magnitude (MS), moment magnitude (MW) Natural disasters: The number of natural disasters in DuPage County (15) is near the US average (15).Major Disasters (Presidential) Declared: 10Emergencies Declared: 4Floods: 8, Storms: 8, Snowstorms: 2, Tornadoes: 2, Winter Storms: 2, Blizzard: 1, Hurricane: 1, Snow: 1, Wind: 1, Other: 1 (Note: some incidents may be assigned to more than one category). Main business address for: MOLEX INC ELECTRONIC CONNECTORS ).
Hospitals and medical centers in Lisle: ACCUCARE HOME HEALTH SERVICES, INC (1027 OGDEN AVENUE)
MEDIC HOME HEALTH CARE, LLC (906 LACEY AVENUE, SUITE 109)
VITALITY HEALTHCARE, INC (4513 LINCOLN AVENUE, STE 112)
SNOW VALLEY NRSG AND REHAB CTR (5000 LINCOLN AVENUE)
WESTBURY CARE CENTER (1800 ROBIN LANE)
Amtrak stations near Lisle: 4 miles: NAPERVILLE (E. 4TH & ELLSWORTH AVE.) Services: ticket office, partially wheelchair accessible, enclosed waiting area, public restrooms, public payphones, free short-term parking, free long-term parking, call for taxi service, public transit connection.
12 miles: LA GRANGE ROAD (LA GRANGE, 25 W. BURLINGTON AVE.) Services: enclosed waiting area, public payphones, taxi stand, public transit connection.
15 miles: SUMMIT (ARCHER & CENTER AVE.) Services: public payphones, free short-term parking, free long-term parking, call for taxi service, public transit connection.
Colleges/Universities in Lisle: Benedictine University Full-time enrollment: 5,694; Location: 5700 College Rd; Private, not-for-profit; Website: www.ben.edu; Offers Doctor's degree )
Empire Beauty School-Lisle Full-time enrollment: 125; Location: 2709 Maple Avenue; Private, for-profit; Website: www.empire.edu)
Other colleges/universities with over 2000 students near Lisle:
North Central College (about 4 miles; Naperville, IL ; Full-time enrollment: 2,860)
College of DuPage (about 4 miles; Glen Ellyn, IL ; FT enrollment: 18,910)
Wheaton College (about 6 miles; Wheaton, IL ; FT enrollment: 2,948)
Universal Technical Institute of Illinois Inc (about 10 miles; Glendale Heights, IL ; FT enrollment: 2,281)
Elmhurst College (about 11 miles; Elmhurst, IL ; FT enrollment: 3,364)
Chamberlain College of Nursing-Illinois (about 12 miles; Addison, IL ; FT enrollment: 8,977)
Lewis University (about 13 miles; Romeoville, IL ; FT enrollment: 5,739)
Public high school in Lisle:
Private high schools in Lisle: BENET ACADEMY Students: 1,353, Location: 2200 MAPLE AVE, Grades: 9-12)GIANT STEPS ILLINOIS Students: 107, Location: 2500 CABOT DR, Grades: UG-12)
Public elementary/middle schools in Lisle:
Private elementary/middle school in Lisle: ST JOAN OF ARC Students: 555, Location: 4913 COLUMBIA AVE, Grades: PK-8)
See full list of schools located in Lisle Library in Lisle: LISLE LIBRARY DISTRICT Operating income: $4,309,431; Location: 777 FRONT STREET; 129,914 books ; 330 e-books ; 11,761 audio materials ; 8,995 video materials ; 17 local licensed databases ; 16 state licensed databases ; 1 other licensed databases ; 386 print serial subscriptions )
User-submitted facts and corrections:
Church: DuPage AME Church, 4300 Yackley Avenue, Lisle, IL 60532 630-969-9800
Notable locations in Lisle: (A) , Corporate West Business Park (B) , Corporate Lakes Business Park (C) , Corporetum Office Campus (D) , Corporetum Office Towers (E) , Aboretum Lakes Business Park (F) , Lisle Library (G) , Lisle Village Hall (H) , Lisle - Woodridge Fire District Station 4 (I) , Lisle - Woodridge Fire District Station 1 (J) , Lisle - Woodridge Fire District Station 5 (K) . Display/hide their locations on the map
Shopping Center: (1) . Display/hide its location on the map
Main business address in Lisle: (A) . Display/hide its location on the map
Churches in Lisle include: (A) , First Congregational Church (B) , Lisle Bible Church (C) , Saint Joan of Arc Catholic Church (D) . Display/hide their locations on the map
Creek: (A) . Display/hide its location on the map
Parks in Lisle include: (1) , Tanglewood Park (2) , Candlewood Park (3) , Barkridge Park (4) , Breckenridge Park (5) , Methodist Park (6) , Pennywood Park (7) , Sun Valley Park (8) , Surrey Ridge Park (9) . Display/hide their locations on the map
Tourist attractions:
Hotels:
Court:
Birthplace of: Glenn Earl - 2005 NFL player (Houston Texans, born : Jun 10, 1981), Jeff Robinson - College basketball player (East Carolina Pirates), Pierre Parker - College basketball player (Loyola Chi Ramblers), T.J. Parker - College basketball player (Northwestern Wildcats).
DuPage County has a predicted average indoor radon screening level between 2 and 4 pCi/L (pico curies per liter) - Moderate Potential Drinking water stations with addresses in Lisle that have no violations reported:
SUBWAY (Population served: 250, Primary Water Source Type: Groundwater)
SQUIRREL CAGE (Population served: 200, Primary Water Source Type: Groundwater)
Average household size: This village:
2.3 peopleIllinois:
2.6 people
Percentage of family households: This village:
58.5%Whole state:
65.8%
Percentage of households with unmarried partners: This village:
6.3%Whole state:
6.3%
Likely homosexual households (counted as self-reported same-sex unmarried-partner households)
Lesbian couples: 0.3% of all households Gay men: 0.2% of all households
People in group quarters in Lisle in 2010:
661 people in college/university student housing
116 people in nursing facilities/skilled-nursing facilities
52 people in other noninstitutional facilities
13 people in group homes for juveniles (non-correctional)
People in group quarters in Lisle in 2000:
125 people in religious group quarters
48 people in nursing homes
10 people in other group homes
Banks with most branches in Lisle (2011 data):
Lisle Savings Bank: 4720 Main Street Branch at 4720 Main Street, branch established on 1985/06/30; at 1450 Maple, branch established on 1917/01/01. Info updated 2006/11/03: Bank assets: $523.4 mil, Deposits: $417.8 mil, local headquarters , positive income , Mortgage Lending Specialization, 2 total offices
U.S. Bank National Association: Lisle Branch at 1026 Ogden Avenue, branch established on 2000/11/15. Info updated 2012/01/30: Bank assets: $330,470.8 mil, Deposits: $236,091.5 mil, headquarters in Cincinnati, OH, positive income , 3121 total offices , Holding Company: U.S. Bancorp
Devon Bank: Devonshire Branch at 1700 Robin Ln, branch established on 2007/04/20. Info updated 2006/11/03: Bank assets: $265.9 mil, Deposits: $242.2 mil, headquarters in Chicago, IL, negative income in the last year , Commercial Lending Specialization, 15 total offices , Holding Company: Devon Bancorp, Inc.
Old Second National Bank: Lisle/Naperville Branch at 3101 Ogden Road, branch established on 2000/02/01. Info updated 2008/03/03: Bank assets: $1,939.3 mil, Deposits: $1,741.1 mil, headquarters in Aurora, IL, positive income , Commercial Lending Specialization, 27 total offices , Holding Company: Old Second Bancorp, Inc.
Bank of America, National Association: Lisle/Center St Branch at 4707 Center Street, branch established on 1972/06/02. Info updated 2009/11/18: Bank assets: $1,451,969.3 mil, Deposits: $1,077,176.8 mil, headquarters in Charlotte, NC, positive income , 5782 total offices , Holding Company: Bank Of America Corporation
RBS Citizens, National Association: Lisle at 2745 West Maple Avenue, branch established on 1934/04/01. Info updated 2007/09/19: Bank assets: $106,940.6 mil, Deposits: $75,690.2 mil, headquarters in Providence, RI, positive income , 1135 total offices , Holding Company: Uk Financial Investments Limited
MB Financial Bank, National Association: Lisle Branch at 6444 South College Road, branch established on 1985/10/17. Info updated 2010/04/27: Bank assets: $9,792.4 mil, Deposits: $7,757.4 mil, headquarters in Chicago, IL, positive income , Commercial Lending Specialization, 93 total offices , Holding Company: Mb Financial, Inc
TCF National Bank: Lisle Jewel Branch #2238 at 1156 Maple Avenue, branch established on 1996/09/19. Info updated 2009/11/23: Bank assets: $19,007.0 mil, Deposits: $12,377.0 mil, headquarters in Sioux Falls, SD, positive income , Commercial Lending Specialization, 441 total offices , Holding Company: Tcf Financial Corporation
West Suburban Bank: Villa St. Benedict Branch at 1920 Maple Avenue, branch established on 2010/05/28. Info updated 2011/02/23: Bank assets: $1,927.7 mil, Deposits: $1,744.7 mil, headquarters in Lombard, IL, positive income , Commercial Lending Specialization, 44 total offices , Holding Company: West Suburban Bancorp, Inc.
For population 15 years and over in Lisle:
Never married: 33.2%Now married: 52.1%Separated: 0.6%Widowed: 5.5%Divorced: 8.6% For population 25 years and over in Lisle:
High school or higher: 98.0%Bachelor's degree or higher: 63.0%Graduate or professional degree: 27.3%Unemployed: 2.5%Mean travel time to work (commute): 21.7 minutes
Education Gini index (Inequality in education) Here:
9.1Illinois average:
12.5
Religion statistics for Lisle, IL (based on DuPage County data)
Religion Adherents Congregations Catholic 373,823 54 Evangelical Protestant 120,953 247 Other 77,889 80 Mainline Protestant 71,909 126 Orthodox 8,460 10 Black Protestant 3,014 5 None 260,876 -
Source: Clifford Grammich, Kirk Hadaway, Richard Houseal, Dale E.Jones, Alexei Krindatch, Richie Stanley and Richard H.Taylor. 2012. 2010 U.S.Religion Census: Religious Congregations & Membership Study. Association of Statisticians of American Religious Bodies. Jones, Dale E., et al. 2002. Congregations and Membership in the United States 2000. Nashville, TN: Glenmary Research Center. Graphs represent county-level data
Food Environment Statistics: Number of grocery stores : 175DuPage County :
1.89 / 10,000 pop.Illinois :
2.24 / 10,000 pop.
Number of supercenters and club stores : 8DuPage County :
0.09 / 10,000 pop.State :
0.08 / 10,000 pop.
Number of convenience stores (no gas) : 97DuPage County :
1.05 / 10,000 pop.State :
0.75 / 10,000 pop.
Number of convenience stores (with gas) : 200This county :
2.16 / 10,000 pop.Illinois :
2.61 / 10,000 pop.
Number of full-service restaurants : 671DuPage County :
7.24 / 10,000 pop.Illinois :
6.86 / 10,000 pop.
Adult diabetes rate : DuPage County :
7.1%State :
8.3%
Low-income preschool obesity rate : DuPage County :
13.2%Illinois :
14.5%
Health and Nutrition: Healthy diet rate : This city:
53.9%Illinois:
49.5%
Average overall health of teeth and gums : Lisle:
53.9%Illinois:
47.2%
Average BMI : This city:
27.8Illinois:
28.6
People feeling badly about themselves : This city:
18.7%Illinois:
20.5%
People not drinking alcohol at all : Average hours sleeping at night : General health condition : Average condition of hearing : More about Health and Nutrition of Lisle, IL Residents
Local government employment and payroll (March 2022)
Function
Full-time employees
Monthly full-time payroll
Average yearly full-time wage
Part-time employees
Monthly part-time payroll
Police Protection - Officers
31 $304,734 $117,962 0 $0 Other and Unallocable
10 $76,643 $91,972 1 $1,866 Police - Other
8 $36,908 $55,362 2 $2,083 Other Government Administration
8 $63,018 $94,527 8 $744 Sewerage
7 $43,685 $74,889 0 $0 Water Supply
6 $33,261 $66,522 0 $0 Natural Resources
5 $28,875 $69,300 0 $0 Financial Administration
2 $19,918 $119,508 1 $1,995
Totals for Government
77 $607,043 $94,604 12 $6,687
Lisle government finances - Expenditure in 2018 (per resident):
Construction - Regular Highways: $409,000 ($17.59)
General Public Buildings: $40,000 ($1.72)Current Operations - Police Protection: $7,782,000 ($334.59)
Water Utilities: $5,310,000 ($228.31)Central Staff Services: $4,185,000 ($179.94)General - Other: $3,017,000 ($129.72)Regular Highways: $2,504,000 ($107.66)Sewerage: $372,000 ($15.99)Parking Facilities: $269,000 ($11.57)Miscellaneous Commercial Activities - Other: $15,000 ($0.64)General - Interest on Debt: $88,000 ($3.78)
Other Capital Outlay - Regular Highways: $2,184,000 ($93.90)
Water Utilities: $619,000 ($26.61)Police Protection: $143,000 ($6.15)Central Staff Services: $136,000 ($5.85)Sewerage: $111,000 ($4.77)Parking Facilities: $39,000 ($1.68)Total Salaries and Wages: $8,201,000 ($352.61)
Lisle government finances - Revenue in 2018 (per resident):
Charges - Parking Facilities: $435,000 ($18.70)
Sewerage: $431,000 ($18.53)Other: $359,000 ($15.44)Solid Waste Management: $19,000 ($0.82)Federal Intergovernmental - Highways: $595,000 ($25.58)
Public Welfare: $15,000 ($0.64)Local Intergovernmental - Other: $41,000 ($1.76)
Miscellaneous - General Revenue - Other: $1,012,000 ($43.51)
Fines and Forfeits: $471,000 ($20.25)Interest Earnings: $352,000 ($15.13)Revenue - Water Utilities: $5,442,000 ($233.98)
State Intergovernmental - General Local Government Support: $6,299,000 ($270.83)
Highways: $619,000 ($26.61)Public Welfare: $5,000 ($0.21)Tax - Property: $6,963,000 ($299.38)
Public Utilities Sales: $3,520,000 ($151.35)Other Selective Sales: $1,528,000 ($65.70)Other License: $1,288,000 ($55.38)
Lisle government finances - Debt in 2018 (per resident):
Long Term Debt - Beginning Outstanding - Unspecified Public Purpose: $21,304,000 ($915.99)
Beginning Outstanding - Public Debt for Private Purpose: $20,143,000 ($866.07)Outstanding Nonguaranteed - Industrial Revenue: $17,626,000 ($757.85)Outstanding Unspecified Public Purpose: $17,306,000 ($744.09)Retired Unspecified Public Purpose: $4,060,000 ($174.56)Retired Nonguaranteed - Public Debt for Private Purpose: $2,517,000 ($108.22)Issue, Unspecified Public Purpose: $61,000 ($2.62)
Lisle government finances - Cash and Securities in 2018 (per resident):
Other Funds - Cash and Securities: $43,615,000 ($1875.27)
Sinking Funds - Cash and Securities: $17,626,000 ($757.85)
7.06% of this county's 2021 resident taxpayers lived in other counties in 2020 ($90,805 average adjusted gross income )
Here:
7.06%Illinois average:
5.09%
0.01% of residents moved from foreign countries ($57 average AGI )DuPage County:
0.01%Illinois average:
0.01%
Top counties from which taxpayers relocated into this county between 2020 and 2021:
8.01% of this county's 2020 resident taxpayers moved to other counties in 2021 ($102,485 average adjusted gross income )
Here:
8.01%Illinois average:
6.10%
0.01% of residents moved to foreign countries ($42 average AGI )DuPage County:
0.01%Illinois average:
0.01%
Top counties to which taxpayers relocated from this county between 2020 and 2021:
Businesses in Lisle, IL
Name Count Name Count
7-Eleven 2 Jewel-Osco 1 ALDI 1 Jimmy John's 1 AutoZone 1 KFC 1 Baskin-Robbins 1 Marriott 1 Chevrolet 1 MasterBrand Cabinets 2 Circle K 1 McDonald's 1 Decora Cabinetry 2 New Balance 1 Domino's Pizza 1 Nike 2 Dunkin Donuts 2 Popeyes 1 Extended Stay America 1 Quiznos 1 FedEx 5 Starbucks 1 Firestone Complete Auto Care 1 Taco Bell 1 H&R Block 1 UPS 4 Hilton 2 Walgreens 1 Honda 1
Strongest AM radio stations in Lisle:
WMVP (1000 AM; 50 kW; CHICAGO, IL; Owner: ABC, INC.)
WSCR (670 AM; 50 kW; CHICAGO, IL; Owner: INFINITY BROADCASTING OPERATIONS, INC.)
WBBM (780 AM; 50 kW; CHICAGO, IL; Owner: INFINITY BROADCASTING OPERATIONS, INC.)
WGN (720 AM; 50 kW; CHICAGO, IL; Owner: WGN CONTINENTAL BROADCASTING CO.)
WYLL (1160 AM; 50 kW; CHICAGO, IL; Owner: SCA LICENSE CORPORATION)
WLS (890 AM; 50 kW; CHICAGO, IL; Owner: WLS, INC.)
WMBI (1110 AM; daytime; 5 kW; CHICAGO, IL; Owner: THE MOODY BIBLE INSTITUTE OF CHICAGO)
WVIV (1200 AM; 20 kW; CHICAGO, IL; Owner: WLXX-AM LICENSE CORP.)
WTMJ (620 AM; 50 kW; MILWAUKEE, WI; Owner: JOURNAL BROADCAST CORPORATION)
WCSN (820 AM; 5 kW; CHICAGO, IL; Owner: WYPA, INC.)
WBIG (1280 AM; 1 kW; AURORA, IL; Owner: BIG BROADCASTING COMAPNY, INC.)
WJJG (1530 AM; daytime; 2 kW; ELMHURST, IL; Owner: JOSEPH J. GENTILE, INC.)
WRDZ (1300 AM; 4 kW; LA GRANGE, IL; Owner: ABC, INC.)
Strongest FM radio stations in Lisle:
WLEY-FM (107.9 FM; AURORA, IL; Owner: WLEY LICENSING, INC.)
WDCB (90.9 FM; GLEN ELLYN, IL; Owner: COLLEGE OF DU PAGE, DISTRICT 502)
WERV-FM (95.9 FM; AURORA, IL; Owner: NM LICENSING, LLC)
WCKG (105.9 FM; ELMWOOD PARK, IL; Owner: INFINITY HOLDINGS CORPORATION OF ORLANDO)
WLIT-FM (93.9 FM; CHICAGO, IL; Owner: AMFM RADIO LICENSES, L.L.C.)
WJMK (104.3 FM; CHICAGO, IL; Owner: INFINITY BROADCASTING CORP. OF ILLINOIS)
WNUA (95.5 FM; CHICAGO, IL; Owner: AMFM RADIO LICENSES, L.L.C.)
WTMX (101.9 FM; SKOKIE, IL; Owner: BONNEVILLE HOLDING COMPANY)
WBBM-FM (96.3 FM; CHICAGO, IL; Owner: INFINITY BROADCASTING OPERATIONS, INC.)
WGCI-FM (107.5 FM; CHICAGO, IL; Owner: AMFM RADIO LICENSES, L.L.C.)
WKSC-FM (103.5 FM; CHICAGO, IL; Owner: AMFM RADIO LICENSES, L.L.C.)
WFMT (98.7 FM; CHICAGO, IL; Owner: WINDOW TO THE WORLD COMMUNICATIONS)
WZZN (94.7 FM; CHICAGO, IL; Owner: ABC CHICAGO FM RADIO,INC.)
WMBI-FM (90.1 FM; CHICAGO, IL; Owner: THE MOODY BIBLE INSTITUTE OF CHICAGO)
WBEZ (91.5 FM; CHICAGO, IL; Owner: THE WBEZ ALLIANCE, INC.)
WKQX (101.1 FM; CHICAGO, IL; Owner: EMMIS RADIO LICENSE CORPORATION)
WLUP-FM (97.9 FM; CHICAGO, IL; Owner: BONNEVILLE HOLDING COMPANY)
WNND (100.3 FM; CHICAGO, IL; Owner: BONNEVILLE HOLDING COMPANY)
WOJO (105.1 FM; EVANSTON, IL; Owner: TICHENOR LICENSE CORPORATION ("TLC"))
WUSN (99.5 FM; CHICAGO, IL; Owner: INFINITY BROADCASTING CORPORATION OF CHICAGO)
TV broadcast stations around Lisle:
WLS-TV (Channel 7; CHICAGO, IL; Owner: WLS TELEVISION, INC.)
WMAQ-TV (Channel 5; CHICAGO, IL; Owner: NBC SUBSIDIARY (WMAQ-TV), INC.)
WTTW (Channel 11; CHICAGO, IL; Owner: WINDOW TO THE WORLD COMMUNICATIONS, INC.)
WGN-TV (Channel 9; CHICAGO, IL; Owner: WGN CONTINENTAL BROADCASTING COMPANY)
WGBO-TV (Channel 66; JOLIET, IL; Owner: WGBO LICENSE PARTNERSHIP, G.P.)
WBBM-TV (Channel 2; CHICAGO, IL; Owner: CBS BROADCASTING INC.)
WPWR-TV (Channel 50; GARY, IN; Owner: FOX TELEVISION STATIONS, INC.)
WXFT (Channel 60; AURORA, IL; Owner: TELEFUTURA CHICAGO LLC)
WCIU-TV (Channel 26; CHICAGO, IL; Owner: WCIU-TV LIMITED PARTNERSHIP)
W34CK (Channel 34; ARLINGTON HEIGHTS, IL; Owner: FIRST UNITED, INC.)
WCPX (Channel 38; CHICAGO, IL; Owner: PAXSON CHICAGO LICENSE, INC.)
WFLD (Channel 32; CHICAGO, IL; Owner: FOX TELEVISION STATIONS, INC.)
W68DO (Channel 68; PALATINE, IL; Owner: TRINITY BROADCASTING NETWORK)
WFBT-CA (Channel 23; CHICAGO, IL; Owner: CHANNEL 23 LIMITED PARTNERSHIP)
W24AJ (Channel 24; AURORA, IL; Owner: NELSON TV, INC.)
WJYS (Channel 62; HAMMOND, IN; Owner: JOVON BROADCASTING CORPORATION)
WSNS-TV (Channel 44; CHICAGO, IL; Owner: TELEMUNDO OF CHICAGO, INC.)
WOCH-LP (Channel 28; CHICAGO, IL; Owner: KM LPTV OF CHICAGO-28, L.L.C.)
WYCC (Channel 20; CHICAGO, IL; Owner: COLLEGE DIST. #508, COUNTY OF COOK)
WOCK-CA (Channel 13; CHICAGO, IL; Owner: KM LPTV OF CHICAGO-13, L.L.C.)
W57DN (Channel 57; ELGIN, IL; Owner: TRINITY BROADCASTING NETWORK)
W64CQ (Channel 64; ARLINGTON HEIGHTS, IL; Owner: TRINITY BROADCASTING NETWORK)
WYIN (Channel 56; GARY, IN; Owner: NORTHWEST INDIANA PUBLIC BROADCASTING, INC.)
W54AP (Channel 54; BLUE ISLAND, IL; Owner: CATHOLIC VIEWS BROADCASTS, INC.)
WSPY-LP (Channel 30; PLANO, IL; Owner: WSPY-TV, INC.)
National Bridge Inventory (NBI) Statistics 52 Number of bridges512ft / 156m Total length $768,000 Total costs1,701,325 Total average daily traffic263,015 Total average daily truck traffic
New bridges - historical statistics
1 1930-1939 1 1940-1949 10 1950-1959 7 1960-1969 2 1970-1979 19 1980-1989 1 1990-1999 8 2000-2009 3 2010-2019
See full National Bridge Inventory statistics for Lisle, IL
FCC Registered Antenna Towers: 26 (
See the full list of FCC Registered Antenna Towers in Lisle )
FCC Registered Private Land Mobile Towers: 4 (
See the full list of FCC Registered Private Land Mobile Towers in Lisle, IL )
FCC Registered Broadcast Land Mobile Towers: 20 (
See the full list of FCC Registered Broadcast Land Mobile Towers )
FCC Registered Microwave Towers: 44 (
See the full list of FCC Registered Microwave Towers in this town )
FCC Registered Paging Towers: 4 (
See the full list of FCC Registered Paging Towers )
FCC Registered Amateur Radio Licenses: 125 (
See the full list of FCC Registered Amateur Radio Licenses in Lisle )
FAA Registered Aircraft Manufacturers and Dealers: 1
AIRCRAFT BUSINESS CORP LTD, 2154 Lillian Ln, Lisle, IL 60532Certificate: D005655 (Corporation), Certificate Issue Date: 04/05/2016, Expiration Date: 04/04/2017 FAA Registered Aircraft: 5
Aircraft: PENNINGTON HENRY R QUICKSILVER 2S (Category: Land, Seats: 2, Weight: Up to 12,499 Pounds), Engine: ROTAX 582DCDI (65 HP) (2 Cycle)N-Number: 106VX, N106VX, N-106VX, Serial Number: 0005, Year manufactured: 2006, Airworthiness Date: 11/02/2006, Certificate Issue Date: 05/28/2008Registrant (Individual): Patrick C Cadas, 5885 Forest View Rd Apt 631, Lisle, IL 60532Aircraft: DESTINY 2000 (Category: Land, Seats: 2, Weight: Up to 12,499 Pounds), Engine: ROTAX 582DCDI (65 HP) (2 Cycle)N-Number: 172AS, N172AS, N-172AS, Serial Number: 1B0144, Year manufactured: 2000, Airworthiness Date: 01/29/2008, Certificate Issue Date: 01/15/2008Registrant (Individual): Gordon J Purtell, 4491 Saint Tropez Dr, Lisle, IL 60532Aircraft: RAYTHEON AIRCRAFT COMPANY A36 (Category: Land, Seats: 6, Weight: Up to 12,499 Pounds), Engine: CONT MOTOR IO-550 SERIES (300 HP) (Reciprocating)N-Number: 47RT, N47RT, N-47RT, Serial Number: E-3142, Year manufactured: 1997, Airworthiness Date: 12/28/1997, Certificate Issue Date: 01/30/2002Registrant (LLC): Gina Bakiares Santori Dpm LLC, 4236 White Birch Dr, Lisle, IL 60532Aircraft: ILLINOIS AVIATION MUSEUM ZENITH 750 (Category: Land, Seats: 2, Weight: Up to 12,499 Pounds), Engine: CONT MOTOR O-200-D (100 HP) (Reciprocating)N-Number: 611AM, N611AM, N-611AM, Serial Number: 1-001, Year manufactured: 2017, Airworthiness Date: 07/07/2017, Certificate Issue Date: 08/01/2017Registrant (Corporation): Access Aero, Attn John Tatro / 2284 Oak Hill Dr, Lisle, IL 60532Aircraft: MAULE M-7-260C (Category: Land, Seats: 5, Weight: Up to 12,499 Pounds), Engine: LYCOMING IO-540 SER (300 HP) (Reciprocating)N-Number: 927GS, N927GS, N-927GS, Serial Number: 30019C, Year manufactured: 2000, Airworthiness Date: 09/27/2000, Certificate Issue Date: 01/28/2014Registrant (LLC): Gina Bakiares Santori Dpm LLC, 4236 White Birch Dr, Lisle, IL 60532
Home Mortgage Disclosure Act Aggregated Statistics For Year 2009(Based on 6 partial tracts) A) FHA, FSA/RHS & VA B) Conventional C) Refinancings D) Home Improvement Loans E) Loans on Dwellings For 5+ Families F) Non-occupant Loans on G) Loans On Manufactured Number Average Value Number Average Value Number Average Value Number Average Value Number Average Value Number Average Value Number Average Value
LOANS ORIGINATED 47 $206,047 92 $228,197 621 $237,891 12 $161,366 2 $599,500 18 $157,349 2 $168,200 APPLICATIONS APPROVED, NOT ACCEPTED 2 $152,850 10 $207,042 59 $245,173 1 $28,460 1 $1,244,310 3 $131,743 0 $0 APPLICATIONS DENIED 5 $236,060 17 $165,389 118 $250,796 7 $122,464 0 $0 12 $122,066 0 $0 APPLICATIONS WITHDRAWN 6 $168,997 9 $239,214 85 $236,825 1 $371,230 0 $0 3 $191,200 0 $0 FILES CLOSED FOR INCOMPLETENESS 2 $235,005 3 $164,163 18 $239,961 1 $41,010 0 $0 2 $197,425 0 $0
Aggregated Statistics For Year 2008(Based on 6 partial tracts) A) FHA, FSA/RHS & VA B) Conventional C) Refinancings D) Home Improvement Loans E) Loans on Dwellings For 5+ Families F) Non-occupant Loans on Number Average Value Number Average Value Number Average Value Number Average Value Number Average Value Number Average Value
LOANS ORIGINATED 33 $206,103 127 $252,965 325 $244,562 16 $110,775 2 $3,406,930 26 $209,417 APPLICATIONS APPROVED, NOT ACCEPTED 2 $244,030 14 $226,756 43 $233,476 7 $54,086 1 $7,170,600 5 $144,302 APPLICATIONS DENIED 3 $137,693 23 $216,879 119 $243,434 13 $129,741 0 $0 14 $155,251 APPLICATIONS WITHDRAWN 2 $201,650 7 $208,511 49 $241,629 5 $191,556 0 $0 2 $137,250 FILES CLOSED FOR INCOMPLETENESS 0 $0 3 $310,603 19 $264,918 1 $297,400 0 $0 1 $194,920
Aggregated Statistics For Year 2007(Based on 6 partial tracts) A) FHA, FSA/RHS & VA B) Conventional C) Refinancings D) Home Improvement Loans E) Loans on Dwellings For 5+ Families F) Non-occupant Loans on G) Loans On Manufactured Number Average Value Number Average Value Number Average Value Number Average Value Number Average Value Number Average Value Number Average Value
LOANS ORIGINATED 5 $209,552 309 $188,399 334 $213,720 38 $128,132 1 $759,240 58 $129,017 0 $0 APPLICATIONS APPROVED, NOT ACCEPTED 1 $231,620 31 $172,903 55 $205,129 9 $42,407 0 $0 7 $202,209 1 $12,320 APPLICATIONS DENIED 2 $196,495 53 $178,119 125 $215,808 26 $96,699 0 $0 18 $149,809 1 $8,040 APPLICATIONS WITHDRAWN 1 $220,180 35 $261,457 67 $203,405 5 $129,820 1 $5,168,150 6 $129,333 0 $0 FILES CLOSED FOR INCOMPLETENESS 0 $0 6 $155,728 27 $223,688 1 $296,950 0 $0 3 $119,563 0 $0
Aggregated Statistics For Year 2006(Based on 6 partial tracts) A) FHA, FSA/RHS & VA B) Conventional C) Refinancings D) Home Improvement Loans E) Loans on Dwellings For 5+ Families F) Non-occupant Loans on Number Average Value Number Average Value Number Average Value Number Average Value Number Average Value Number Average Value
LOANS ORIGINATED 3 $189,217 547 $156,036 378 $217,661 46 $131,158 7 $7,378,526 169 $114,136 APPLICATIONS APPROVED, NOT ACCEPTED 0 $0 59 $147,757 56 $228,991 8 $56,192 1 $108,930 22 $111,496 APPLICATIONS DENIED 0 $0 115 $127,651 130 $209,609 21 $109,500 0 $0 42 $104,910 APPLICATIONS WITHDRAWN 0 $0 45 $163,280 75 $243,087 7 $77,556 0 $0 12 $112,372 FILES CLOSED FOR INCOMPLETENESS 0 $0 11 $131,955 16 $211,185 2 $64,610 0 $0 5 $105,162
Aggregated Statistics For Year 2005(Based on 6 partial tracts) A) FHA, FSA/RHS & VA B) Conventional C) Refinancings D) Home Improvement Loans E) Loans on Dwellings For 5+ Families F) Non-occupant Loans on G) Loans On Manufactured Number Average Value Number Average Value Number Average Value Number Average Value Number Average Value Number Average Value Number Average Value
LOANS ORIGINATED 9 $184,304 455 $193,799 427 $212,382 47 $111,531 3 $3,220,560 55 $159,008 0 $0 APPLICATIONS APPROVED, NOT ACCEPTED 1 $115,100 56 $179,844 52 $178,373 6 $88,535 0 $0 5 $169,770 1 $54,830 APPLICATIONS DENIED 2 $153,305 69 $137,540 134 $205,997 25 $81,098 0 $0 12 $148,702 0 $0 APPLICATIONS WITHDRAWN 1 $117,260 43 $176,741 88 $201,454 13 $145,595 1 $1,061,080 5 $222,350 1 $157,530 FILES CLOSED FOR INCOMPLETENESS 0 $0 18 $154,906 24 $219,452 2 $272,900 0 $0 2 $93,915 0 $0
Aggregated Statistics For Year 2004(Based on 6 partial tracts) A) FHA, FSA/RHS & VA B) Conventional C) Refinancings D) Home Improvement Loans E) Loans on Dwellings For 5+ Families F) Non-occupant Loans on G) Loans On Manufactured Number Average Value Number Average Value Number Average Value Number Average Value Number Average Value Number Average Value Number Average Value
LOANS ORIGINATED 11 $168,875 459 $179,105 546 $196,194 45 $90,116 3 $3,782,413 59 $129,058 3 $30,640 APPLICATIONS APPROVED, NOT ACCEPTED 1 $116,900 42 $226,857 57 $202,136 11 $71,286 0 $0 3 $80,567 1 $41,490 APPLICATIONS DENIED 2 $166,160 44 $150,734 106 $182,319 16 $38,988 0 $0 4 $112,625 0 $0 APPLICATIONS WITHDRAWN 2 $171,890 28 $208,102 87 $197,066 8 $76,356 0 $0 3 $223,717 0 $0 FILES CLOSED FOR INCOMPLETENESS 2 $141,125 14 $197,131 34 $196,281 2 $39,725 0 $0 1 $75,010 0 $0
Aggregated Statistics For Year 2003(Based on 6 partial tracts) A) FHA, FSA/RHS & VA B) Conventional C) Refinancings D) Home Improvement Loans E) Loans on Dwellings For 5+ Families F) Non-occupant Loans on Number Average Value Number Average Value Number Average Value Number Average Value Number Average Value Number Average Value
LOANS ORIGINATED 18 $157,157 349 $183,457 1,586 $180,411 34 $95,699 1 $9,870,120 63 $124,061 APPLICATIONS APPROVED, NOT ACCEPTED 2 $142,180 25 $214,192 162 $178,208 5 $29,770 0 $0 8 $113,388 APPLICATIONS DENIED 4 $137,675 36 $134,659 167 $162,294 17 $40,503 0 $0 13 $102,842 APPLICATIONS WITHDRAWN 1 $194,480 30 $184,485 189 $164,732 6 $22,970 0 $0 6 $123,722 FILES CLOSED FOR INCOMPLETENESS 0 $0 10 $177,352 32 $178,025 1 $21,090 0 $0 2 $109,200
Detailed HMDA statistics for the following Tracts:
8460.01
, 8460.02 , 8461.02 , 8461.04 , 8462.02 , 8463.01
Private Mortgage Insurance Companies Aggregated Statistics For Year 2009(Based on 6 partial tracts) A) Conventional B) Refinancings C) Non-occupant Loans on Number Average Value Number Average Value Number Average Value
LOANS ORIGINATED 16 $269,911 14 $240,031 1 $276,640 APPLICATIONS APPROVED, NOT ACCEPTED 7 $247,673 5 $193,786 0 $0 APPLICATIONS DENIED 3 $355,090 3 $310,370 0 $0 APPLICATIONS WITHDRAWN 0 $0 3 $260,673 0 $0 FILES CLOSED FOR INCOMPLETENESS 0 $0 0 $0 0 $0
Aggregated Statistics For Year 2008(Based on 6 partial tracts) A) Conventional B) Refinancings C) Non-occupant Loans on D) Loans On Manufactured Number Average Value Number Average Value Number Average Value Number Average Value
LOANS ORIGINATED 44 $200,452 25 $233,112 0 $0 0 $0 APPLICATIONS APPROVED, NOT ACCEPTED 19 $244,151 17 $207,792 3 $104,820 0 $0 APPLICATIONS DENIED 9 $220,292 1 $159,180 2 $193,765 0 $0 APPLICATIONS WITHDRAWN 2 $246,630 2 $230,570 0 $0 0 $0 FILES CLOSED FOR INCOMPLETENESS 2 $282,635 1 $361,810 2 $280,075 1 $243,800
Aggregated Statistics For Year 2007(Based on 6 partial tracts) A) Conventional B) Refinancings C) Non-occupant Loans on Number Average Value Number Average Value Number Average Value
LOANS ORIGINATED 93 $179,088 28 $236,530 8 $109,199 APPLICATIONS APPROVED, NOT ACCEPTED 12 $161,218 7 $203,310 1 $202,770 APPLICATIONS DENIED 1 $159,020 1 $261,190 0 $0 APPLICATIONS WITHDRAWN 3 $117,440 4 $259,385 1 $73,940 FILES CLOSED FOR INCOMPLETENESS 0 $0 0 $0 0 $0
Aggregated Statistics For Year 2006(Based on 6 partial tracts) A) Conventional B) Refinancings C) Non-occupant Loans on Number Average Value Number Average Value Number Average Value
LOANS ORIGINATED 83 $147,890 18 $235,353 25 $122,047 APPLICATIONS APPROVED, NOT ACCEPTED 11 $188,884 3 $267,603 2 $181,405 APPLICATIONS DENIED 1 $90,640 1 $221,800 1 $221,800 APPLICATIONS WITHDRAWN 5 $189,302 3 $184,837 2 $100,605 FILES CLOSED FOR INCOMPLETENESS 0 $0 0 $0 0 $0
Aggregated Statistics For Year 2005(Based on 6 partial tracts) A) Conventional B) Refinancings C) Non-occupant Loans on Number Average Value Number Average Value Number Average Value
LOANS ORIGINATED 70 $191,338 17 $215,312 5 $141,046 APPLICATIONS APPROVED, NOT ACCEPTED 15 $202,785 8 $228,538 2 $84,815 APPLICATIONS DENIED 1 $304,090 1 $223,550 1 $261,520 APPLICATIONS WITHDRAWN 6 $156,193 2 $236,330 1 $149,000 FILES CLOSED FOR INCOMPLETENESS 2 $188,350 0 $0 0 $0
Aggregated Statistics For Year 2004(Based on 6 partial tracts) A) Conventional B) Refinancings C) Non-occupant Loans on Number Average Value Number Average Value Number Average Value
LOANS ORIGINATED 108 $171,450 28 $201,538 8 $144,159 APPLICATIONS APPROVED, NOT ACCEPTED 17 $160,089 7 $204,007 1 $160,920 APPLICATIONS DENIED 5 $159,328 0 $0 1 $223,700 APPLICATIONS WITHDRAWN 2 $182,400 2 $152,940 1 $86,950 FILES CLOSED FOR INCOMPLETENESS 0 $0 0 $0 0 $0
Aggregated Statistics For Year 2003(Based on 6 partial tracts) A) Conventional B) Refinancings C) Non-occupant Loans on Number Average Value Number Average Value Number Average Value
LOANS ORIGINATED 113 $176,712 87 $179,547 10 $127,275 APPLICATIONS APPROVED, NOT ACCEPTED 14 $186,086 14 $173,846 1 $183,130 APPLICATIONS DENIED 1 $157,710 1 $109,680 0 $0 APPLICATIONS WITHDRAWN 3 $143,490 2 $218,025 1 $66,390 FILES CLOSED FOR INCOMPLETENESS 0 $0 0 $0 0 $0
Detailed PMIC statistics for the following Tracts:
8460.01
, 8460.02 , 8461.02 , 8461.04 , 8462.02 , 8463.01 Fire-safe hotels and motels in Lisle, Illinois:
Sheraton Lisle, 3000 Warrenville Rd, Lisle, Illinois 60532 Phone: (630) 505-1000, Fax: (630) 505-1165
Extended Stay America - Chicago - Lisle, 445 Warrenville Rd, Lisle, Illinois 60532 Phone: (630) 434-7710, Fax: (630) 434-7756
All 2 fire-safe hotels and motels in Lisle, Illinois
Most common first names in Lisle, IL among deceased individuals Name Count Lived (average)
John 106 77.9 years Mary 105 82.7 years William 81 75.2 years Joseph 66 79.0 years Helen 64 83.4 years Robert 63 70.5 years Edward 50 78.3 years James 50 72.9 years Anna 44 83.1 years Frank 42 76.2 years
Most common last names in Lisle, IL among deceased individuals Last name Count Lived (average)
Smith 26 80.6 years Johnson 15 78.6 years Anderson 15 74.9 years Williams 10 80.1 years Riedy 9 73.1 years Davis 9 72.9 years Brown 7 74.7 years Meyer 7 80.3 years Jones 7 76.6 years Baker 7 72.1 years
Lisle compared to Illinois state average:
Median house value above state average. Unemployed percentage significantly below state average. Black race population percentage significantly below state average. Hispanic race population percentage below state average. House age below state average. Percentage of population with a bachelor's degree or higher significantly above state average.
Top Patent Applicants
Suzann Hua (48)
David A. Wegerer (37)
Vernon W. Hamlin (31)
Brian J. Buck (24)
Eric Steven Peyton (22)
Alok Sharma (19)
Shreecharan Kanchanavally (17)
Peerouz Amleshi (16)
Shiyan Hua (14)
Thomas J. Cloonan (13)
Total of 832 patent applications in 2008-2024.

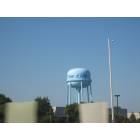


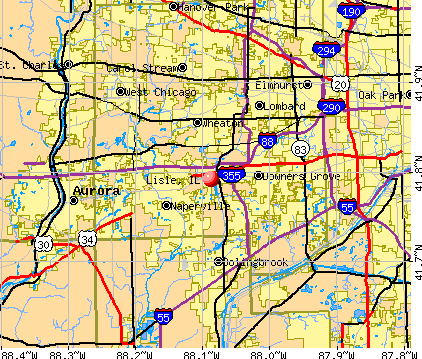


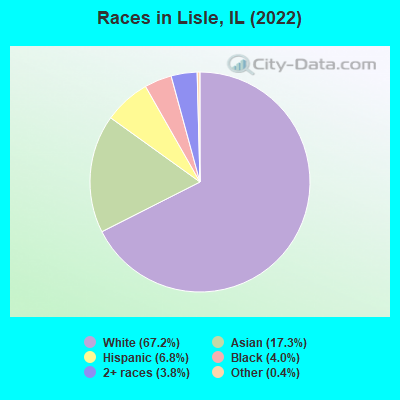
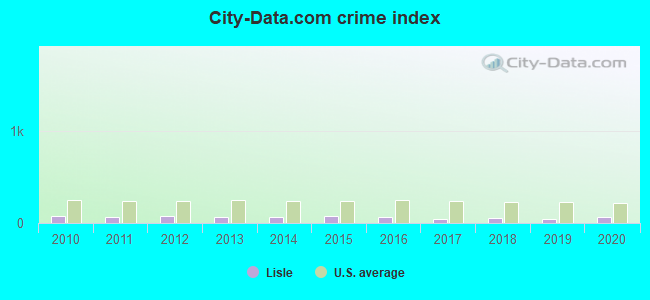
 Recent articles from our blog. Our writers, many of them Ph.D. graduates or candidates, create easy-to-read articles on a wide variety of topics.


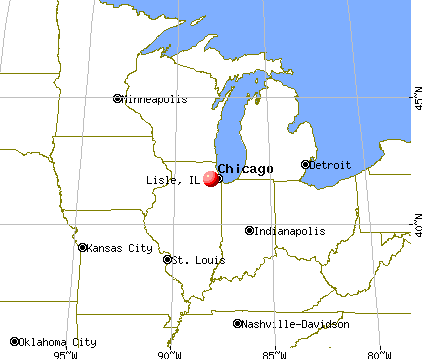
 (4.5 miles
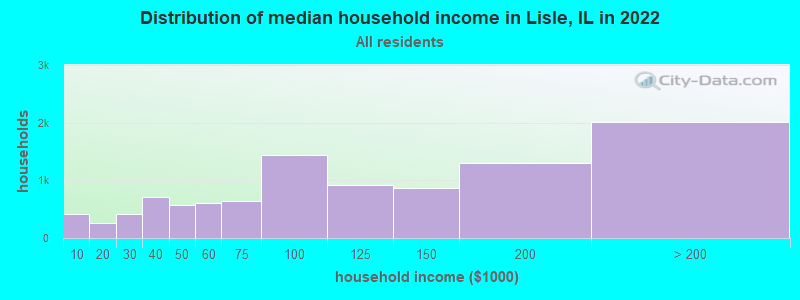
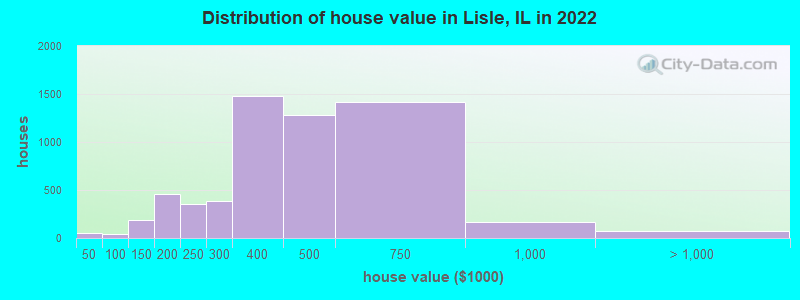
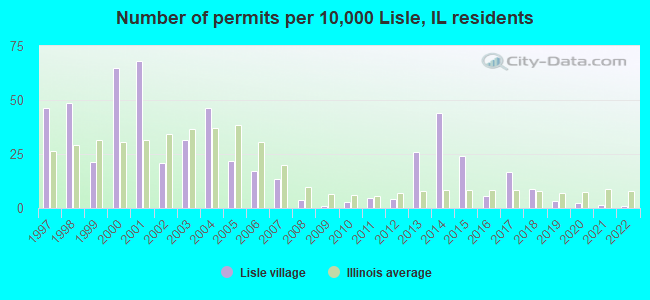
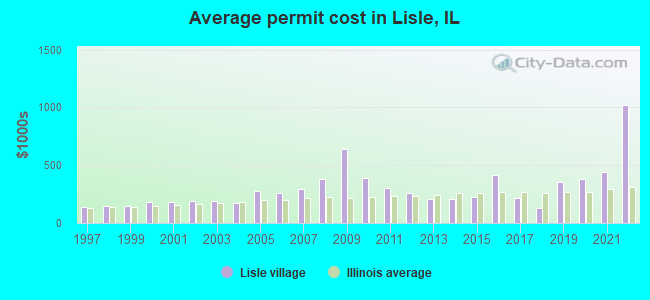
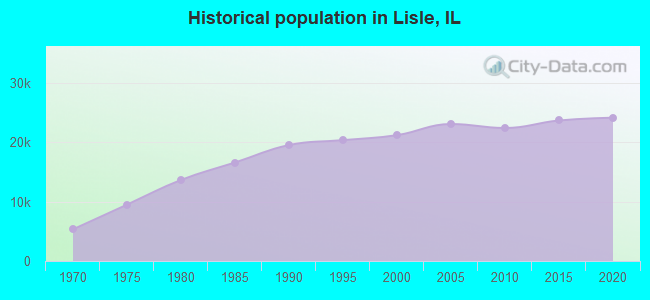
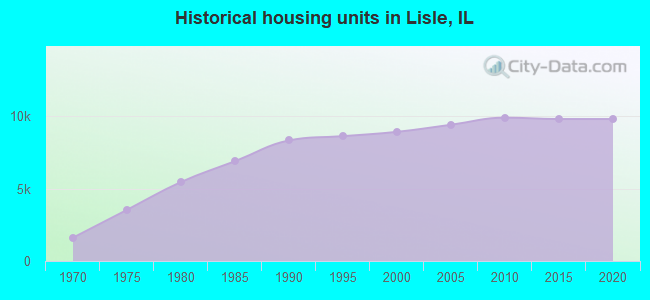
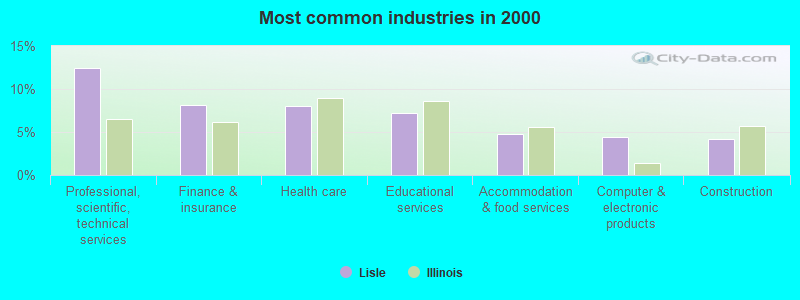
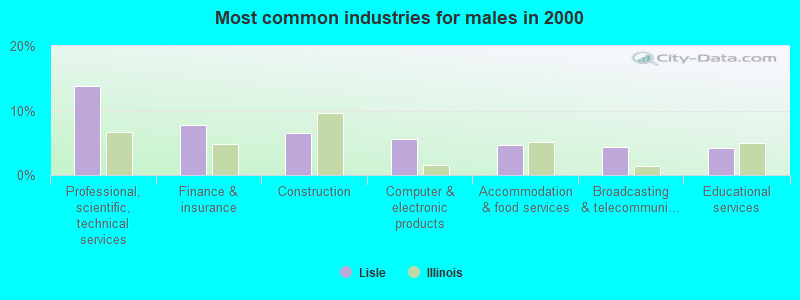
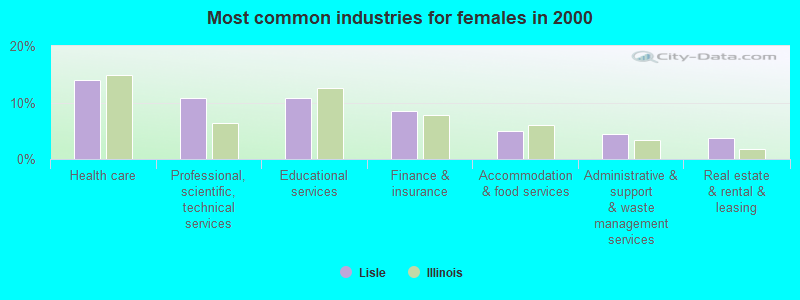
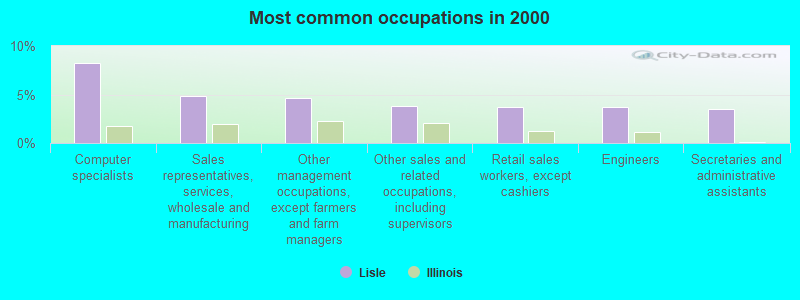
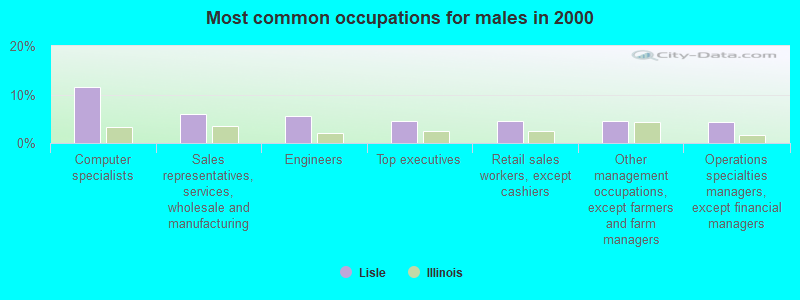
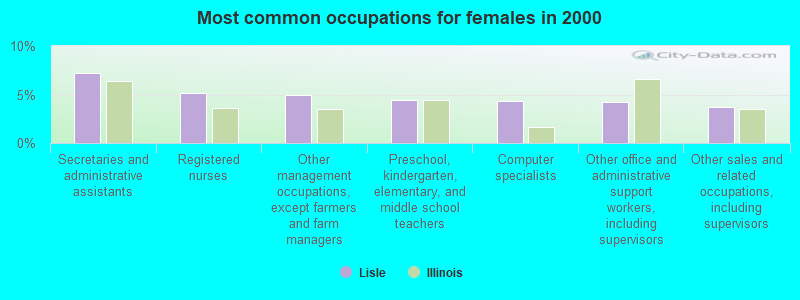
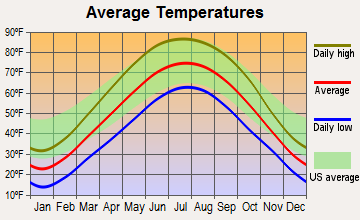
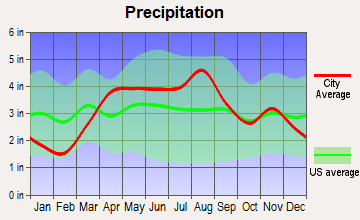
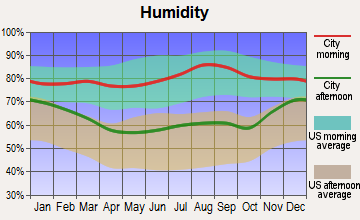
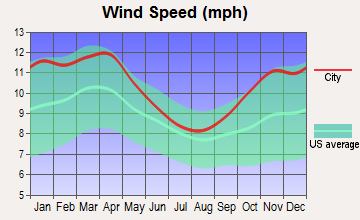
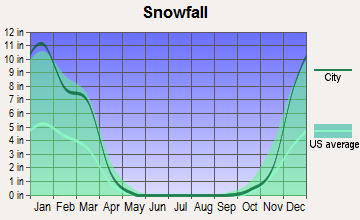
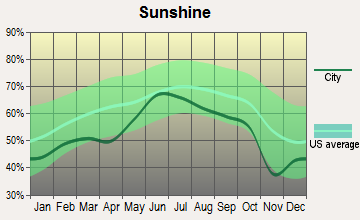
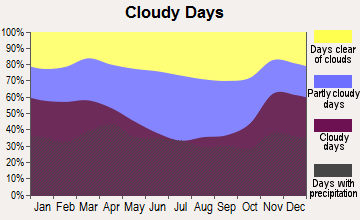
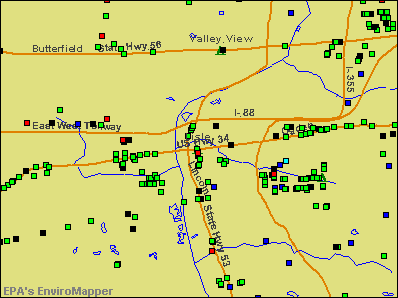

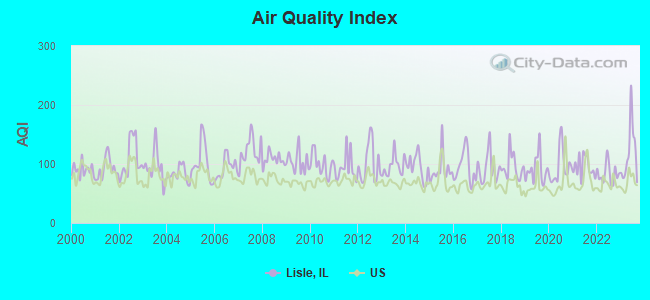
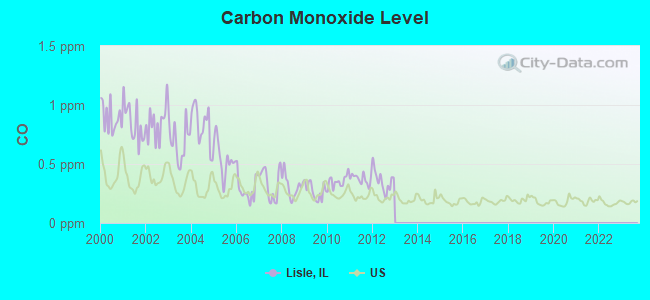
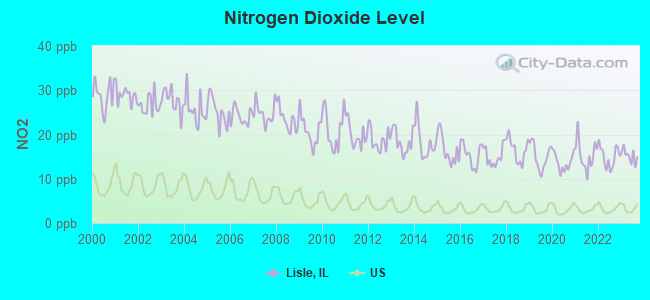
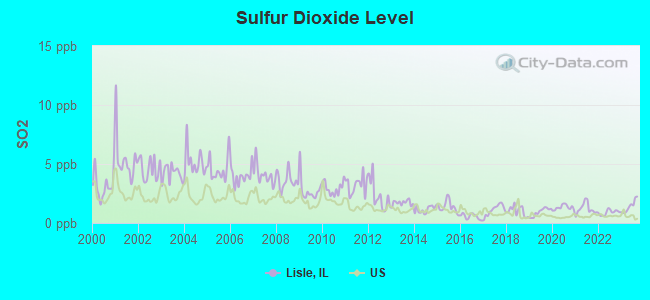
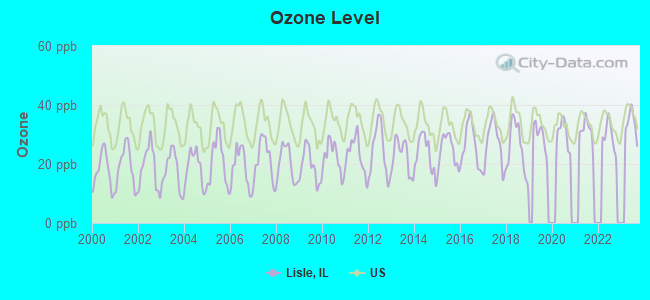
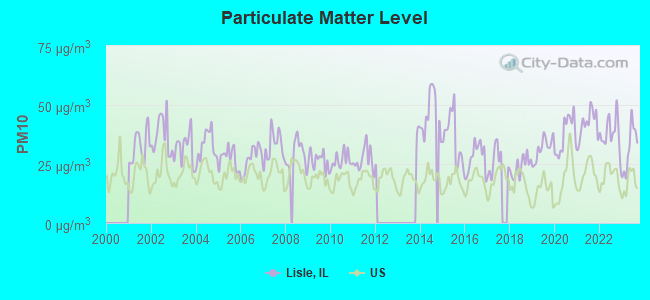
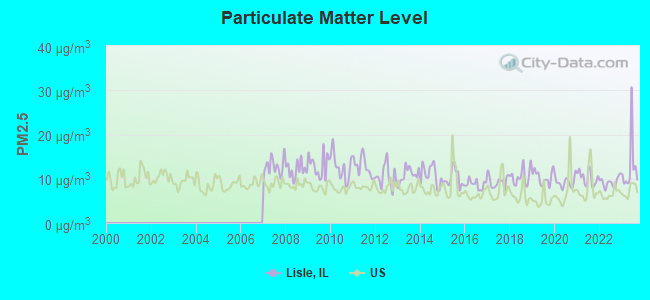
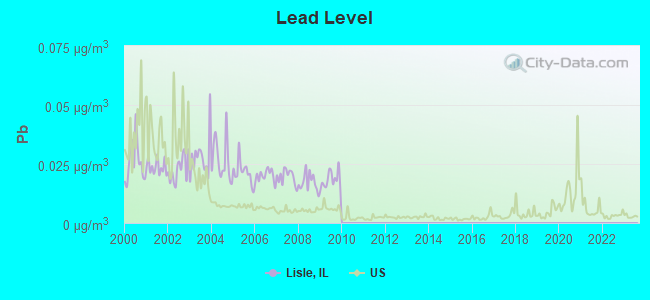

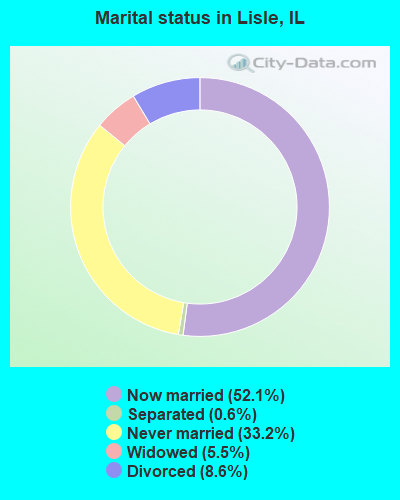
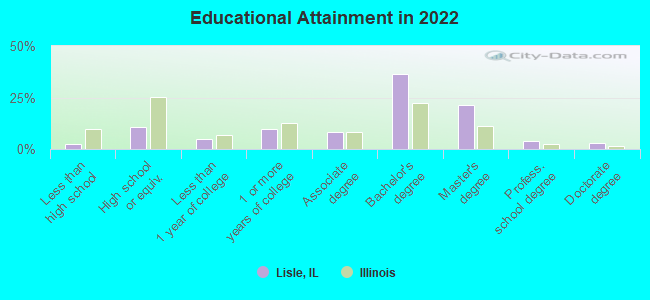

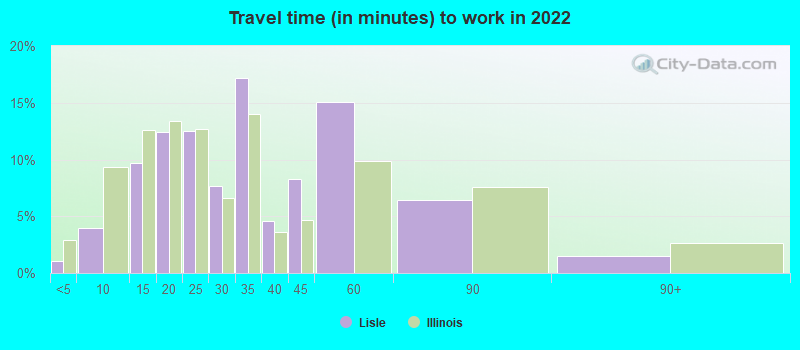
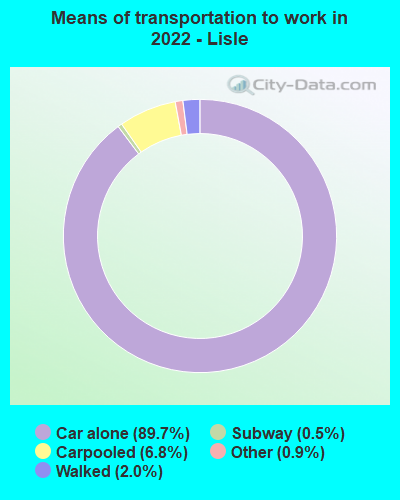
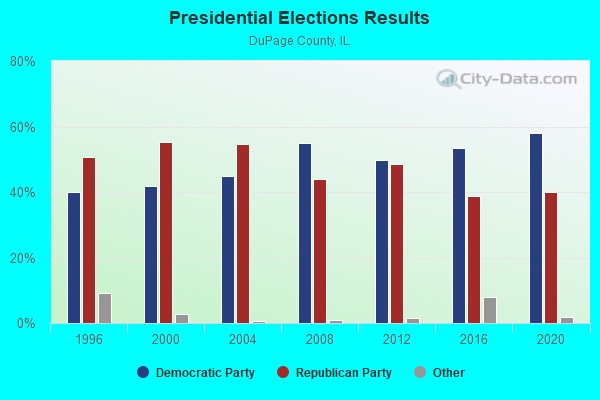
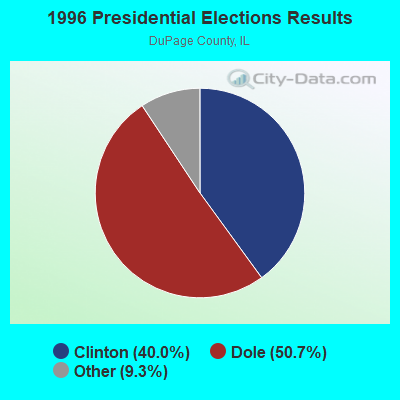
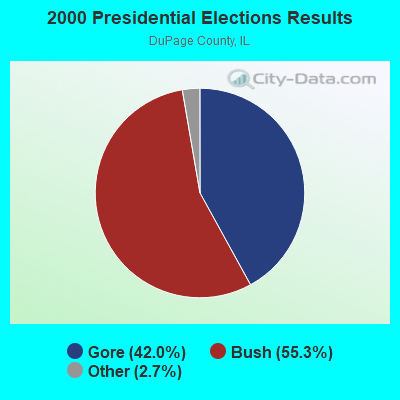
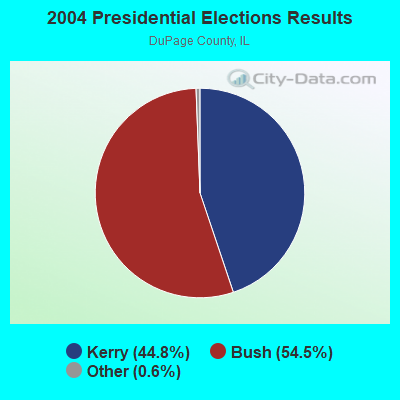
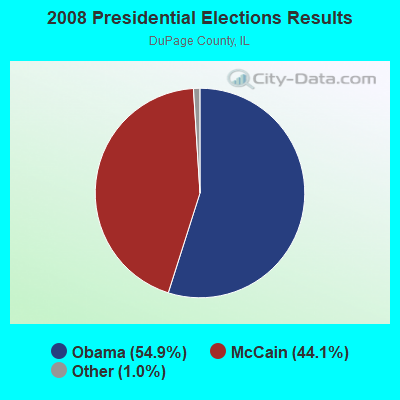
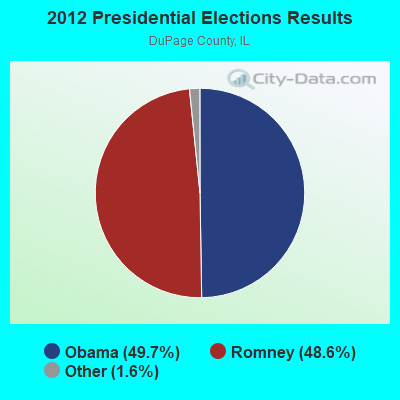
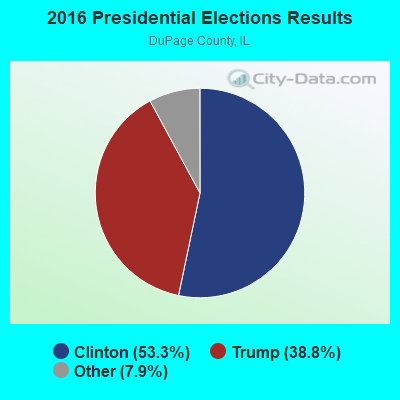
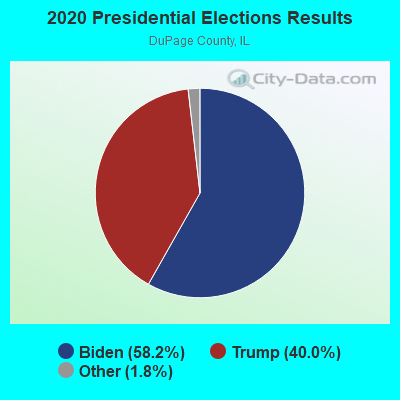
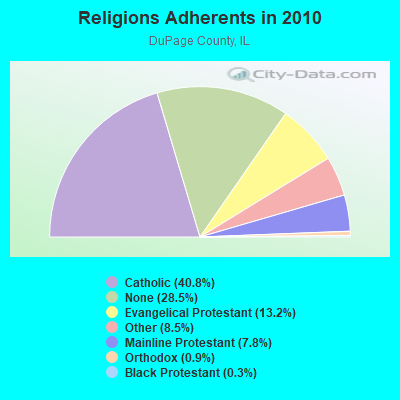
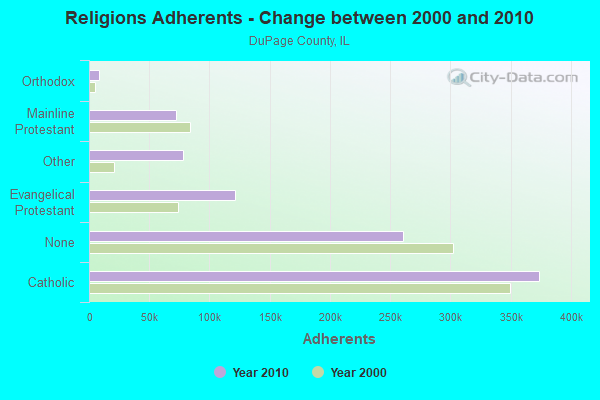
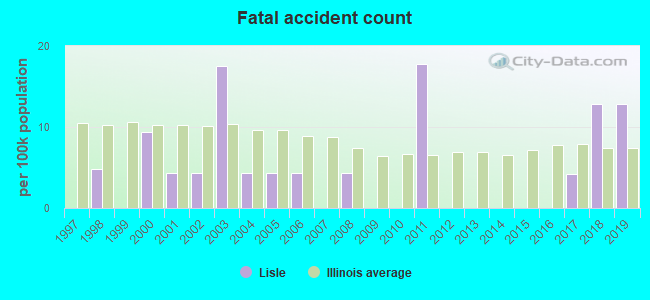
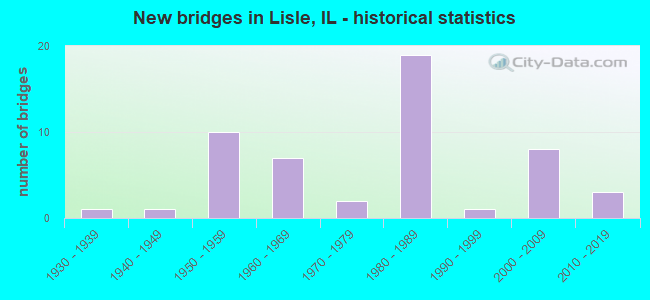
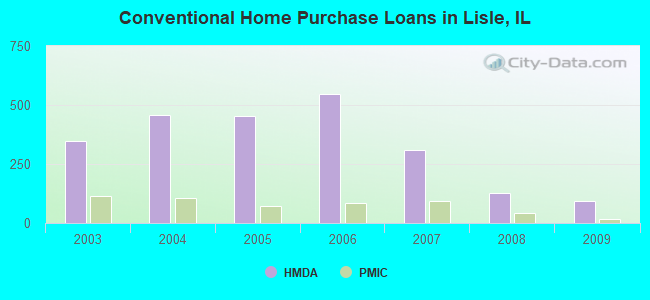
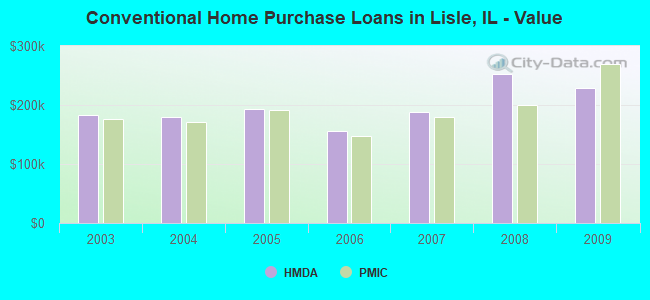
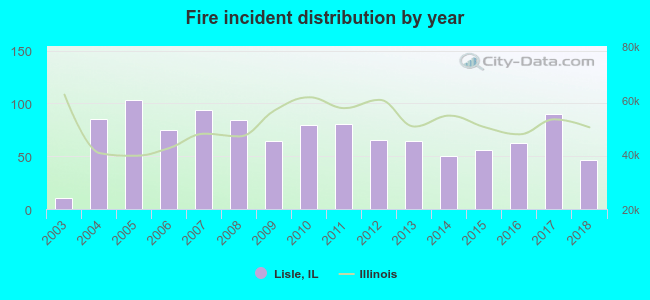 According to the data from the years 2003 - 2018 the average number of fire incidents per year is 69. The highest number of reported fire incidents - 103 took place in 2005, and the least - 10 in 2003. The data has a rising trend.
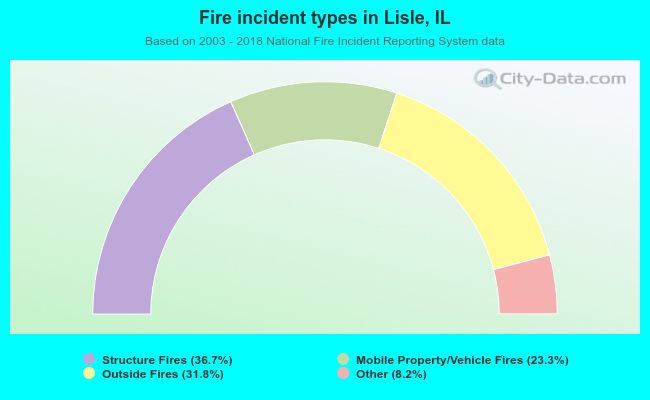 When looking into fire subcategories, the most reports belonged to: Structure Fires (36.7%), and Outside Fires (31.8%).