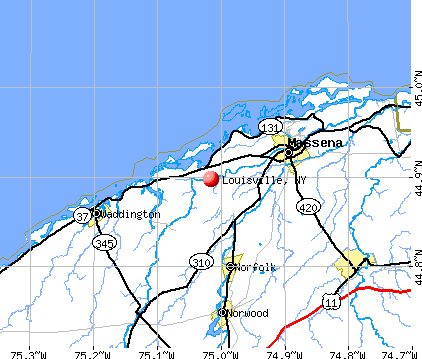
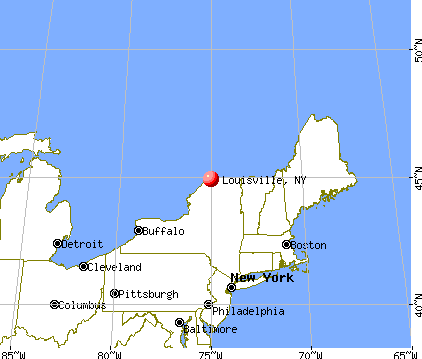
Louisville, New York
Submit your own pictures of this town and show them to the world
- OSM Map
- General Map
- Google Map
- MSN Map
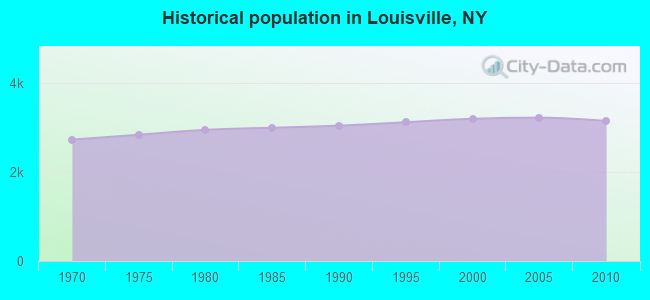
Population change since 2000: -1.6%
 |
| Males: 1,517 | |
| Females: 1,628 |
| Median resident age: | 44.3 years |
| New York median age: | 40.7 years |
Zip codes: 13667.
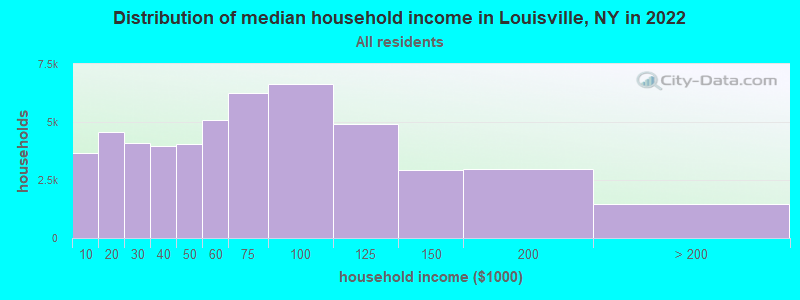
| Louisville: | $72,169 |
| NY: | $79,557 |
Estimated per capita income in 2022: $35,137 (it was $19,127 in 2000)
Louisville town income, earnings, and wages data
Estimated median house or condo value in 2022: $154,822 (it was $75,000 in 2000)
| Louisville: | $154,822 |
| NY: | $400,400 |
Mean prices in 2022: all housing units: $165,040; detached houses: $170,732; townhouses or other attached units: $459,774; in 2-unit structures: $389,853; in 3-to-4-unit structures: $379,409; in 5-or-more-unit structures: $432,214; mobile homes: $74,789; occupied boats, rvs, vans, etc.: $95,045
Detailed information about poverty and poor residents in Louisville, NY


- 3,01295.8%White alone
- 431.4%American Indian alone
- 351.1%Hispanic
- 250.8%Asian alone
- 240.8%Two or more races
- 60.2%Black alone
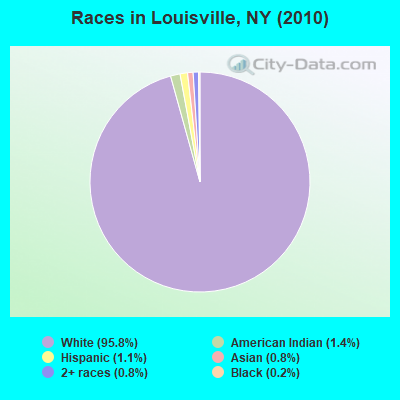
Races in Louisville detailed stats: ancestries, foreign born residents, place of birth
 Recent articles from our blog. Our writers, many of them Ph.D. graduates or candidates, create easy-to-read articles on a wide variety of topics.


 | Bills want new stadium to be completely funded by taxpayer money (902 replies) |
| Why do transplants avoid the Buffalo area? (101 replies) |
| Safest Cities from natural disasters (70 replies) |
| Syracuse, NY Highly Rated and Ranked (43 replies) |
| Buffalo--Boom or Bust (849 replies) |
| Syracuse, NY Population Rankings Using Different Definitions (20 replies) |
Latest news from Louisville, NY collected exclusively by city-data.com from local newspapers, TV, and radio stations
Ancestries: French (24.4%), Irish (15.7%), United States (10.3%), French Canadian (10.0%), English (7.5%), Italian (7.0%).
Current Local Time: EST time zone
Elevation: 220 feet
Land area: 48.2 square miles.
Population density: 65 people per square mile (very low).
185 residents are foreign born (3.6% North America, 1.7% Europe).
| This town: | 5.8% |
| New York: | 20.4% |
| Louisville town: | 2.0% ($1,526) |
| New York: | 1.9% ($2,847) |
Nearest city with pop. 50,000+: Utica, NY  (125.4 miles , pop. 60,651).
Nearest city with pop. 200,000+: Rochester, NY (176.7 miles , pop. 219,773).
Nearest city with pop. 1,000,000+: Bronx, NY (286.2 miles , pop. 1,332,650).
Nearest cities:
), ), ), ), )Latitude: 44.90 N, Longitude: 75.00 W
Area code commonly used in this area: 315

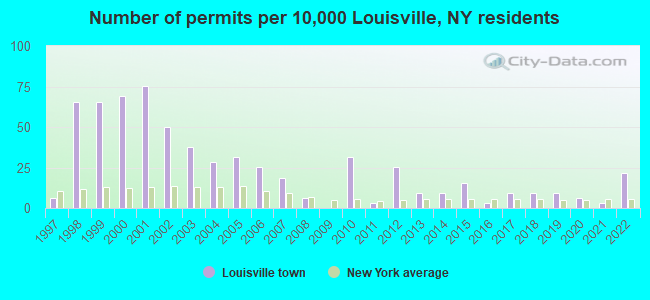
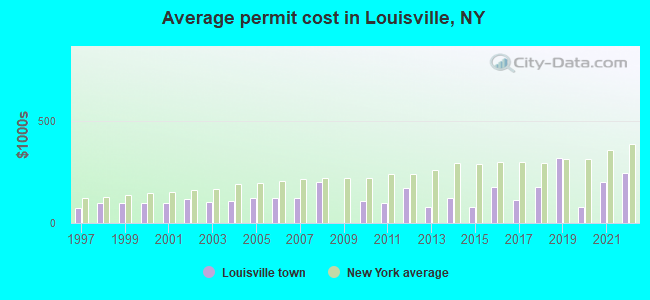
Single-family new house construction building permits:
- 2022: 7 buildings, average cost: $245,700
- 2021: 1 building, cost: $200,000
- 2020: 2 buildings, average cost: $80,000
- 2019: 3 buildings, average cost: $316,700
- 2018: 3 buildings, average cost: $176,700
- 2017: 3 buildings, average cost: $113,300
- 2016: 1 building, cost: $175,000
- 2015: 5 buildings, average cost: $77,800
- 2014: 3 buildings, average cost: $123,300
- 2013: 3 buildings, average cost: $76,700
- 2012: 8 buildings, average cost: $170,600
- 2011: 1 building, cost: $100,000
- 2010: 10 buildings, average cost: $106,900
- 2008: 2 buildings, average cost: $200,000
- 2007: 6 buildings, average cost: $120,000
- 2006: 8 buildings, average cost: $120,000
- 2005: 10 buildings, average cost: $120,000
- 2004: 9 buildings, average cost: $105,600
- 2003: 12 buildings, average cost: $103,800
- 2002: 16 buildings, average cost: $117,300
- 2001: 24 buildings, average cost: $100,000
- 2000: 22 buildings, average cost: $100,000
- 1999: 21 buildings, average cost: $100,000
- 1998: 21 buildings, average cost: $100,000
- 1997: 2 buildings, average cost: $75,000
| Here: | 5.2% |
| New York: | 4.4% |
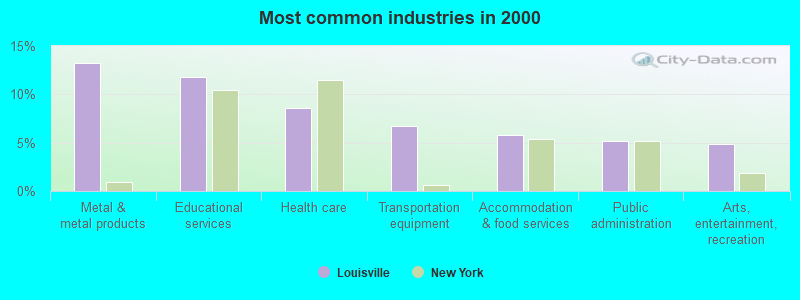
- Metal & metal products (13.3%)
- Educational services (11.8%)
- Health care (8.6%)
- Transportation equipment (6.7%)
- Accommodation & food services (5.8%)
- Public administration (5.2%)
- Arts, entertainment, recreation (4.8%)
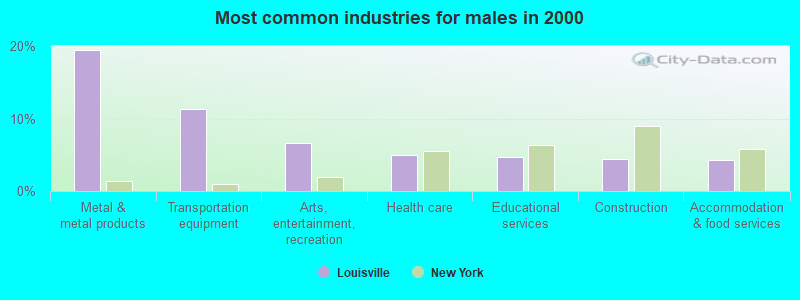
- Metal & metal products (19.4%)
- Transportation equipment (11.2%)
- Arts, entertainment, recreation (6.7%)
- Health care (4.9%)
- Educational services (4.7%)
- Construction (4.4%)
- Accommodation & food services (4.3%)
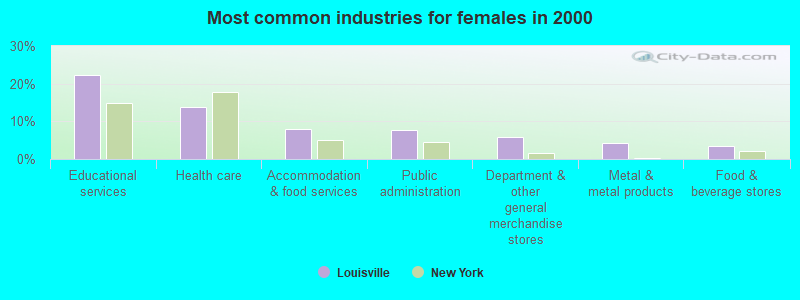
- Educational services (22.2%)
- Health care (13.9%)
- Accommodation & food services (7.9%)
- Public administration (7.8%)
- Department & other general merchandise stores (5.8%)
- Metal & metal products (4.3%)
- Food & beverage stores (3.4%)
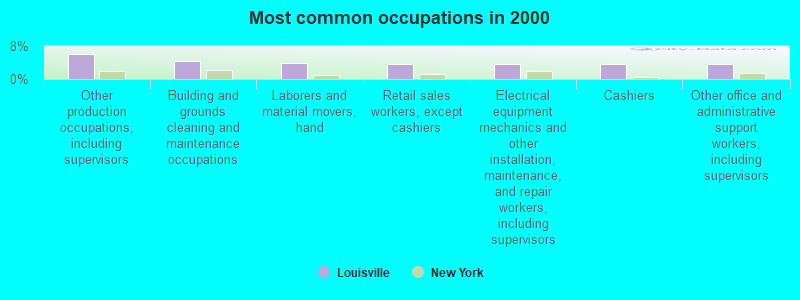
- Other production occupations, including supervisors (6.1%)
- Building and grounds cleaning and maintenance occupations (4.3%)
- Laborers and material movers, hand (4.0%)
- Retail sales workers, except cashiers (3.7%)
- Electrical equipment mechanics and other installation, maintenance, and repair workers, including supervisors (3.6%)
- Cashiers (3.6%)
- Other office and administrative support workers, including supervisors (3.6%)
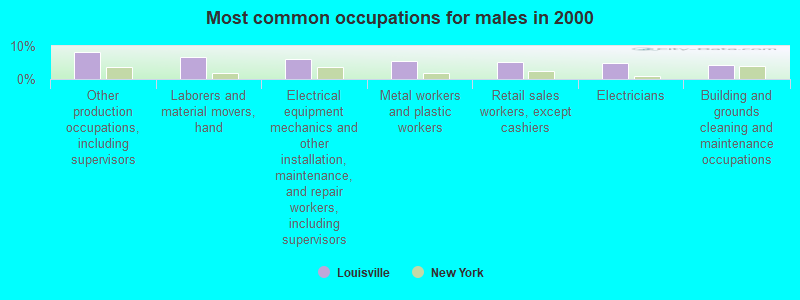
- Other production occupations, including supervisors (8.2%)
- Laborers and material movers, hand (6.7%)
- Electrical equipment mechanics and other installation, maintenance, and repair workers, including supervisors (6.1%)
- Metal workers and plastic workers (5.4%)
- Retail sales workers, except cashiers (5.1%)
- Electricians (4.8%)
- Building and grounds cleaning and maintenance occupations (4.3%)
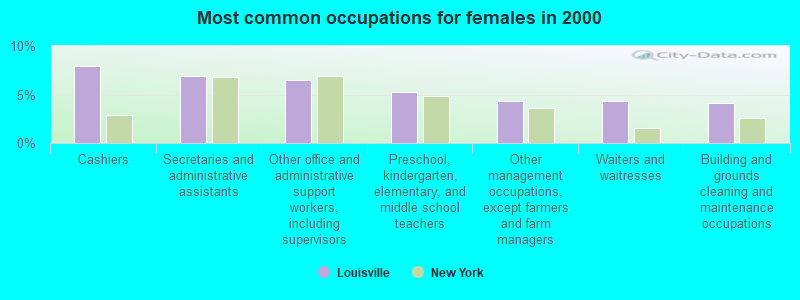
- Cashiers (7.9%)
- Secretaries and administrative assistants (6.9%)
- Other office and administrative support workers, including supervisors (6.5%)
- Preschool, kindergarten, elementary, and middle school teachers (5.2%)
- Other management occupations, except farmers and farm managers (4.3%)
- Waiters and waitresses (4.3%)
- Building and grounds cleaning and maintenance occupations (4.2%)
Average climate in Louisville, New York
Based on data reported by over 4,000 weather stations


(lower is better)
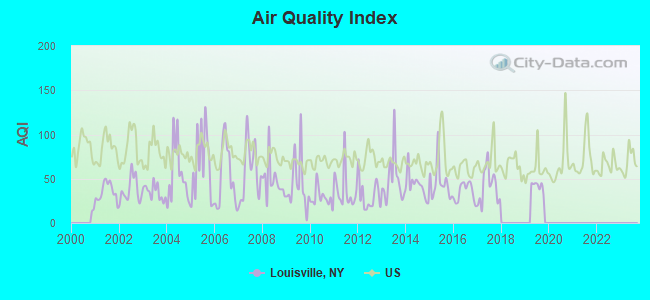
Air Quality Index (AQI) level in 2019 was 41.9. This is significantly better than average.
| City: | 41.9 |
| U.S.: | 72.6 |
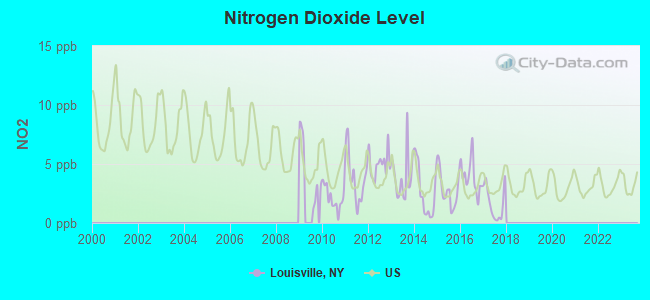
Nitrogen Dioxide (NO2) [ppb] level in 2017 was 1.66. This is significantly better than average. Closest monitor was 16.0 miles away from the city center.
| City: | 1.66 |
| U.S.: | 5.11 |
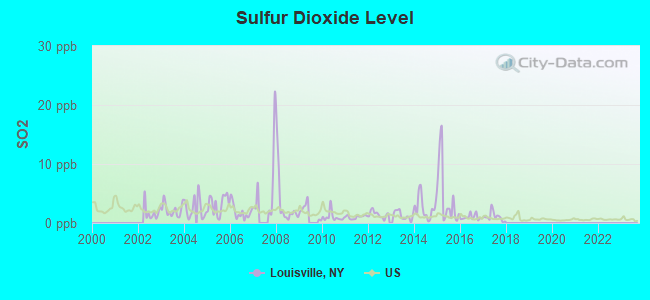
Sulfur Dioxide (SO2) [ppb] level in 2017 was 1.08. This is significantly better than average. Closest monitor was 16.0 miles away from the city center.
| City: | 1.08 |
| U.S.: | 1.51 |
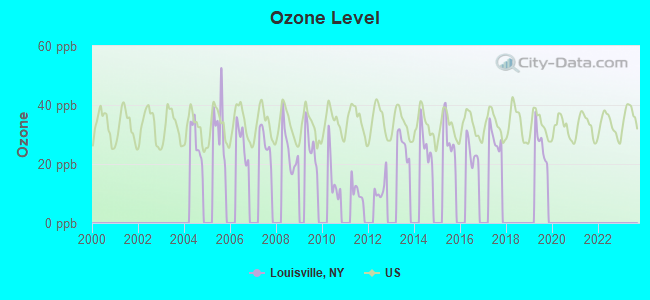
Ozone [ppb] level in 2019 was 26.9. This is better than average. Closest monitor was 16.0 miles away from the city center.
| City: | 26.9 |
| U.S.: | 33.3 |
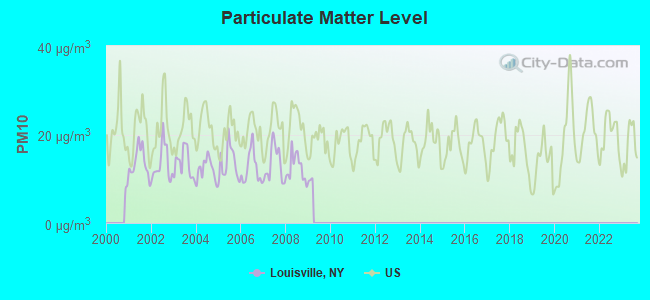
Particulate Matter (PM10) [µg/m3] level in 2008 was 12.5. This is significantly better than average. Closest monitor was 15.0 miles away from the city center.
| City: | 12.5 |
| U.S.: | 19.2 |
Earthquake activity:
Louisville-area historical earthquake activity is above New York state average. It is 78% smaller than the overall U.S. average.On 4/20/2002 at 10:50:47, a magnitude 5.3 (5.3 ML, Depth: 3.0 mi, Class: Moderate, Intensity: VI - VII) earthquake occurred 69.6 miles away from Louisville center
On 10/7/1983 at 10:18:46, a magnitude 5.3 (5.1 MB, 5.3 LG, 5.1 ML) earthquake occurred 73.3 miles away from the city center
On 4/20/2002 at 10:50:47, a magnitude 5.2 (5.2 MB, 4.2 MS, 5.2 MW, 5.0 MW) earthquake occurred 69.4 miles away from the city center
On 1/19/1982 at 00:14:42, a magnitude 4.7 (4.5 MB, 4.7 MD, 4.5 LG, Class: Light, Intensity: IV - V) earthquake occurred 194.6 miles away from the city center
On 10/16/2012 at 23:12:25, a magnitude 4.7 (4.7 ML, Depth: 10.0 mi) earthquake occurred 233.5 miles away from the city center
On 4/8/2003 at 15:06:14, a magnitude 3.7 (3.7 MB, Depth: 6.2 mi, Class: Light, Intensity: II - III) earthquake occurred 38.1 miles away from the city center
Magnitude types: regional Lg-wave magnitude (LG), body-wave magnitude (MB), duration magnitude (MD), local magnitude (ML), surface-wave magnitude (MS), moment magnitude (MW)
Natural disasters:
The number of natural disasters in St. Lawrence County (2) is a lot smaller than the US average (15).Major Disasters (Presidential) Declared: 1
Causes of natural disasters: Flood: 1, Other: 1 (Note: some incidents may be assigned to more than one category).

Hospitals and medical centers near Louisville:
- MASSENA MEMORIAL HOSPITAL Acute Care Hospitals (about 6 miles away; MASSENA, NY)
- MASSENA MEMORIAL HOSPITAL DIALYSIS CENTER (Dialysis Facility, about 6 miles away; MASSENA, NY)
- ST REGIS NURSING HOME INC (Nursing Home, about 6 miles away; MASSENA, NY)
- HIGHLAND NURSING HOME INC (Nursing Home, about 8 miles away; MASSENA, NY)
- POTSDAM NURSING HOME (Nursing Home, about 16 miles away; POTSDAM, NY)
- CANTON-POTSDAM HOSPITAL Acute Care Hospitals (about 16 miles away; POTSDAM, NY)
- HEALTH SERVICES OF NORTHERN NEW YORK INC CHHA (Home Health Center, about 16 miles away; POTSDAM, NY)
Colleges/universities with over 2000 students nearest to Louisville:
- Clarkson University (about 17 miles; Potsdam, NY; Full-time enrollment: 3,472)
- SUNY College at Potsdam (about 17 miles; Potsdam, NY; FT enrollment: 4,307)
- SUNY College of Technology at Canton (about 23 miles; Canton, NY; FT enrollment: 3,411)
- St Lawrence University (about 23 miles; Canton, NY; FT enrollment: 2,501)
- SUNY College at Plattsburgh (about 77 miles; Plattsburgh, NY; FT enrollment: 5,934)
- Jefferson Community College (about 79 miles; Watertown, NY; FT enrollment: 2,886)
- Champlain College (about 94 miles; Burlington, VT; FT enrollment: 2,623)
Points of interest:
Notable locations in Louisville: Wilson Hill Range Lights (A), Rod and Gun Club (B), Saint Lawrence Yacht Club (C), Massena Country Club (D), Louisville Corner (E), Fiftysix Auto Drive-In (F), Leading Light (G). Display/hide their locations on the map
Churches in Louisville include: Louisville Landing Church (A), New Testament Church (B), Pilgrim Holiness Church (C), Saint Lawrence Church (D), Massena Baptist Church (E). Display/hide their locations on the map
Cemetery: Saint Lawrence Cemetery (1). Display/hide its location on the map
Creeks: McConnell Creek (A), Coles Creek (B). Display/hide their locations on the map
Park in Louisville: Wilson Hill State Fish and Game Managemen (1). Display/hide its location on the map
Beach: Massena Beach (A). Display/hide its location on the map
| This town: | 2.3 people |
| New York: | 2.6 people |
| This town: | 66.7% |
| Whole state: | 63.5% |
| This town: | 9.1% |
| Whole state: | 6.8% |
Likely homosexual households (counted as self-reported same-sex unmarried-partner households)
- Lesbian couples: 0.4% of all households
- Gay men: 0.3% of all households
| This town: | 11.1% |
| Whole state: | 14.6% |
| This town: | 6.2% |
| Whole state: | 7.4% |
For population 15 years and over in Louisville:
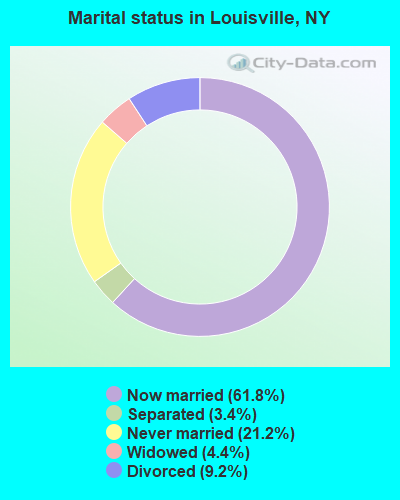
- Never married: 21.2%
- Now married: 61.8%
- Separated: 3.4%
- Widowed: 4.4%
- Divorced: 9.2%
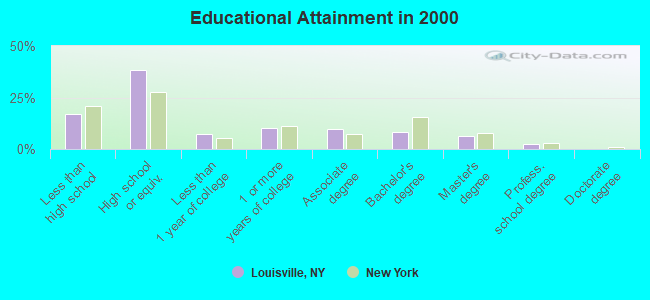
For population 25 years and over in Louisville:
- High school or higher: 83.0%
- Bachelor's degree or higher: 17.3%
- Graduate or professional degree: 8.8%
- Unemployed: 6.8%
- Mean travel time to work (commute): 19.2 minutes
| Here: | 11.2 |
| New York average: | 14.2 |
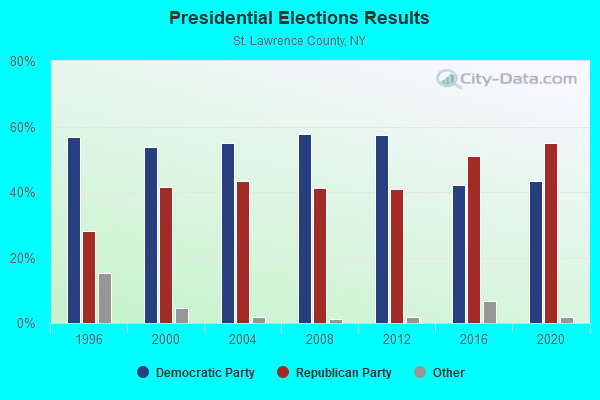
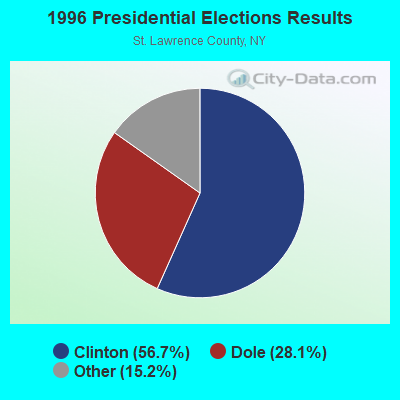
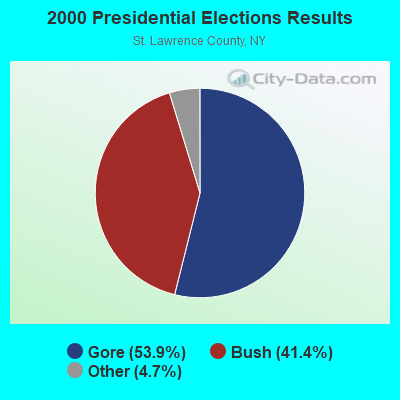
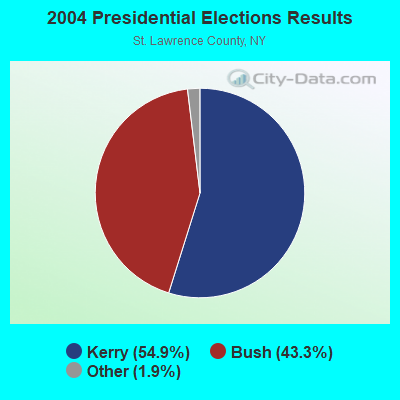
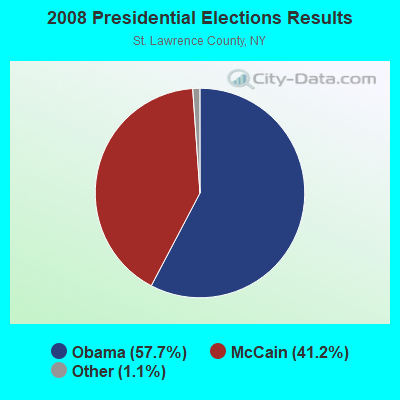
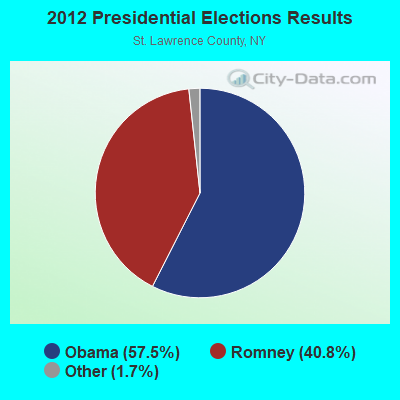
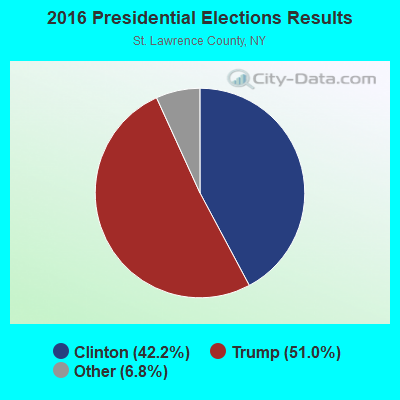
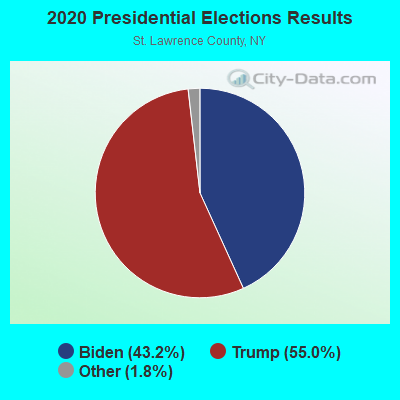
Graphs represent county-level data. Detailed 2008 Election Results
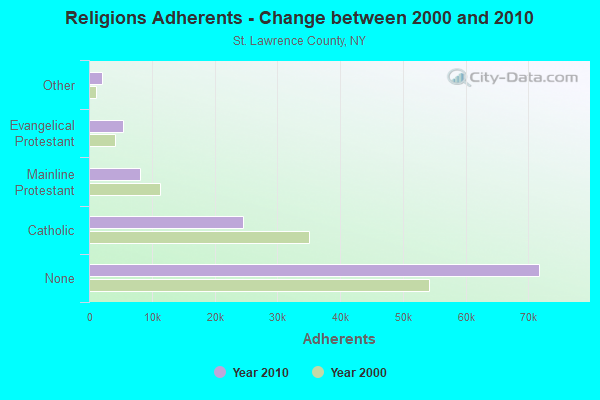
Religion statistics for Louisville, NY (based on St. Lawrence County data)
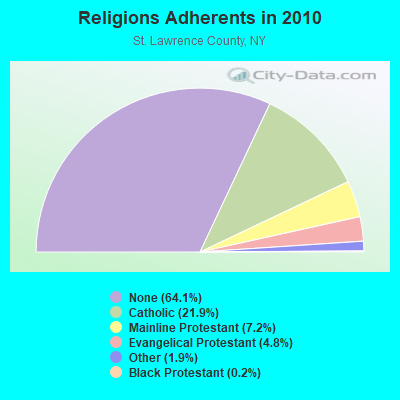
| Religion | Adherents | Congregations |
|---|---|---|
| Catholic | 24,478 | 32 |
| Mainline Protestant | 8,075 | 72 |
| Evangelical Protestant | 5,364 | 55 |
| Other | 2,093 | 11 |
| Black Protestant | 179 | 1 |
| None | 71,755 | - |
Food Environment Statistics:
| This county: | 2.55 / 10,000 pop. |
| New York: | 4.13 / 10,000 pop. |
| Here: | 0.09 / 10,000 pop. |
| State: | 0.06 / 10,000 pop. |
| This county: | 1.18 / 10,000 pop. |
| New York: | 0.92 / 10,000 pop. |
| This county: | 5.01 / 10,000 pop. |
| State: | 1.68 / 10,000 pop. |
| St. Lawrence County: | 9.66 / 10,000 pop. |
| New York: | 8.82 / 10,000 pop. |
| Here: | 8.5% |
| New York: | 8.2% |
| St. Lawrence County: | 29.6% |
| New York: | 23.8% |
| St. Lawrence County: | 13.3% |
| New York: | 15.6% |
Strongest AM radio stations in Louisville:
- WYBG (1050 AM; 1 kW; MASSENA, NY)
- WMSA (1340 AM; 1 kW; MASSENA, NY; Owner: SEAWAY BROADCASTING, INC.)
- WICY (1490 AM; 50 kW; MALONE, NY; Owner: CARTIER COMMUNICATIONS INC.)
- WCHP (760 AM; 35 kW; CHAMPLAIN, NY; Owner: CHAMPLAIN RADIO, INC.)
- WGY (810 AM; 50 kW; SCHENECTADY, NY; Owner: CLEAR CHANNEL BROADCASTING LICENSES, INC.)
- WPDM (1470 AM; 1 kW; POTSDAM, NY; Owner: ST. LAWRENCE RADIO, INC.)
- WNNZ (640 AM; 50 kW; WESTFIELD, MA; Owner: CLEAR CHANNEL BROADCASTING LICENSES, INC.)
- WPTR (1540 AM; 50 kW; ALBANY, NY; Owner: KIMTRON, INC.)
- WHAM (1180 AM; 50 kW; ROCHESTER, NY; Owner: CITICASTERS LICENSES, L.P.)
- WIRD (920 AM; 5 kW; LAKE PLACID, NY; Owner: RADIO LAKE PLACID INC)
- WRKO (680 AM; 50 kW; BOSTON, MA; Owner: ENTERCOM BOSTON LICENSE, LLC)
- WSLB (1400 AM; 1 kW; OGDENSBURG, NY; Owner: CLANCY-MANCE COMMUNICATIONS NORTH, INC.)
- WCRN (830 AM; 50 kW; WORCESTER, MA; Owner: CARTER BROADCASTING CORPORATION)
Strongest FM radio stations in Louisville:
- WYUL (94.7 FM; CHATEAUGAY, NY; Owner: CARTIER COMMUNICATIONS INC.)
- WRCD (101.5 FM; CANTON, NY; Owner: RADIO POWER INC.)
- WYSX (98.7 FM; OGDENSBURG, NY; Owner: WATERS COMMUNICATIONS INC.)
- WYSI (96.7 FM; CANTON, NY; Owner: RADIO POWER, INC.)
TV broadcast stations around Louisville:
- WNYF-LP (Channel 28; MASSENA, NY; Owner: UNITED COMMUNICATIONS CORPORATION)
- W14BU (Channel 14; MASSENA, NY; Owner: DAVID WELCH)
- W25BX (Channel 25; MASSENA, NY; Owner: NELLIE GAJESKI)
- W36BN (Channel 36; MASSENA, NY; Owner: NELLIE GAJESKI)
- W65CR (Channel 65; MASSENA, NY; Owner: ROBERT G. JUILLERAT)
- W20BA (Channel 20; MASSENA, NY; Owner: NATIONAL MINORITY T.V., INC.)
- WNPI-TV (Channel 18; NORWOOD, NY; Owner: ST. LAWRENCE VALLEY EDUCATIONAL TV COUNCIL, INC)
- National Bridge Inventory (NBI) Statistics
- 5Number of bridges
- 138ft / 42.0mTotal length
- $14,592,000Total costs
- 10,924Total average daily traffic
- 1,164Total average daily truck traffic
- 11,924Total future (year 2038) average daily traffic
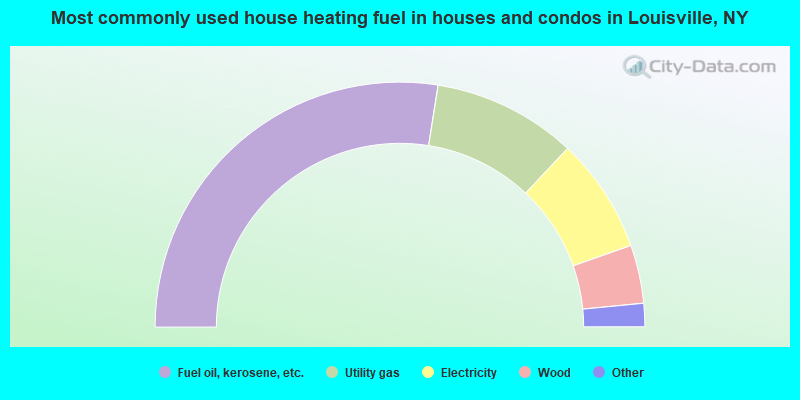
- 55.0%Fuel oil, kerosene, etc.
- 19.0%Utility gas
- 15.2%Electricity
- 7.7%Wood
- 2.6%Bottled, tank, or LP gas
- 0.5%Other fuel
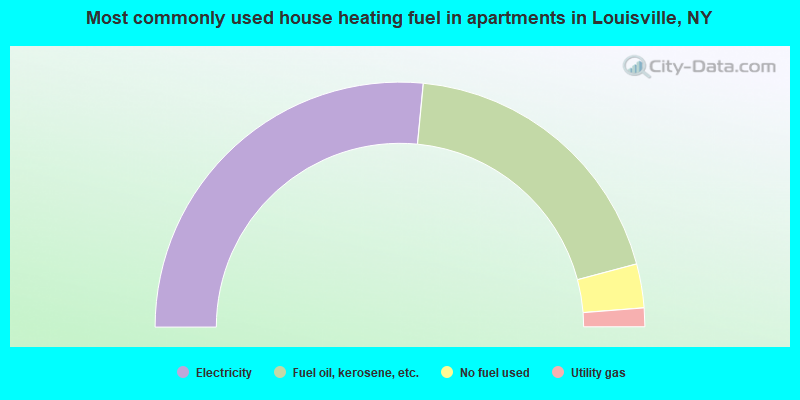
- 53.1%Electricity
- 38.7%Fuel oil, kerosene, etc.
- 5.8%No fuel used
- 2.5%Utility gas
Louisville compared to New York state average:
- Median house value significantly below state average.
- Unemployed percentage below state average.
- Black race population percentage significantly below state average.
- Hispanic race population percentage significantly below state average.
- Foreign-born population percentage significantly below state average.
- Renting percentage below state average.
- Length of stay since moving in significantly above state average.
- Number of rooms per house significantly below state average.
- House age significantly below state average.
- Number of college students below state average.
- Percentage of population with a bachelor's degree or higher below state average.