Lower Peninsula, Washington
Submit your own pictures of this place and show them to the world
- OSM Map
- General Map
- Google Map
- MSN Map

| Males: 8,270 | |
| Females: 6,597 |
| Median resident age: | 38.8 years |
| Washington median age: | 35.3 years |
Zip code: 98349
| Lower Peninsula: | $99,308 |
| WA: | $91,306 |
Estimated per capita income in 2022: $43,799 (it was $20,373 in 2000)
Lower Peninsula CCD income, earnings, and wages data
Estimated median house or condo value in 2022: $528,058 (it was $141,600 in 2000)
| Lower Peninsula: | $528,058 |
| WA: | $569,500 |
Mean prices in 2022: all housing units: $571,140; detached houses: $606,667; townhouses or other attached units: $534,248; in 2-unit structures: $606,121; in 3-to-4-unit structures: $262,548; in 5-or-more-unit structures: $407,089; mobile homes: $200,236; occupied boats, rvs, vans, etc.: $40,477
Lower Peninsula, WA residents, houses, and apartments details
Detailed information about poverty and poor residents in Lower Peninsula, WA


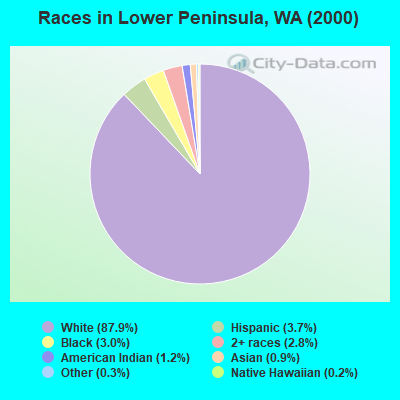
- 11,88687.9%White alone
- 4943.7%Hispanic
- 4003.0%Black alone
- 3852.8%Two or more races
- 1631.2%American Indian alone
- 1260.9%Asian alone
- 420.3%Other race alone
- 260.2%Native Hawaiian and Other
Pacific Islander alone
Races in Lower Peninsula detailed stats: ancestries, foreign born residents, place of birth
 Recent articles from our blog. Our writers, many of them Ph.D. graduates or candidates, create easy-to-read articles on a wide variety of topics.

Current Local Time: PST time zone
Land area: 69.2 square miles.
Population density: 215 people per square mile (very low).

| Lower Peninsula CCD: | 1.1% ($1,610) |
| Washington: | 1.2% ($1,915) |
Nearest city with pop. 50,000+: Lakewood, WA  (12.9 miles , pop. 58,211).
Nearest city with pop. 200,000+: Seattle, WA (31.3 miles , pop. 563,374).
Nearest city with pop. 1,000,000+: Los Angeles, CA (940.0 miles , pop. 3,694,820).
Nearest cities:
), ), ), ), ), ), )Latitude: 47.27 N, Longitude: 122.75 W

| Here: | 5.5% |
| Washington: | 4.6% |
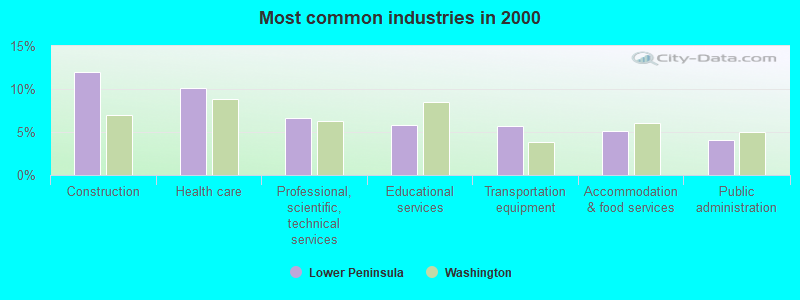
- Construction (12.0%)
- Health care (10.1%)
- Professional, scientific, technical services (6.6%)
- Educational services (5.8%)
- Transportation equipment (5.7%)
- Accommodation & food services (5.1%)
- Public administration (4.0%)
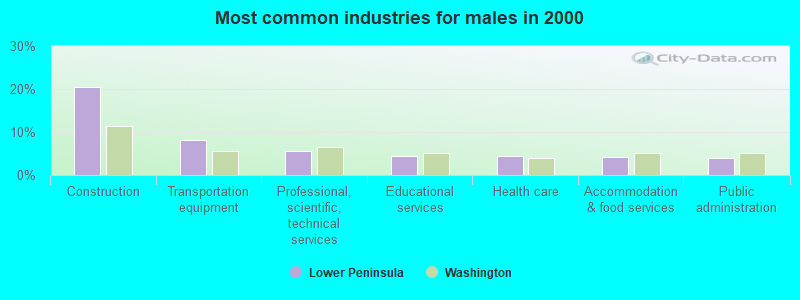
- Construction (20.5%)
- Transportation equipment (8.2%)
- Professional, scientific, technical services (5.7%)
- Educational services (4.5%)
- Health care (4.4%)
- Accommodation & food services (4.2%)
- Public administration (3.9%)
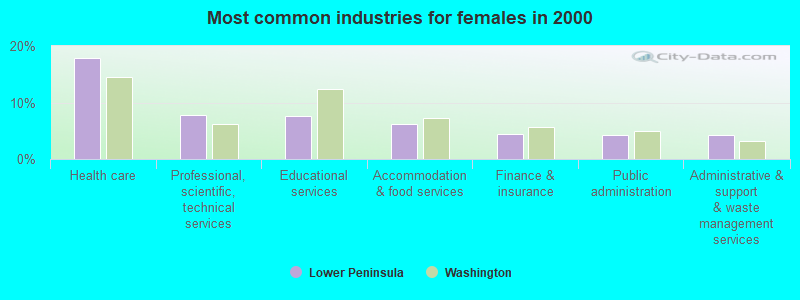
- Health care (17.9%)
- Professional, scientific, technical services (7.9%)
- Educational services (7.6%)
- Accommodation & food services (6.2%)
- Finance & insurance (4.4%)
- Public administration (4.3%)
- Administrative & support & waste management services (4.2%)
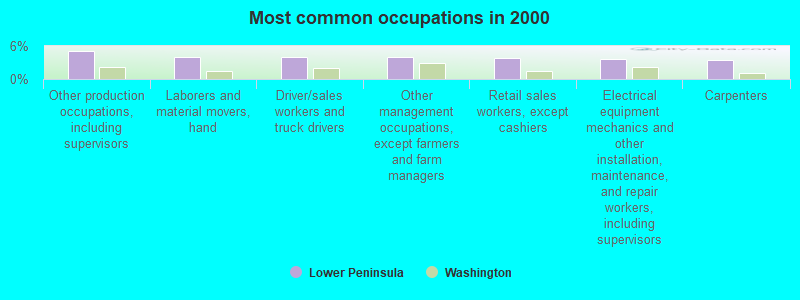
- Other production occupations, including supervisors (5.2%)
- Laborers and material movers, hand (4.1%)
- Driver/sales workers and truck drivers (4.1%)
- Other management occupations, except farmers and farm managers (3.9%)
- Retail sales workers, except cashiers (3.8%)
- Electrical equipment mechanics and other installation, maintenance, and repair workers, including supervisors (3.6%)
- Carpenters (3.5%)
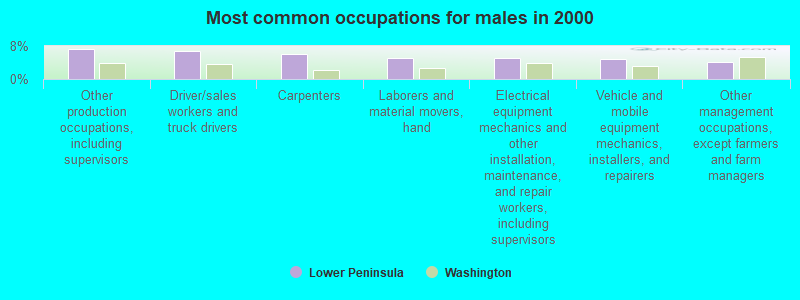
- Other production occupations, including supervisors (7.2%)
- Driver/sales workers and truck drivers (6.9%)
- Carpenters (6.1%)
- Laborers and material movers, hand (5.1%)
- Electrical equipment mechanics and other installation, maintenance, and repair workers, including supervisors (5.1%)
- Vehicle and mobile equipment mechanics, installers, and repairers (4.8%)
- Other management occupations, except farmers and farm managers (4.2%)
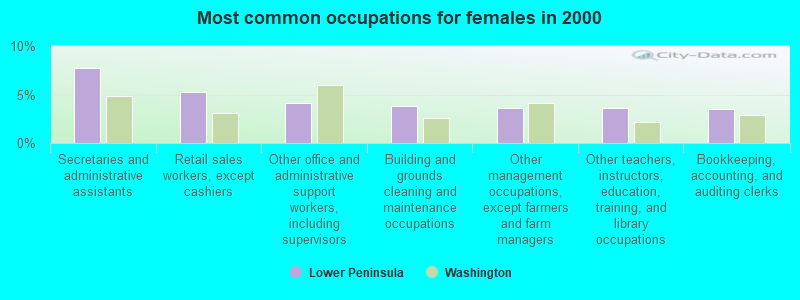
- Secretaries and administrative assistants (7.8%)
- Retail sales workers, except cashiers (5.2%)
- Other office and administrative support workers, including supervisors (4.1%)
- Building and grounds cleaning and maintenance occupations (3.8%)
- Other management occupations, except farmers and farm managers (3.6%)
- Other teachers, instructors, education, training, and library occupations (3.6%)
- Bookkeeping, accounting, and auditing clerks (3.5%)
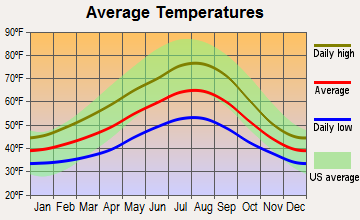
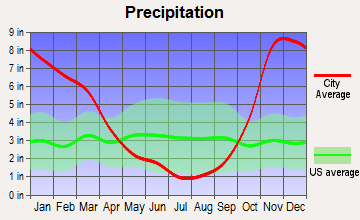
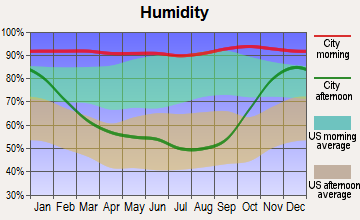
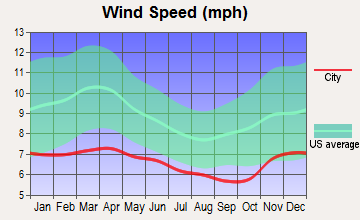
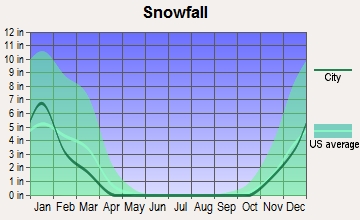
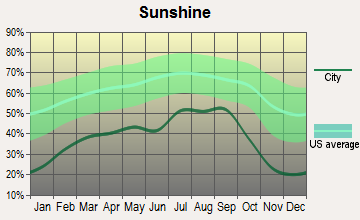
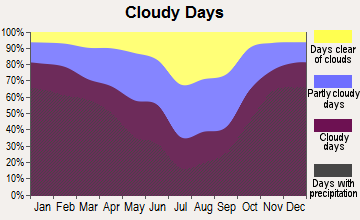
Average climate in Lower Peninsula, Washington
Based on data reported by over 4,000 weather stations
(lower is better)
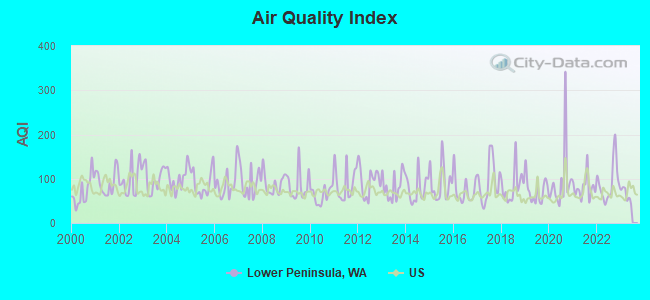
Air Quality Index (AQI) level in 2022 was 91.9. This is worse than average.
| City: | 91.9 |
| U.S.: | 72.6 |
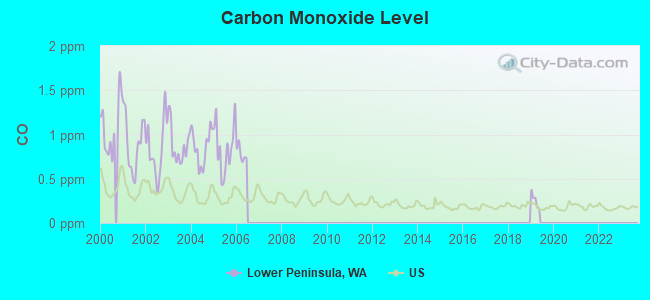
Carbon Monoxide (CO) [ppm] level in 2005 was 0.848. This is significantly worse than average. Closest monitor was 14.4 miles away from the city center.
| City: | 0.848 |
| U.S.: | 0.251 |
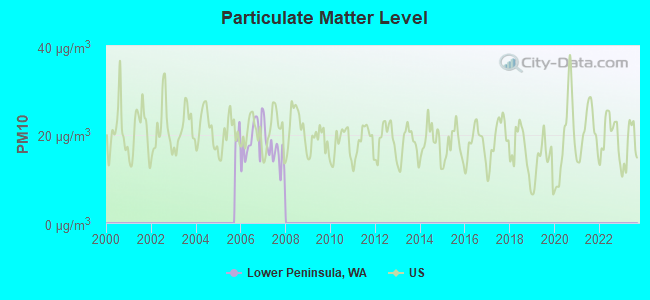
Particulate Matter (PM10) [µg/m3] level in 2007 was 16.4. This is about average. Closest monitor was 14.8 miles away from the city center.
| City: | 16.4 |
| U.S.: | 19.2 |
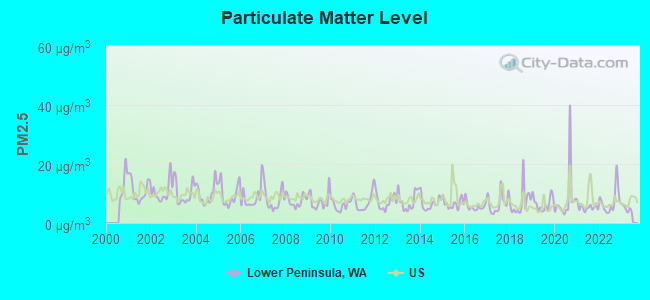
Particulate Matter (PM2.5) [µg/m3] level in 2022 was 7.33. This is about average. Closest monitor was 15.2 miles away from the city center.
| City: | 7.33 |
| U.S.: | 8.11 |
Earthquake activity:
Lower Peninsula-area historical earthquake activity is significantly above Washington state average. It is 1341% greater than the overall U.S. average.On 4/13/1949 at 19:55:42, a magnitude 7.0 (7.0 UK, Class: Major, Intensity: VIII - XII) earthquake occurred 11.8 miles away from Lower Peninsula center, causing $80,000,000 total damage
On 2/28/2001 at 18:54:32, a magnitude 6.8 (6.8 MD, Depth: 32.2 mi, Class: Strong, Intensity: VII - IX) earthquake occurred 8.5 miles away from Lower Peninsula center
On 2/28/2001 at 18:54:32, a magnitude 6.8 (6.5 MB, 6.6 MS, 6.8 MW) earthquake occurred 14.9 miles away from Lower Peninsula center, causing $2,000,000,000 total damage and $305,000,000 insured losses
On 4/29/1965 at 15:28:43, a magnitude 6.6 (6.6 UK) earthquake occurred 19.8 miles away from Lower Peninsula center, causing $28,000,000 total damage
On 7/3/1999 at 01:43:54, a magnitude 5.8 (5.4 MB, 5.5 MS, 5.8 MW, 5.3 ME, Depth: 25.2 mi, Class: Moderate, Intensity: VI - VII) earthquake occurred 27.1 miles away from the city center
On 1/31/1922 at 13:17:28, a magnitude 7.6 (7.6 UK) earthquake occurred 475.4 miles away from Lower Peninsula center
Magnitude types: body-wave magnitude (MB), duration magnitude (MD), energy magnitude (ME), surface-wave magnitude (MS), moment magnitude (MW)
Natural disasters:
The number of natural disasters in Pierce County (21) is greater than the US average (15).Major Disasters (Presidential) Declared: 20
Emergencies Declared: 1
Causes of natural disasters: Floods: 13, Storms: 10, Mudslides: 5, Landslides: 4, Winter Storms: 4, Earthquakes: 2, Heavy Rains: 2, Winds: 2, Hurricane: 1, Volcanic Eruption: 1, Other: 1 (Note: some incidents may be assigned to more than one category).
Hospitals and medical centers near Lower Peninsula:
- MANOR CARE OF GIG HARBOR WA, LLC (Nursing Home, about 9 miles away; GIG HARBOR, WA)
- ST JOSEPH DIALYSIS CENTER GIG HARBOR (Dialysis Facility, about 9 miles away; GIG HARBOR, WA)
- ST ANTHONY HOSPITAL Acute Care Hospitals (about 9 miles away; GIG HARBOR, WA)
- COTTESMORE OF LIFE CARE (Nursing Home, about 10 miles away; GIG HARBOR, WA)
- ABILENE HOUSE INC (Nursing Home, about 11 miles away; TACOMA, WA)
- FRANCISCAN HOSPICE (Hospital, about 11 miles away; UNIVERSITY PLACE, WA)
- HIGHLANDS DEMENTIA CARE CTR (Nursing Home, about 11 miles away; TACOMA, WA)
Amtrak stations near Lower Peninsula:
- 16 miles: TACOMA (1001 PUYALLUP AVE.) . Services: ticket office, partially wheelchair accessible, enclosed waiting area, public restrooms, public payphones, full-service food facilities, free short-term parking, free long-term parking, call for taxi service, intercity bus service, public transit connection.
- 20 miles: OLYMPIA/LACEY (OLYMPIA, 6600 YELM HWY. S.E.) . Services: fully wheelchair accessible, enclosed waiting area, public restrooms, public payphones, vending machines, free short-term parking, free long-term parking, call for car rental service, call for taxi service, public transit connection.
Colleges/universities with over 2000 students nearest to Lower Peninsula:
- Pierce College at Fort Steilacoom (about 11 miles; Lakewood, WA; Full-time enrollment: 5,228)
- Tacoma Community College (about 11 miles; Tacoma, WA; FT enrollment: 6,622)
- University of Puget Sound (about 13 miles; Tacoma, WA; FT enrollment: 2,788)
- Clover Park Technical College (about 14 miles; Lakewood, WA; FT enrollment: 4,185)
- Bates Technical College (about 15 miles; Tacoma, WA; FT enrollment: 4,929)
- University of Washington-Tacoma Campus (about 15 miles; Tacoma, WA; FT enrollment: 3,788)
- Pacific Lutheran University (about 17 miles; Tacoma, WA; FT enrollment: 3,548)
Points of interest:
Notable locations in Lower Peninsula: Camp Seymour (A), Delano Beach (B), Drayton Light (C), McDermott Point Lighthouse (D), Elgin (E), Anderson Island Ferry Landing (F), Sunshine Beach (G), Villa Beach (H), Yoman Dock (I), Longbranch Improvement Club Marina (J), Lakebay Marina (K), McNeil Island Sewage Treatment Plant (L), Rocky Bay Health Care Facility (M), Pierce County Fire Protection District 16 Station 6 (N), Pierce County Fire Protection District 16 Station 3 (O), Pierce County Fire Protection District 16 Station 5 (P), Pierce County Fire Protection District 27 (Q), Mcneil Island Fire Department (R), Pierce County Fire Protection District 16 Station 2 (S), Pierce County Fire Protection District 16 Station 4 (T). Display/hide their locations on the map
Cemeteries: Hillcrest Cemetery (1), Anderson Island Cemetery (2). Display/hide their locations on the map
Lakes and reservoirs: Little Palmer Lake (A), Lake Minterwood (B), Bay Lake (C), Palmer Lake (D), Florence Lake (E), Josephine Lake (F), Doyle Pond (G), Stansberry Lake (H). Display/hide their locations on the map
Creeks: Vaughn Creek (A), Rocky Creek (B), Bradley Creek (C), Huge Creek (D), Luhr Creek (E). Display/hide their locations on the map
Parks in Lower Peninsula include: Eagle Island State Marine Park (1), Penrose Point State Park (2). Display/hide their locations on the map
Beach: Joemma Beach (A). Display/hide its location on the map
| This place: | 2.6 people |
| Washington: | 2.5 people |
| This place: | 65.3% |
| Whole state: | 66.5% |
| This place: | 6.0% |
| Whole state: | 6.1% |
Likely homosexual households (counted as self-reported same-sex unmarried-partner households)
- Lesbian couples: 0.3% of all households
- Gay men: 0.5% of all households
| This place: | 10.0% |
| Whole state: | 10.6% |
| This place: | 5.0% |
| Whole state: | 4.6% |
People in group quarters in Lower Peninsula in 2000:
- 1,468 people in state prisons
- 15 people in nursing homes
- 13 people in other workers' dormitories
For population 15 years and over in Lower Peninsula:
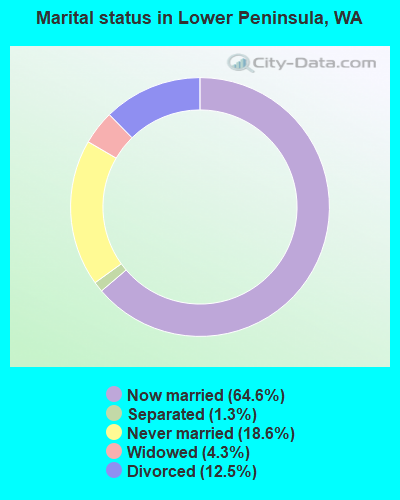
- Never married: 18.6%
- Now married: 64.6%
- Separated: 1.3%
- Widowed: 4.3%
- Divorced: 12.5%
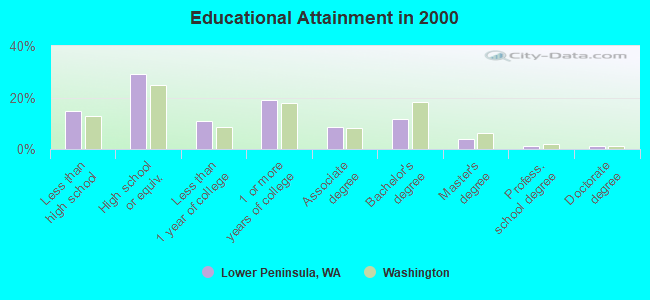
For population 25 years and over in Lower Peninsula:
- High school or higher: 85.3%
- Bachelor's degree or higher: 18.0%
- Graduate or professional degree: 6.2%
- Unemployed: 6.9%
- Mean travel time to work (commute): 45.7 minutes
| Here: | 9.7 |
| Washington average: | 11.3 |
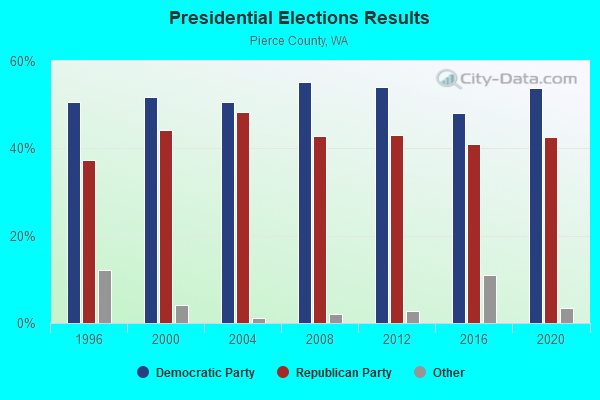
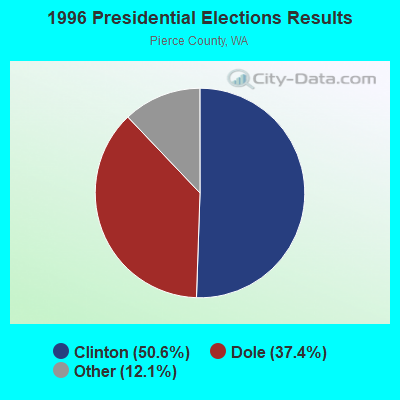
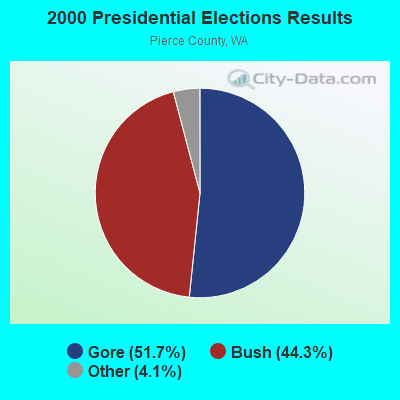
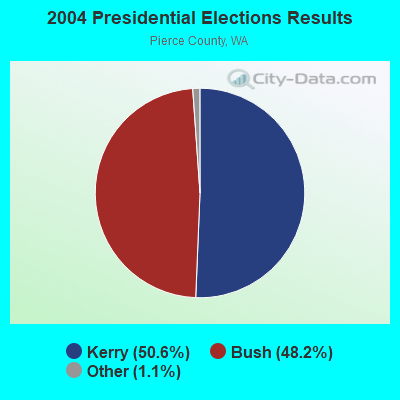
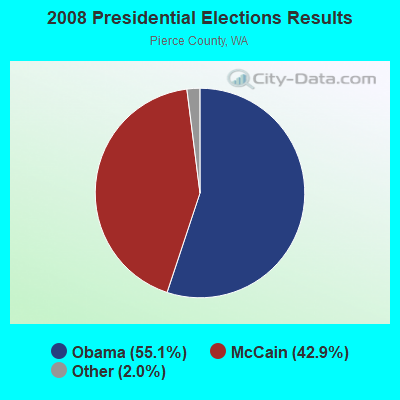
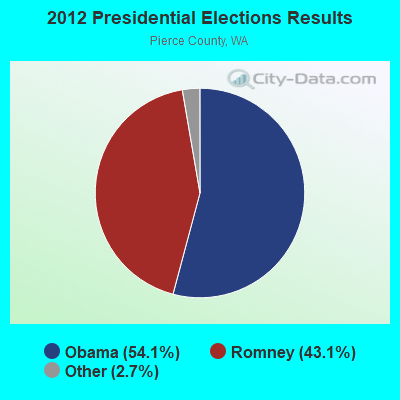
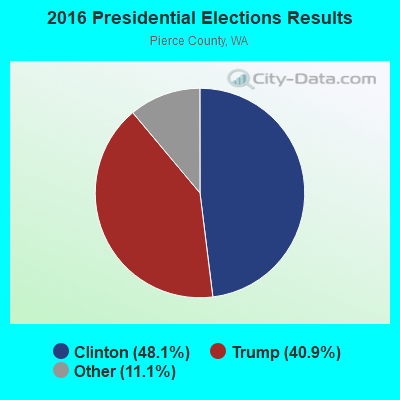
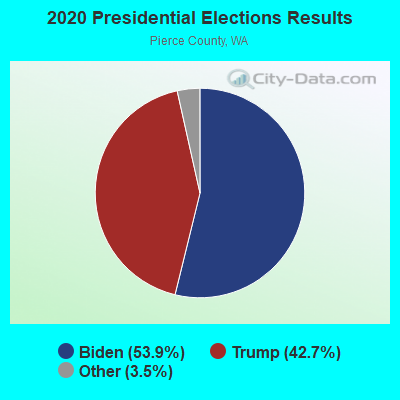
Graphs represent county-level data. Detailed 2008 Election Results
Religion statistics for Lower Peninsula, WA (based on Pierce County data)
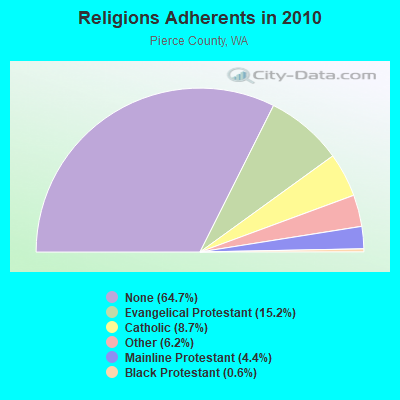
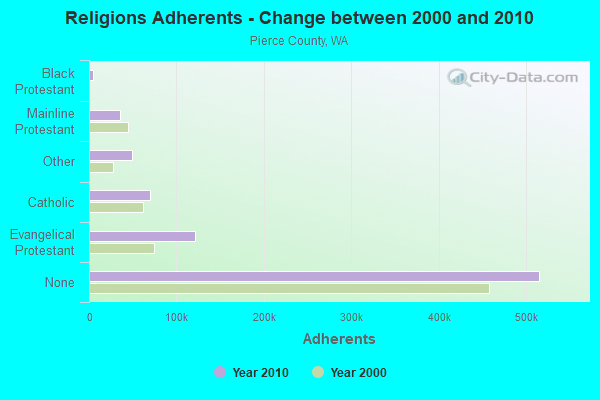
| Religion | Adherents | Congregations |
|---|---|---|
| Evangelical Protestant | 121,041 | 365 |
| Catholic | 69,558 | 26 |
| Other | 49,446 | 109 |
| Mainline Protestant | 34,906 | 123 |
| Black Protestant | 4,817 | 17 |
| Orthodox | 605 | 4 |
| None | 514,852 | - |
Food Environment Statistics:
| Pierce County: | 1.71 / 10,000 pop. |
| Washington: | 2.06 / 10,000 pop. |
| Pierce County: | 0.17 / 10,000 pop. |
| Washington: | 0.19 / 10,000 pop. |
| This county: | 1.36 / 10,000 pop. |
| State: | 1.18 / 10,000 pop. |
| Pierce County: | 1.97 / 10,000 pop. |
| Washington: | 2.67 / 10,000 pop. |
| This county: | 6.61 / 10,000 pop. |
| Washington: | 8.26 / 10,000 pop. |
| Pierce County: | 8.4% |
| State: | 7.7% |
| This county: | 29.3% |
| Washington: | 25.7% |
| This county: | 14.1% |
| State: | 13.9% |
8.45% of this county's 2021 resident taxpayers lived in other counties in 2020 ($69,857 average adjusted gross income)
| Here: | 8.45% |
| Washington average: | 7.53% |
0.15% of residents moved from foreign countries ($1,028 average AGI)
Pierce County: 0.15% Washington average: 0.05%
Top counties from which taxpayers relocated into this county between 2020 and 2021:
| from King County, WA | |
| from Thurston County, WA | |
| from Kitsap County, WA |
8.36% of this county's 2020 resident taxpayers moved to other counties in 2021 ($66,301 average adjusted gross income)
| Here: | 8.36% |
| Washington average: | 7.40% |
0.12% of residents moved to foreign countries ($853 average AGI)
Pierce County: 0.12% Washington average: 0.04%
Top counties to which taxpayers relocated from this county between 2020 and 2021:
| to King County, WA | |
| to Thurston County, WA | |
| to Kitsap County, WA |
Strongest AM radio stations in Lower Peninsula:
- KIRO (710 AM; 50 kW; SEATTLE, WA; Owner: ENTERCOM SEATTLE LICENSE, LLC)
- KTTH (770 AM; 50 kW; SEATTLE, WA; Owner: ENTERCOM SEATTLE LICENSE, LLC)
- KGNW (820 AM; 50 kW; BURIEN-SEATTLE, WA; Owner: INSPIRATION MEDIA, INC.)
- KJR (950 AM; 50 kW; SEATTLE, WA)
- KYCW (1090 AM; 50 kW; SEATTLE, WA; Owner: INFINITY RADIO SUBSIDIARY OPERATIONS INC.)
- KOMO (1000 AM; 50 kW; SEATTLE, WA; Owner: FISHER BROADCASTING - SEATTLE RADIO, L.L.C.)
- KIXI (880 AM; 50 kW; MERCER ISLAND/SEATTL, WA; Owner: BELLEVUE RADIO, INC.)
- KKOL (1300 AM; 50 kW; SEATTLE, WA; Owner: INSPIRATION MEDIA, INC.)
- KNWX (1210 AM; 28 kW; AUBURN-FEDERAL WAY, WA; Owner: ENTERCOM SEATTLE LICENSE, LLC)
- KHHO (850 AM; 10 kW; TACOMA, WA; Owner: ACKERLEY MEDIA GROUP, INC.)
- KMAS (1030 AM; 10 kW; SHELTON, WA; Owner: SOUND BROADCASTING, INC.)
- KVI (570 AM; 5 kW; SEATTLE, WA; Owner: FISHER BROADCASTING - SEATTLE RADIO, L.L.C.)
- KGHO (920 AM; 5 kW; OLYMPIA, WA; Owner: SPENCER BROADCASTING, L.P.)
Strongest FM radio stations in Lower Peninsula:
- KGHP (89.9 FM; GIG HARBOR, WA; Owner: PENINSULA SCHOOL DISTRICT NO. 401)
- K205DD (88.9 FM; BREMERTON, WA; Owner: CALVARY CHAPEL OF TWIN FALLS, INC.)
- KQBZ (100.7 FM; SEATTLE, WA; Owner: ENTERCOM SEATTLE LICENSE, LLC)
- KMTT (103.7 FM; TACOMA, WA; Owner: ENTERCOM SEATTLE LICENSE, LLC)
- KNDD (107.7 FM; SEATTLE, WA; Owner: ENTERCOM SEATTLE LICENSE, LLC)
- KISW (99.9 FM; SEATTLE, WA; Owner: ENTERCOM SEATTLE LICENSE, LLC)
- KBSG-FM (97.3 FM; TACOMA, WA; Owner: ENTERCOM SEATTLE LICENSE, LLC)
- KYPT (96.5 FM; SEATTLE, WA; Owner: INFINITY RADIO SUBSIDIARY OPERATIONS INC.)
- KRXY (94.5 FM; SHELTON, WA; Owner: PREMIER BROADCASTERS, INC.)
- KBKS (106.1 FM; TACOMA, WA; Owner: INFINITY RADIO SUBSIDIARY OPERATIONS INC.)
- KING-FM (98.1 FM; SEATTLE, WA; Owner: CLASSIC RADIO, INC.)
- KLSY-FM (92.5 FM; BELLEVUE, WA; Owner: BELLEVUE RADIO INC.)
- KPLU-FM (88.5 FM; TACOMA, WA; Owner: PACIFIC LUTHERAN UNIVERSITY, INC.)
- KWJZ (98.9 FM; SEATTLE, WA; Owner: ORCA RADIO, INC.)
- KZOK-FM (102.5 FM; SEATTLE, WA; Owner: INFINITY RADIO SUBSIDIARY OPERATIONS INC.)
- KMPS-FM (94.1 FM; SEATTLE, WA; Owner: INFINITY RADIO SUBSIDIARY OPERATIONS INC.)
- KFMY (97.7 FM; RAYMOND, WA; Owner: SOUTH SOUND BROADCASTING, LLC)
- KGY-FM (96.9 FM; MCCLEARY, WA; Owner: KGY, INC.)
- KVTI (90.9 FM; TACOMA, WA; Owner: CLOVER PARK TECHNICAL COLLEGE)
- KAYO-FM (99.3 FM; ELMA, WA; Owner: SOUTH SOUND BROADCASTING, LLC)
TV broadcast stations around Lower Peninsula:
- KBTC-TV (Channel 28; TACOMA, WA; Owner: BATES TECHNICAL COLLEGE)
- KCPQ (Channel 13; TACOMA, WA; Owner: TRIBUNE TELEVISION NORTHWEST, INC.)
- KING-TV (Channel 5; SEATTLE, WA; Owner: KING BROADCASTING COMPANY)
- KSTW (Channel 11; TACOMA, WA; Owner: UPN TELEVISION STATIONS INC.)
- K58DP (Channel 58; SEATTLE, WA; Owner: WORD OF GOD FELLOWSHIP, INC.)
- KTWB-TV (Channel 22; SEATTLE, WA; Owner: TRIBUNE TELEVISION HOLDINGS, INC.)
- KOMO-TV (Channel 4; SEATTLE, WA; Owner: FISHER BROADCASTING - SEATTLE TV, L.L.C.)
- KIRO-TV (Channel 7; SEATTLE, WA; Owner: KIRO-TV HOLDINGS, INC.)
- KCTS-TV (Channel 9; SEATTLE, WA; Owner: KCTS TELEVISION)
- KHCV (Channel 45; SEATTLE, WA; Owner: NORTH PACIFIC INTERNATIONAL TELEVISION, INC.)
- KWPX (Channel 33; BELLEVUE, WA; Owner: PAXSON COMMUNICATIONS LICENSE COMPANY, LLC)
- K57HB (Channel 57; EUREKA, CA; Owner: MS COMMUNICATIONS, LLC)
- KONG-TV (Channel 16; EVERETT, WA; Owner: KONG-TV, INC.)
- KTBW-TV (Channel 20; TACOMA, WA; Owner: TRINITY BROADCASTING OF WASHINGTON)
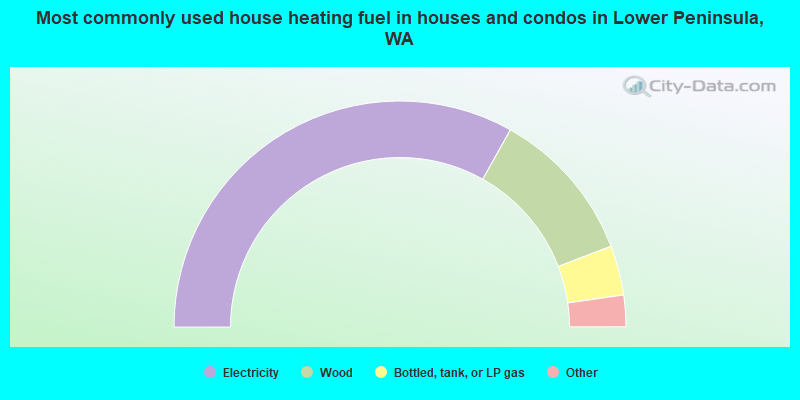
- 66.2%Electricity
- 22.1%Wood
- 7.1%Bottled, tank, or LP gas
- 2.3%Fuel oil, kerosene, etc.
- 1.4%Utility gas
- 0.6%Other fuel
- 0.2%Solar energy
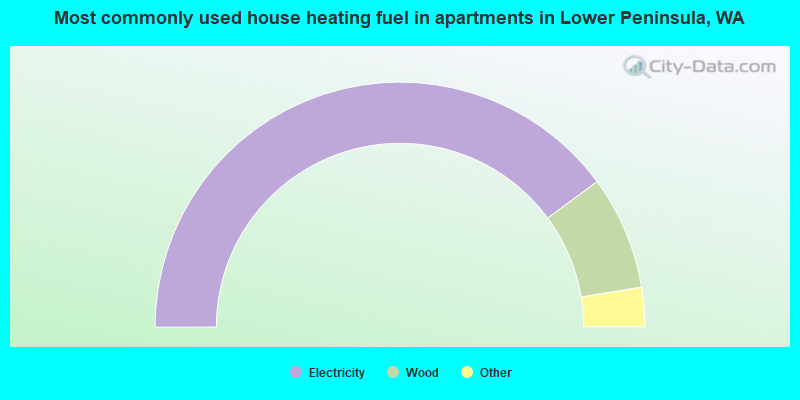
- 79.8%Electricity
- 15.0%Wood
- 2.2%Bottled, tank, or LP gas
- 1.9%Fuel oil, kerosene, etc.
- 1.1%Other fuel
Lower Peninsula compared to Washington state average:
- Unemployed percentage below state average.
- Hispanic race population percentage significantly below state average.
- Median age above state average.
- Foreign-born population percentage significantly below state average.
- Renting percentage significantly below state average.
- Length of stay since moving in significantly above state average.
- Number of rooms per house significantly below state average.
- House age significantly below state average.
- Institutionalized population percentage significantly above state average.
- Percentage of population with a bachelor's degree or higher below state average.
Lower Peninsula on our top lists:
- #2 on the list of "Top 101 cities with largest percentage of females in occupations: vehicle and mobile equipment mechanics, installers, and repairers (population 5,000+)"
- #8 on the list of "Top 101 cities with largest percentage of males in industries: fuel dealers (population 5,000+)"
- #9 on the list of "Top 100 cities with longest commuting times (pop. 5,000+)"
- #18 on the list of "Top 101 cities with largest percentage of females in industries: fuel dealers (population 5,000+)"
- #23 on the list of "Top 101 cities with largest percentage of females in industries: other direct selling establishments (population 5,000+)"
- #24 on the list of "Top 101 cities with largest percentage of males in occupations: carpenters (population 5,000+)"
- #26 on the list of "Top 101 cities with largest percentage of males in occupations: drafters, engineering, and mapping technicians (population 5,000+)"
- #30 on the list of "Top 101 cities with largest percentage of males in industries: hardware, plumbing and heating equipment, and supplies merchant wholesalers (population 5,000+)"
- #32 on the list of "Top 101 cities with largest percentage of females in occupations: electrical equipment mechanics and other installation, maintenance, and repair occupations including supervisors (population 5,000+)"
- #42 on the list of "Top 101 cities with largest percentage of workers with very long commute times (90 or more minutes) (population 5,000+)"
- #46 on the list of "Top 101 cities with largest percentage of females in industries: building material and garden equipment and supplies dealers (population 5,000+)"
- #49 on the list of "Top 101 cities with largest percentage of males in industries: water transportation (population 5,000+)"
- #53 on the list of "Top 101 cities with largest percentage of males in industries: lumber and other construction materials merchant wholesalers (population 5,000+)"
- #58 on the list of "Top 101 cities with largest percentage of males in occupations: laborers and material movers, hand (population 5,000+)"
- #59 on the list of "Top 101 cities with largest percentage of females in occupations: transportation, tourism, and lodging attendants (population 5,000+)"
- #66 on the list of "Top 101 cities with largest percentage of males in industries: retail florists (population 5,000+)"
- #67 on the list of "Top 101 cities with largest percentage of males in industries: transportation equipment (population 5,000+)"
- #69 on the list of "Top 101 cities with largest percentage of females in industries: air transportation (population 5,000+)"
- #71 on the list of "Top 101 cities with largest percentage of females in industries: u. s. postal service (population 5,000+)"
- #91 on the list of "Top 101 cities with largest percentage of males in industries: farm supplies merchant wholesalers (population 5,000+)"
- #28 on the list of "Top 101 counties with the highest average weight of females"
- #41 on the list of "Top 101 counties with the largest increase in the number of births per 1000 residents 2000-2006 to 2007-2013 (pop 50,000+)"
- #41 on the list of "Top 101 counties with the highest ground withdrawal of fresh water for public supply"
- #48 on the list of "Top 101 counties with the highest percentage of residents relocating from foreign countries between 2010 and 2011 (pop. 50,000+)"
- #50 on the list of "Top 101 counties with the most Evangelical Protestant congregations"