Madison, Alabama Submit your own pictures of this city and show them to the world
OSM Map
General Map
Google Map
MSN Map
OSM Map
General Map
Google Map
MSN Map
OSM Map
General Map
Google Map
MSN Map
OSM Map
General Map
Google Map
MSN Map
Please wait while loading the map...
Population in 2022: 59,785 (100% urban, 0% rural). Population change since 2000: +103.8%Males: 29,697 Females: 30,088
March 2022 cost of living index in Madison: 84.3 (less than average, U.S. average is 100) Percentage of residents living in poverty in 2022: 4.5%for White Non-Hispanic residents , 10.2% for Black residents , 9.2% for Hispanic or Latino residents , 6.9% for American Indian residents , 2.0% for two or more races residents )
Profiles of local businesses
Business Search - 14 Million verified businesses
Data:
Median household income ($)
Median household income (% change since 2000)
Household income diversity
Ratio of average income to average house value (%)
Ratio of average income to average rent
Median household income ($) - White
Median household income ($) - Black or African American
Median household income ($) - Asian
Median household income ($) - Hispanic or Latino
Median household income ($) - American Indian and Alaska Native
Median household income ($) - Multirace
Median household income ($) - Other Race
Median household income for houses/condos with a mortgage ($)
Median household income for apartments without a mortgage ($)
Races - White alone (%)
Races - White alone (% change since 2000)
Races - Black alone (%)
Races - Black alone (% change since 2000)
Races - American Indian alone (%)
Races - American Indian alone (% change since 2000)
Races - Asian alone (%)
Races - Asian alone (% change since 2000)
Races - Hispanic (%)
Races - Hispanic (% change since 2000)
Races - Native Hawaiian and Other Pacific Islander alone (%)
Races - Native Hawaiian and Other Pacific Islander alone (% change since 2000)
Races - Two or more races (%)
Races - Two or more races (% change since 2000)
Races - Other race alone (%)
Races - Other race alone (% change since 2000)
Racial diversity
Unemployment (%)
Unemployment (% change since 2000)
Unemployment (%) - White
Unemployment (%) - Black or African American
Unemployment (%) - Asian
Unemployment (%) - Hispanic or Latino
Unemployment (%) - American Indian and Alaska Native
Unemployment (%) - Multirace
Unemployment (%) - Other Race
Population density (people per square mile)
Population - Males (%)
Population - Females (%)
Population - Males (%) - White
Population - Males (%) - Black or African American
Population - Males (%) - Asian
Population - Males (%) - Hispanic or Latino
Population - Males (%) - American Indian and Alaska Native
Population - Males (%) - Multirace
Population - Males (%) - Other Race
Population - Females (%) - White
Population - Females (%) - Black or African American
Population - Females (%) - Asian
Population - Females (%) - Hispanic or Latino
Population - Females (%) - American Indian and Alaska Native
Population - Females (%) - Multirace
Population - Females (%) - Other Race
Coronavirus confirmed cases (Apr 25, 2024)
Deaths caused by coronavirus (Apr 25, 2024)
Coronavirus confirmed cases (per 100k population) (Apr 25, 2024)
Deaths caused by coronavirus (per 100k population) (Apr 25, 2024)
Daily increase in number of cases (Apr 25, 2024)
Weekly increase in number of cases (Apr 25, 2024)
Cases doubled (in days) (Apr 25, 2024)
Hospitalized patients (Apr 18, 2022)
Negative test results (Apr 18, 2022)
Total test results (Apr 18, 2022)
COVID Vaccine doses distributed (per 100k population) (Sep 19, 2023)
COVID Vaccine doses administered (per 100k population) (Sep 19, 2023)
COVID Vaccine doses distributed (Sep 19, 2023)
COVID Vaccine doses administered (Sep 19, 2023)
Likely homosexual households (%)
Likely homosexual households (% change since 2000)
Likely homosexual households - Lesbian couples (%)
Likely homosexual households - Lesbian couples (% change since 2000)
Likely homosexual households - Gay men (%)
Likely homosexual households - Gay men (% change since 2000)
Cost of living index
Median gross rent ($)
Median contract rent ($)
Median monthly housing costs ($)
Median house or condo value ($)
Median house or condo value ($ change since 2000)
Mean house or condo value by units in structure - 1, detached ($)
Mean house or condo value by units in structure - 1, attached ($)
Mean house or condo value by units in structure - 2 ($)
Mean house or condo value by units in structure by units in structure - 3 or 4 ($)
Mean house or condo value by units in structure - 5 or more ($)
Mean house or condo value by units in structure - Boat, RV, van, etc. ($)
Mean house or condo value by units in structure - Mobile home ($)
Median house or condo value ($) - White
Median house or condo value ($) - Black or African American
Median house or condo value ($) - Asian
Median house or condo value ($) - Hispanic or Latino
Median house or condo value ($) - American Indian and Alaska Native
Median house or condo value ($) - Multirace
Median house or condo value ($) - Other Race
Median resident age
Resident age diversity
Median resident age - Males
Median resident age - Females
Median resident age - White
Median resident age - Black or African American
Median resident age - Asian
Median resident age - Hispanic or Latino
Median resident age - American Indian and Alaska Native
Median resident age - Multirace
Median resident age - Other Race
Median resident age - Males - White
Median resident age - Males - Black or African American
Median resident age - Males - Asian
Median resident age - Males - Hispanic or Latino
Median resident age - Males - American Indian and Alaska Native
Median resident age - Males - Multirace
Median resident age - Males - Other Race
Median resident age - Females - White
Median resident age - Females - Black or African American
Median resident age - Females - Asian
Median resident age - Females - Hispanic or Latino
Median resident age - Females - American Indian and Alaska Native
Median resident age - Females - Multirace
Median resident age - Females - Other Race
Commute - mean travel time to work (minutes)
Travel time to work - Less than 5 minutes (%)
Travel time to work - Less than 5 minutes (% change since 2000)
Travel time to work - 5 to 9 minutes (%)
Travel time to work - 5 to 9 minutes (% change since 2000)
Travel time to work - 10 to 19 minutes (%)
Travel time to work - 10 to 19 minutes (% change since 2000)
Travel time to work - 20 to 29 minutes (%)
Travel time to work - 20 to 29 minutes (% change since 2000)
Travel time to work - 30 to 39 minutes (%)
Travel time to work - 30 to 39 minutes (% change since 2000)
Travel time to work - 40 to 59 minutes (%)
Travel time to work - 40 to 59 minutes (% change since 2000)
Travel time to work - 60 to 89 minutes (%)
Travel time to work - 60 to 89 minutes (% change since 2000)
Travel time to work - 90 or more minutes (%)
Travel time to work - 90 or more minutes (% change since 2000)
Marital status - Never married (%)
Marital status - Now married (%)
Marital status - Separated (%)
Marital status - Widowed (%)
Marital status - Divorced (%)
Median family income ($)
Median family income (% change since 2000)
Median non-family income ($)
Median non-family income (% change since 2000)
Median per capita income ($)
Median per capita income (% change since 2000)
Median family income ($) - White
Median family income ($) - Black or African American
Median family income ($) - Asian
Median family income ($) - Hispanic or Latino
Median family income ($) - American Indian and Alaska Native
Median family income ($) - Multirace
Median family income ($) - Other Race
Median year house/condo built
Median year apartment built
Year house built - Built 2005 or later (%)
Year house built - Built 2000 to 2004 (%)
Year house built - Built 1990 to 1999 (%)
Year house built - Built 1980 to 1989 (%)
Year house built - Built 1970 to 1979 (%)
Year house built - Built 1960 to 1969 (%)
Year house built - Built 1950 to 1959 (%)
Year house built - Built 1940 to 1949 (%)
Year house built - Built 1939 or earlier (%)
Average household size
Household density (households per square mile)
Average household size - White
Average household size - Black or African American
Average household size - Asian
Average household size - Hispanic or Latino
Average household size - American Indian and Alaska Native
Average household size - Multirace
Average household size - Other Race
Occupied housing units (%)
Vacant housing units (%)
Owner occupied housing units (%)
Renter occupied housing units (%)
Vacancy status - For rent (%)
Vacancy status - For sale only (%)
Vacancy status - Rented or sold, not occupied (%)
Vacancy status - For seasonal, recreational, or occasional use (%)
Vacancy status - For migrant workers (%)
Vacancy status - Other vacant (%)
Residents with income below the poverty level (%)
Residents with income below 50% of the poverty level (%)
Children below poverty level (%)
Poor families by family type - Married-couple family (%)
Poor families by family type - Male, no wife present (%)
Poor families by family type - Female, no husband present (%)
Poverty status for native-born residents (%)
Poverty status for foreign-born residents (%)
Poverty among high school graduates not in families (%)
Poverty among people who did not graduate high school not in families (%)
Residents with income below the poverty level (%) - White
Residents with income below the poverty level (%) - Black or African American
Residents with income below the poverty level (%) - Asian
Residents with income below the poverty level (%) - Hispanic or Latino
Residents with income below the poverty level (%) - American Indian and Alaska Native
Residents with income below the poverty level (%) - Multirace
Residents with income below the poverty level (%) - Other Race
Air pollution - Air Quality Index (AQI)
Air pollution - CO
Air pollution - NO2
Air pollution - SO2
Air pollution - Ozone
Air pollution - PM10
Air pollution - PM25
Air pollution - Pb
Crime - Murders per 100,000 population
Crime - Rapes per 100,000 population
Crime - Robberies per 100,000 population
Crime - Assaults per 100,000 population
Crime - Burglaries per 100,000 population
Crime - Thefts per 100,000 population
Crime - Auto thefts per 100,000 population
Crime - Arson per 100,000 population
Crime - City-data.com crime index
Crime - Violent crime index
Crime - Property crime index
Crime - Murders per 100,000 population (5 year average)
Crime - Rapes per 100,000 population (5 year average)
Crime - Robberies per 100,000 population (5 year average)
Crime - Assaults per 100,000 population (5 year average)
Crime - Burglaries per 100,000 population (5 year average)
Crime - Thefts per 100,000 population (5 year average)
Crime - Auto thefts per 100,000 population (5 year average)
Crime - Arson per 100,000 population (5 year average)
Crime - City-data.com crime index (5 year average)
Crime - Violent crime index (5 year average)
Crime - Property crime index (5 year average)
1996 Presidential Elections Results (%) - Democratic Party (Clinton)
1996 Presidential Elections Results (%) - Republican Party (Dole)
1996 Presidential Elections Results (%) - Other
2000 Presidential Elections Results (%) - Democratic Party (Gore)
2000 Presidential Elections Results (%) - Republican Party (Bush)
2000 Presidential Elections Results (%) - Other
2004 Presidential Elections Results (%) - Democratic Party (Kerry)
2004 Presidential Elections Results (%) - Republican Party (Bush)
2004 Presidential Elections Results (%) - Other
2008 Presidential Elections Results (%) - Democratic Party (Obama)
2008 Presidential Elections Results (%) - Republican Party (McCain)
2008 Presidential Elections Results (%) - Other
2012 Presidential Elections Results (%) - Democratic Party (Obama)
2012 Presidential Elections Results (%) - Republican Party (Romney)
2012 Presidential Elections Results (%) - Other
2016 Presidential Elections Results (%) - Democratic Party (Clinton)
2016 Presidential Elections Results (%) - Republican Party (Trump)
2016 Presidential Elections Results (%) - Other
2020 Presidential Elections Results (%) - Democratic Party (Biden)
2020 Presidential Elections Results (%) - Republican Party (Trump)
2020 Presidential Elections Results (%) - Other
Ancestries Reported - Arab (%)
Ancestries Reported - Czech (%)
Ancestries Reported - Danish (%)
Ancestries Reported - Dutch (%)
Ancestries Reported - English (%)
Ancestries Reported - French (%)
Ancestries Reported - French Canadian (%)
Ancestries Reported - German (%)
Ancestries Reported - Greek (%)
Ancestries Reported - Hungarian (%)
Ancestries Reported - Irish (%)
Ancestries Reported - Italian (%)
Ancestries Reported - Lithuanian (%)
Ancestries Reported - Norwegian (%)
Ancestries Reported - Polish (%)
Ancestries Reported - Portuguese (%)
Ancestries Reported - Russian (%)
Ancestries Reported - Scotch-Irish (%)
Ancestries Reported - Scottish (%)
Ancestries Reported - Slovak (%)
Ancestries Reported - Subsaharan African (%)
Ancestries Reported - Swedish (%)
Ancestries Reported - Swiss (%)
Ancestries Reported - Ukrainian (%)
Ancestries Reported - United States (%)
Ancestries Reported - Welsh (%)
Ancestries Reported - West Indian (%)
Ancestries Reported - Other (%)
Educational Attainment - No schooling completed (%)
Educational Attainment - Less than high school (%)
Educational Attainment - High school or equivalent (%)
Educational Attainment - Less than 1 year of college (%)
Educational Attainment - 1 or more years of college (%)
Educational Attainment - Associate degree (%)
Educational Attainment - Bachelor's degree (%)
Educational Attainment - Master's degree (%)
Educational Attainment - Professional school degree (%)
Educational Attainment - Doctorate degree (%)
School Enrollment - Nursery, preschool (%)
School Enrollment - Kindergarten (%)
School Enrollment - Grade 1 to 4 (%)
School Enrollment - Grade 5 to 8 (%)
School Enrollment - Grade 9 to 12 (%)
School Enrollment - College undergrad (%)
School Enrollment - Graduate or professional (%)
School Enrollment - Not enrolled in school (%)
School enrollment - Public schools (%)
School enrollment - Private schools (%)
School enrollment - Not enrolled (%)
Median number of rooms in houses and condos
Median number of rooms in apartments
Housing units lacking complete plumbing facilities (%)
Housing units lacking complete kitchen facilities (%)
Density of houses
Urban houses (%)
Rural houses (%)
Households with people 60 years and over (%)
Households with people 65 years and over (%)
Households with people 75 years and over (%)
Households with one or more nonrelatives (%)
Households with no nonrelatives (%)
Population in households (%)
Family households (%)
Nonfamily households (%)
Population in families (%)
Family households with own children (%)
Median number of bedrooms in owner occupied houses
Mean number of bedrooms in owner occupied houses
Median number of bedrooms in renter occupied houses
Mean number of bedrooms in renter occupied houses
Median number of vehichles in owner occupied houses
Mean number of vehichles in owner occupied houses
Median number of vehichles in renter occupied houses
Mean number of vehichles in renter occupied houses
Mortgage status - with mortgage (%)
Mortgage status - with second mortgage (%)
Mortgage status - with home equity loan (%)
Mortgage status - with both second mortgage and home equity loan (%)
Mortgage status - without a mortgage (%)
Average family size
Average family size - White
Average family size - Black or African American
Average family size - Asian
Average family size - Hispanic or Latino
Average family size - American Indian and Alaska Native
Average family size - Multirace
Average family size - Other Race
Geographical mobility - Same house 1 year ago (%)
Geographical mobility - Moved within same county (%)
Geographical mobility - Moved from different county within same state (%)
Geographical mobility - Moved from different state (%)
Geographical mobility - Moved from abroad (%)
Place of birth - Born in state of residence (%)
Place of birth - Born in other state (%)
Place of birth - Native, outside of US (%)
Place of birth - Foreign born (%)
Housing units in structures - 1, detached (%)
Housing units in structures - 1, attached (%)
Housing units in structures - 2 (%)
Housing units in structures - 3 or 4 (%)
Housing units in structures - 5 to 9 (%)
Housing units in structures - 10 to 19 (%)
Housing units in structures - 20 to 49 (%)
Housing units in structures - 50 or more (%)
Housing units in structures - Mobile home (%)
Housing units in structures - Boat, RV, van, etc. (%)
House/condo owner moved in on average (years ago)
Renter moved in on average (years ago)
Year householder moved into unit - Moved in 1999 to March 2000 (%)
Year householder moved into unit - Moved in 1995 to 1998 (%)
Year householder moved into unit - Moved in 1990 to 1994 (%)
Year householder moved into unit - Moved in 1980 to 1989 (%)
Year householder moved into unit - Moved in 1970 to 1979 (%)
Year householder moved into unit - Moved in 1969 or earlier (%)
Means of transportation to work - Drove car alone (%)
Means of transportation to work - Carpooled (%)
Means of transportation to work - Public transportation (%)
Means of transportation to work - Bus or trolley bus (%)
Means of transportation to work - Streetcar or trolley car (%)
Means of transportation to work - Subway or elevated (%)
Means of transportation to work - Railroad (%)
Means of transportation to work - Ferryboat (%)
Means of transportation to work - Taxicab (%)
Means of transportation to work - Motorcycle (%)
Means of transportation to work - Bicycle (%)
Means of transportation to work - Walked (%)
Means of transportation to work - Other means (%)
Working at home (%)
Industry diversity
Most Common Industries - Agriculture, forestry, fishing and hunting, and mining (%)
Most Common Industries - Agriculture, forestry, fishing and hunting (%)
Most Common Industries - Mining, quarrying, and oil and gas extraction (%)
Most Common Industries - Construction (%)
Most Common Industries - Manufacturing (%)
Most Common Industries - Wholesale trade (%)
Most Common Industries - Retail trade (%)
Most Common Industries - Transportation and warehousing, and utilities (%)
Most Common Industries - Transportation and warehousing (%)
Most Common Industries - Utilities (%)
Most Common Industries - Information (%)
Most Common Industries - Finance and insurance, and real estate and rental and leasing (%)
Most Common Industries - Finance and insurance (%)
Most Common Industries - Real estate and rental and leasing (%)
Most Common Industries - Professional, scientific, and management, and administrative and waste management services (%)
Most Common Industries - Professional, scientific, and technical services (%)
Most Common Industries - Management of companies and enterprises (%)
Most Common Industries - Administrative and support and waste management services (%)
Most Common Industries - Educational services, and health care and social assistance (%)
Most Common Industries - Educational services (%)
Most Common Industries - Health care and social assistance (%)
Most Common Industries - Arts, entertainment, and recreation, and accommodation and food services (%)
Most Common Industries - Arts, entertainment, and recreation (%)
Most Common Industries - Accommodation and food services (%)
Most Common Industries - Other services, except public administration (%)
Most Common Industries - Public administration (%)
Occupation diversity
Most Common Occupations - Management, business, science, and arts occupations (%)
Most Common Occupations - Management, business, and financial occupations (%)
Most Common Occupations - Management occupations (%)
Most Common Occupations - Business and financial operations occupations (%)
Most Common Occupations - Computer, engineering, and science occupations (%)
Most Common Occupations - Computer and mathematical occupations (%)
Most Common Occupations - Architecture and engineering occupations (%)
Most Common Occupations - Life, physical, and social science occupations (%)
Most Common Occupations - Education, legal, community service, arts, and media occupations (%)
Most Common Occupations - Community and social service occupations (%)
Most Common Occupations - Legal occupations (%)
Most Common Occupations - Education, training, and library occupations (%)
Most Common Occupations - Arts, design, entertainment, sports, and media occupations (%)
Most Common Occupations - Healthcare practitioners and technical occupations (%)
Most Common Occupations - Health diagnosing and treating practitioners and other technical occupations (%)
Most Common Occupations - Health technologists and technicians (%)
Most Common Occupations - Service occupations (%)
Most Common Occupations - Healthcare support occupations (%)
Most Common Occupations - Protective service occupations (%)
Most Common Occupations - Fire fighting and prevention, and other protective service workers including supervisors (%)
Most Common Occupations - Law enforcement workers including supervisors (%)
Most Common Occupations - Food preparation and serving related occupations (%)
Most Common Occupations - Building and grounds cleaning and maintenance occupations (%)
Most Common Occupations - Personal care and service occupations (%)
Most Common Occupations - Sales and office occupations (%)
Most Common Occupations - Sales and related occupations (%)
Most Common Occupations - Office and administrative support occupations (%)
Most Common Occupations - Natural resources, construction, and maintenance occupations (%)
Most Common Occupations - Farming, fishing, and forestry occupations (%)
Most Common Occupations - Construction and extraction occupations (%)
Most Common Occupations - Installation, maintenance, and repair occupations (%)
Most Common Occupations - Production, transportation, and material moving occupations (%)
Most Common Occupations - Production occupations (%)
Most Common Occupations - Transportation occupations (%)
Most Common Occupations - Material moving occupations (%)
People in Group quarters - Institutionalized population (%)
People in Group quarters - Correctional institutions (%)
People in Group quarters - Federal prisons and detention centers (%)
People in Group quarters - Halfway houses (%)
People in Group quarters - Local jails and other confinement facilities (including police lockups) (%)
People in Group quarters - Military disciplinary barracks (%)
People in Group quarters - State prisons (%)
People in Group quarters - Other types of correctional institutions (%)
People in Group quarters - Nursing homes (%)
People in Group quarters - Hospitals/wards, hospices, and schools for the handicapped (%)
People in Group quarters - Hospitals/wards and hospices for chronically ill (%)
People in Group quarters - Hospices or homes for chronically ill (%)
People in Group quarters - Military hospitals or wards for chronically ill (%)
People in Group quarters - Other hospitals or wards for chronically ill (%)
People in Group quarters - Hospitals or wards for drug/alcohol abuse (%)
People in Group quarters - Mental (Psychiatric) hospitals or wards (%)
People in Group quarters - Schools, hospitals, or wards for the mentally retarded (%)
People in Group quarters - Schools, hospitals, or wards for the physically handicapped (%)
People in Group quarters - Institutions for the deaf (%)
People in Group quarters - Institutions for the blind (%)
People in Group quarters - Orthopedic wards and institutions for the physically handicapped (%)
People in Group quarters - Wards in general hospitals for patients who have no usual home elsewhere (%)
People in Group quarters - Wards in military hospitals for patients who have no usual home elsewhere (%)
People in Group quarters - Juvenile institutions (%)
People in Group quarters - Long-term care (%)
People in Group quarters - Homes for abused, dependent, and neglected children (%)
People in Group quarters - Residential treatment centers for emotionally disturbed children (%)
People in Group quarters - Training schools for juvenile delinquents (%)
People in Group quarters - Short-term care, detention or diagnostic centers for delinquent children (%)
People in Group quarters - Type of juvenile institution unknown (%)
People in Group quarters - Noninstitutionalized population (%)
People in Group quarters - College dormitories (includes college quarters off campus) (%)
People in Group quarters - Military quarters (%)
People in Group quarters - On base (%)
People in Group quarters - Barracks, unaccompanied personnel housing (UPH), (Enlisted/Officer), ;and similar group living quarters for military personnel (%)
People in Group quarters - Transient quarters for temporary residents (%)
People in Group quarters - Military ships (%)
People in Group quarters - Group homes (%)
People in Group quarters - Homes or halfway houses for drug/alcohol abuse (%)
People in Group quarters - Homes for the mentally ill (%)
People in Group quarters - Homes for the mentally retarded (%)
People in Group quarters - Homes for the physically handicapped (%)
People in Group quarters - Other group homes (%)
People in Group quarters - Religious group quarters (%)
People in Group quarters - Dormitories (%)
People in Group quarters - Agriculture workers' dormitories on farms (%)
People in Group quarters - Job Corps and vocational training facilities (%)
People in Group quarters - Other workers' dormitories (%)
People in Group quarters - Crews of maritime vessels (%)
People in Group quarters - Other nonhousehold living situations (%)
People in Group quarters - Other noninstitutional group quarters (%)
Residents speaking English at home (%)
Residents speaking English at home - Born in the United States (%)
Residents speaking English at home - Native, born elsewhere (%)
Residents speaking English at home - Foreign born (%)
Residents speaking Spanish at home (%)
Residents speaking Spanish at home - Born in the United States (%)
Residents speaking Spanish at home - Native, born elsewhere (%)
Residents speaking Spanish at home - Foreign born (%)
Residents speaking other language at home (%)
Residents speaking other language at home - Born in the United States (%)
Residents speaking other language at home - Native, born elsewhere (%)
Residents speaking other language at home - Foreign born (%)
Class of Workers - Employee of private company (%)
Class of Workers - Self-employed in own incorporated business (%)
Class of Workers - Private not-for-profit wage and salary workers (%)
Class of Workers - Local government workers (%)
Class of Workers - State government workers (%)
Class of Workers - Federal government workers (%)
Class of Workers - Self-employed workers in own not incorporated business and Unpaid family workers (%)
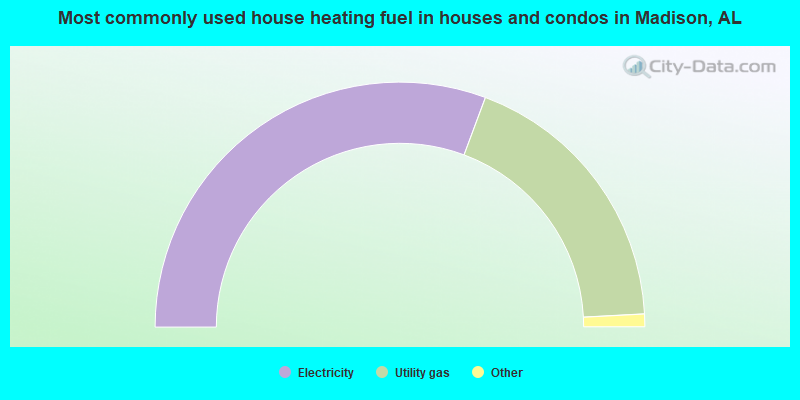
House heating fuel used in houses and condos - Utility gas (%)
House heating fuel used in houses and condos - Bottled, tank, or LP gas (%)
House heating fuel used in houses and condos - Electricity (%)
House heating fuel used in houses and condos - Fuel oil, kerosene, etc. (%)
House heating fuel used in houses and condos - Coal or coke (%)
House heating fuel used in houses and condos - Wood (%)
House heating fuel used in houses and condos - Solar energy (%)
House heating fuel used in houses and condos - Other fuel (%)
House heating fuel used in houses and condos - No fuel used (%)
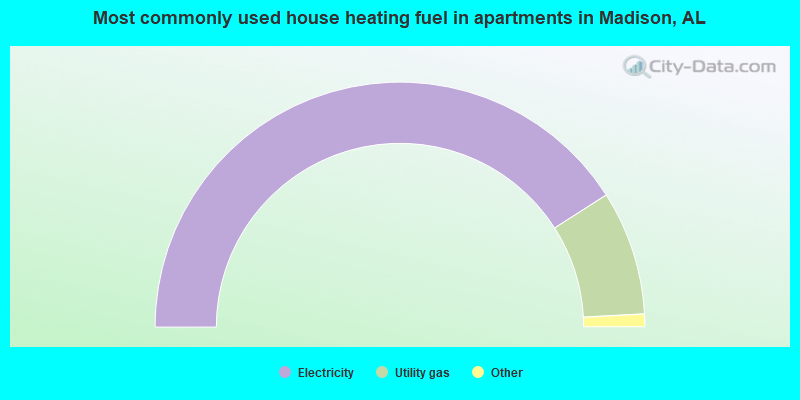
House heating fuel used in apartments - Utility gas (%)
House heating fuel used in apartments - Bottled, tank, or LP gas (%)
House heating fuel used in apartments - Electricity (%)
House heating fuel used in apartments - Fuel oil, kerosene, etc. (%)
House heating fuel used in apartments - Coal or coke (%)
House heating fuel used in apartments - Wood (%)
House heating fuel used in apartments - Solar energy (%)
House heating fuel used in apartments - Other fuel (%)
House heating fuel used in apartments - No fuel used (%)
Armed forces status - In Armed Forces (%)
Armed forces status - Civilian (%)
Armed forces status - Civilian - Veteran (%)
Armed forces status - Civilian - Nonveteran (%)
Fatal accidents locations in years 2005-2021
Fatal accidents locations in 2005
Fatal accidents locations in 2006
Fatal accidents locations in 2007
Fatal accidents locations in 2008
Fatal accidents locations in 2009
Fatal accidents locations in 2010
Fatal accidents locations in 2011
Fatal accidents locations in 2012
Fatal accidents locations in 2013
Fatal accidents locations in 2014
Fatal accidents locations in 2015
Fatal accidents locations in 2016
Fatal accidents locations in 2017
Fatal accidents locations in 2018
Fatal accidents locations in 2019
Fatal accidents locations in 2020
Fatal accidents locations in 2021
Alcohol use - People drinking some alcohol every month (%)
Alcohol use - People not drinking at all (%)
Alcohol use - Average days/month drinking alcohol
Alcohol use - Average drinks/week
Alcohol use - Average days/year people drink much
Audiometry - Average condition of hearing (%)
Audiometry - People that can hear a whisper from across a quiet room (%)
Audiometry - People that can hear normal voice from across a quiet room (%)
Audiometry - Ears ringing, roaring, buzzing (%)
Audiometry - Had a job exposure to loud noise (%)
Audiometry - Had off-work exposure to loud noise (%)
Blood Pressure & Cholesterol - Has high blood pressure (%)
Blood Pressure & Cholesterol - Checking blood pressure at home (%)
Blood Pressure & Cholesterol - Frequently checking blood cholesterol (%)
Blood Pressure & Cholesterol - Has high cholesterol level (%)
Consumer Behavior - Money monthly spent on food at supermarket/grocery store
Consumer Behavior - Money monthly spent on food at other stores
Consumer Behavior - Money monthly spent on eating out
Consumer Behavior - Money monthly spent on carryout/delivered foods
Consumer Behavior - Income spent on food at supermarket/grocery store (%)
Consumer Behavior - Income spent on food at other stores (%)
Consumer Behavior - Income spent on eating out (%)
Consumer Behavior - Income spent on carryout/delivered foods (%)
Current Health Status - General health condition (%)
Current Health Status - Blood donors (%)
Current Health Status - Has blood ever tested for HIV virus (%)
Current Health Status - Left-handed people (%)
Dermatology - People using sunscreen (%)
Diabetes - Diabetics (%)
Diabetes - Had a blood test for high blood sugar (%)
Diabetes - People taking insulin (%)
Diet Behavior & Nutrition - Diet health (%)
Diet Behavior & Nutrition - Milk product consumption (# of products/month)
Diet Behavior & Nutrition - Meals not home prepared (#/week)
Diet Behavior & Nutrition - Meals from fast food or pizza place (#/week)
Diet Behavior & Nutrition - Ready-to-eat foods (#/month)
Diet Behavior & Nutrition - Frozen meals/pizza (#/month)
Drug Use - People that ever used marijuana or hashish (%)
Drug Use - Ever used hard drugs (%)
Drug Use - Ever used any form of cocaine (%)
Drug Use - Ever used heroin (%)
Drug Use - Ever used methamphetamine (%)
Health Insurance - People covered by health insurance (%)
Kidney Conditions-Urology - Avg. # of times urinating at night
Medical Conditions - People with asthma (%)
Medical Conditions - People with anemia (%)
Medical Conditions - People with psoriasis (%)
Medical Conditions - People with overweight (%)
Medical Conditions - Elderly people having difficulties in thinking or remembering (%)
Medical Conditions - People who ever received blood transfusion (%)
Medical Conditions - People having trouble seeing even with glass/contacts (%)
Medical Conditions - People with arthritis (%)
Medical Conditions - People with gout (%)
Medical Conditions - People with congestive heart failure (%)
Medical Conditions - People with coronary heart disease (%)
Medical Conditions - People with angina pectoris (%)
Medical Conditions - People who ever had heart attack (%)
Medical Conditions - People who ever had stroke (%)
Medical Conditions - People with emphysema (%)
Medical Conditions - People with thyroid problem (%)
Medical Conditions - People with chronic bronchitis (%)
Medical Conditions - People with any liver condition (%)
Medical Conditions - People who ever had cancer or malignancy (%)
Mental Health - People who have little interest in doing things (%)
Mental Health - People feeling down, depressed, or hopeless (%)
Mental Health - People who have trouble sleeping or sleeping too much (%)
Mental Health - People feeling tired or having little energy (%)
Mental Health - People with poor appetite or overeating (%)
Mental Health - People feeling bad about themself (%)
Mental Health - People who have trouble concentrating on things (%)
Mental Health - People moving or speaking slowly or too fast (%)
Mental Health - People having thoughts they would be better off dead (%)
Oral Health - Average years since last visit a dentist
Oral Health - People embarrassed because of mouth (%)
Oral Health - People with gum disease (%)
Oral Health - General health of teeth and gums (%)
Oral Health - Average days a week using dental floss/device
Oral Health - Average days a week using mouthwash for dental problem
Oral Health - Average number of teeth
Pesticide Use - Households using pesticides to control insects (%)
Pesticide Use - Households using pesticides to kill weeds (%)
Physical Activity - People doing vigorous-intensity work activities (%)
Physical Activity - People doing moderate-intensity work activities (%)
Physical Activity - People walking or bicycling (%)
Physical Activity - People doing vigorous-intensity recreational activities (%)
Physical Activity - People doing moderate-intensity recreational activities (%)
Physical Activity - Average hours a day doing sedentary activities
Physical Activity - Average hours a day watching TV or videos
Physical Activity - Average hours a day using computer
Physical Functioning - People having limitations keeping them from working (%)
Physical Functioning - People limited in amount of work they can do (%)
Physical Functioning - People that need special equipment to walk (%)
Physical Functioning - People experiencing confusion/memory problems (%)
Physical Functioning - People requiring special healthcare equipment (%)
Prescription Medications - Average number of prescription medicines taking
Preventive Aspirin Use - Adults 40+ taking low-dose aspirin (%)
Reproductive Health - Vaginal deliveries (%)
Reproductive Health - Cesarean deliveries (%)
Reproductive Health - Deliveries resulted in a live birth (%)
Reproductive Health - Pregnancies resulted in a delivery (%)
Reproductive Health - Women breastfeeding newborns (%)
Reproductive Health - Women that had a hysterectomy (%)
Reproductive Health - Women that had both ovaries removed (%)
Reproductive Health - Women that have ever taken birth control pills (%)
Reproductive Health - Women taking birth control pills (%)
Reproductive Health - Women that have ever used Depo-Provera or injectables (%)
Reproductive Health - Women that have ever used female hormones (%)
Sexual Behavior - People 18+ that ever had sex (vaginal, anal, or oral) (%)
Sexual Behavior - Males 18+ that ever had vaginal sex with a woman (%)
Sexual Behavior - Males 18+ that ever performed oral sex on a woman (%)
Sexual Behavior - Males 18+ that ever had anal sex with a woman (%)
Sexual Behavior - Males 18+ that ever had any sex with a man (%)
Sexual Behavior - Females 18+ that ever had vaginal sex with a man (%)
Sexual Behavior - Females 18+ that ever performed oral sex on a man (%)
Sexual Behavior - Females 18+ that ever had anal sex with a man (%)
Sexual Behavior - Females 18+ that ever had any kind of sex with a woman (%)
Sexual Behavior - Average age people first had sex
Sexual Behavior - Average number of female sex partners in lifetime (males 18+)
Sexual Behavior - Average number of female vaginal sex partners in lifetime (males 18+)
Sexual Behavior - Average age people first performed oral sex on a woman (18+)
Sexual Behavior - Average number of woman performed oral sex on in lifetime (18+)
Sexual Behavior - Average number of male sex partners in lifetime (males 18+)
Sexual Behavior - Average number of male anal sex partners in lifetime (males 18+)
Sexual Behavior - Average age people first performed oral sex on a man (18+)
Sexual Behavior - Average number of male oral sex partners in lifetime (18+)
Sexual Behavior - People using protection when performing oral sex (%)
Sexual Behavior - Average number of times people have vaginal or anal sex a year
Sexual Behavior - People having sex without condom (%)
Sexual Behavior - Average number of male sex partners in lifetime (females 18+)
Sexual Behavior - Average number of male vaginal sex partners in lifetime (females 18+)
Sexual Behavior - Average number of female sex partners in lifetime (females 18+)
Sexual Behavior - Circumcised males 18+ (%)
Sleep Disorders - Average hours sleeping at night
Sleep Disorders - People that has trouble sleeping (%)
Smoking-Cigarette Use - People smoking cigarettes (%)
Taste & Smell - People 40+ having problems with smell (%)
Taste & Smell - People 40+ having problems with taste (%)
Taste & Smell - People 40+ that ever had wisdom teeth removed (%)
Taste & Smell - People 40+ that ever had tonsils teeth removed (%)
Taste & Smell - People 40+ that ever had a loss of consciousness because of a head injury (%)
Taste & Smell - People 40+ that ever had a broken nose or other serious injury to face or skull (%)
Taste & Smell - People 40+ that ever had two or more sinus infections (%)
Weight - Average height (inches)
Weight - Average weight (pounds)
Weight - Average BMI
Weight - People that are obese (%)
Weight - People that ever were obese (%)
Weight - People trying to lose weight (%)
39,257 66.6% White alone 8,428 14.3% Black alone 4,059 6.9% Asian alone 4,078 6.9% Hispanic 2,493 4.2% Two or more races 348 0.6% Other race alone 210 0.4% American Indian alone 4 0.01% Native Hawaiian and Other
According to our research of Alabama and other state lists, there were 34 registered sex offenders living in Madison, Alabama as of April 25, 2024 . The ratio of all residents to sex offenders in Madison is 1,392 to 1.The ratio of registered sex offenders to all residents in this city is much lower than the state average.
The City-Data.com crime index weighs serious crimes and violent crimes more heavily. Higher means more crime, U.S. average is 246.1. It adjusts for the number of visitors and daily workers commuting into cities.
- means the value is smaller than the state average.
- means the value is about the same as the state average.
- means the value is bigger than the state average.
Crime rate in Madison detailed stats: murders, rapes, robberies, assaults, burglaries, thefts, arson Officers per 1,000 residents here:
1.47Alabama average:
2.40
Latest news from Madison, AL collected exclusively by city-data.com from local newspapers, TV, and radio stations
Ancestries: English (13.5%), American (12.6%), German (6.6%), European (5.0%), Irish (4.8%), Scottish (2.2%).
Current Local Time:
Land area: 23.2 square miles.
Population density: 2,582 people per square mile (average).
5,920 residents are foreign born (5.5% Asia , 2.5% Latin America , 1.5% Europe ).
This city:
10.0%Alabama:
3.5%
Median real estate property taxes paid for housing units with mortgages in 2022: $1,669 (0.4%)Median real estate property taxes paid for housing units with no mortgage in 2022: $1,619 (0.4%)
Nearest city with pop. 50,000+: Huntsville, AL
Nearest city with pop. 200,000+: Birmingham, AL
Nearest city with pop. 1,000,000+: Chicago, IL
Nearest cities:
Mooresville, AL (3.2 miles),
Latitude: 34.72 N, Longitude: 86.74 W
Nickname or alias (official or unofficial): Where Progress Meets Preservation
Daytime population change due to commuting: -3,130 (-5.3%)Workers who live and work in this city: 9,891 (34.7%)
Single-family new house construction building permits:
2022: 293 buildings , average cost: $382,3002021: 345 buildings , average cost: $385,4002020: 438 buildings , average cost: $322,5002019: 369 buildings , average cost: $335,3002018: 408 buildings , average cost: $340,8002017: 558 buildings , average cost: $303,4002016: 490 buildings , average cost: $319,9002015: 466 buildings , average cost: $360,2002014: 338 buildings , average cost: $384,7002013: 327 buildings , average cost: $404,7002012: 326 buildings , average cost: $388,0002011: 374 buildings , average cost: $332,7002010: 281 buildings , average cost: $368,9002009: 268 buildings , average cost: $345,8002008: 227 buildings , average cost: $223,3002007: 364 buildings , average cost: $216,5002006: 630 buildings , average cost: $138,9002005: 504 buildings , average cost: $186,4002004: 693 buildings , average cost: $65,5002003: 539 buildings , average cost: $70,6002002: 559 buildings , average cost: $67,9002001: 455 buildings , average cost: $65,9002000: 378 buildings , average cost: $70,0001999: 500 buildings , average cost: $65,6001998: 535 buildings , average cost: $62,4001997: 512 buildings , average cost: $62,700Unemployment in December 2023:
Population change in the 1990s: +14,475 (+97.4%).
Most common occupations in Madison, AL (%)
Both Males Females
Computer specialists (10.1%)
Engineers (8.8%)
Other management occupations, except farmers and farm managers (6.5%)
Other sales and related occupations, including supervisors (3.7%)
Retail sales workers, except cashiers (3.6%)
Preschool, kindergarten, elementary, and middle school teachers (3.5%)
Other production occupations, including supervisors (3.1%)
Engineers (14.2%)
Computer specialists (11.9%)
Other management occupations, except farmers and farm managers (7.9%)
Other production occupations, including supervisors (4.0%)
Operations specialties managers, except financial managers (3.7%)
Retail sales workers, except cashiers (3.3%)
Other sales and related occupations, including supervisors (3.3%)
Computer specialists (7.9%)
Preschool, kindergarten, elementary, and middle school teachers (7.3%)
Secretaries and administrative assistants (4.9%)
Other management occupations, except farmers and farm managers (4.8%)
Information and record clerks, except customer service representatives (4.4%)
Other sales and related occupations, including supervisors (4.1%)
Other office and administrative support workers, including supervisors (4.0%)
Tornado activity:
Madison-area historical tornado activity is slightly above Alabama state average. It is 147% greater than the overall U.S. average.
On 4/3/1974, a category F5 (max. wind speeds 261-318 mph) tornado 8.3 miles away from the Madison city center killed 28 people and injured 267 people .
On 4/3/1974, a category F5 tornado 17.7 miles away from the city center killed 16 people and injured 190 people .
Earthquake activity:
Madison-area historical earthquake activity is significantly above Alabama state average. It is 169% greater than the overall U.S. average. On 4/29/2003 at 08:59:39, a magnitude 4.9 (4.4 MB, 4.6 MW, 4.9 LG, Class: Light, Intensity: IV - V) earthquake occurred 65.1 miles away from Madison center On 1/18/1999 at 07:00:53, a magnitude 4.8 (4.8 MB, 4.0 LG, Depth: 0.6 mi) earthquake occurred 95.3 miles away from Madison center On 4/29/2003 at 08:59:39, a magnitude 4.6 (4.6 MW, Depth: 12.3 mi) earthquake occurred 65.0 miles away from Madison center On 4/18/2008 at 09:36:59, a magnitude 5.4 (5.1 MB, 4.8 MS, 5.4 MW, 5.2 MW, Class: Moderate, Intensity: VI - VII) earthquake occurred 266.2 miles away from the city center On 6/24/1975 at 11:11:36, a magnitude 4.5 (4.5 MB) earthquake occurred 93.3 miles away from Madison center On 3/25/1976 at 00:41:20, a magnitude 5.0 (4.9 MB, 5.0 LG) earthquake occurred 212.6 miles away from Madison center Magnitude types: regional Lg-wave magnitude (LG), body-wave magnitude (MB), surface-wave magnitude (MS), moment magnitude (MW) Natural disasters: The number of natural disasters in Madison County (17) is near the US average (15).Major Disasters (Presidential) Declared: 10Emergencies Declared: 5Storms: 8, Tornadoes: 8, Floods: 6, Hurricanes: 3, Winds: 3, Drought: 1, Freeze: 1, Ice Storm: 1, Snowfall: 1, Winter Storm: 1, Other: 1 (Note: some incidents may be assigned to more than one category). Hospitals and medical centers in Madison: MADISON MANOR NH (BOX 350 WALL TRIANA HIGHWAY)
MADISON MANOR NURSING HOME (3891 SULLIVAN ST)
VALLEY VIEW HEALTH AND REHABILITATION, LLC (5968 WALL TRIANA HIGHWAY)
FMC ODYSSEY DIALYSIS (40 HUGHES ROAD)
Operable nuclear power plants near Madison:
17 miles: Browns Ferry 1 and 2 in Decatur, AL.17 miles: Browns Ferry 3 in Decatur, AL.
Colleges/Universities in Madison: ITT Technical Institute-Madison Full-time enrollment: 398; Location: 9238 Madison Blvd, Ste 500; Private, for-profit; Website: www.itt-tech.edu)
Paul Mitchell the School-Huntsville Full-time enrollment: 98; Location: 3810 Sullivan St Ste F; Private, for-profit; Website: www.pmtshuntsville.com)
Colleges/universities with over 2000 students nearest to Madison:
University of Alabama in Huntsville (about 6 miles; Huntsville, AL ; Full-time enrollment: 6,006)
Alabama A & M University (about 11 miles; Normal, AL ; FT enrollment: 4,524)
John C Calhoun State Community College (about 13 miles; Tanner, AL ; FT enrollment: 7,911)
Athens State University (about 15 miles; Athens, AL ; FT enrollment: 2,771)
George C Wallace State Community College-Hanceville (about 45 miles; Hanceville, AL ; FT enrollment: 4,486)
Snead State Community College (about 49 miles; Boaz, AL ; FT enrollment: 2,023)
Northeast Alabama Community College (about 49 miles; Rainsville, AL ; FT enrollment: 2,409)
Public high schools in Madison: BOB JONES HIGH SCH Students: 1,937, Location: 650 HUGHES RD, Grades: 9-12)JAMES CLEMENS HIGH SCHOOL Location: 11306 COUNTY LINE ROAD, Grades: 9-12)
Private high schools in Madison: MADISON ACADEMY Students: 895, Location: 325 SLAUGHTER RD, Grades: PK-12)
MADISON BAPTIST ACADEMY Students: 77, Location: 840 BALCH RD, Grades: KG-12)
THREE SPRINGS SCHOOL OF MADISON Students: 59, Location: 1329 BROWNS FERRY RD, Grades: 6-12, Boys only )
Biggest public elementary/middle schools in Madison: DISCOVERY MIDDLE SCH Students: 1,044, Location: 1304 HUGHES RD, Grades: 7-8)LIBERTY MIDDLE SCH Students: 933, Location: 281 DOCK MURPHY DR, Grades: 7-8)HERITAGE ELEM SCH Students: 905, Location: 11775 COUNTY LINE RD, Grades: KG-6)RAINBOW ELEM SCH Students: 878, Location: 50 NANCE RD, Grades: PK-6)COLUMBIA ELEM SCH Students: 834, Location: 667 BALCH ROAD, Grades: KG-6)LEGACY ELEM SCH Students: 781, Location: 165 PINE GROVE ROAD, Grades: PK-5)HORIZON ELEM SCH Students: 625, Location: 7855 OLD MADISON PIKE, Grades: KG-6)MADISON ELEM SCH Students: 447, Location: 17 COLLEGE ST, Grades: KG-6)WEST MADISON ELEM SCH Students: 426, Location: 4976 WALL TRIANA HWY, Grades: PK-6)MILL CREEK ELEMENTARY SCHOOL Location: 847 MILL ROAD, Grades: PK-6)
Private elementary/middle schools in Madison: ST JOHN THE BAPTIST CATHOLIC SCHOOL Students: 469, Location: 1057 HUGHES RD, Grades: PK-8)
PREMIER SCHOOL Students: 138, Location: 1827 SLAUGHTER RD, Grades: PK-1)
See full list of schools located in Madison
Notable locations in Madison: (A) , Madison Industrial Park (B) , Putnam Industrial Park (C) , Madison Fire and Rescue Station 2 (D) , Madison Fire and Rescue Station 1 (E) . Display/hide their locations on the map
Shopping Centers: (1) , Madison Mall Shopping Center (2) . Display/hide their locations on the map
Churches in Madison include: (A) , Cedar Acres Church (B) , Saint Peter African Methodist Episcopal Church (C) , Mason Christian Methodist Episcopal Chapel (D) , Big Shiloh Primitive Baptist Church (E) , Church of Christ (F) , Berea Church (G) , Little Shiloh Primitive Baptist Church (H) , Madison Baptist Church (I) . Display/hide their locations on the map
Cemeteries: (1) , Palmer Cemetery (2) , Moore Cemetery (3) , Washington Cemetery (4) , Whitworth Cemetery (5) , Farley Cemetery (6) , Faith Memorial Cemetery (7) . Display/hide their locations on the map
Swamps: (A) . Display/hide its location on the map
Creek: (A) . Display/hide its location on the map
Parks in Madison include: (1) , Hughs Park (2) . Display/hide their locations on the map
Tourist attractions: (1) , Insanity Skate Inc (Amusement & Theme Parks; 100 Skatepark Road) (2) , Capital Trailways (Tours & Charters; 8430 Segers Road) (3) , Capital Motor Lines (Tours & Charters; 9091 Madison Boulevard) (4) , Elite Travel (Tours & Charters; Huntsville Internati) (5) . Display/hide their approximate locations on the map
Hotels: (1) , Federal Square Motel & Suites (8781 Madison Blvd) (2) , Ramada Inn (8716 Madison Boulevard) (3) , Huntsville-Days Inn Airport/Space Center (102 Arlington Dr) (4) , Radisson Inn Huntsville Arprt (8721 Madison Boulevard) (5) , Four Points by Sheraton (1000 Glenn Hearn Boulevard) (6) , Holiday Inn Huntsville West-I 565 (9035 Madison Boulevard) (7) , Howard Johnson (8721 Madison Boulevard) (8) , Motel 6 (8995 Madison Boulevard) (9) . Display/hide their approximate locations on the map
Court: (1) . Display/hide its approximate location on the map
Birthplace of: Fernandez Lockett - College basketball player (Austin Peay Governors), Jordan Howell - College basketball player (Tennessee Volunteers), Shema Mbyirukira - College basketball player (Birmingham Sou Panthers), Thomas Viglianco - College basketball player (Birmingham Sou Panthers).
Madison County has a predicted average indoor radon screening level greater than 4 pCi/L (pico curies per liter) - Highest Potential Drinking water stations with addresses in Madison and their reported violations in the past:
MADISON WATER WORKS & SEWER (Address: 101 Ray Sanderson Drive Population served: 39,051, Groundwater under infl of surface water):
Past monitoring violations:
Monitoring and Reporting (DBP) - Between JAN-16-2014 and APR-16-2014, Contaminant: TTHM. Follow-up actions: St Violation/Reminder Notice (NOV-07-2013), St Public Notif requested (NOV-07-2013)
Monitoring and Reporting (DBP) - Between JAN-16-2014 and APR-16-2014, Contaminant: Total Haloacetic Acids (HAA5). Follow-up actions: St Violation/Reminder Notice (NOV-07-2013), St Public Notif requested (NOV-07-2013)
Monitoring and Reporting (DBP) - Between OCT-21-2013 and JAN-15-2014, Contaminant: TTHM. Follow-up actions: St Public Notif requested (NOV-07-2013), St Violation/Reminder Notice (NOV-07-2013), St Compliance achieved (MAY-07-2014)
Monitoring and Reporting (DBP) - Between OCT-21-2013 and JAN-15-2014, Contaminant: Total Haloacetic Acids (HAA5). Follow-up actions: St Public Notif requested (NOV-07-2013), St Violation/Reminder Notice (NOV-07-2013), St Compliance achieved (MAY-07-2014)
Monitoring and Reporting (DBP) - Between JUL-11-2013 and OCT-20-2013, Contaminant: TTHM. Follow-up actions: St Public Notif requested (NOV-07-2013), St Violation/Reminder Notice (NOV-07-2013), St Compliance achieved (FEB-27-2014)
14 regular monitoring violations
2 other older monitoring violations
Average household size: This city:
2.6 peopleAlabama:
2.5 people
Percentage of family households: This city:
73.1%Whole state:
67.8%
Percentage of households with unmarried partners: This city:
3.0%Whole state:
4.7%
Likely homosexual households (counted as self-reported same-sex unmarried-partner households)
Lesbian couples: 0.2% of all households Gay men: 0.2% of all households
225 people in nursing facilities/skilled-nursing facilities in 2010people in correctional facilities intended for juveniles in 2010People in group quarters in Madison in 2000:
179 people in nursing homes
46 people in other noninstitutional group quarters
29 people in training schools for juvenile delinquents
Banks with most branches in Madison (2011 data):
Regions Bank: South Madison Branch, South Madison, North Madison Branch. Info updated 2011/02/24: Bank assets: $123,368.2 mil, Deposits: $98,301.3 mil, headquarters in Birmingham, AL, positive income , Commercial Lending Specialization, 1778 total offices , Holding Company: Regions Financial Corporation
BancorpSouth Bank: Madison Branch at 7302 Highway 72 West, branch established on 2008/06/30; Hughes Road Branch at 41 Hughes Road, branch established on 2008/02/11. Info updated 2007/07/18: Bank assets: $12,990.3 mil, Deposits: $10,863.8 mil, headquarters in Tupelo, MS, positive income , Commercial Lending Specialization, 271 total offices , Holding Company: Bancorpsouth, Inc.
Wells Fargo Bank, National Association: Madison Branch at 9044 Highway 20 West, branch established on 1986/07/14; Highway 72 West Branch at 7796 Highway 72 West, branch established on 1993/07/24. Info updated 2011/04/05: Bank assets: $1,161,490.0 mil, Deposits: $905,653.0 mil, headquarters in Sioux Falls, SD, positive income , 6395 total offices , Holding Company: Wells Fargo & Company
PNC Bank, National Association: North Madison Branch at 7930 U.S. Highway 72 West, branch established on 1994/12/29; Hughes Road Branch at 25 Hughes Road, branch established on 2005/03/14. Info updated 2012/03/20: Bank assets: $263,309.6 mil, Deposits: $197,343.0 mil, headquarters in Wilmington, DE, positive income , Commercial Lending Specialization, 3085 total offices , Holding Company: Pnc Financial Services Group, Inc., The
Synovus Bank: Madison Branch at 7770 Highway 72 West, branch established on 2007/01/29; Madison Branch at 11 Hughes Road, branch established on 1997/10/01. Info updated 2011/01/25: Bank assets: $26,863.3 mil, Deposits: $22,415.0 mil, headquarters in Columbus, GA, positive income , Commercial Lending Specialization, 296 total offices , Holding Company: Synovus Financial Corp.
Cadence Bank, N.A.: Madison Branch at 3751 Sullivan Street, branch established on 1989/04/11. Info updated 2011/12/14: Bank assets: $3,909.7 mil, Deposits: $3,124.0 mil, headquarters in Birmingham, AL, positive income , Commercial Lending Specialization, 112 total offices , Holding Company: Cadence Bancorp Llc
EvaBank: Arlington Place Branch at 3810 Sullivan Street, branch established on 2007/05/07. Info updated 2011/12/20: Bank assets: $352.1 mil, Deposits: $310.4 mil, headquarters in Eva, AL, positive income , Consumer Lending Specialization, 5 total offices
SouthBank, a Federal Savings Bank: 8848 Alabama Highway 20 at 8848 Alabama Highway 20, branch established on 1995/05/29. Info updated 2011/07/21: Bank assets: $242.2 mil, Deposits: $183.8 mil, headquarters in Huntsville, AL, negative income in the last year , Commercial Lending Specialization, 13 total offices
Woodforest National Bank: Madison Branch at 8650 Madison Blvd, branch established on 2009/05/16. Info updated 2011/05/10: Bank assets: $3,488.9 mil, Deposits: $3,097.6 mil, headquarters in Houston, TX, positive income , Commercial Lending Specialization, 766 total offices , Holding Company: Woodforest Financial Group Employee Stock Ownership Plan (With 401(K) Provisions)
7 other banks with 7 local branches
For population 15 years and over in Madison:
Never married: 25.0%Now married: 61.0%Separated: 0.9%Widowed: 4.6%Divorced: 8.5% For population 25 years and over in Madison:
High school or higher: 97.2%Bachelor's degree or higher: 64.2%Graduate or professional degree: 29.5%Unemployed: 2.6%Mean travel time to work (commute): 16.5 minutes
Education Gini index (Inequality in education) Here:
9.2Alabama average:
11.5
Religion statistics for Madison, AL (based on Madison County data)
Religion Adherents Congregations Evangelical Protestant 105,503 284 Mainline Protestant 35,533 72 Catholic 14,157 6 Black Protestant 6,710 41 Other 6,587 27 Orthodox 340 2 None 165,981 -
Source: Clifford Grammich, Kirk Hadaway, Richard Houseal, Dale E.Jones, Alexei Krindatch, Richie Stanley and Richard H.Taylor. 2012. 2010 U.S.Religion Census: Religious Congregations & Membership Study. Association of Statisticians of American Religious Bodies. Jones, Dale E., et al. 2002. Congregations and Membership in the United States 2000. Nashville, TN: Glenmary Research Center. Graphs represent county-level data
Food Environment Statistics: Number of grocery stores : 35Madison County :
1.12 / 10,000 pop.Alabama :
1.89 / 10,000 pop.
Number of supercenters and club stores : 9This county :
0.29 / 10,000 pop.State :
0.20 / 10,000 pop.
Number of convenience stores (no gas) : 16This county :
0.51 / 10,000 pop.Alabama :
0.65 / 10,000 pop.
Number of convenience stores (with gas) : 177Here :
5.66 / 10,000 pop.State :
6.32 / 10,000 pop.
Number of full-service restaurants : 202Madison County :
6.47 / 10,000 pop.Alabama :
5.75 / 10,000 pop.
Low-income preschool obesity rate : This county :
14.1%State :
13.5%
Health and Nutrition: Healthy diet rate : This city:
53.0%Alabama:
49.0%
Average overall health of teeth and gums : People feeling badly about themselves : Madison:
19.9%Alabama:
20.7%
People not drinking alcohol at all : This city:
9.1%Alabama:
11.0%
Average hours sleeping at night : Overweight people : Madison:
33.2%Alabama:
34.4%
General health condition : Madison:
60.7%Alabama:
55.2%
Average condition of hearing : Madison:
82.5%Alabama:
79.3%
More about Health and Nutrition of Madison, AL Residents
Local government employment and payroll (March 2022)
Function
Full-time employees
Monthly full-time payroll
Average yearly full-time wage
Part-time employees
Monthly part-time payroll
Police Protection - Officers
81 $489,463 $72,513 0 $0 Firefighters
68 $443,110 $78,196 0 $0 Streets and Highways
54 $238,831 $53,074 0 $0 Other and Unallocable
45 $197,769 $52,738 3 $3,184 Other Government Administration
23 $113,781 $59,364 3 $2,447 Police - Other
22 $89,745 $48,952 12 $5,589 Parks and Recreation
19 $79,562 $50,250 33 $17,949 Financial Administration
17 $99,503 $70,237 0 $0 Water Supply
17 $96,133 $67,859 0 $0 Sewerage
16 $87,387 $65,540 1 $1,163 Judicial and Legal
9 $50,021 $66,695 1 $642 Fire - Other
3 $13,642 $54,568 0 $0 Health
3 $9,750 $39,000 0 $0 Welfare
2 $4,765 $28,590 0 $0
Totals for Government
379 $2,013,461 $63,751 53 $30,973
Madison government finances - Expenditure in 2021 (per resident):
Construction - Parks and Recreation: $19,337,000 ($323.44)
Water Utilities: $12,759,000 ($213.41)Sewerage: $11,178,000 ($186.97)Regular Highways: $3,707,000 ($62.01)General - Other: $203,000 ($3.40)Current Operations - Central Staff Services: $7,373,000 ($123.33)
Police Protection: $6,901,000 ($115.43)Local Fire Protection: $5,654,000 ($94.57)Regular Highways: $4,566,000 ($76.37)Sewerage: $3,616,000 ($60.48)Water Utilities: $3,305,000 ($55.28)Parks and Recreation: $2,577,000 ($43.10)Judicial and Legal Services: $1,635,000 ($27.35)Solid Waste Management: $1,609,000 ($26.91)Financial Administration: $1,489,000 ($24.91)General - Other: $1,487,000 ($24.87)Protective Inspection and Regulation - Other: $986,000 ($16.49)Libraries: $981,000 ($16.41)Miscellaneous Commercial Activities - Other: $8,000 ($0.13)General - Interest on Debt: $9,304,000 ($155.62)
Other Capital Outlay - General - Other: $1,325,000 ($22.16)
Parks and Recreation: $712,000 ($11.91)Total Salaries and Wages: $18,807,000 ($314.58)
Water Utilities - Interest on Debt: $5,203,000 ($87.03)
Madison government finances - Revenue in 2021 (per resident):
Charges - Sewerage: $10,976,000 ($183.59)
Solid Waste Management: $1,535,000 ($25.68)Parks and Recreation: $508,000 ($8.50)Other: $373,000 ($6.24)Miscellaneous Commercial Activities: $50,000 ($0.84)Miscellaneous - Special Assessments: $5,035,000 ($84.22)
Sale of Property: $1,603,000 ($26.81)Interest Earnings: $997,000 ($16.68)Fines and Forfeits: $820,000 ($13.72)General Revenue - Other: $609,000 ($10.19)Rents: $126,000 ($2.11)Donations From Private Sources: $84,000 ($1.41)Revenue - Water Utilities: $11,328,000 ($189.48)
State Intergovernmental - Health and Hospitals: $2,481,000 ($41.50)
Highways: $1,038,000 ($17.36)Other: $39,000 ($0.65)General Local Government Support: $24,000 ($0.40)Tax - General Sales and Gross Receipts: $27,605,000 ($461.74)
Property: $9,990,000 ($167.10)Occupation and Business License - Other: $3,406,000 ($56.97)Public Utilities Sales: $2,834,000 ($47.40)Other Selective Sales: $2,761,000 ($46.18)Other License: $2,408,000 ($40.28)Alcoholic Beverage Sales: $1,376,000 ($23.02)Motor Fuels Sales: $514,000 ($8.60)Tobacco Products Sales: $144,000 ($2.41)
Madison government finances - Debt in 2021 (per resident):
Long Term Debt - Outstanding Unspecified Public Purpose: $406,030,000 ($6791.50)
Beginning Outstanding - Unspecified Public Purpose: $351,835,000 ($5885.00)Issue, Unspecified Public Purpose: $111,370,000 ($1862.84)Retired Unspecified Public Purpose: $57,175,000 ($956.34)
Madison government finances - Cash and Securities in 2021 (per resident):
Bond Funds - Cash and Securities: $82,068,000 ($1372.72)
Other Funds - Cash and Securities: $57,319,000 ($958.75)
Sinking Funds - Cash and Securities: $13,426,000 ($224.57)
7.25% of this county's 2021 resident taxpayers lived in other counties in 2020 ($73,277 average adjusted gross income )
Here:
7.25%Alabama average:
6.87%
0.07% of residents moved from foreign countries ($1,008 average AGI )Madison County:
0.07%Alabama average:
0.02%
Top counties from which taxpayers relocated into this county between 2020 and 2021:
6.24% of this county's 2020 resident taxpayers moved to other counties in 2021 ($77,445 average adjusted gross income )
Here:
6.24%Alabama average:
6.41%
0.04% of residents moved to foreign countries ($728 average AGI )Madison County:
0.04%Alabama average:
0.02%
Top counties to which taxpayers relocated from this county between 2020 and 2021:
Businesses in Madison, AL
Name Count Name Count
AT&T 1 Maurices 1 Academy Sports + Outdoors 1 McDonald's 2 Advance Auto Parts 1 Motel 6 1 Applebee's 1 Outback 1 Arby's 2 Outback Steakhouse 1 AutoZone 1 Papa John's Pizza 1 Baymont Inn 1 Penske 2 Burger King 2 Pizza Hut 1 CVS 2 Publix Super Markets 3 Chick-Fil-A 1 Quiznos 1 Cracker Barrel 1 RadioShack 1 Curves 2 Rite Aid 2 DHL 1 Ruby Tuesday 2 Dairy Queen 1 Rue21 1 Domino's Pizza 2 Ryder Rental & Truck Leasing 1 FedEx 7 SONIC Drive-In 2 GNC 1 Sprint Nextel 1 GameStop 1 Staples 1 H&R Block 3 Starbucks 1 Hardee's 2 Subway 5 Hilton 1 T-Mobile 3 Holiday Inn 1 Taco Bell 2 Home Depot 1 U-Haul 4 KFC 2 UPS 4 Kohl's 1 Vans 1 Kroger 1 Waffle House 1 La Quinta 1 Walgreens 1 Little Caesars Pizza 1 Walmart 1 Lowe's 1 Wendy's 2 MasterBrand Cabinets 1 YMCA 1
Strongest AM radio stations in Madison:
WLOR (1550 AM; 50 kW; HUNTSVILLE, AL; Owner: BCA RADIO, LLC)
WUMP (730 AM; 1 kW; MADISON, AL; Owner: TENNESSEE VALLEY RADIO, INC.)
WDJL (1000 AM; daytime; 10 kW; HUNTSVILLE, AL; Owner: JAMES K. SHARP DBA 5TH AVE BROADCASTING)
WEUP (1600 AM; 10 kW; HUNTSVILLE, AL; Owner: HUNDLEY BATTS, SR. & VIRGINIA CAPLES)
WEUV (1700 AM; 10 kW; HUNTSVILLE, AL; Owner: HUNDLEY BATTS, SR & VIRGINIA CAPLES)
WVNN (770 AM; 10 kW; ATHENS, AL; Owner: ATHENS BROADCASTING COMPANY, INC.)
WBXR (1140 AM; daytime; 15 kW; HAZEL GREEN, AL; Owner: LOW COUNTRY CORPORATION, INC.)
WKAC (1080 AM; daytime; 5 kW; ATHENS, AL; Owner: LIMESTONE BROADCASTING COMPANY, INC.)
WYAM (890 AM; daytime; 2 kW; HARTSELLE, AL; Owner: DECATUR COMMUNICATIONS PROPERTIES, LLC)
WWAM (820 AM; daytime; 50 kW; JASPER, TN; Owner: SHELTON BROADCASTING SYSTEM)
WBHP (1230 AM; 1 kW; HUNTSVILLE, AL; Owner: CAPSTAR TX LIMITED PARTNERSHIP)
WTKI (1450 AM; 1 kW; HUNTSVILLE, AL; Owner: MOUNTAIN MIST MEDIA, LLC)
WDJC (850 AM; 50 kW; BIRMINGHAM, AL; Owner: KIMTRON, INC.)
Strongest FM radio stations in Madison:
WAHR (99.1 FM; HUNTSVILLE, AL; Owner: BCA RADIO, LLC)
WZYP (104.3 FM; ATHENS, AL; Owner: ATHENS BROADCASTING COMPANY, INC.)
W278AA (103.5 FM; MADISON, AL; Owner: TENNESSEE VALLEY RADIO, INC.)
WDRM (102.1 FM; DECATUR, AL; Owner: CAPSTAR TX LIMITED PARTNERSHIP)
WRTT-FM (95.1 FM; HUNTSVILLE, AL; Owner: BCA RADIO, LLC)
W222AK (92.3 FM; HUNTSVILLE, AL; Owner: PRESS W. PARHAM)
W289AC (105.7 FM; HUNTSVILLE, AL; Owner: WILLIAM PAXTON ROGERS)
WYFD (91.7 FM; DECATUR, AL; Owner: BIBLE BROADCASTING NETWORK, INC.)
WAYH (88.1 FM; HARVEST, AL; Owner: WAY-FM MEDIA GROUP, INC.)
WXQW (94.1 FM; MERIDIANVILLE, AL; Owner: CAPSTAR TX LIMITED PARTNERSHIP)
W293AH (106.5 FM; NORMAL, AL; Owner: CAPSTAR TX LIMITED PARTNERSHIP)
W251AC (98.1 FM; CHAPSHAW, AL; Owner: WILLIAM PAXTON ROGERS)
W249BB (97.7 FM; HUNTSVILLE, AL; Owner: WAY-FM MEDIA GROUP, INC.)
W275AA (102.9 FM; HUNTSVILLE, AL; Owner: ARCHIE C. BOBO, PERSONAL REP. OF DORSEY E. NEWMAN ESTATE)
W300AH (107.9 FM; HUNTSVILLE, AL; Owner: PORTER L. BATTS)
W202BV (88.3 FM; HUNTSVILLE, AL; Owner: WAY-FM MEDIA GROUP, INC.)
W298AF (107.5 FM; HADEN, AL; Owner: HADEN RADIO COMPANY)
WOCG (90.1 FM; HUNTSVILLE, AL; Owner: OAKWOOD COLLEGE)
WLRH (89.3 FM; HUNTSVILLE, AL; Owner: ALABAMA EDUCATIONAL TELEVISION COMMISSION)
WRSA-FM (96.9 FM; DECATUR, AL; Owner: NCA, INC.)
TV broadcast stations around Madison:
WZDX (Channel 54; HUNTSVILLE, AL; Owner: HUNTSVILLE TELEVISION ACQUISITION CORP.)
WAAY-TV (Channel 31; HUNTSVILLE, AL; Owner: PIEDMONT TELEVISION OF HUNTSVILLE LICENSE LLC)
WHNT-TV (Channel 19; HUNTSVILLE, AL; Owner: NEW YORK TIMES MANAGEMENT SERVICES)
WTZT-LP (Channel 11; ATHENS, AL; Owner: WTZT-LP TELEVISION STATION, L.L.C.)
W38BQ (Channel 38; HUNTSVILLE, AL; Owner: THREE ANGELS BROADCASTING NETWORK)
W67CO (Channel 67; HUNTSVILLE, AL; Owner: TRINITY BROADCASTING NETWORK)
WHIQ (Channel 25; HUNTSVILLE, AL; Owner: ALABAMA EDUCATIONAL TELEVISION COMMISSION)
WYAM-LP (Channel 56; DECATUR, AL; Owner: DECATUR COMMUNICATION PROPERTIES, LLC)
WMJN-LP (Channel 43; DECATUR, AL; Owner: FIRST CULLMAN BROADCASTING, INC.)
National Bridge Inventory (NBI) Statistics 32 Number of bridges200ft / 60.8m Total length $35,644,000 Total costs100,175 Total average daily traffic11,636 Total average daily truck traffic
New bridges - historical statistics
3 1930-1939 2 1940-1949 2 1950-1959 1 1960-1969 6 1980-1989 5 1990-1999 5 2000-2009 7 2010-2019 1 2020-2022
See full National Bridge Inventory statistics for Madison, AL
Home Mortgage Disclosure Act Aggregated Statistics For Year 2009(Based on 1 full and 5 partial tracts) A) FHA, FSA/RHS & VA B) Conventional C) Refinancings D) Home Improvement Loans E) Loans on Dwellings For 5+ Families F) Non-occupant Loans on G) Loans On Manufactured Number Average Value Number Average Value Number Average Value Number Average Value Number Average Value Number Average Value Number Average Value
LOANS ORIGINATED 224 $193,654 285 $215,105 1,216 $208,230 62 $49,181 1 $8,200,000 38 $137,482 1 $42,700 APPLICATIONS APPROVED, NOT ACCEPTED 1 $178,890 14 $241,944 70 $207,543 5 $41,902 0 $0 2 $71,450 0 $0 APPLICATIONS DENIED 13 $208,444 29 $208,877 236 $192,393 18 $31,954 0 $0 7 $155,620 0 $0 APPLICATIONS WITHDRAWN 29 $187,514 40 $250,593 231 $200,019 2 $89,225 0 $0 6 $216,687 0 $0 FILES CLOSED FOR INCOMPLETENESS 5 $129,566 4 $369,390 56 $210,990 3 $80,567 0 $0 1 $13,110 0 $0
Aggregated Statistics For Year 2008(Based on 1 full and 5 partial tracts) A) FHA, FSA/RHS & VA B) Conventional C) Refinancings D) Home Improvement Loans E) Loans on Dwellings For 5+ Families F) Non-occupant Loans on G) Loans On Manufactured Number Average Value Number Average Value Number Average Value Number Average Value Number Average Value Number Average Value Number Average Value
LOANS ORIGINATED 189 $190,207 417 $201,305 501 $203,316 62 $62,722 1 $17,717,750 74 $128,122 1 $13,920 APPLICATIONS APPROVED, NOT ACCEPTED 7 $155,857 34 $225,469 45 $157,434 6 $60,475 0 $0 6 $105,447 0 $0 APPLICATIONS DENIED 8 $158,656 38 $171,453 218 $185,043 55 $47,788 0 $0 15 $124,139 4 $73,360 APPLICATIONS WITHDRAWN 20 $150,046 52 $188,068 134 $197,937 10 $91,169 0 $0 13 $125,649 0 $0 FILES CLOSED FOR INCOMPLETENESS 4 $227,658 14 $232,199 39 $236,427 2 $152,680 0 $0 2 $85,570 0 $0
Aggregated Statistics For Year 2007(Based on 1 full and 5 partial tracts) A) FHA, FSA/RHS & VA B) Conventional C) Refinancings D) Home Improvement Loans E) Loans on Dwellings For 5+ Families F) Non-occupant Loans on G) Loans On Manufactured Number Average Value Number Average Value Number Average Value Number Average Value Number Average Value Number Average Value Number Average Value
LOANS ORIGINATED 95 $194,516 873 $172,224 471 $171,005 73 $59,494 1 $298,910 116 $111,052 0 $0 APPLICATIONS APPROVED, NOT ACCEPTED 10 $162,736 86 $129,926 85 $171,380 13 $51,513 0 $0 13 $96,792 5 $49,342 APPLICATIONS DENIED 4 $130,477 72 $209,731 226 $170,260 80 $79,201 0 $0 15 $114,941 8 $54,189 APPLICATIONS WITHDRAWN 6 $155,933 85 $169,029 99 $165,206 14 $114,297 1 $177,980 16 $106,342 0 $0 FILES CLOSED FOR INCOMPLETENESS 1 $91,810 30 $187,697 60 $161,632 4 $131,568 0 $0 6 $95,930 0 $0
Aggregated Statistics For Year 2006(Based on 1 full and 5 partial tracts) A) FHA, FSA/RHS & VA B) Conventional C) Refinancings D) Home Improvement Loans E) Loans on Dwellings For 5+ Families F) Non-occupant Loans on G) Loans On Manufactured Number Average Value Number Average Value Number Average Value Number Average Value Number Average Value Number Average Value Number Average Value
LOANS ORIGINATED 80 $171,917 1,029 $158,497 438 $149,207 79 $51,530 1 $2,676,970 194 $105,407 4 $42,352 APPLICATIONS APPROVED, NOT ACCEPTED 2 $190,040 94 $144,343 75 $132,915 15 $52,872 0 $0 19 $78,568 5 $50,948 APPLICATIONS DENIED 11 $139,630 103 $151,234 223 $148,958 67 $64,925 0 $0 17 $149,883 6 $80,817 APPLICATIONS WITHDRAWN 14 $148,457 117 $188,101 163 $145,624 14 $84,501 0 $0 17 $130,375 0 $0 FILES CLOSED FOR INCOMPLETENESS 4 $141,512 36 $152,249 78 $169,000 5 $66,304 0 $0 9 $114,598 0 $0
Aggregated Statistics For Year 2005(Based on 1 full and 5 partial tracts) A) FHA, FSA/RHS & VA B) Conventional C) Refinancings D) Home Improvement Loans E) Loans on Dwellings For 5+ Families F) Non-occupant Loans on G) Loans On Manufactured Number Average Value Number Average Value Number Average Value Number Average Value Number Average Value Number Average Value Number Average Value
LOANS ORIGINATED 111 $157,067 914 $155,415 486 $152,963 61 $62,816 1 $852,350 133 $99,727 3 $43,313 APPLICATIONS APPROVED, NOT ACCEPTED 5 $147,352 81 $148,343 79 $139,894 9 $40,350 0 $0 10 $67,166 3 $35,707 APPLICATIONS DENIED 6 $204,415 92 $132,702 307 $150,481 80 $59,750 0 $0 13 $100,808 7 $87,360 APPLICATIONS WITHDRAWN 9 $181,390 121 $150,028 179 $172,112 35 $134,290 0 $0 15 $113,016 0 $0 FILES CLOSED FOR INCOMPLETENESS 0 $0 37 $141,623 113 $163,450 8 $50,131 0 $0 8 $113,876 0 $0
Aggregated Statistics For Year 2004(Based on 1 full and 5 partial tracts) A) FHA, FSA/RHS & VA B) Conventional C) Refinancings D) Home Improvement Loans E) Loans on Dwellings For 5+ Families F) Non-occupant Loans on G) Loans On Manufactured Number Average Value Number Average Value Number Average Value Number Average Value Number Average Value Number Average Value Number Average Value
LOANS ORIGINATED 121 $131,578 885 $152,614 599 $147,343 39 $36,047 5 $4,905,444 93 $88,124 2 $35,780 APPLICATIONS APPROVED, NOT ACCEPTED 2 $155,960 64 $136,859 79 $133,314 14 $51,172 0 $0 11 $80,548 3 $33,333 APPLICATIONS DENIED 12 $121,442 70 $127,723 291 $131,147 64 $43,811 0 $0 16 $99,108 8 $52,036 APPLICATIONS WITHDRAWN 20 $127,726 107 $146,272 168 $152,034 11 $83,410 0 $0 19 $90,144 0 $0 FILES CLOSED FOR INCOMPLETENESS 3 $148,973 37 $152,704 146 $152,852 8 $65,362 0 $0 4 $64,567 0 $0
Aggregated Statistics For Year 2003(Based on 1 full and 5 partial tracts) A) FHA, FSA/RHS & VA B) Conventional C) Refinancings D) Home Improvement Loans E) Loans on Dwellings For 5+ Families F) Non-occupant Loans on Number Average Value Number Average Value Number Average Value Number Average Value Number Average Value Number Average Value
LOANS ORIGINATED 168 $127,197 910 $140,027 1,962 $141,335 36 $52,866 1 $22,060 122 $87,518 APPLICATIONS APPROVED, NOT ACCEPTED 2 $194,395 53 $141,106 171 $125,740 6 $37,552 0 $0 6 $78,558 APPLICATIONS DENIED 8 $114,788 43 $124,256 382 $126,961 23 $25,935 0 $0 15 $72,395 APPLICATIONS WITHDRAWN 10 $150,351 85 $159,520 253 $130,427 6 $98,972 0 $0 11 $101,711 FILES CLOSED FOR INCOMPLETENESS 5 $109,606 24 $122,084 55 $150,009 6 $62,300 0 $0 4 $63,802
Aggregated Statistics For Year 1999(Based on 2 partial tracts) A) FHA, FSA/RHS & VA B) Conventional C) Refinancings D) Home Improvement Loans E) Loans on Dwellings For 5+ Families F) Non-occupant Loans on Number Average Value Number Average Value Number Average Value Number Average Value Number Average Value Number Average Value
LOANS ORIGINATED 161 $110,104 807 $137,936 328 $130,554 68 $30,279 1 $80,330 49 $196,443 APPLICATIONS APPROVED, NOT ACCEPTED 4 $71,670 45 $107,763 26 $91,315 19 $17,354 0 $0 2 $66,535 APPLICATIONS DENIED 13 $78,575 99 $95,000 79 $84,391 38 $19,084 0 $0 5 $37,088 APPLICATIONS WITHDRAWN 15 $126,726 71 $124,302 69 $93,553 3 $36,630 0 $0 4 $67,548 FILES CLOSED FOR INCOMPLETENESS 0 $0 13 $144,383 53 $89,065 0 $0 0 $0 4 $141,868
Detailed HMDA statistics for the following Tracts:
0110.11
, 0110.12 , 0110.13 , 0110.14 , 0110.21 , 0110.22
Private Mortgage Insurance Companies Aggregated Statistics For Year 2009(Based on 1 full and 5 partial tracts) A) Conventional B) Refinancings C) Non-occupant Loans on Number Average Value Number Average Value Number Average Value
LOANS ORIGINATED 63 $229,354 49 $220,583 1 $75,000 APPLICATIONS APPROVED, NOT ACCEPTED 17 $262,356 15 $236,976 0 $0 APPLICATIONS DENIED 4 $284,332 10 $229,382 0 $0 APPLICATIONS WITHDRAWN 0 $0 3 $263,483 0 $0 FILES CLOSED FOR INCOMPLETENESS 4 $151,305 3 $219,943 2 $82,325
Aggregated Statistics For Year 2008(Based on 1 full and 5 partial tracts) A) Conventional B) Refinancings C) Non-occupant Loans on Number Average Value Number Average Value Number Average Value
LOANS ORIGINATED 140 $193,871 55 $204,742 12 $109,922 APPLICATIONS APPROVED, NOT ACCEPTED 28 $179,315 40 $283,790 1 $54,200 APPLICATIONS DENIED 6 $193,197 4 $141,160 2 $89,015 APPLICATIONS WITHDRAWN 4 $127,272 2 $204,680 0 $0 FILES CLOSED FOR INCOMPLETENESS 1 $199,990 5 $309,076 3 $362,543
Aggregated Statistics For Year 2007(Based on 1 full and 5 partial tracts) A) Conventional B) Refinancings C) Non-occupant Loans on Number Average Value Number Average Value Number Average Value
LOANS ORIGINATED 185 $168,287 64 $198,847 17 $125,774 APPLICATIONS APPROVED, NOT ACCEPTED 29 $191,631 21 $275,334 6 $109,482 APPLICATIONS DENIED 4 $157,118 1 $273,390 3 $154,123 APPLICATIONS WITHDRAWN 5 $226,630 6 $231,778 2 $173,845 FILES CLOSED FOR INCOMPLETENESS 1 $75,000 2 $155,305 2 $79,425
Aggregated Statistics For Year 2006(Based on 1 full and 5 partial tracts) A) Conventional B) Refinancings C) Non-occupant Loans on Number Average Value Number Average Value Number Average Value
LOANS ORIGINATED 123 $174,207 57 $181,422 15 $114,603 APPLICATIONS APPROVED, NOT ACCEPTED 13 $198,398 15 $235,147 2 $91,860 APPLICATIONS DENIED 0 $0 1 $127,180 0 $0 APPLICATIONS WITHDRAWN 9 $248,999 8 $243,610 5 $187,868 FILES CLOSED FOR INCOMPLETENESS 0 $0 4 $218,700 1 $43,230
Aggregated Statistics For Year 2005(Based on 1 full and 5 partial tracts) A) Conventional B) Refinancings C) Non-occupant Loans on D) Loans On Manufactured Number Average Value Number Average Value Number Average Value Number Average Value
LOANS ORIGINATED 135 $148,482 64 $160,727 17 $83,645 1 $127,230 APPLICATIONS APPROVED, NOT ACCEPTED 14 $143,337 20 $190,222 3 $98,263 0 $0 APPLICATIONS DENIED 2 $71,355 3 $257,927 1 $39,340 0 $0 APPLICATIONS WITHDRAWN 4 $286,070 11 $296,790 1 $50,290 0 $0 FILES CLOSED FOR INCOMPLETENESS 1 $165,130 2 $309,905 0 $0 0 $0
Aggregated Statistics For Year 2004(Based on 1 full and 5 partial tracts) A) Conventional B) Refinancings C) Non-occupant Loans on Number Average Value Number Average Value Number Average Value
LOANS ORIGINATED 127 $141,098 93 $142,410 21 $68,900 APPLICATIONS APPROVED, NOT ACCEPTED 33 $154,251 35 $188,292 4 $84,028 APPLICATIONS DENIED 0 $0 2 $237,410 0 $0 APPLICATIONS WITHDRAWN 8 $200,915 11 $286,931 1 $232,050 FILES CLOSED FOR INCOMPLETENESS 3 $131,453 2 $231,400 1 $71,680
Aggregated Statistics For Year 2003(Based on 1 full and 5 partial tracts) A) Conventional B) Refinancings C) Non-occupant Loans on Number Average Value Number Average Value Number Average Value
LOANS ORIGINATED 199 $154,148 313 $154,517 18 $101,345 APPLICATIONS APPROVED, NOT ACCEPTED 33 $156,863 81 $177,666 5 $95,002 APPLICATIONS DENIED 2 $75,685 1 $179,110 0 $0 APPLICATIONS WITHDRAWN 5 $165,218 22 $202,152 0 $0 FILES CLOSED FOR INCOMPLETENESS 2 $172,025 1 $438,160 0 $0
Aggregated Statistics For Year 1999(Based on 2 partial tracts) A) Conventional B) Refinancings C) Non-occupant Loans on Number Average Value Number Average Value Number Average Value
LOANS ORIGINATED 239 $147,763 60 $136,350 1 $44,640 APPLICATIONS APPROVED, NOT ACCEPTED 16 $184,387 8 $127,336 1 $49,790 APPLICATIONS DENIED 4 $160,102 0 $0 0 $0 APPLICATIONS WITHDRAWN 4 $134,302 4 $156,258 1 $118,470 FILES CLOSED FOR INCOMPLETENESS 1 $72,970 1 $103,880 0 $0
Detailed PMIC statistics for the following Tracts:
0110.11
, 0110.12 , 0110.13 , 0110.14 , 0110.21 , 0110.22 Fire-safe hotels and motels in Madison, Alabama:
Country Hearth Inn & Suites, 8716 Madison Blvd, Madison, Alabama 35758 Phone: (256) 258-3800, Fax: (256) 774-8001
Radisson Huntsville Airport, 8721 Madison Blvd, Madison, Alabama 35758 Phone: (256) 772-8855, Fax: (256) 464-0783
Best Western Plus Madison-Huntsville Hotel, 9035 Madison Boulevard/Hwy 20 W, Madison, Alabama 35758 Phone: (256) 772-7170, Fax: (256) 464-0762
Federal Square Motel And Suites, 8781 Madison Blvd, Madison, Alabama 35758 Phone: (256) 772-8470, Fax: (256) 772-0620
Baymont Inn & Suites Madison, 122 Cleghorn Blvd, Madison, Alabama 35758 Phone: (256) 258-0800, Fax: (256) 258-0805
La Quinta Inn And Suites, 105 Westchester Dr, Madison, Alabama 35758 Phone: (256) 258-2777, Fax: (256) 258-2778
Country Inn & Suites, 101 Westchester Rd, Madison, Alabama 35758 Phone: (256) 325-0007, Fax: (256) 325-0377
Value Place - Madison, 120 Brazelton Cir, Madison, Alabama 35758 Phone: (256) 325-6300, Fax: (256) 325-6310
Holiday Inn Express & Suites, 8956 Madison Blvd, Madison, Alabama 35758 Phone: (256) 258-3000
All 9 fire-safe hotels and motels in Madison, Alabama
Most common first names in Madison, AL among deceased individuals Name Count Lived (average)
James 109 69.9 years John 106 73.0 years Mary 97 81.6 years William 89 72.9 years Robert 66 72.4 years Willie 39 72.4 years George 35 74.8 years Annie 33 79.9 years Thomas 33 69.9 years Charles 30 71.7 years
Most common last names in Madison, AL among deceased individuals Last name Count Lived (average)
Smith 58 70.9 years Jones 36 69.0 years Williams 31 75.5 years Miller 30 80.2 years Moore 30 78.5 years Fletcher 29 67.2 years Johnson 27 76.7 years Taylor 25 68.9 years Davis 24 73.3 years Harris 23 77.5 years
Madison compared to Alabama state average:
Median household income above state average. Median house value above state average. Unemployed percentage significantly below state average. Hispanic race population percentage above state average. Median age below state average. Foreign-born population percentage significantly above state average. Length of stay since moving in above state average. Number of rooms per house above state average. House age significantly below state average. Percentage of population with a bachelor's degree or higher significantly above state average.
#10 on the list of "Top 101 cities with largest percentage of males in occupations: architecture and engineering occupations (population 5,000+)"
#44 on the list of "Top 101 cities with largest percentage of females in occupations: architecture and engineering occupations (population 5,000+)"
#40 on the list of "Top 101 counties with the highest number of infant deaths per 1000 residents 2007-2013 (pop. 50,000+)"
#66 on the list of "Top 101 counties with the most Evangelical Protestant adherents"
#82 on the list of "Top 101 counties with the highest ground withdrawal of fresh water for public supply"
#83 on the list of "Top 101 counties with the most Black Protestant congregations"
#83 on the list of "Top 101 counties with the most Evangelical Protestant congregations"
Top Patent Applicants
Mary J. Bossard (50)
Douglas C. Winfield (48)
Zhihao Fang (29)
James Leroy Deming (23)
Dale L. Kirkland (22)
Xiaoming Shen (20)
David B. Ewing (18)
Kunsang Yoon (17)
Tacey X. Viegas (16)
Steven James Heinrich (16)
Total of 910 patent applications in 2008-2024.


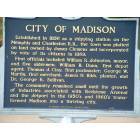


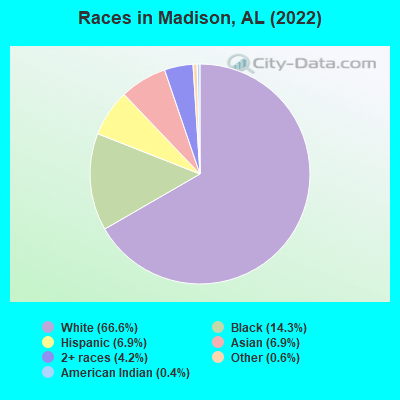
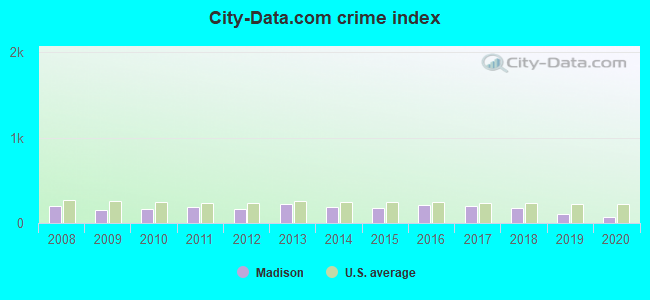
 Recent articles from our blog. Our writers, many of them Ph.D. graduates or candidates, create easy-to-read articles on a wide variety of topics.


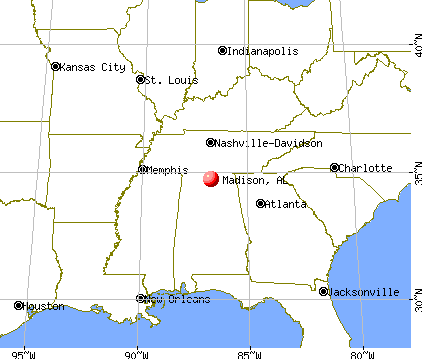
 (8.2 miles
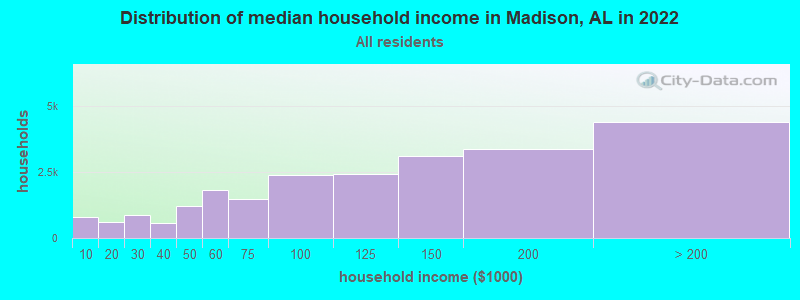
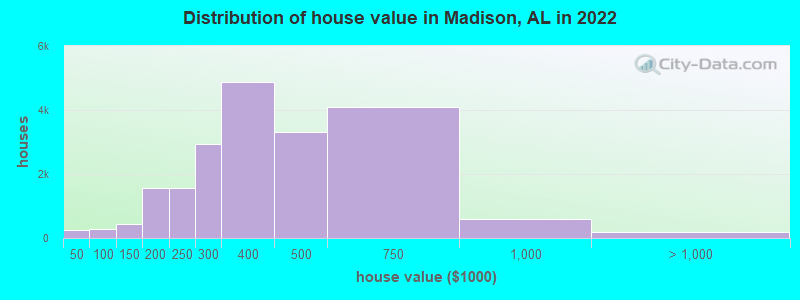
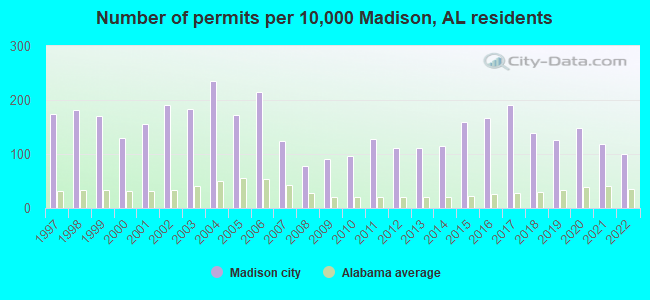
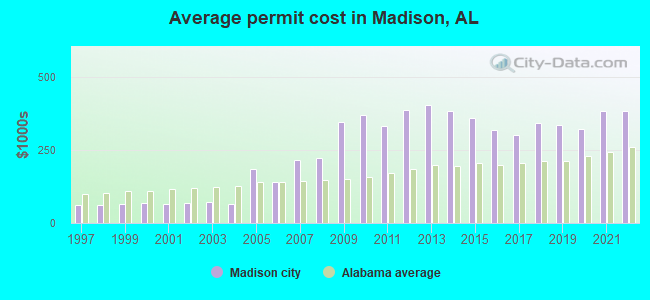
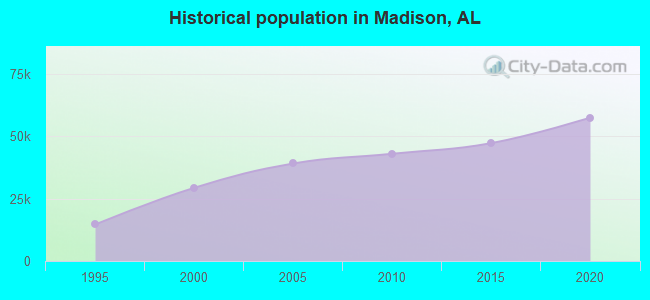
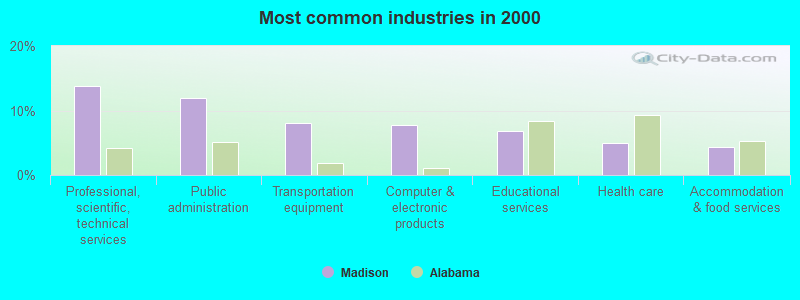
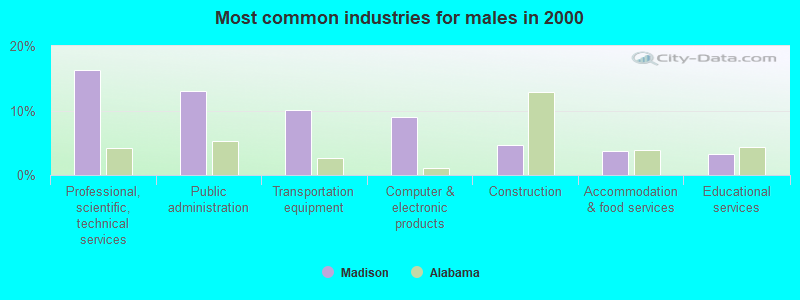
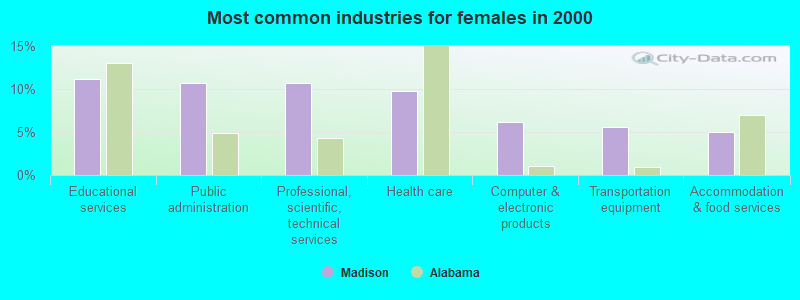
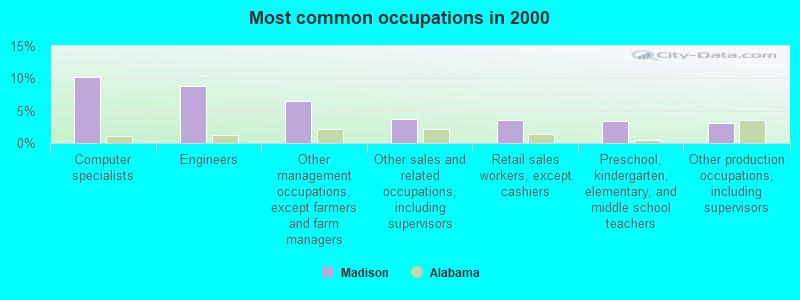
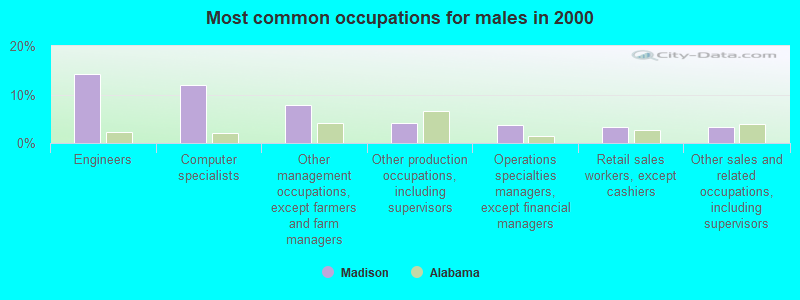
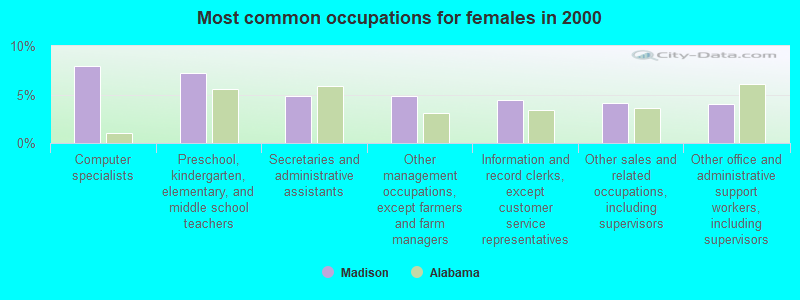
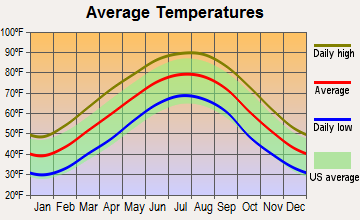
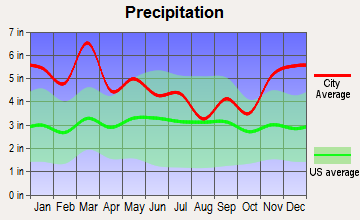
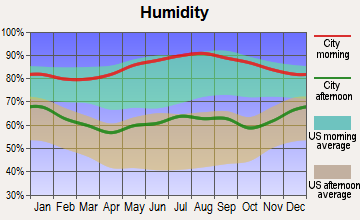
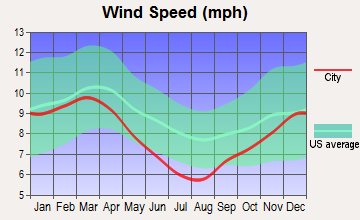
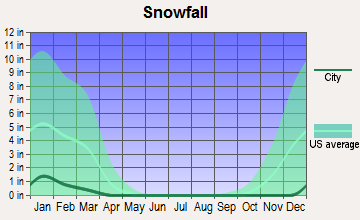
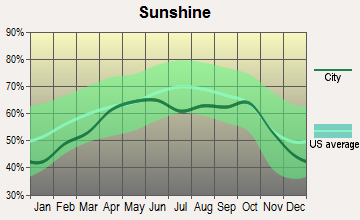
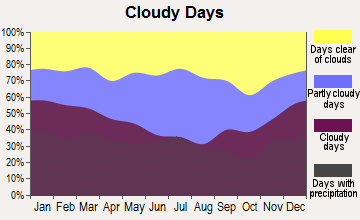
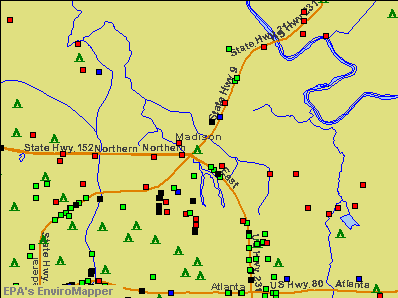

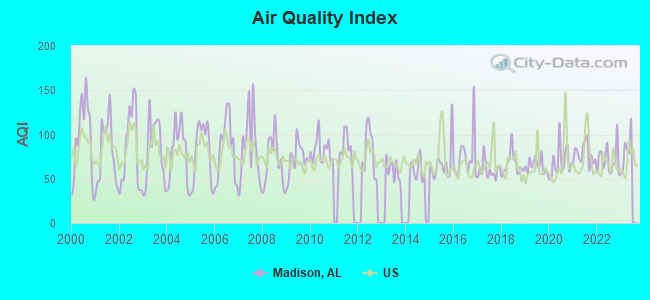
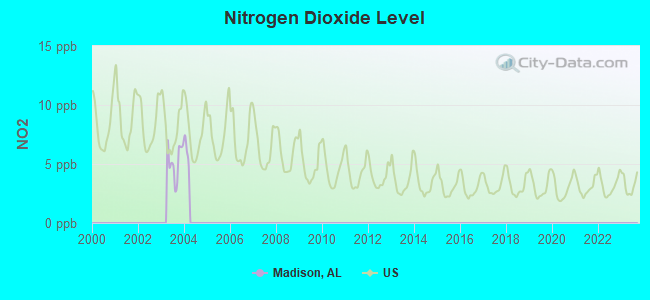
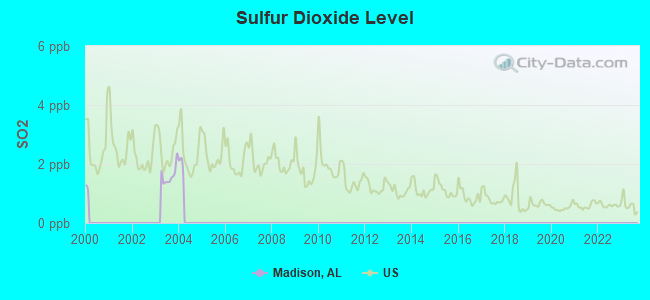
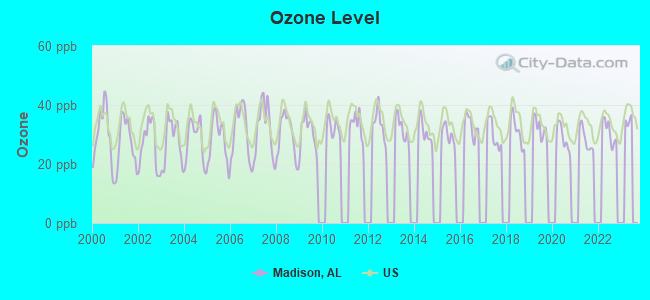
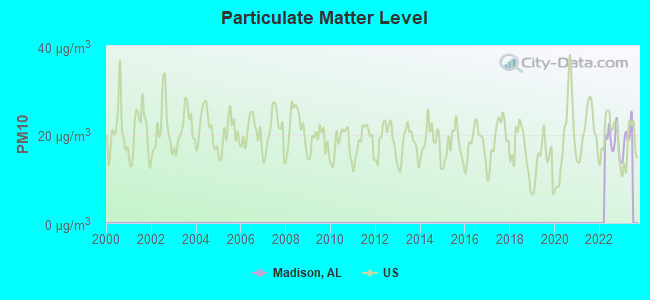
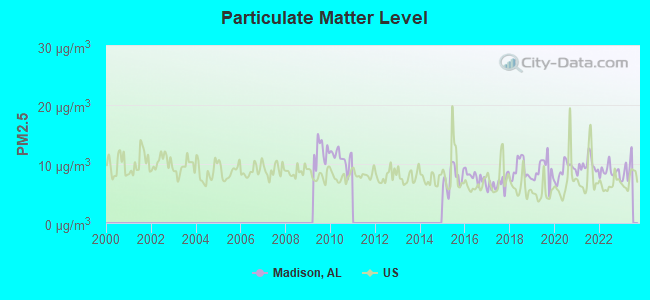
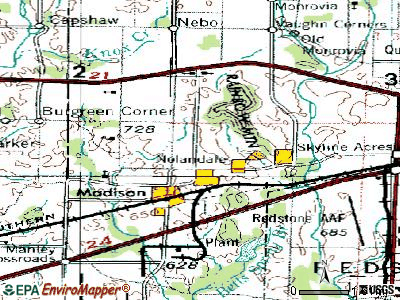
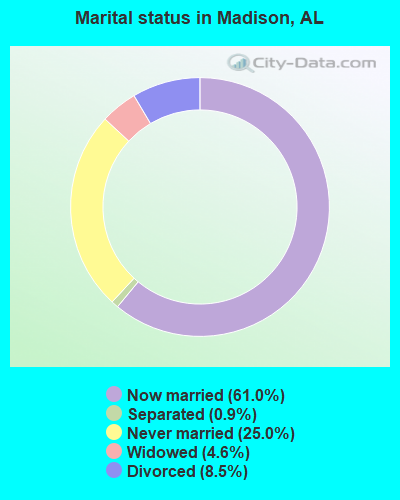
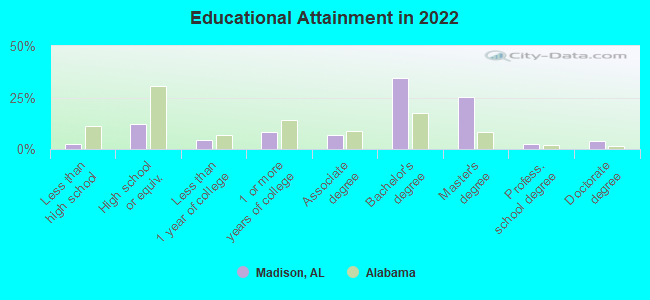
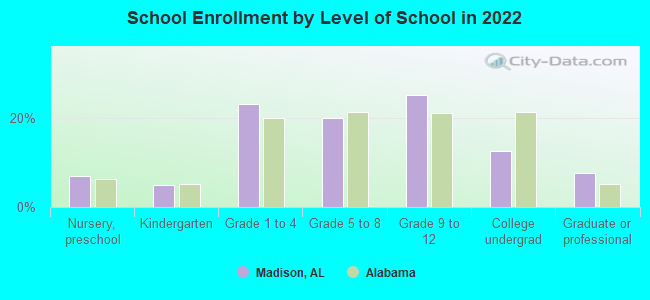
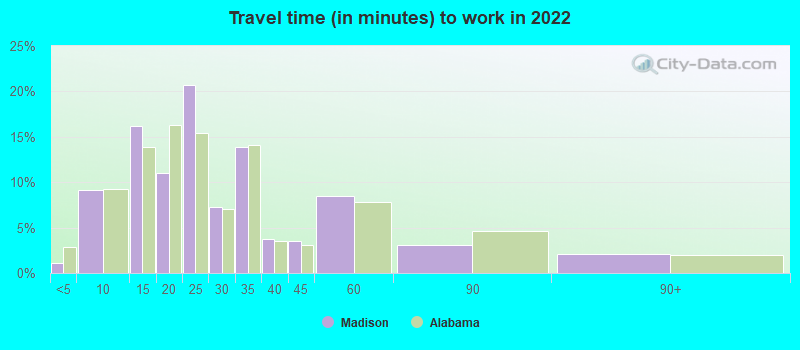
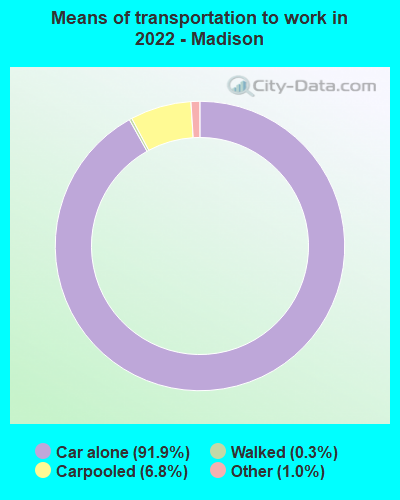
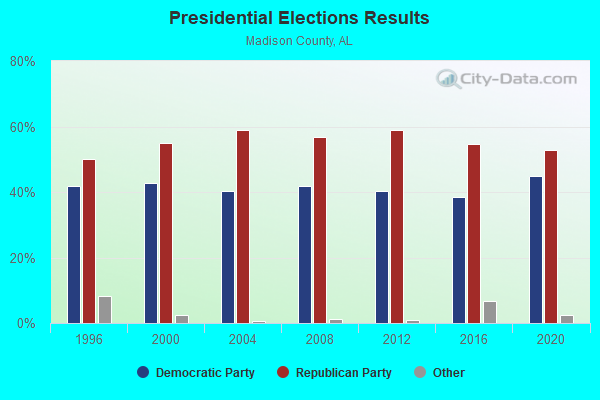
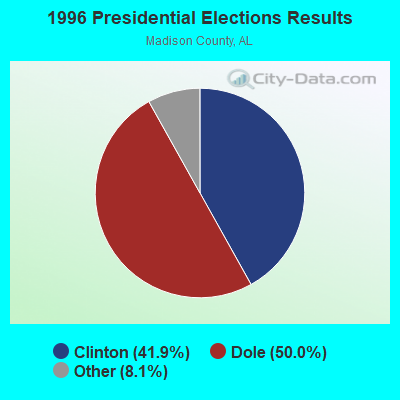
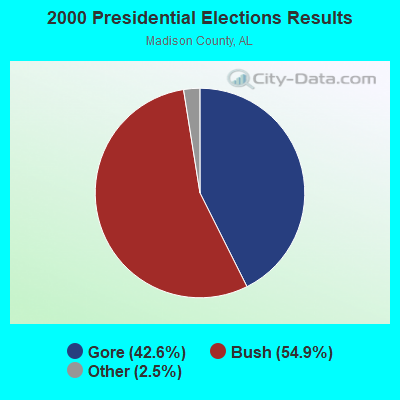
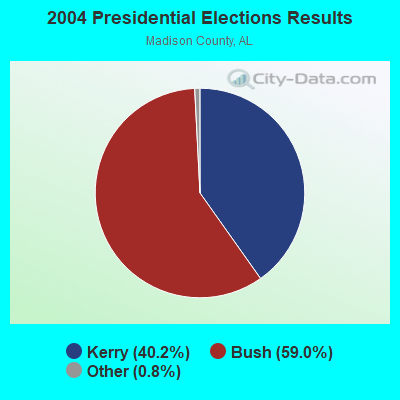

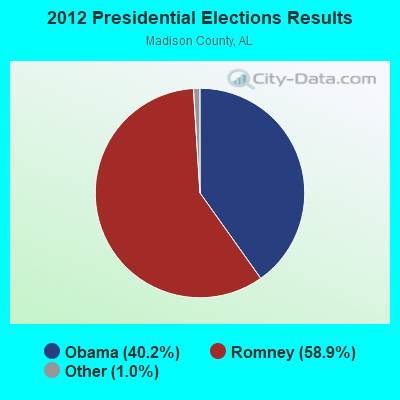
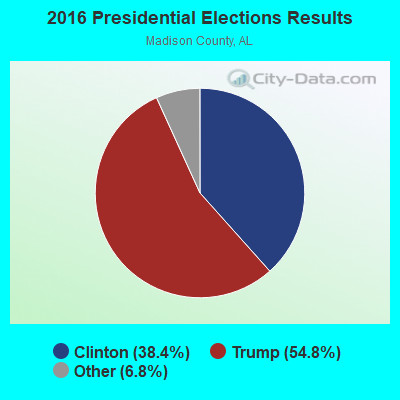
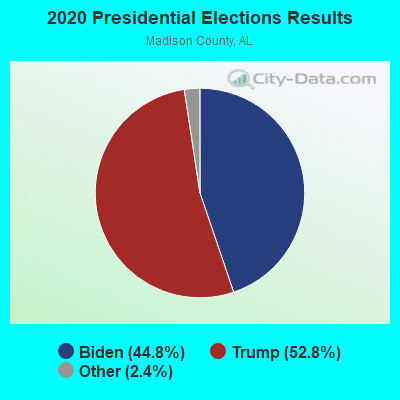
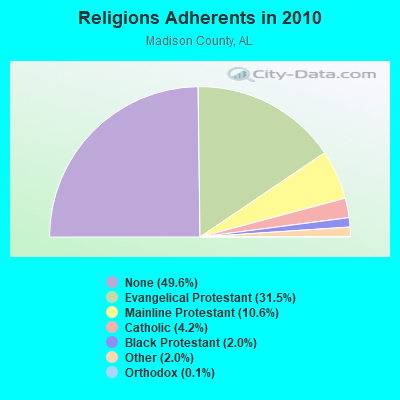
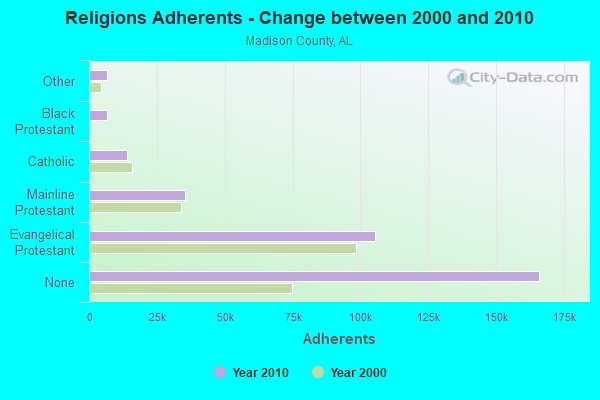
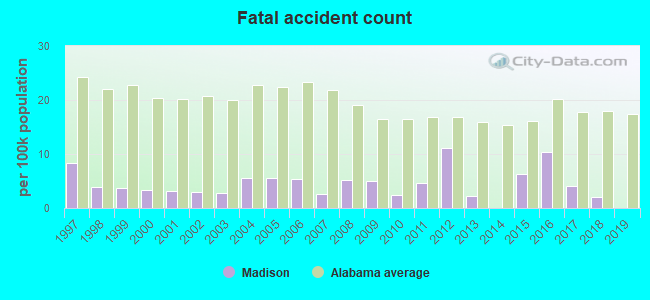
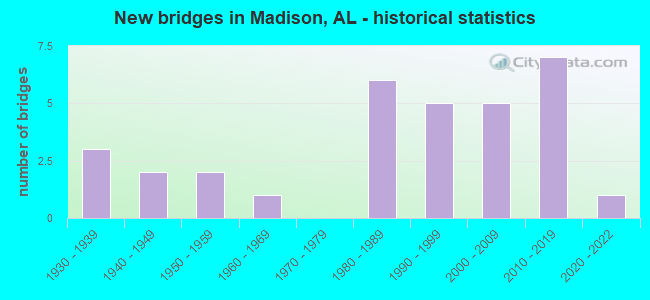
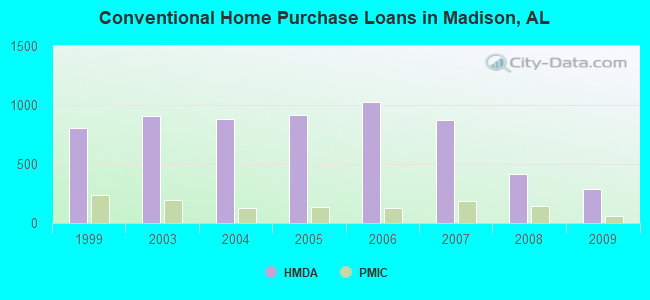
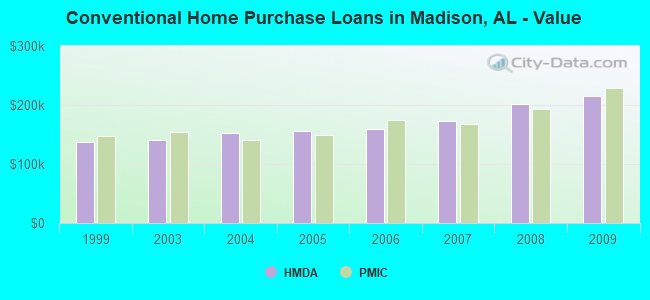
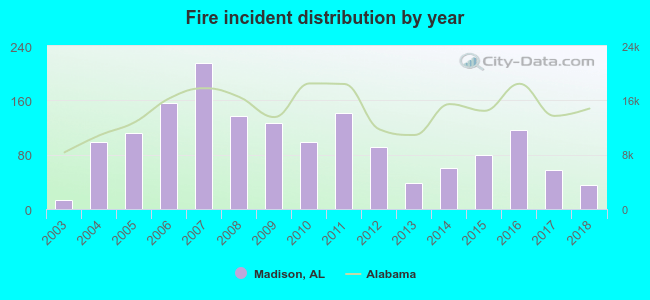 Based on the data from the years 2003 - 2018 the average number of fire incidents per year is 99. The highest number of fires - 215 took place in 2007, and the least - 13 in 2003. The data has an increasing trend.
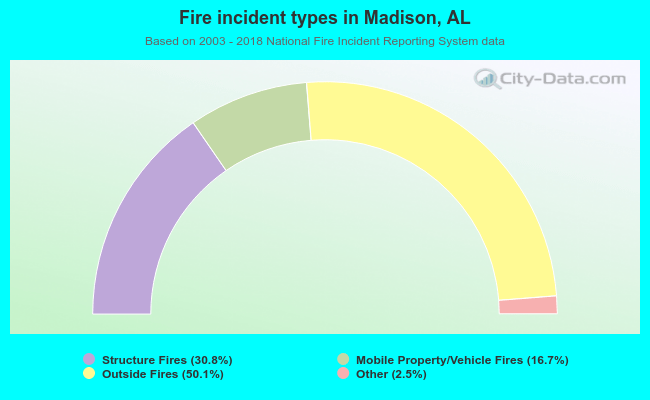 When looking into fire subcategories, the most reports belonged to: Outside Fires (50.1%), and Structure Fires (30.8%).