Marysville, California Submit your own pictures of this city and show them to the world
OSM Map
General Map
Google Map
MSN Map
OSM Map
General Map
Google Map
MSN Map
OSM Map
General Map
Google Map
MSN Map
OSM Map
General Map
Google Map
MSN Map
Please wait while loading the map...
Population in 2022: 12,704 (100% urban, 0% rural). Population change since 2000: +3.6%Males: 6,318 Females: 6,386
March 2022 cost of living index in Marysville: 94.3 (less than average, U.S. average is 100) Percentage of residents living in poverty in 2022: 24.2%for White Non-Hispanic residents , 28.5% for Hispanic or Latino residents , 27.0% for American Indian residents , 12.0% for other race residents , 43.3% for two or more races residents )
Profiles of local businesses
Business Search - 14 Million verified businesses
Data:
Median household income ($)
Median household income (% change since 2000)
Household income diversity
Ratio of average income to average house value (%)
Ratio of average income to average rent
Median household income ($) - White
Median household income ($) - Black or African American
Median household income ($) - Asian
Median household income ($) - Hispanic or Latino
Median household income ($) - American Indian and Alaska Native
Median household income ($) - Multirace
Median household income ($) - Other Race
Median household income for houses/condos with a mortgage ($)
Median household income for apartments without a mortgage ($)
Races - White alone (%)
Races - White alone (% change since 2000)
Races - Black alone (%)
Races - Black alone (% change since 2000)
Races - American Indian alone (%)
Races - American Indian alone (% change since 2000)
Races - Asian alone (%)
Races - Asian alone (% change since 2000)
Races - Hispanic (%)
Races - Hispanic (% change since 2000)
Races - Native Hawaiian and Other Pacific Islander alone (%)
Races - Native Hawaiian and Other Pacific Islander alone (% change since 2000)
Races - Two or more races (%)
Races - Two or more races (% change since 2000)
Races - Other race alone (%)
Races - Other race alone (% change since 2000)
Racial diversity
Unemployment (%)
Unemployment (% change since 2000)
Unemployment (%) - White
Unemployment (%) - Black or African American
Unemployment (%) - Asian
Unemployment (%) - Hispanic or Latino
Unemployment (%) - American Indian and Alaska Native
Unemployment (%) - Multirace
Unemployment (%) - Other Race
Population density (people per square mile)
Population - Males (%)
Population - Females (%)
Population - Males (%) - White
Population - Males (%) - Black or African American
Population - Males (%) - Asian
Population - Males (%) - Hispanic or Latino
Population - Males (%) - American Indian and Alaska Native
Population - Males (%) - Multirace
Population - Males (%) - Other Race
Population - Females (%) - White
Population - Females (%) - Black or African American
Population - Females (%) - Asian
Population - Females (%) - Hispanic or Latino
Population - Females (%) - American Indian and Alaska Native
Population - Females (%) - Multirace
Population - Females (%) - Other Race
Coronavirus confirmed cases (Apr 19, 2024)
Deaths caused by coronavirus (Apr 19, 2024)
Coronavirus confirmed cases (per 100k population) (Apr 19, 2024)
Deaths caused by coronavirus (per 100k population) (Apr 19, 2024)
Daily increase in number of cases (Apr 19, 2024)
Weekly increase in number of cases (Apr 19, 2024)
Cases doubled (in days) (Apr 19, 2024)
Hospitalized patients (Apr 18, 2022)
Negative test results (Apr 18, 2022)
Total test results (Apr 18, 2022)
COVID Vaccine doses distributed (per 100k population) (Sep 19, 2023)
COVID Vaccine doses administered (per 100k population) (Sep 19, 2023)
COVID Vaccine doses distributed (Sep 19, 2023)
COVID Vaccine doses administered (Sep 19, 2023)
Likely homosexual households (%)
Likely homosexual households (% change since 2000)
Likely homosexual households - Lesbian couples (%)
Likely homosexual households - Lesbian couples (% change since 2000)
Likely homosexual households - Gay men (%)
Likely homosexual households - Gay men (% change since 2000)
Cost of living index
Median gross rent ($)
Median contract rent ($)
Median monthly housing costs ($)
Median house or condo value ($)
Median house or condo value ($ change since 2000)
Mean house or condo value by units in structure - 1, detached ($)
Mean house or condo value by units in structure - 1, attached ($)
Mean house or condo value by units in structure - 2 ($)
Mean house or condo value by units in structure by units in structure - 3 or 4 ($)
Mean house or condo value by units in structure - 5 or more ($)
Mean house or condo value by units in structure - Boat, RV, van, etc. ($)
Mean house or condo value by units in structure - Mobile home ($)
Median house or condo value ($) - White
Median house or condo value ($) - Black or African American
Median house or condo value ($) - Asian
Median house or condo value ($) - Hispanic or Latino
Median house or condo value ($) - American Indian and Alaska Native
Median house or condo value ($) - Multirace
Median house or condo value ($) - Other Race
Median resident age
Resident age diversity
Median resident age - Males
Median resident age - Females
Median resident age - White
Median resident age - Black or African American
Median resident age - Asian
Median resident age - Hispanic or Latino
Median resident age - American Indian and Alaska Native
Median resident age - Multirace
Median resident age - Other Race
Median resident age - Males - White
Median resident age - Males - Black or African American
Median resident age - Males - Asian
Median resident age - Males - Hispanic or Latino
Median resident age - Males - American Indian and Alaska Native
Median resident age - Males - Multirace
Median resident age - Males - Other Race
Median resident age - Females - White
Median resident age - Females - Black or African American
Median resident age - Females - Asian
Median resident age - Females - Hispanic or Latino
Median resident age - Females - American Indian and Alaska Native
Median resident age - Females - Multirace
Median resident age - Females - Other Race
Commute - mean travel time to work (minutes)
Travel time to work - Less than 5 minutes (%)
Travel time to work - Less than 5 minutes (% change since 2000)
Travel time to work - 5 to 9 minutes (%)
Travel time to work - 5 to 9 minutes (% change since 2000)
Travel time to work - 10 to 19 minutes (%)
Travel time to work - 10 to 19 minutes (% change since 2000)
Travel time to work - 20 to 29 minutes (%)
Travel time to work - 20 to 29 minutes (% change since 2000)
Travel time to work - 30 to 39 minutes (%)
Travel time to work - 30 to 39 minutes (% change since 2000)
Travel time to work - 40 to 59 minutes (%)
Travel time to work - 40 to 59 minutes (% change since 2000)
Travel time to work - 60 to 89 minutes (%)
Travel time to work - 60 to 89 minutes (% change since 2000)
Travel time to work - 90 or more minutes (%)
Travel time to work - 90 or more minutes (% change since 2000)
Marital status - Never married (%)
Marital status - Now married (%)
Marital status - Separated (%)
Marital status - Widowed (%)
Marital status - Divorced (%)
Median family income ($)
Median family income (% change since 2000)
Median non-family income ($)
Median non-family income (% change since 2000)
Median per capita income ($)
Median per capita income (% change since 2000)
Median family income ($) - White
Median family income ($) - Black or African American
Median family income ($) - Asian
Median family income ($) - Hispanic or Latino
Median family income ($) - American Indian and Alaska Native
Median family income ($) - Multirace
Median family income ($) - Other Race
Median year house/condo built
Median year apartment built
Year house built - Built 2005 or later (%)
Year house built - Built 2000 to 2004 (%)
Year house built - Built 1990 to 1999 (%)
Year house built - Built 1980 to 1989 (%)
Year house built - Built 1970 to 1979 (%)
Year house built - Built 1960 to 1969 (%)
Year house built - Built 1950 to 1959 (%)
Year house built - Built 1940 to 1949 (%)
Year house built - Built 1939 or earlier (%)
Average household size
Household density (households per square mile)
Average household size - White
Average household size - Black or African American
Average household size - Asian
Average household size - Hispanic or Latino
Average household size - American Indian and Alaska Native
Average household size - Multirace
Average household size - Other Race
Occupied housing units (%)
Vacant housing units (%)
Owner occupied housing units (%)
Renter occupied housing units (%)
Vacancy status - For rent (%)
Vacancy status - For sale only (%)
Vacancy status - Rented or sold, not occupied (%)
Vacancy status - For seasonal, recreational, or occasional use (%)
Vacancy status - For migrant workers (%)
Vacancy status - Other vacant (%)
Residents with income below the poverty level (%)
Residents with income below 50% of the poverty level (%)
Children below poverty level (%)
Poor families by family type - Married-couple family (%)
Poor families by family type - Male, no wife present (%)
Poor families by family type - Female, no husband present (%)
Poverty status for native-born residents (%)
Poverty status for foreign-born residents (%)
Poverty among high school graduates not in families (%)
Poverty among people who did not graduate high school not in families (%)
Residents with income below the poverty level (%) - White
Residents with income below the poverty level (%) - Black or African American
Residents with income below the poverty level (%) - Asian
Residents with income below the poverty level (%) - Hispanic or Latino
Residents with income below the poverty level (%) - American Indian and Alaska Native
Residents with income below the poverty level (%) - Multirace
Residents with income below the poverty level (%) - Other Race
Air pollution - Air Quality Index (AQI)
Air pollution - CO
Air pollution - NO2
Air pollution - SO2
Air pollution - Ozone
Air pollution - PM10
Air pollution - PM25
Air pollution - Pb
Crime - Murders per 100,000 population
Crime - Rapes per 100,000 population
Crime - Robberies per 100,000 population
Crime - Assaults per 100,000 population
Crime - Burglaries per 100,000 population
Crime - Thefts per 100,000 population
Crime - Auto thefts per 100,000 population
Crime - Arson per 100,000 population
Crime - City-data.com crime index
Crime - Violent crime index
Crime - Property crime index
Crime - Murders per 100,000 population (5 year average)
Crime - Rapes per 100,000 population (5 year average)
Crime - Robberies per 100,000 population (5 year average)
Crime - Assaults per 100,000 population (5 year average)
Crime - Burglaries per 100,000 population (5 year average)
Crime - Thefts per 100,000 population (5 year average)
Crime - Auto thefts per 100,000 population (5 year average)
Crime - Arson per 100,000 population (5 year average)
Crime - City-data.com crime index (5 year average)
Crime - Violent crime index (5 year average)
Crime - Property crime index (5 year average)
1996 Presidential Elections Results (%) - Democratic Party (Clinton)
1996 Presidential Elections Results (%) - Republican Party (Dole)
1996 Presidential Elections Results (%) - Other
2000 Presidential Elections Results (%) - Democratic Party (Gore)
2000 Presidential Elections Results (%) - Republican Party (Bush)
2000 Presidential Elections Results (%) - Other
2004 Presidential Elections Results (%) - Democratic Party (Kerry)
2004 Presidential Elections Results (%) - Republican Party (Bush)
2004 Presidential Elections Results (%) - Other
2008 Presidential Elections Results (%) - Democratic Party (Obama)
2008 Presidential Elections Results (%) - Republican Party (McCain)
2008 Presidential Elections Results (%) - Other
2012 Presidential Elections Results (%) - Democratic Party (Obama)
2012 Presidential Elections Results (%) - Republican Party (Romney)
2012 Presidential Elections Results (%) - Other
2016 Presidential Elections Results (%) - Democratic Party (Clinton)
2016 Presidential Elections Results (%) - Republican Party (Trump)
2016 Presidential Elections Results (%) - Other
2020 Presidential Elections Results (%) - Democratic Party (Biden)
2020 Presidential Elections Results (%) - Republican Party (Trump)
2020 Presidential Elections Results (%) - Other
Ancestries Reported - Arab (%)
Ancestries Reported - Czech (%)
Ancestries Reported - Danish (%)
Ancestries Reported - Dutch (%)
Ancestries Reported - English (%)
Ancestries Reported - French (%)
Ancestries Reported - French Canadian (%)
Ancestries Reported - German (%)
Ancestries Reported - Greek (%)
Ancestries Reported - Hungarian (%)
Ancestries Reported - Irish (%)
Ancestries Reported - Italian (%)
Ancestries Reported - Lithuanian (%)
Ancestries Reported - Norwegian (%)
Ancestries Reported - Polish (%)
Ancestries Reported - Portuguese (%)
Ancestries Reported - Russian (%)
Ancestries Reported - Scotch-Irish (%)
Ancestries Reported - Scottish (%)
Ancestries Reported - Slovak (%)
Ancestries Reported - Subsaharan African (%)
Ancestries Reported - Swedish (%)
Ancestries Reported - Swiss (%)
Ancestries Reported - Ukrainian (%)
Ancestries Reported - United States (%)
Ancestries Reported - Welsh (%)
Ancestries Reported - West Indian (%)
Ancestries Reported - Other (%)
Educational Attainment - No schooling completed (%)
Educational Attainment - Less than high school (%)
Educational Attainment - High school or equivalent (%)
Educational Attainment - Less than 1 year of college (%)
Educational Attainment - 1 or more years of college (%)
Educational Attainment - Associate degree (%)
Educational Attainment - Bachelor's degree (%)
Educational Attainment - Master's degree (%)
Educational Attainment - Professional school degree (%)
Educational Attainment - Doctorate degree (%)
School Enrollment - Nursery, preschool (%)
School Enrollment - Kindergarten (%)
School Enrollment - Grade 1 to 4 (%)
School Enrollment - Grade 5 to 8 (%)
School Enrollment - Grade 9 to 12 (%)
School Enrollment - College undergrad (%)
School Enrollment - Graduate or professional (%)
School Enrollment - Not enrolled in school (%)
School enrollment - Public schools (%)
School enrollment - Private schools (%)
School enrollment - Not enrolled (%)
Median number of rooms in houses and condos
Median number of rooms in apartments
Housing units lacking complete plumbing facilities (%)
Housing units lacking complete kitchen facilities (%)
Density of houses
Urban houses (%)
Rural houses (%)
Households with people 60 years and over (%)
Households with people 65 years and over (%)
Households with people 75 years and over (%)
Households with one or more nonrelatives (%)
Households with no nonrelatives (%)
Population in households (%)
Family households (%)
Nonfamily households (%)
Population in families (%)
Family households with own children (%)
Median number of bedrooms in owner occupied houses
Mean number of bedrooms in owner occupied houses
Median number of bedrooms in renter occupied houses
Mean number of bedrooms in renter occupied houses
Median number of vehichles in owner occupied houses
Mean number of vehichles in owner occupied houses
Median number of vehichles in renter occupied houses
Mean number of vehichles in renter occupied houses
Mortgage status - with mortgage (%)
Mortgage status - with second mortgage (%)
Mortgage status - with home equity loan (%)
Mortgage status - with both second mortgage and home equity loan (%)
Mortgage status - without a mortgage (%)
Average family size
Average family size - White
Average family size - Black or African American
Average family size - Asian
Average family size - Hispanic or Latino
Average family size - American Indian and Alaska Native
Average family size - Multirace
Average family size - Other Race
Geographical mobility - Same house 1 year ago (%)
Geographical mobility - Moved within same county (%)
Geographical mobility - Moved from different county within same state (%)
Geographical mobility - Moved from different state (%)
Geographical mobility - Moved from abroad (%)
Place of birth - Born in state of residence (%)
Place of birth - Born in other state (%)
Place of birth - Native, outside of US (%)
Place of birth - Foreign born (%)
Housing units in structures - 1, detached (%)
Housing units in structures - 1, attached (%)
Housing units in structures - 2 (%)
Housing units in structures - 3 or 4 (%)
Housing units in structures - 5 to 9 (%)
Housing units in structures - 10 to 19 (%)
Housing units in structures - 20 to 49 (%)
Housing units in structures - 50 or more (%)
Housing units in structures - Mobile home (%)
Housing units in structures - Boat, RV, van, etc. (%)
House/condo owner moved in on average (years ago)
Renter moved in on average (years ago)
Year householder moved into unit - Moved in 1999 to March 2000 (%)
Year householder moved into unit - Moved in 1995 to 1998 (%)
Year householder moved into unit - Moved in 1990 to 1994 (%)
Year householder moved into unit - Moved in 1980 to 1989 (%)
Year householder moved into unit - Moved in 1970 to 1979 (%)
Year householder moved into unit - Moved in 1969 or earlier (%)
Means of transportation to work - Drove car alone (%)
Means of transportation to work - Carpooled (%)
Means of transportation to work - Public transportation (%)
Means of transportation to work - Bus or trolley bus (%)
Means of transportation to work - Streetcar or trolley car (%)
Means of transportation to work - Subway or elevated (%)
Means of transportation to work - Railroad (%)
Means of transportation to work - Ferryboat (%)
Means of transportation to work - Taxicab (%)
Means of transportation to work - Motorcycle (%)
Means of transportation to work - Bicycle (%)
Means of transportation to work - Walked (%)
Means of transportation to work - Other means (%)
Working at home (%)
Industry diversity
Most Common Industries - Agriculture, forestry, fishing and hunting, and mining (%)
Most Common Industries - Agriculture, forestry, fishing and hunting (%)
Most Common Industries - Mining, quarrying, and oil and gas extraction (%)
Most Common Industries - Construction (%)
Most Common Industries - Manufacturing (%)
Most Common Industries - Wholesale trade (%)
Most Common Industries - Retail trade (%)
Most Common Industries - Transportation and warehousing, and utilities (%)
Most Common Industries - Transportation and warehousing (%)
Most Common Industries - Utilities (%)
Most Common Industries - Information (%)
Most Common Industries - Finance and insurance, and real estate and rental and leasing (%)
Most Common Industries - Finance and insurance (%)
Most Common Industries - Real estate and rental and leasing (%)
Most Common Industries - Professional, scientific, and management, and administrative and waste management services (%)
Most Common Industries - Professional, scientific, and technical services (%)
Most Common Industries - Management of companies and enterprises (%)
Most Common Industries - Administrative and support and waste management services (%)
Most Common Industries - Educational services, and health care and social assistance (%)
Most Common Industries - Educational services (%)
Most Common Industries - Health care and social assistance (%)
Most Common Industries - Arts, entertainment, and recreation, and accommodation and food services (%)
Most Common Industries - Arts, entertainment, and recreation (%)
Most Common Industries - Accommodation and food services (%)
Most Common Industries - Other services, except public administration (%)
Most Common Industries - Public administration (%)
Occupation diversity
Most Common Occupations - Management, business, science, and arts occupations (%)
Most Common Occupations - Management, business, and financial occupations (%)
Most Common Occupations - Management occupations (%)
Most Common Occupations - Business and financial operations occupations (%)
Most Common Occupations - Computer, engineering, and science occupations (%)
Most Common Occupations - Computer and mathematical occupations (%)
Most Common Occupations - Architecture and engineering occupations (%)
Most Common Occupations - Life, physical, and social science occupations (%)
Most Common Occupations - Education, legal, community service, arts, and media occupations (%)
Most Common Occupations - Community and social service occupations (%)
Most Common Occupations - Legal occupations (%)
Most Common Occupations - Education, training, and library occupations (%)
Most Common Occupations - Arts, design, entertainment, sports, and media occupations (%)
Most Common Occupations - Healthcare practitioners and technical occupations (%)
Most Common Occupations - Health diagnosing and treating practitioners and other technical occupations (%)
Most Common Occupations - Health technologists and technicians (%)
Most Common Occupations - Service occupations (%)
Most Common Occupations - Healthcare support occupations (%)
Most Common Occupations - Protective service occupations (%)
Most Common Occupations - Fire fighting and prevention, and other protective service workers including supervisors (%)
Most Common Occupations - Law enforcement workers including supervisors (%)
Most Common Occupations - Food preparation and serving related occupations (%)
Most Common Occupations - Building and grounds cleaning and maintenance occupations (%)
Most Common Occupations - Personal care and service occupations (%)
Most Common Occupations - Sales and office occupations (%)
Most Common Occupations - Sales and related occupations (%)
Most Common Occupations - Office and administrative support occupations (%)
Most Common Occupations - Natural resources, construction, and maintenance occupations (%)
Most Common Occupations - Farming, fishing, and forestry occupations (%)
Most Common Occupations - Construction and extraction occupations (%)
Most Common Occupations - Installation, maintenance, and repair occupations (%)
Most Common Occupations - Production, transportation, and material moving occupations (%)
Most Common Occupations - Production occupations (%)
Most Common Occupations - Transportation occupations (%)
Most Common Occupations - Material moving occupations (%)
People in Group quarters - Institutionalized population (%)
People in Group quarters - Correctional institutions (%)
People in Group quarters - Federal prisons and detention centers (%)
People in Group quarters - Halfway houses (%)
People in Group quarters - Local jails and other confinement facilities (including police lockups) (%)
People in Group quarters - Military disciplinary barracks (%)
People in Group quarters - State prisons (%)
People in Group quarters - Other types of correctional institutions (%)
People in Group quarters - Nursing homes (%)
People in Group quarters - Hospitals/wards, hospices, and schools for the handicapped (%)
People in Group quarters - Hospitals/wards and hospices for chronically ill (%)
People in Group quarters - Hospices or homes for chronically ill (%)
People in Group quarters - Military hospitals or wards for chronically ill (%)
People in Group quarters - Other hospitals or wards for chronically ill (%)
People in Group quarters - Hospitals or wards for drug/alcohol abuse (%)
People in Group quarters - Mental (Psychiatric) hospitals or wards (%)
People in Group quarters - Schools, hospitals, or wards for the mentally retarded (%)
People in Group quarters - Schools, hospitals, or wards for the physically handicapped (%)
People in Group quarters - Institutions for the deaf (%)
People in Group quarters - Institutions for the blind (%)
People in Group quarters - Orthopedic wards and institutions for the physically handicapped (%)
People in Group quarters - Wards in general hospitals for patients who have no usual home elsewhere (%)
People in Group quarters - Wards in military hospitals for patients who have no usual home elsewhere (%)
People in Group quarters - Juvenile institutions (%)
People in Group quarters - Long-term care (%)
People in Group quarters - Homes for abused, dependent, and neglected children (%)
People in Group quarters - Residential treatment centers for emotionally disturbed children (%)
People in Group quarters - Training schools for juvenile delinquents (%)
People in Group quarters - Short-term care, detention or diagnostic centers for delinquent children (%)
People in Group quarters - Type of juvenile institution unknown (%)
People in Group quarters - Noninstitutionalized population (%)
People in Group quarters - College dormitories (includes college quarters off campus) (%)
People in Group quarters - Military quarters (%)
People in Group quarters - On base (%)
People in Group quarters - Barracks, unaccompanied personnel housing (UPH), (Enlisted/Officer), ;and similar group living quarters for military personnel (%)
People in Group quarters - Transient quarters for temporary residents (%)
People in Group quarters - Military ships (%)
People in Group quarters - Group homes (%)
People in Group quarters - Homes or halfway houses for drug/alcohol abuse (%)
People in Group quarters - Homes for the mentally ill (%)
People in Group quarters - Homes for the mentally retarded (%)
People in Group quarters - Homes for the physically handicapped (%)
People in Group quarters - Other group homes (%)
People in Group quarters - Religious group quarters (%)
People in Group quarters - Dormitories (%)
People in Group quarters - Agriculture workers' dormitories on farms (%)
People in Group quarters - Job Corps and vocational training facilities (%)
People in Group quarters - Other workers' dormitories (%)
People in Group quarters - Crews of maritime vessels (%)
People in Group quarters - Other nonhousehold living situations (%)
People in Group quarters - Other noninstitutional group quarters (%)
Residents speaking English at home (%)
Residents speaking English at home - Born in the United States (%)
Residents speaking English at home - Native, born elsewhere (%)
Residents speaking English at home - Foreign born (%)
Residents speaking Spanish at home (%)
Residents speaking Spanish at home - Born in the United States (%)
Residents speaking Spanish at home - Native, born elsewhere (%)
Residents speaking Spanish at home - Foreign born (%)
Residents speaking other language at home (%)
Residents speaking other language at home - Born in the United States (%)
Residents speaking other language at home - Native, born elsewhere (%)
Residents speaking other language at home - Foreign born (%)
Class of Workers - Employee of private company (%)
Class of Workers - Self-employed in own incorporated business (%)
Class of Workers - Private not-for-profit wage and salary workers (%)
Class of Workers - Local government workers (%)
Class of Workers - State government workers (%)
Class of Workers - Federal government workers (%)
Class of Workers - Self-employed workers in own not incorporated business and Unpaid family workers (%)
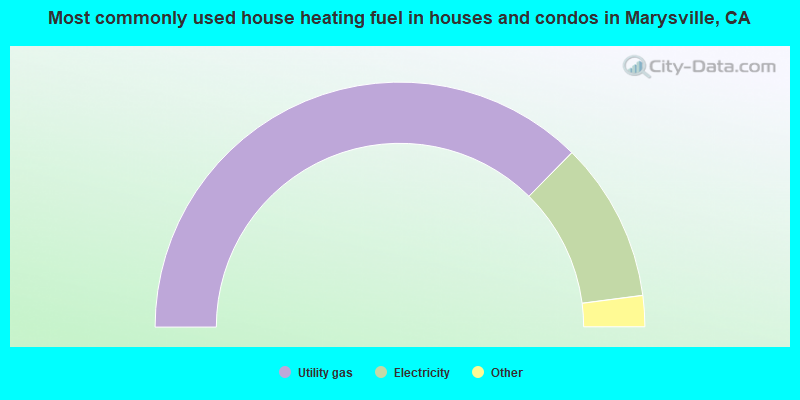
House heating fuel used in houses and condos - Utility gas (%)
House heating fuel used in houses and condos - Bottled, tank, or LP gas (%)
House heating fuel used in houses and condos - Electricity (%)
House heating fuel used in houses and condos - Fuel oil, kerosene, etc. (%)
House heating fuel used in houses and condos - Coal or coke (%)
House heating fuel used in houses and condos - Wood (%)
House heating fuel used in houses and condos - Solar energy (%)
House heating fuel used in houses and condos - Other fuel (%)
House heating fuel used in houses and condos - No fuel used (%)
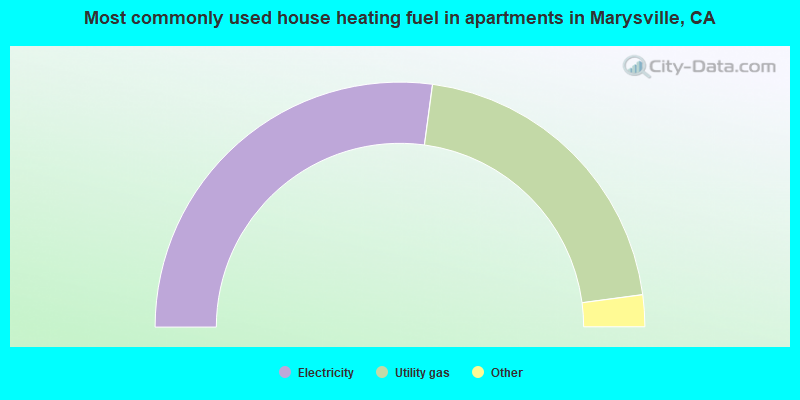
House heating fuel used in apartments - Utility gas (%)
House heating fuel used in apartments - Bottled, tank, or LP gas (%)
House heating fuel used in apartments - Electricity (%)
House heating fuel used in apartments - Fuel oil, kerosene, etc. (%)
House heating fuel used in apartments - Coal or coke (%)
House heating fuel used in apartments - Wood (%)
House heating fuel used in apartments - Solar energy (%)
House heating fuel used in apartments - Other fuel (%)
House heating fuel used in apartments - No fuel used (%)
Armed forces status - In Armed Forces (%)
Armed forces status - Civilian (%)
Armed forces status - Civilian - Veteran (%)
Armed forces status - Civilian - Nonveteran (%)
Fatal accidents locations in years 2005-2021
Fatal accidents locations in 2005
Fatal accidents locations in 2006
Fatal accidents locations in 2007
Fatal accidents locations in 2008
Fatal accidents locations in 2009
Fatal accidents locations in 2010
Fatal accidents locations in 2011
Fatal accidents locations in 2012
Fatal accidents locations in 2013
Fatal accidents locations in 2014
Fatal accidents locations in 2015
Fatal accidents locations in 2016
Fatal accidents locations in 2017
Fatal accidents locations in 2018
Fatal accidents locations in 2019
Fatal accidents locations in 2020
Fatal accidents locations in 2021
Alcohol use - People drinking some alcohol every month (%)
Alcohol use - People not drinking at all (%)
Alcohol use - Average days/month drinking alcohol
Alcohol use - Average drinks/week
Alcohol use - Average days/year people drink much
Audiometry - Average condition of hearing (%)
Audiometry - People that can hear a whisper from across a quiet room (%)
Audiometry - People that can hear normal voice from across a quiet room (%)
Audiometry - Ears ringing, roaring, buzzing (%)
Audiometry - Had a job exposure to loud noise (%)
Audiometry - Had off-work exposure to loud noise (%)
Blood Pressure & Cholesterol - Has high blood pressure (%)
Blood Pressure & Cholesterol - Checking blood pressure at home (%)
Blood Pressure & Cholesterol - Frequently checking blood cholesterol (%)
Blood Pressure & Cholesterol - Has high cholesterol level (%)
Consumer Behavior - Money monthly spent on food at supermarket/grocery store
Consumer Behavior - Money monthly spent on food at other stores
Consumer Behavior - Money monthly spent on eating out
Consumer Behavior - Money monthly spent on carryout/delivered foods
Consumer Behavior - Income spent on food at supermarket/grocery store (%)
Consumer Behavior - Income spent on food at other stores (%)
Consumer Behavior - Income spent on eating out (%)
Consumer Behavior - Income spent on carryout/delivered foods (%)
Current Health Status - General health condition (%)
Current Health Status - Blood donors (%)
Current Health Status - Has blood ever tested for HIV virus (%)
Current Health Status - Left-handed people (%)
Dermatology - People using sunscreen (%)
Diabetes - Diabetics (%)
Diabetes - Had a blood test for high blood sugar (%)
Diabetes - People taking insulin (%)
Diet Behavior & Nutrition - Diet health (%)
Diet Behavior & Nutrition - Milk product consumption (# of products/month)
Diet Behavior & Nutrition - Meals not home prepared (#/week)
Diet Behavior & Nutrition - Meals from fast food or pizza place (#/week)
Diet Behavior & Nutrition - Ready-to-eat foods (#/month)
Diet Behavior & Nutrition - Frozen meals/pizza (#/month)
Drug Use - People that ever used marijuana or hashish (%)
Drug Use - Ever used hard drugs (%)
Drug Use - Ever used any form of cocaine (%)
Drug Use - Ever used heroin (%)
Drug Use - Ever used methamphetamine (%)
Health Insurance - People covered by health insurance (%)
Kidney Conditions-Urology - Avg. # of times urinating at night
Medical Conditions - People with asthma (%)
Medical Conditions - People with anemia (%)
Medical Conditions - People with psoriasis (%)
Medical Conditions - People with overweight (%)
Medical Conditions - Elderly people having difficulties in thinking or remembering (%)
Medical Conditions - People who ever received blood transfusion (%)
Medical Conditions - People having trouble seeing even with glass/contacts (%)
Medical Conditions - People with arthritis (%)
Medical Conditions - People with gout (%)
Medical Conditions - People with congestive heart failure (%)
Medical Conditions - People with coronary heart disease (%)
Medical Conditions - People with angina pectoris (%)
Medical Conditions - People who ever had heart attack (%)
Medical Conditions - People who ever had stroke (%)
Medical Conditions - People with emphysema (%)
Medical Conditions - People with thyroid problem (%)
Medical Conditions - People with chronic bronchitis (%)
Medical Conditions - People with any liver condition (%)
Medical Conditions - People who ever had cancer or malignancy (%)
Mental Health - People who have little interest in doing things (%)
Mental Health - People feeling down, depressed, or hopeless (%)
Mental Health - People who have trouble sleeping or sleeping too much (%)
Mental Health - People feeling tired or having little energy (%)
Mental Health - People with poor appetite or overeating (%)
Mental Health - People feeling bad about themself (%)
Mental Health - People who have trouble concentrating on things (%)
Mental Health - People moving or speaking slowly or too fast (%)
Mental Health - People having thoughts they would be better off dead (%)
Oral Health - Average years since last visit a dentist
Oral Health - People embarrassed because of mouth (%)
Oral Health - People with gum disease (%)
Oral Health - General health of teeth and gums (%)
Oral Health - Average days a week using dental floss/device
Oral Health - Average days a week using mouthwash for dental problem
Oral Health - Average number of teeth
Pesticide Use - Households using pesticides to control insects (%)
Pesticide Use - Households using pesticides to kill weeds (%)
Physical Activity - People doing vigorous-intensity work activities (%)
Physical Activity - People doing moderate-intensity work activities (%)
Physical Activity - People walking or bicycling (%)
Physical Activity - People doing vigorous-intensity recreational activities (%)
Physical Activity - People doing moderate-intensity recreational activities (%)
Physical Activity - Average hours a day doing sedentary activities
Physical Activity - Average hours a day watching TV or videos
Physical Activity - Average hours a day using computer
Physical Functioning - People having limitations keeping them from working (%)
Physical Functioning - People limited in amount of work they can do (%)
Physical Functioning - People that need special equipment to walk (%)
Physical Functioning - People experiencing confusion/memory problems (%)
Physical Functioning - People requiring special healthcare equipment (%)
Prescription Medications - Average number of prescription medicines taking
Preventive Aspirin Use - Adults 40+ taking low-dose aspirin (%)
Reproductive Health - Vaginal deliveries (%)
Reproductive Health - Cesarean deliveries (%)
Reproductive Health - Deliveries resulted in a live birth (%)
Reproductive Health - Pregnancies resulted in a delivery (%)
Reproductive Health - Women breastfeeding newborns (%)
Reproductive Health - Women that had a hysterectomy (%)
Reproductive Health - Women that had both ovaries removed (%)
Reproductive Health - Women that have ever taken birth control pills (%)
Reproductive Health - Women taking birth control pills (%)
Reproductive Health - Women that have ever used Depo-Provera or injectables (%)
Reproductive Health - Women that have ever used female hormones (%)
Sexual Behavior - People 18+ that ever had sex (vaginal, anal, or oral) (%)
Sexual Behavior - Males 18+ that ever had vaginal sex with a woman (%)
Sexual Behavior - Males 18+ that ever performed oral sex on a woman (%)
Sexual Behavior - Males 18+ that ever had anal sex with a woman (%)
Sexual Behavior - Males 18+ that ever had any sex with a man (%)
Sexual Behavior - Females 18+ that ever had vaginal sex with a man (%)
Sexual Behavior - Females 18+ that ever performed oral sex on a man (%)
Sexual Behavior - Females 18+ that ever had anal sex with a man (%)
Sexual Behavior - Females 18+ that ever had any kind of sex with a woman (%)
Sexual Behavior - Average age people first had sex
Sexual Behavior - Average number of female sex partners in lifetime (males 18+)
Sexual Behavior - Average number of female vaginal sex partners in lifetime (males 18+)
Sexual Behavior - Average age people first performed oral sex on a woman (18+)
Sexual Behavior - Average number of woman performed oral sex on in lifetime (18+)
Sexual Behavior - Average number of male sex partners in lifetime (males 18+)
Sexual Behavior - Average number of male anal sex partners in lifetime (males 18+)
Sexual Behavior - Average age people first performed oral sex on a man (18+)
Sexual Behavior - Average number of male oral sex partners in lifetime (18+)
Sexual Behavior - People using protection when performing oral sex (%)
Sexual Behavior - Average number of times people have vaginal or anal sex a year
Sexual Behavior - People having sex without condom (%)
Sexual Behavior - Average number of male sex partners in lifetime (females 18+)
Sexual Behavior - Average number of male vaginal sex partners in lifetime (females 18+)
Sexual Behavior - Average number of female sex partners in lifetime (females 18+)
Sexual Behavior - Circumcised males 18+ (%)
Sleep Disorders - Average hours sleeping at night
Sleep Disorders - People that has trouble sleeping (%)
Smoking-Cigarette Use - People smoking cigarettes (%)
Taste & Smell - People 40+ having problems with smell (%)
Taste & Smell - People 40+ having problems with taste (%)
Taste & Smell - People 40+ that ever had wisdom teeth removed (%)
Taste & Smell - People 40+ that ever had tonsils teeth removed (%)
Taste & Smell - People 40+ that ever had a loss of consciousness because of a head injury (%)
Taste & Smell - People 40+ that ever had a broken nose or other serious injury to face or skull (%)
Taste & Smell - People 40+ that ever had two or more sinus infections (%)
Weight - Average height (inches)
Weight - Average weight (pounds)
Weight - Average BMI
Weight - People that are obese (%)
Weight - People that ever were obese (%)
Weight - People trying to lose weight (%)
7,222 55.2% White alone 3,784 28.9% Hispanic 1,125 8.6% Asian alone 602 4.6% Two or more races 159 1.2% Black alone 113 0.9% Other race alone 46 0.4% American Indian alone
Officers per 1,000 residents here:
1.42California average:
2.30
Latest news from Marysville, CA collected exclusively by city-data.com from local newspapers, TV, and radio stations
Ancestries: American (6.9%), German (6.5%), European (6.3%), Irish (4.4%), Italian (3.0%), Afghan (2.5%).
Current Local Time:
Land area: 3.50 square miles.
Population density: 3,626 people per square mile (average).
1,669 residents are foreign born (7.6% Latin America , 4.8% Asia ).
This city:
12.8%California:
26.5%
Median real estate property taxes paid for housing units with mortgages in 2022: $1,920 (0.6%)Median real estate property taxes paid for housing units with no mortgage in 2022: $2,106 (0.6%)
Nearest city with pop. 50,000+: Roseville, CA
Nearest city with pop. 200,000+: Sacramento, CA
Nearest city with pop. 1,000,000+: Los Angeles, CA
Nearest cities:
Latitude: 39.15 N, Longitude: 121.59 W
Nickname or alias (official or unofficial): Gateway to the Gold Fields
Daytime population change due to commuting: +2,495 (+19.1%)Workers who live and work in this city: 1,224 (22.1%)
Single-family new house construction building permits:
2021: 4 buildings , average cost: $152,5002018: 4 buildings , average cost: $145,0002017: 1 building , cost: $255,1002015: 1 building , cost: $197,6002013: 1 building , cost: $144,5002012: 1 building , cost: $67,5002010: 4 buildings , average cost: $89,2002009: 2 buildings , average cost: $162,0002008: 2 buildings , average cost: $90,0002007: 2 buildings , average cost: $255,2002006: 1 building , cost: $117,3002005: 2 buildings , average cost: $117,3002004: 2 buildings , average cost: $149,2002003: 20 buildings , average cost: $149,3002002: 5 buildings , average cost: $78,7002001: 2 buildings , average cost: $112,4001999: 1 building , cost: $107,9001998: 1 building , cost: $107,900Unemployment in December 2023:
Most common occupations in Marysville, CA (%)
Both Males Females
Other office and administrative support workers, including supervisors (6.1%)
Other production occupations, including supervisors (5.0%)
Other management occupations, except farmers and farm managers (4.7%)
Building and grounds cleaning and maintenance occupations (4.5%)
Material recording, scheduling, dispatching, and distributing workers (4.0%)
Other sales and related occupations, including supervisors (3.6%)
Preschool, kindergarten, elementary, and middle school teachers (3.4%)
Other production occupations, including supervisors (6.5%)
Vehicle and mobile equipment mechanics, installers, and repairers (6.3%)
Electrical equipment mechanics and other installation, maintenance, and repair workers, including supervisors (5.7%)
Driver/sales workers and truck drivers (5.7%)
Building and grounds cleaning and maintenance occupations (5.4%)
Other management occupations, except farmers and farm managers (4.7%)
Material recording, scheduling, dispatching, and distributing workers (3.7%)
Other office and administrative support workers, including supervisors (9.7%)
Preschool, kindergarten, elementary, and middle school teachers (5.7%)
Cashiers (4.8%)
Other management occupations, except farmers and farm managers (4.6%)
Other sales and related occupations, including supervisors (4.5%)
Material recording, scheduling, dispatching, and distributing workers (4.3%)
Cooks and food preparation workers (4.1%)
Earthquake activity:
Marysville-area historical earthquake activity is significantly above California state average. It is 7242% greater than the overall U.S. average. On 4/18/1906 at 13:12:21, a magnitude 7.9 (7.9 UK, Class: Major, Intensity: VIII - XII) earthquake occurred 110.3 miles away from Marysville center, causing $524,000,000 total damage On 1/31/1922 at 13:17:28, a magnitude 7.6 (7.6 UK) earthquake occurred 236.2 miles away from Marysville center On 10/3/1915 at 06:52:48, a magnitude 7.6 (7.6 UK) earthquake occurred 236.2 miles away from Marysville center On 4/25/1992 at 18:06:04, a magnitude 7.2 (6.3 MB, 7.1 MS, 7.2 MW, 7.1 MW, Depth: 9.4 mi) earthquake occurred 156.0 miles away from the city center, causing $75,000,000 total damage On 10/18/1989 at 00:04:15, a magnitude 7.1 (6.5 MB, 7.1 MS, 6.9 MW, 7.0 ML) earthquake occurred 141.4 miles away from the city center, causing 62 deaths ( 62 shaking deaths) and 3757 injuries, causing $1,305,032,704 total damage On 12/21/1932 at 06:10:09, a magnitude 7.2 (7.2 UK) earthquake occurred 193.8 miles away from the city center Magnitude types: body-wave magnitude (MB), local magnitude (ML), surface-wave magnitude (MS), moment magnitude (MW) Natural disasters: The number of natural disasters in Yuba County (22) is greater than the US average (15).Major Disasters (Presidential) Declared: 12Emergencies Declared: 3Floods: 12, Fires: 6, Storms: 6, Winter Storms: 5, Landslides: 3, Mudslides: 3, Drought: 1, Freeze: 1, Heavy Rain: 1, Hurricane: 1, Tornado: 1, Other: 1 (Note: some incidents may be assigned to more than one category). Hospitals and medical centers in Marysville: GRANNY'S HOUSE - MAGNOLIA ROAD (632 MAGNOLIA ROAD) RIDEOUT MEMORIAL HOSPITAL (Voluntary non-profit - Other, 726 4TH ST) SUTTER NORTH HOSPICE (826 FOURTH STREET) MARYSVILLE CARE CENTER (1617 RAMIREZ STREET)
MARYSVILLE DIALYSIS CENTER (1015 8TH STREET)
Amtrak station: MARYSVILLE (6TH & A STS.) - Bus Station
College/University in Marysville: Yuba College Full-time enrollment: 4,737; Location: 2088 N Beale Rd; Public; Website: yc.yccd.edu)
Other colleges/universities with over 2000 students near Marysville:
Sierra College (about 32 miles; Rocklin, CA ; Full-time enrollment: 11,488)
Butte College (about 35 miles; Oroville, CA ; FT enrollment: 8,649)
Universal Technical Institute of Northern California Inc (about 35 miles; Sacramento, CA ; FT enrollment: 3,193)
University of Phoenix-Sacramento Valley Campus (about 37 miles; Sacramento, CA ; FT enrollment: 2,855)
American River College (about 37 miles; Sacramento, CA ; FT enrollment: 20,452)
Folsom Lake College (about 42 miles; Folsom, CA ; FT enrollment: 5,308)
California State University-Sacramento (about 42 miles; Sacramento, CA ; FT enrollment: 22,234)
Public high schools in Marysville: MARYSVILLE HIGH Students: 648, Location: 12 E. 18TH ST., Grades: 9-12)CAMPTONVILLE ACADEMY Students: 306, Location: 922 G ST., Grades: KG-12, Charter school )MARYSVILLE CHARTER ACADEMY FOR THE ARTS Students: 227, Location: 1917 B ST., Grades: 7-12, Charter school )YUBA COUNTY CAREER PREPARATORY CHARTER Students: 134, Location: 1104 E ST., Grades: KG-12, Charter school )LINCOLN (ABRAHAM) (ALTERNATIVE) Students: 103, Location: 1949 B ST., Grades: KG-12)YUBA COUNTY SPECIAL EDUCATION Students: 72, Location: 935 14TH ST., Grades: KG-12)NORTH MARYSVILLE CONTINUATION HIGH Students: 13, Location: 1949 B ST., Grades: 9-12)THOMAS E. MATHEWS COMMUNITY Students: 11, Location: 1010 I ST., Grades: 7-12)HARRY P B CARDEN Location: 1023 14TH ST., Grades: KG-12)
Public elementary/middle schools in Marysville: LINDA ELEMENTARY Students: 505, Location: 6180 DUNNING AVE., Grades: KG-6)ANNA MCKENNEY INTERMEDIATE Students: 485, Location: 1904 HUSTON, Grades: 6-8)KYNOCH ELEMENTARY Students: 368, Location: 1905 AHERN ST., Grades: KG-5)COVILLAUD ELEMENTARY Students: 268, Location: 628 F ST., Grades: KG-5)FOOTHILL INTERMEDIATE Students: 206, Location: 5351 FRUITLAND RD., Grades: 7-8)EDGEWATER ELEMENTARY Students: 109, Location: 5715 OAKWOOD DR., Grades: KG-6)LOMA RICA ELEMENTARY Students: 108, Location: 5150 FRUITLAND RD., Grades: KG-5)CORDUA ELEMENTARY Students: 59, Location: 2830 HIGHWAY 20, Grades: KG-5)PARAGON COLLEGIATE ACADEMY Location: 1608 SAMPSON ST., Grades: KG-8, Charter school )
See full list of schools located in Marysville Library in Marysville: YUBA COUNTY LIBRARY Operating income: $1,057,676; Location: 303 SECOND ST.; 142,705 books ; 42 e-books ; 5,000 audio materials ; 7,500 video materials ; 2 local licensed databases ; 1 state licensed databases ; 1 other licensed databases ; 125 print serial subscriptions ; 1 electronic serial subscriptions )
Notable locations in Marysville: (A) , Yuba County Jail (B) , Yuba County Courthouse (C) , Veterans Memorial Auditorium (D) , The Castle (E) , Packard Library (F) , Marysville City Hall (G) , Marysville Art Club (H) , Mary Aaron Memorial Museum (I) , Hart Building (J) , California Department of Forestry and Fire Protection Station 95 Marysville Fire Department (K) . Display/hide their locations on the map
Churches in Marysville include: (A) , Word of Life Church (B) , Saint Joseph Catholic Church (C) , Saint Johns Episcopal Church (D) , Mount Olivet Baptist Church (E) , Hall Street Baptist Church (F) , First Presbyterian Church (G) , First Methodist Church (H) , First Church of Christ Scientist (I) . Display/hide their locations on the map
Cemetery: (1) . Display/hide its location on the map
Lakes: (A) , Ellis Lake (B) . Display/hide their locations on the map
Parks in Marysville include: (1) , Yuba Square (2) , Basin Park (3) , Bryant Field (4) , Ellis Lake Park (5) , Market Square (6) , Memorial Stadium (7) , Napoleon Square (8) , Plaza Park (9) . Display/hide their locations on the map
Hotels:
Birthplace of: Robert W. Chandler - Soilder, Alice Miller (golfer) - Professional golfer, Brad Johnson (television actor) - Actor, Leslie M. Palm - Marine Corps general, Alyn Beals - Football player, Arthur L. Jarrett - Screenwriter, Guy Branum - Actor, Joe Rose (American football) - Football player, Larry Bagby - Actor, Merle Anthony - Baseball umpire.
Yuba County has a predicted average indoor radon screening level between 2 and 4 pCi/L (pico curies per liter) - Moderate Potential Drinking water stations with addresses in Marysville and their reported violations in the past:
MARYSVILLE RACEWAY PARK (Population served: 70, Groundwater):
Past health violations:
MCL, Monthly (TCR) - Between OCT-2011 and DEC-2011, Contaminant: Coliform. Follow-up actions: St AO (w/o penalty) issued (OCT-31-2011), St Compliance achieved (DEC-28-2011)
Past monitoring violations:
One routine major monitoring violation
Population served: 65, Groundwater):
Past health violations:
MCL, Monthly (TCR) - Between JUL-2006 and SEP-2006, Contaminant: Coliform
Past monitoring violations:
Monitoring, Repeat Major (TCR) - In OCT-2006, Contaminant: Coliform (TCR)
Population served: 60, Groundwater):
Past health violations:
MCL, Monthly (TCR) - Between JUL-2013 and SEP-2013, Contaminant: Coliform. Follow-up actions: St Formal NOV issued (AUG-21-2013), St Compliance achieved (OCT-30-2013)
Population served: 60, Groundwater):
Past health violations:
MCL, Monthly (TCR) - In SEP-2011, Contaminant: Coliform. Follow-up actions: St AO (w/o penalty) issued (OCT-24-2011), St Compliance achieved (OCT-28-2011)
MCL, Monthly (TCR) - In JAN-2006, Contaminant: Coliform
Population served: 50, Groundwater):
Past health violations:
MCL, Monthly (TCR) - In SEP-2011, Contaminant: Coliform. Follow-up actions: St AO (w/o penalty) issued (OCT-19-2011), St Compliance achieved (OCT-21-2011)
Population served: 30, Groundwater):
Past health violations:
MCL, Monthly (TCR) - In DEC-2006, Contaminant: Coliform
MCL, Monthly (TCR) - In JUL-2006, Contaminant: Coliform
MCL, Monthly (TCR) - In JUN-2006, Contaminant: Coliform
Past monitoring violations:
2 routine major monitoring violations
Population served: 25, Groundwater):
Past monitoring violations:
9 routine major monitoring violations
Drinking water stations with addresses in Marysville that have no violations reported:
MARYSVILLE FLEA MARKET (Population served: 500, Primary Water Source Type: Groundwater)
CASTLEWOOD MOBILE HOME PARK (Population served: 161, Primary Water Source Type: Groundwater)
YUBA COUNTY 4-H CAMP (Population served: 100, Primary Water Source Type: Groundwater)
SEVEN MILE HOUSE (Population served: 50, Primary Water Source Type: Groundwater)
PIZZA ROUND UP (Population served: 50, Primary Water Source Type: Groundwater)
LOMA RICA STORE (Population served: 35, Primary Water Source Type: Groundwater)
WILLOW GLEN CAFE (Population served: 35, Primary Water Source Type: Groundwater)
Average household size: This city:
2.4 peopleCalifornia:
2.9 people
Percentage of family households: This city:
57.9%Whole state:
68.7%
Percentage of households with unmarried partners: This city:
10.5%Whole state:
7.2%
Likely homosexual households (counted as self-reported same-sex unmarried-partner households)
Lesbian couples: 0.5% of all households Gay men: 0.3% of all households
People in group quarters in Marysville in 2010:
406 people in local jails and other municipal confinement facilities
82 people in nursing facilities/skilled-nursing facilities
57 people in other noninstitutional facilities
40 people in residential treatment centers for adults
38 people in emergency and transitional shelters (with sleeping facilities) for people experiencing homelessness
37 people in correctional facilities intended for juveniles
6 people in group homes intended for adults
4 people in workers' group living quarters and job corps centers
People in group quarters in Marysville in 2000:
341 people in local jails and other confinement facilities (including police lockups)
87 people in other noninstitutional group quarters
78 people in nursing homes
58 people in short-term care, detention or diagnostic centers for delinquent children
22 people in other nonhousehold living situations
21 people in homes or halfway houses for drug/alcohol abuse
Banks with branches in Marysville (2011 data):
Tri Counties Bank: Marysville Branch at 904 E Street, branch established on 1994/03/14. Info updated 2011/09/26: Bank assets: $2,554.4 mil, Deposits: $2,191.2 mil, headquarters in Chico, CA, positive income , Commercial Lending Specialization, 71 total offices , Holding Company: Trico Bancshares
Bank of America, National Association: Marysville Branch at 619 E Street, branch established on 1922/02/03. Info updated 2009/11/18: Bank assets: $1,451,969.3 mil, Deposits: $1,077,176.8 mil, headquarters in Charlotte, NC, positive income , 5782 total offices , Holding Company: Bank Of America Corporation
JPMorgan Chase Bank, National Association: 726 E Street Branch at 726 E Street, branch established on 1919/01/01. Info updated 2011/11/10: Bank assets: $1,811,678.0 mil, Deposits: $1,190,738.0 mil, headquarters in Columbus, OH, positive income , International Specialization, 5577 total offices , Holding Company: Jpmorgan Chase & Co.
Umpqua Bank: Marysville Branch at 700 E Street, branch established on 1979/08/08. Info updated 2011/09/02: Bank assets: $11,556.7 mil, Deposits: $9,325.3 mil, headquarters in Roseburg, OR, positive income , Commercial Lending Specialization, 193 total offices , Holding Company: Umpqua Holdings Corporation
Rabobank, National Association: Marysville Branch at 904 B Street, branch established on 2004/07/05. Info updated 2011/01/27: Bank assets: $11,745.0 mil, Deposits: $8,446.0 mil, headquarters in Roseville, CA, positive income , Agricultural Specialization, 124 total offices , Holding Company: Cooperatieve Centrale Raiffeisen-Boerenleenbank B.A., "rabobank Nederland
Gold Pacific Bank, National Association: at 519 'd' Street, branch established on 1986/12/29. Info updated 2012/04/03: Bank assets: $130.9 mil, Deposits: $118.3 mil, local headquarters , negative income in the last year , Commercial Lending Specialization, 8 total offices , Holding Company: Golden Pacific Bancorp, Inc.
For population 15 years and over in Marysville:
Never married: 43.5%Now married: 35.2%Separated: 1.3%Widowed: 4.5%Divorced: 15.4% For population 25 years and over in Marysville:
High school or higher: 83.0%Bachelor's degree or higher: 14.7%Graduate or professional degree: 5.7%Unemployed: 9.8%Mean travel time to work (commute): 33.6 minutes
Education Gini index (Inequality in education) Here:
12.6California average:
15.5
Religion statistics for Marysville, CA (based on Yuba County data)
Religion Adherents Congregations Catholic 12,138 3 Evangelical Protestant 5,904 46 Other 4,406 9 Mainline Protestant 891 7 Black Protestant 266 1 None 48,550 -
Source: Clifford Grammich, Kirk Hadaway, Richard Houseal, Dale E.Jones, Alexei Krindatch, Richie Stanley and Richard H.Taylor. 2012. 2010 U.S.Religion Census: Religious Congregations & Membership Study. Association of Statisticians of American Religious Bodies. Jones, Dale E., et al. 2002. Congregations and Membership in the United States 2000. Nashville, TN: Glenmary Research Center. Graphs represent county-level data
Food Environment Statistics: Number of grocery stores : 13This county :
1.81 / 10,000 pop.California :
2.14 / 10,000 pop.
Number of supercenters and club stores : 1Here :
0.14 / 10,000 pop.California :
0.04 / 10,000 pop.
Number of convenience stores (no gas) : 6Yuba County :
0.84 / 10,000 pop.California :
0.62 / 10,000 pop.
Number of convenience stores (with gas) : 15Here :
2.09 / 10,000 pop.California :
1.49 / 10,000 pop.
Number of full-service restaurants : 29Here :
4.04 / 10,000 pop.State :
7.42 / 10,000 pop.
Adult diabetes rate : Yuba County :
7.2%California :
7.3%
Adult obesity rate : Yuba County :
27.4%California :
21.3%
Low-income preschool obesity rate : Health and Nutrition: Healthy diet rate : Here:
49.0%California:
49.4%
Average overall health of teeth and gums : Marysville:
46.5%California:
48.0%
Average BMI : Marysville:
28.5State:
28.1
People feeling badly about themselves : This city:
20.8%State:
20.2%
People not drinking alcohol at all : Here:
11.5%California:
11.2%
Average hours sleeping at night : Overweight people : Marysville:
32.4%California:
31.5%
General health condition : This city:
56.0%State:
56.4%
Average condition of hearing : This city:
79.8%State:
80.9%
More about Health and Nutrition of Marysville, CA Residents
Local government employment and payroll (March 2022)
Function
Full-time employees
Monthly full-time payroll
Average yearly full-time wage
Part-time employees
Monthly part-time payroll
Police Protection - Officers
19 $164,493 $103,890 10 $18,323 Firefighters
14 $142,272 $121,947 5 $885 Police - Other
8 $42,898 $64,347 6 $2,028 Other Government Administration
6 $16,459 $32,918 5 $1,500 Streets and Highways
4 $35,693 $107,079 0 $0 Financial Administration
3 $20,334 $81,336 0 $0 Parks and Recreation
3 $10,735 $42,940 1 $2,306 Sewerage
2 $8,746 $52,476 0 $0 Other and Unallocable
1 $5,930 $71,160 0 $0 Fire - Other
0 $0 1 $3,367
Totals for Government
60 $447,559 $89,512 28 $28,409
Marysville government finances - Expenditure in 2017 (per resident):
Construction - Housing and Community Development: $123,000 ($9.68)
Current Operations - Sewerage: $3,028,000 ($238.35)
Police Protection: $2,962,000 ($233.15)Central Staff Services: $1,694,000 ($133.34)Local Fire Protection: $1,211,000 ($95.32)Regular Highways: $457,000 ($35.97)Parks and Recreation: $375,000 ($29.52)Financial Administration: $330,000 ($25.98)Housing and Community Development: $289,000 ($22.75)Protective Inspection and Regulation - Other: $180,000 ($14.17)Health - Other: $31,000 ($2.44)Miscellaneous Commercial Activities - Other: $12,000 ($0.94)General - Interest on Debt: $1,724,000 ($135.71)
Other Capital Outlay - General - Other: $738,000 ($58.09)
Sewerage: $84,000 ($6.61)Police Protection: $80,000 ($6.30)Local Fire Protection: $53,000 ($4.17)Regular Highways: $44,000 ($3.46)
Marysville government finances - Revenue in 2017 (per resident):
Charges - Sewerage: $2,687,000 ($211.51)
Other: $1,579,000 ($124.29)Regular Highways: $13,000 ($1.02)Parks and Recreation: $7,000 ($0.55)Federal Intergovernmental - Other: $124,000 ($9.76)
Housing and Community Development: $46,000 ($3.62)Miscellaneous - General Revenue - Other: $638,000 ($50.22)
Rents: $159,000 ($12.52)Fines and Forfeits: $87,000 ($6.85)Interest Earnings: $34,000 ($2.68)State Intergovernmental - Other: $858,000 ($67.54)
General Local Government Support: $294,000 ($23.14)Highways: $5,000 ($0.39)Tax - General Sales and Gross Receipts: $2,908,000 ($228.90)
Property: $2,171,000 ($170.89)Public Utilities Sales: $416,000 ($32.75)Other License: $214,000 ($16.85)Occupation and Business License - Other: $138,000 ($10.86)Other Selective Sales: $81,000 ($6.38)
Marysville government finances - Debt in 2017 (per resident):
Long Term Debt - Beginning Outstanding - Unspecified Public Purpose: $50,905,000 ($4007.01)
Outstanding Unspecified Public Purpose: $49,446,000 ($3892.16)Retired Unspecified Public Purpose: $1,460,000 ($114.92)
Marysville government finances - Cash and Securities in 2017 (per resident):
Other Funds - Cash and Securities: $7,589,000 ($597.37)
12.15% of this county's 2021 resident taxpayers lived in other counties in 2020 ($52,892 average adjusted gross income )
Here:
12.15%California average:
5.19%
0.27% of residents moved from foreign countries ($1,145 average AGI )Yuba County:
0.27%California average:
0.03%
Top counties from which taxpayers relocated into this county between 2020 and 2021:
10.93% of this county's 2020 resident taxpayers moved to other counties in 2021 ($50,912 average adjusted gross income )
Here:
10.93%California average:
6.14%
0.15% of residents moved to foreign countries ($622 average AGI )Yuba County:
0.15%California average:
0.02%
Top counties to which taxpayers relocated from this county between 2020 and 2021:
Businesses in Marysville, CA
Name Count Name Count
7-Eleven 3 Little Caesars Pizza 1 Ace Hardware 1 McDonald's 1 AutoZone 1 Motel 6 1 Baymont Inn 1 Panda Express 1 Burger King 2 Pizza Hut 1 CVS 1 Quiznos 1 Carl\s Jr. 1 RadioShack 1 Circle K 1 Starbucks 1 Comfort Suites 1 Subway 3 Curves 1 Super 8 1 DHL 1 T-Mobile 2 Dennys 1 Taco Bell 2 Domino's Pizza 1 U-Haul 1 FedEx 3 UPS 4 Jack In The Box 1 Walgreens 1 KFC 1 Walmart 1 Kroger 1
Strongest AM radio stations in Marysville:
KMYC (1410 AM; 5 kW; MARYSVILLE, CA; Owner: THOMAS F. HUTH)
KOBO (1450 AM; 1 kW; YUBA CITY, CA; Owner: MULTICULTURAL RADIO BROADCASTING INC)
KUBA (1600 AM; 5 kW; YUBA CITY, CA; Owner: HARLAN COMMUNICATIONS, INC.)
KFBK (1530 AM; 50 kW; SACRAMENTO, CA; Owner: AMFM RADIO LICENSES, L.L.C.)
KFIA (710 AM; 25 kW; CARMICHAEL, CA; Owner: VISTA BROADCASTING INC.)
KSTE (650 AM; 25 kW; RANCHO CORDOVA, CA; Owner: AMFM RADIO LICENSES, L.L.C.)
KHTK (1140 AM; 50 kW; SACRAMENTO, CA; Owner: INFINITY RADIO SUBSIDIARY OPERATIONS INC.)
KCBS (740 AM; 50 kW; SAN FRANCISCO, CA; Owner: INFINITY BROADCASTING OPERATIONS, INC.)
KAHI (950 AM; 10 kW; AUBURN, CA; Owner: IHR EDUCATIONAL BROADCASTING)
KLIB (1110 AM; 10 kW; ROSEVILLE, CA; Owner: WAY BROADCASTING, INC.)
KCBC (770 AM; 50 kW; RIVERBANK, CA; Owner: KIERTRON, INC.)
KNCO (830 AM; 5 kW; GRASS VALLEY, CA; Owner: NEVADA COUNTY BROADCASTERS, INC.)
KKOH (780 AM; 50 kW; RENO, NV; Owner: CITADEL BROADCASTING COMPANY)
Strongest FM radio stations in Marysville:
KRCX-FM (99.9 FM; MARYSVILLE, CA; Owner: ENTRAVISION HOLDINGS, LLC)
KMJE (101.5 FM; GRIDLEY, CA; Owner: RESULTS RADIO LICENSEE, LLC)
K213BZ (90.5 FM; RICHVALE, CA; Owner: FAMILY STATIONS, INC.)
KXCL (103.9 FM; YUBA CITY, CA; Owner: HARLAN COMMUNICATIONS, INC.)
KKCY (103.1 FM; COLUSA, CA; Owner: RESULTS RADIO LICENSEE, LLC)
K258AQ (99.5 FM; YANKEE HILL, CA; Owner: CALVARY CHAPEL OF TWIN FALLS, INC.)
KYIX (104.9 FM; SOUTH OROVILLE, CA; Owner: BUTTE BROADCASTING COMPANY, INC.)
KHHZ (97.7 FM; OROVILLE, CA; Owner: CLEAR CHANNEL BROADCASTING LICENSES, INC.)
KHAP (89.1 FM; CHICO, CA; Owner: FAMILY STATIONS, INC.)
KNDL (89.9 FM; ANGWIN, CA; Owner: HOWELL MOUNTAIN BROADCASTING COMPANY)
KLVR (91.9 FM; SANTA ROSA, CA; Owner: EDUCATIONAL MEDIA FOUNDATION)
KXTS (100.9 FM; CALISTOGA, CA; Owner: SINCLAIR TELECABLE, INC.)
KBBF (89.1 FM; SANTA ROSA, CA; Owner: BILINGUAL B/CING. FOUNDATION, INC.)
KVMR (89.5 FM; NEVADA CITY, CA; Owner: NEVADA CITY COMMUNITY BROADCAST GRUP)
KHGQ (100.3 FM; QUINCY, CA; Owner: KEILY MILLER)
KLVS (99.3 FM; GRASS VALLEY, CA; Owner: EDUCATIONAL MEDIA FOUNDATION)
K284AG (104.7 FM; WOODLAND, CA; Owner: EDUCATIONAL MEDIA FOUNDATION)
KNCO-FM (94.1 FM; GRASS VALLEY, CA; Owner: NEVADA COUNTY BROADCASTERS, INC.)
KUIC (95.3 FM; VACAVILLE, CA; Owner: KUIC, INC.)
KKFS (105.5 FM; DUNNIGAN, CA; Owner: CARON BROADCASTING, INC.)
TV broadcast stations around Marysville:
KEZT-CA (Channel 23; SACRAMENTO, CA; Owner: TELEFUTURA SACRAMENTO LLC)
KMMK-LP (Channel 14; SACRAMENTO, CA; Owner: CABALLERO TELEVISION TEXAS, L.L.C.)
KSPX (Channel 29; SACRAMENTO, CA; Owner: PAXSON SACRAMENTO LICENSE, INC.)
KTXL (Channel 40; SACRAMENTO, CA; Owner: CHANNEL 40, INC.)
KOVR (Channel 13; STOCKTON, CA; Owner: SCI - SACRAMENTO LICENSEE, LLC)
KXTV (Channel 10; SACRAMENTO, CA; Owner: KXTV, INC.)
KQCA (Channel 58; STOCKTON, CA; Owner: KCRA HEARST-ARGYLE TELEVISION, INC.)
KVIE (Channel 6; SACRAMENTO, CA; Owner: KVIE, INC.)
K17EH (Channel 17; EUREKA, CA; Owner: MS COMMUNICATIONS, LLC)
National Bridge Inventory (NBI) Statistics 25 Number of bridges479ft / 146m Total length $3,463,000 Total costs246,560 Total average daily traffic26,689 Total average daily truck traffic
New bridges - historical statistics
2 1900-1909 1 1910-1919 4 1920-1929 2 1930-1939 2 1940-1949 7 1950-1959 5 1960-1969 2 1980-1989
See full National Bridge Inventory statistics for Marysville, CA
Home Mortgage Disclosure Act Aggregated Statistics For Year 2009(Based on 3 partial tracts) A) FHA, FSA/RHS & VA B) Conventional C) Refinancings D) Home Improvement Loans E) Loans on Dwellings For 5+ Families F) Non-occupant Loans on Number Average Value Number Average Value Number Average Value Number Average Value Number Average Value Number Average Value
LOANS ORIGINATED 41 $109,916 29 $76,772 38 $136,926 4 $57,252 1 $124,430 21 $73,211 APPLICATIONS APPROVED, NOT ACCEPTED 3 $111,853 1 $138,590 7 $167,691 4 $23,682 0 $0 2 $119,205 APPLICATIONS DENIED 6 $101,847 3 $62,440 27 $145,943 1 $7,930 0 $0 5 $86,500 APPLICATIONS WITHDRAWN 6 $180,323 5 $94,014 10 $142,250 1 $79,130 0 $0 4 $61,812 FILES CLOSED FOR INCOMPLETENESS 0 $0 1 $82,420 3 $130,037 0 $0 0 $0 1 $35,550
Aggregated Statistics For Year 2008(Based on 3 partial tracts) A) FHA, FSA/RHS & VA B) Conventional C) Refinancings D) Home Improvement Loans F) Non-occupant Loans on G) Loans On Manufactured Number Average Value Number Average Value Number Average Value Number Average Value Number Average Value Number Average Value
LOANS ORIGINATED 30 $138,928 32 $120,957 46 $143,176 10 $49,313 25 $107,834 0 $0 APPLICATIONS APPROVED, NOT ACCEPTED 1 $120,790 6 $120,753 10 $132,594 1 $88,560 4 $108,320 1 $45,660 APPLICATIONS DENIED 4 $152,708 12 $102,348 69 $161,203 18 $106,608 16 $135,351 1 $48,740 APPLICATIONS WITHDRAWN 3 $154,687 7 $118,629 23 $160,049 2 $29,690 5 $102,642 0 $0 FILES CLOSED FOR INCOMPLETENESS 0 $0 1 $136,280 4 $177,115 1 $60,180 2 $186,420 0 $0
Aggregated Statistics For Year 2007(Based on 3 partial tracts) A) FHA, FSA/RHS & VA B) Conventional C) Refinancings D) Home Improvement Loans E) Loans on Dwellings For 5+ Families F) Non-occupant Loans on G) Loans On Manufactured Number Average Value Number Average Value Number Average Value Number Average Value Number Average Value Number Average Value Number Average Value
LOANS ORIGINATED 1 $279,650 65 $172,331 130 $154,116 21 $82,077 7 $2,778,806 31 $177,438 1 $30,250 APPLICATIONS APPROVED, NOT ACCEPTED 0 $0 13 $141,427 37 $165,422 3 $108,313 0 $0 8 $163,104 1 $38,980 APPLICATIONS DENIED 0 $0 33 $188,629 131 $192,605 17 $80,889 1 $359,590 20 $169,140 2 $56,235 APPLICATIONS WITHDRAWN 0 $0 11 $197,492 45 $175,563 4 $220,045 1 $1,185,220 7 $100,087 0 $0 FILES CLOSED FOR INCOMPLETENESS 0 $0 8 $161,411 23 $229,137 4 $144,558 0 $0 3 $144,643 0 $0
Aggregated Statistics For Year 2006(Based on 3 partial tracts) A) FHA, FSA/RHS & VA B) Conventional C) Refinancings D) Home Improvement Loans E) Loans on Dwellings For 5+ Families F) Non-occupant Loans on G) Loans On Manufactured Number Average Value Number Average Value Number Average Value Number Average Value Number Average Value Number Average Value Number Average Value
LOANS ORIGINATED 2 $199,750 123 $150,446 244 $160,797 48 $83,710 4 $1,676,510 65 $172,763 0 $0 APPLICATIONS APPROVED, NOT ACCEPTED 0 $0 31 $144,521 50 $182,006 10 $129,683 0 $0 8 $170,085 1 $39,490 APPLICATIONS DENIED 0 $0 59 $146,784 139 $194,013 39 $91,639 0 $0 29 $187,597 0 $0 APPLICATIONS WITHDRAWN 1 $169,080 25 $145,228 103 $177,607 8 $147,875 0 $0 8 $138,396 0 $0 FILES CLOSED FOR INCOMPLETENESS 0 $0 3 $211,073 23 $181,474 3 $132,923 0 $0 6 $181,995 0 $0
Aggregated Statistics For Year 2005(Based on 3 partial tracts) A) FHA, FSA/RHS & VA B) Conventional C) Refinancings D) Home Improvement Loans E) Loans on Dwellings For 5+ Families F) Non-occupant Loans on G) Loans On Manufactured Number Average Value Number Average Value Number Average Value Number Average Value Number Average Value Number Average Value Number Average Value
LOANS ORIGINATED 3 $259,637 224 $141,538 344 $156,374 52 $113,056 2 $708,515 104 $146,780 0 $0 APPLICATIONS APPROVED, NOT ACCEPTED 0 $0 39 $140,985 44 $169,976 5 $112,884 0 $0 9 $150,063 1 $96,110 APPLICATIONS DENIED 0 $0 63 $140,635 110 $160,658 26 $77,788 1 $708,350 22 $197,844 4 $78,232 APPLICATIONS WITHDRAWN 1 $176,430 42 $158,606 132 $160,825 14 $140,679 0 $0 19 $166,324 0 $0 FILES CLOSED FOR INCOMPLETENESS 0 $0 8 $169,351 33 $145,135 4 $128,482 0 $0 6 $169,905 0 $0
Aggregated Statistics For Year 2004(Based on 3 partial tracts) A) FHA, FSA/RHS & VA B) Conventional C) Refinancings D) Home Improvement Loans E) Loans on Dwellings For 5+ Families F) Non-occupant Loans on G) Loans On Manufactured Number Average Value Number Average Value Number Average Value Number Average Value Number Average Value Number Average Value Number Average Value
LOANS ORIGINATED 16 $184,118 204 $120,870 308 $128,822 65 $67,519 4 $2,577,895 92 $131,755 1 $137,850 APPLICATIONS APPROVED, NOT ACCEPTED 0 $0 22 $115,920 44 $140,249 6 $62,460 0 $0 11 $128,035 1 $53,150 APPLICATIONS DENIED 2 $102,350 37 $118,588 122 $137,751 40 $53,204 0 $0 16 $117,417 1 $179,610 APPLICATIONS WITHDRAWN 1 $130,220 28 $116,406 115 $134,458 17 $96,834 0 $0 15 $139,999 0 $0 FILES CLOSED FOR INCOMPLETENESS 0 $0 7 $126,187 35 $147,581 1 $129,680 0 $0 3 $197,110 1 $45,920
Aggregated Statistics For Year 2003(Based on 3 partial tracts) A) FHA, FSA/RHS & VA B) Conventional C) Refinancings D) Home Improvement Loans E) Loans on Dwellings For 5+ Families F) Non-occupant Loans on Number Average Value Number Average Value Number Average Value Number Average Value Number Average Value Number Average Value
LOANS ORIGINATED 22 $143,012 148 $112,164 427 $102,608 21 $26,713 5 $1,464,128 95 $103,303 APPLICATIONS APPROVED, NOT ACCEPTED 2 $170,820 24 $104,199 54 $97,243 6 $35,767 1 $124,430 12 $95,360 APPLICATIONS DENIED 4 $143,180 32 $123,688 123 $105,788 20 $31,119 1 $2,757,650 16 $128,883 APPLICATIONS WITHDRAWN 4 $140,982 21 $115,393 98 $109,461 3 $24,823 0 $0 12 $83,719 FILES CLOSED FOR INCOMPLETENESS 0 $0 2 $187,825 14 $118,607 2 $42,705 0 $0 4 $117,332
Aggregated Statistics For Year 2002(Based on 3 partial tracts) A) FHA, FSA/RHS & VA B) Conventional C) Refinancings D) Home Improvement Loans E) Loans on Dwellings For 5+ Families F) Non-occupant Loans on Number Average Value Number Average Value Number Average Value Number Average Value Number Average Value Number Average Value
LOANS ORIGINATED 37 $109,729 122 $92,977 209 $90,573 14 $23,916 4 $626,068 60 $86,881 APPLICATIONS APPROVED, NOT ACCEPTED 3 $88,247 12 $89,753 27 $91,297 5 $22,690 1 $2,774,730 6 $67,982 APPLICATIONS DENIED 5 $89,806 22 $87,134 103 $85,937 11 $32,697 0 $0 12 $79,232 APPLICATIONS WITHDRAWN 3 $110,130 16 $120,889 78 $96,940 7 $33,466 1 $695,000 5 $106,164 FILES CLOSED FOR INCOMPLETENESS 1 $97,190 1 $78,820 18 $92,717 1 $25,250 1 $2,066,930 3 $76,060
Aggregated Statistics For Year 2001(Based on 3 partial tracts) A) FHA, FSA/RHS & VA B) Conventional C) Refinancings D) Home Improvement Loans E) Loans on Dwellings For 5+ Families F) Non-occupant Loans on Number Average Value Number Average Value Number Average Value Number Average Value Number Average Value Number Average Value
LOANS ORIGINATED 47 $96,191 81 $81,780 129 $80,238 12 $30,516 1 $278,510 42 $68,751 APPLICATIONS APPROVED, NOT ACCEPTED 3 $84,200 10 $65,262 20 $82,370 1 $29,290 0 $0 4 $77,692 APPLICATIONS DENIED 8 $75,601 25 $57,749 87 $77,687 11 $27,224 1 $4,098,220 13 $61,130 APPLICATIONS WITHDRAWN 1 $60,900 8 $86,454 63 $88,606 7 $38,710 0 $0 5 $88,230 FILES CLOSED FOR INCOMPLETENESS 0 $0 1 $49,070 6 $83,548 1 $11,140 0 $0 0 $0
Aggregated Statistics For Year 2000(Based on 3 partial tracts) A) FHA, FSA/RHS & VA B) Conventional C) Refinancings D) Home Improvement Loans E) Loans on Dwellings For 5+ Families F) Non-occupant Loans on Number Average Value Number Average Value Number Average Value Number Average Value Number Average Value Number Average Value
LOANS ORIGINATED 45 $86,473 62 $72,909 53 $57,927 8 $17,292 3 $414,700 21 $61,478 APPLICATIONS APPROVED, NOT ACCEPTED 3 $91,353 10 $97,483 12 $60,028 8 $31,748 0 $0 1 $117,540 APPLICATIONS DENIED 3 $83,610 31 $74,014 51 $55,806 18 $34,644 0 $0 7 $56,157 APPLICATIONS WITHDRAWN 8 $86,085 14 $67,907 18 $62,007 3 $16,763 0 $0 6 $60,328 FILES CLOSED FOR INCOMPLETENESS 1 $81,570 1 $89,640 6 $78,505 0 $0 0 $0 1 $25,170
Aggregated Statistics For Year 1999(Based on 3 partial tracts) A) FHA, FSA/RHS & VA B) Conventional C) Refinancings D) Home Improvement Loans E) Loans on Dwellings For 5+ Families F) Non-occupant Loans on Number Average Value Number Average Value Number Average Value Number Average Value Number Average Value Number Average Value
LOANS ORIGINATED 58 $76,111 48 $63,364 68 $71,288 11 $22,175 1 $99,640 23 $52,080 APPLICATIONS APPROVED, NOT ACCEPTED 6 $79,767 6 $38,472 20 $64,440 3 $28,037 0 $0 3 $94,337 APPLICATIONS DENIED 4 $75,995 15 $57,151 60 $65,495 5 $16,848 0 $0 5 $65,826 APPLICATIONS WITHDRAWN 5 $67,234 10 $96,120 32 $73,554 0 $0 1 $868,400 3 $82,617 FILES CLOSED FOR INCOMPLETENESS 2 $74,320 0 $0 10 $73,058 1 $13,770 0 $0 1 $86,840
Detailed HMDA statistics for the following Tracts:
0401.00
, 0402.00 , 0410.00
Private Mortgage Insurance Companies Aggregated Statistics For Year 2009(Based on 3 partial tracts) A) Conventional B) Refinancings C) Non-occupant Loans on Number Average Value Number Average Value Number Average Value
LOANS ORIGINATED 2 $121,900 1 $51,600 0 $0 APPLICATIONS APPROVED, NOT ACCEPTED 0 $0 0 $0 0 $0 APPLICATIONS DENIED 0 $0 0 $0 0 $0 APPLICATIONS WITHDRAWN 0 $0 0 $0 0 $0 FILES CLOSED FOR INCOMPLETENESS 1 $52,730 0 $0 1 $52,730
Aggregated Statistics For Year 2007(Based on 3 partial tracts) A) Conventional B) Refinancings C) Non-occupant Loans on Number Average Value Number Average Value Number Average Value
LOANS ORIGINATED 15 $184,927 10 $204,692 2 $124,585 APPLICATIONS APPROVED, NOT ACCEPTED 4 $226,180 4 $189,880 0 $0 APPLICATIONS DENIED 2 $213,895 1 $121,060 0 $0 APPLICATIONS WITHDRAWN 2 $227,085 1 $135,910 0 $0 FILES CLOSED FOR INCOMPLETENESS 0 $0 0 $0 0 $0
Aggregated Statistics For Year 2006(Based on 3 partial tracts) A) Conventional B) Refinancings C) Non-occupant Loans on Number Average Value Number Average Value Number Average Value
LOANS ORIGINATED 4 $203,088 7 $232,800 1 $127,980 APPLICATIONS APPROVED, NOT ACCEPTED 1 $409,450 1 $368,670 0 $0 APPLICATIONS DENIED 0 $0 0 $0 0 $0 APPLICATIONS WITHDRAWN 0 $0 0 $0 0 $0 FILES CLOSED FOR INCOMPLETENESS 0 $0 0 $0 0 $0
Aggregated Statistics For Year 2005(Based on 3 partial tracts) A) Conventional B) Refinancings C) Non-occupant Loans on Number Average Value Number Average Value Number Average Value
LOANS ORIGINATED 6 $166,535 9 $180,162 2 $167,120 APPLICATIONS APPROVED, NOT ACCEPTED 1 $219,180 3 $151,617 1 $133,570 APPLICATIONS DENIED 0 $0 0 $0 0 $0 APPLICATIONS WITHDRAWN 1 $119,030 0 $0 1 $118,040 FILES CLOSED FOR INCOMPLETENESS 0 $0 0 $0 0 $0
Aggregated Statistics For Year 2004(Based on 3 partial tracts) A) Conventional B) Refinancings C) Non-occupant Loans on Number Average Value Number Average Value Number Average Value
LOANS ORIGINATED 26 $150,946 8 $153,115 9 $147,841 APPLICATIONS APPROVED, NOT ACCEPTED 9 $152,136 3 $106,870 3 $148,833 APPLICATIONS DENIED 2 $170,080 0 $0 2 $170,080 APPLICATIONS WITHDRAWN 1 $173,790 1 $74,660 1 $95,810 FILES CLOSED FOR INCOMPLETENESS 0 $0 0 $0 0 $0
Aggregated Statistics For Year 2003(Based on 3 partial tracts) A) Conventional B) Refinancings C) Non-occupant Loans on Number Average Value Number Average Value Number Average Value
LOANS ORIGINATED 64 $135,942 22 $124,818 11 $123,973 APPLICATIONS APPROVED, NOT ACCEPTED 7 $114,316 6 $116,393 3 $91,423 APPLICATIONS DENIED 0 $0 0 $0 0 $0 APPLICATIONS WITHDRAWN 1 $178,990 4 $196,175 0 $0 FILES CLOSED FOR INCOMPLETENESS 0 $0 0 $0 0 $0
Aggregated Statistics For Year 2002(Based on 3 partial tracts) A) Conventional B) Refinancings C) Non-occupant Loans on Number Average Value Number Average Value Number Average Value
LOANS ORIGINATED 46 $108,857 28 $112,466 12 $100,518 APPLICATIONS APPROVED, NOT ACCEPTED 6 $100,822 4 $105,428 2 $73,340 APPLICATIONS DENIED 0 $0 1 $57,930 0 $0 APPLICATIONS WITHDRAWN 0 $0 1 $112,010 1 $47,530 FILES CLOSED FOR INCOMPLETENESS 0 $0 0 $0 0 $0
Aggregated Statistics For Year 2001(Based on 3 partial tracts) A) Conventional B) Refinancings C) Non-occupant Loans on Number Average Value Number Average Value Number Average Value
LOANS ORIGINATED 28 $101,886 14 $90,484 6 $69,315 APPLICATIONS APPROVED, NOT ACCEPTED 3 $67,407 3 $81,647 1 $128,060 APPLICATIONS DENIED 0 $0 1 $66,340 0 $0 APPLICATIONS WITHDRAWN 1 $124,770 0 $0 1 $45,300 FILES CLOSED FOR INCOMPLETENESS 1 $59,250 0 $0 0 $0
Aggregated Statistics For Year 2000(Based on 3 partial tracts) A) Conventional B) Refinancings C) Non-occupant Loans on Number Average Value Number Average Value Number Average Value
LOANS ORIGINATED 19 $77,585 4 $78,278 5 $83,088 APPLICATIONS APPROVED, NOT ACCEPTED 3 $80,047 1 $68,280 1 $80,500 APPLICATIONS DENIED 0 $0 0 $0 0 $0 APPLICATIONS WITHDRAWN 1 $36,390 0 $0 0 $0 FILES CLOSED FOR INCOMPLETENESS 0 $0 0 $0 0 $0
Aggregated Statistics For Year 1999(Based on 3 partial tracts) A) Conventional B) Refinancings C) Non-occupant Loans on Number Average Value Number Average Value Number Average Value
LOANS ORIGINATED 19 $73,590 9 $89,827 3 $38,023 APPLICATIONS APPROVED, NOT ACCEPTED 1 $74,460 1 $139,790 0 $0 APPLICATIONS DENIED 2 $80,815 0 $0 0 $0 APPLICATIONS WITHDRAWN 1 $44,670 1 $41,920 0 $0 FILES CLOSED FOR INCOMPLETENESS 1 $72,840 0 $0 0 $0
Detailed PMIC statistics for the following Tracts:
0401.00
, 0402.00 , 0410.00 Fire-safe hotels and motels in Marysville, California:
Baymont Inn & Suites, 1111 N Beale Rd, Marysville, California 95901 Phone: (530) 742-2700, Fax: (530) 742-2733
Comfort Suites, 1034 N Beale Rd, Marysville, California 95901 Phone: (530) 742-9200, Fax: (530) 742-9500
Americas Best Value Inn, 721 10 th St, Marysville, California 95901 Phone: (530) 742-8586, Fax: (530) 742-0132
Rio Inn And Suites, 899 N Beale Rd, Marysville, California 95901 Phone: (530) 749-8344, Fax: (530) 749-2686
Motel 6 Marysville, 803 E St, Marysville, California 95901 Phone: (530) 743-5465, Fax: (530) 741-0252
All 5 fire-safe hotels and motels in Marysville, California Marysville compared to California state average:
Median household income below state average. Median house value below state average. Black race population percentage significantly below state average. Foreign-born population percentage below state average. Length of stay since moving in significantly above state average. House age above state average. Institutionalized population percentage significantly above state average. Percentage of population with a bachelor's degree or higher below state average. Marysville on our top lists :
#59 on the list of "Top 101 cities with the largest percentage of people in short-term care, detention or diagnostic centers for delinquent children (population 1,000+)"
#63 on the list of "Top 101 cities with the highest number of arson incidents per 100,000 residents, excludes tourist destinations and others with a lot of outsiders visiting based on city industries data (population 5,000+)"
#89 on the list of "Top 101 cities with largest percentage of females in industries: health care and social assistance (population 5,000+)"
#30 on the list of "Top 101 counties with the highest percentage of residents relocating to other counties in 2011 (pop. 50,000+)"
#33 on the list of "Top 101 counties with the highest percentage of residents relocating from foreign countries between 2010 and 2011 (pop. 50,000+)"
#34 on the list of "Top 101 counties with the highest percentage of residents relocating to foreign countries in 2011 (pop. 50,000+)"
#35 on the list of "Top 101 counties with highest percentage of residents voting for 3rd party candidates in the 2012 Presidential Election (pop. 50,000+)"
#40 on the list of "Top 101 counties with the lowest surface withdrawal of fresh water for public supply (pop. 50,000+)"
Top Patent Applicants
Chester Whiseant (3)
Thomas Ambler Rice (2)
Obed Patty (2)
Pablo Medina (1)
Gerald P. Coleman (1)
Matthew R. Younce, Sr. (1)
Robert M. Ledford (1)
Kelby Simison (1)
Lance Smith (1)
Carmel Jerry Ramsey (1)
Total of 17 patent applications in 2008-2024.
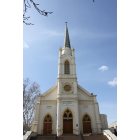
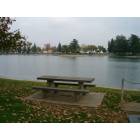


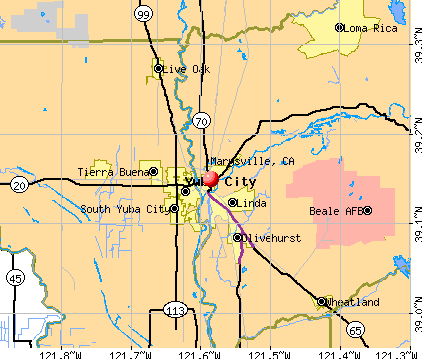


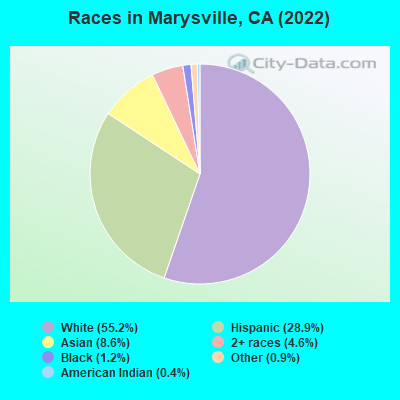
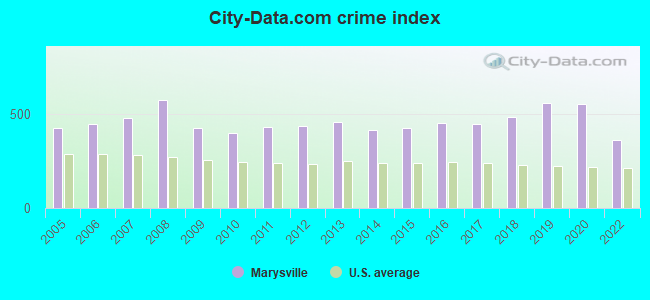
 Recent articles from our blog. Our writers, many of them Ph.D. graduates or candidates, create easy-to-read articles on a wide variety of topics.


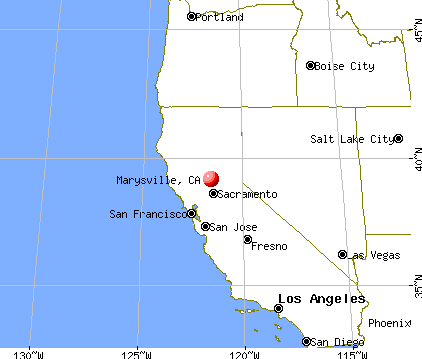
 (31.7 miles
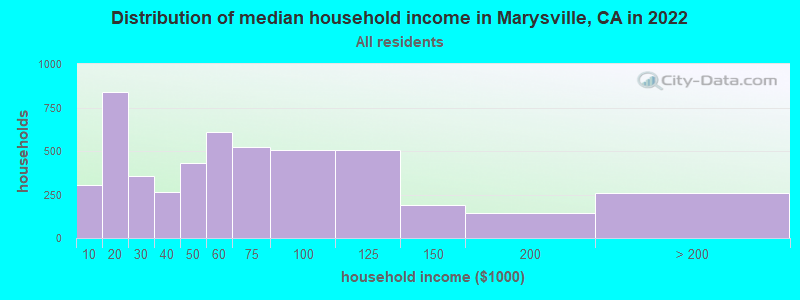
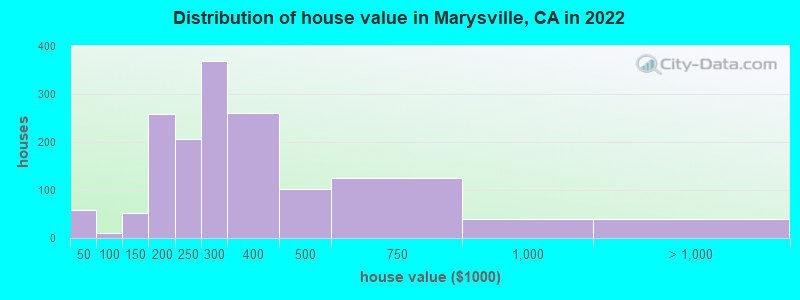
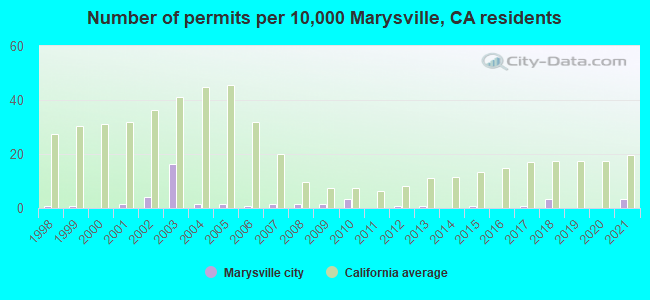
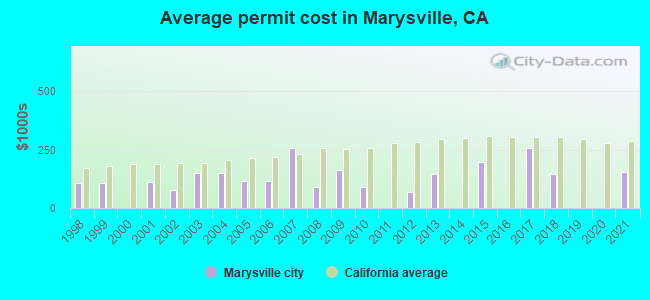
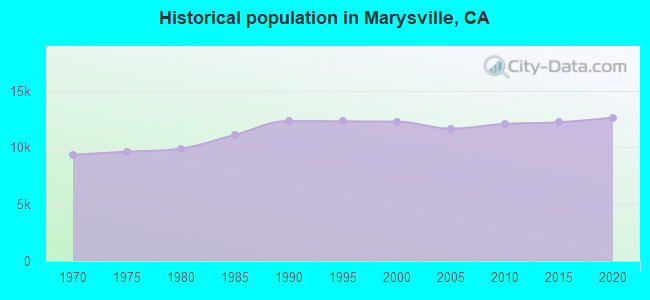
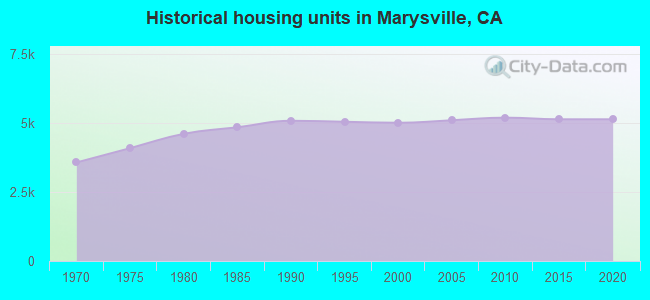
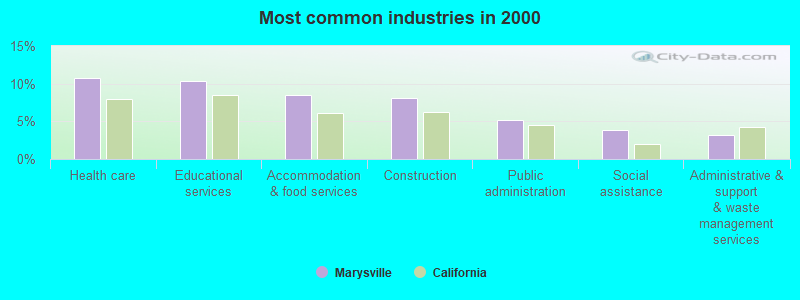
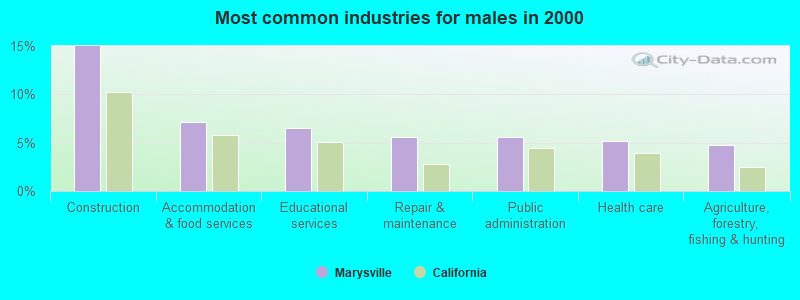
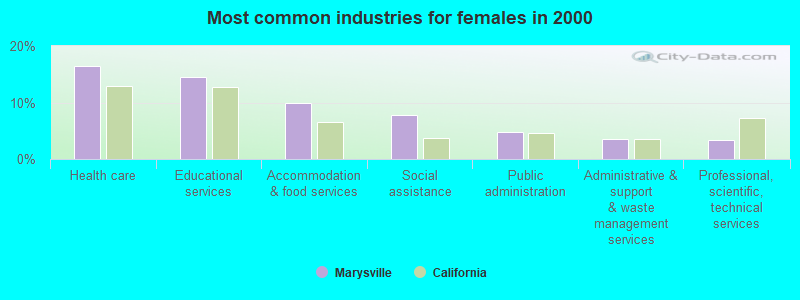
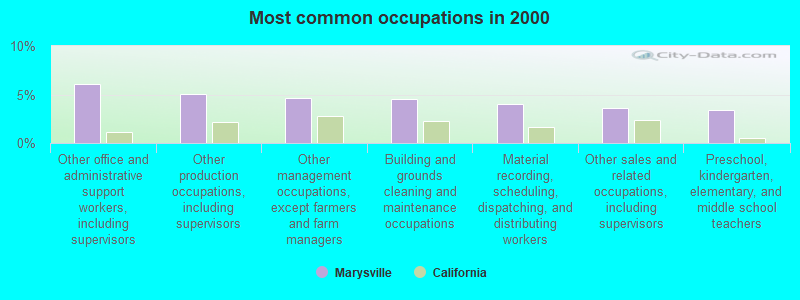
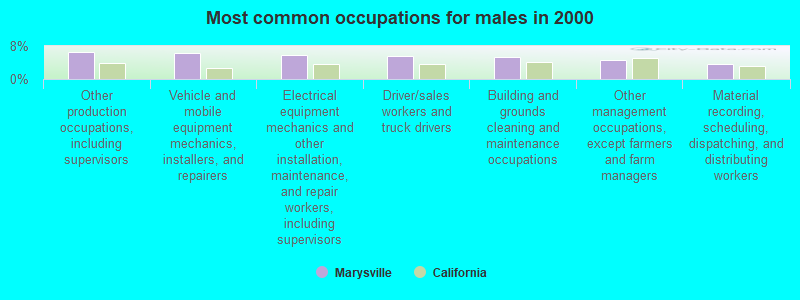
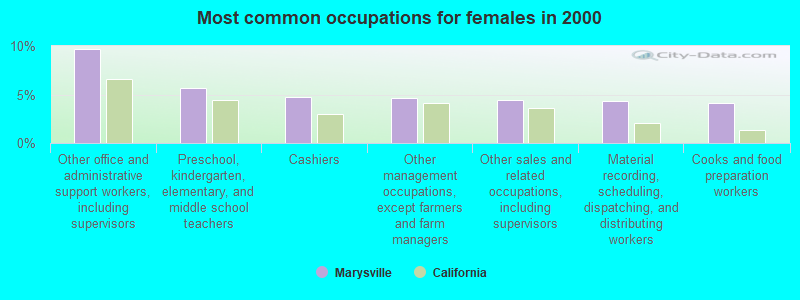


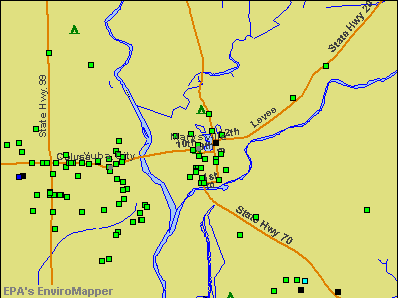

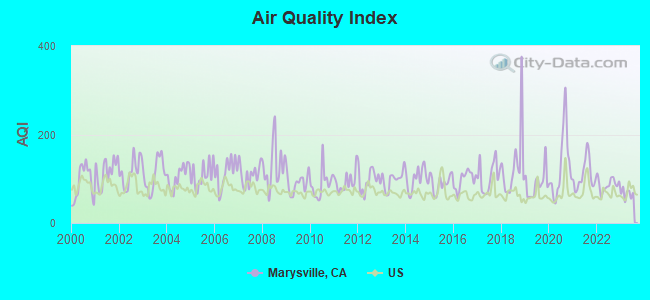
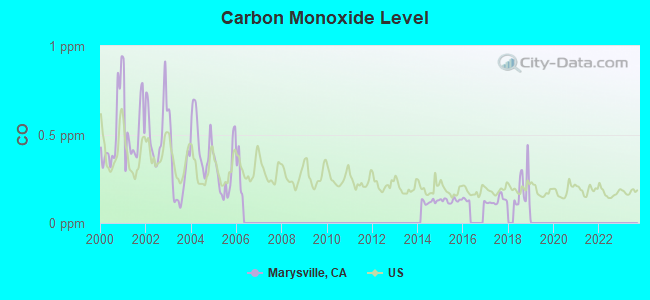
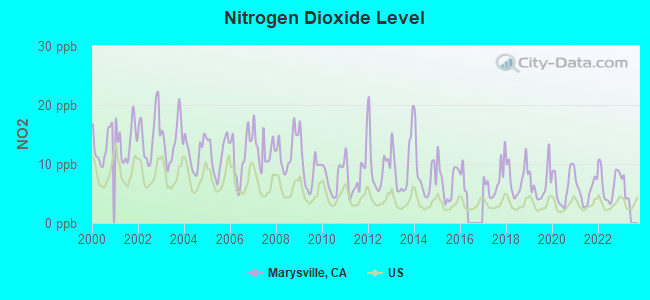
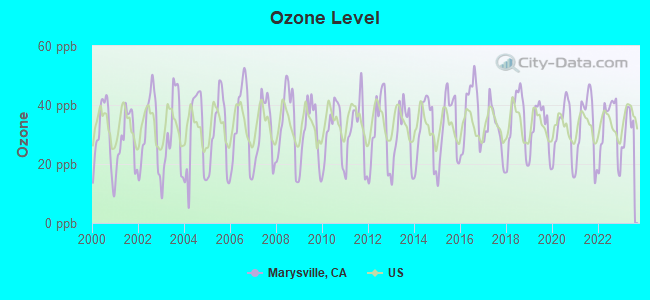
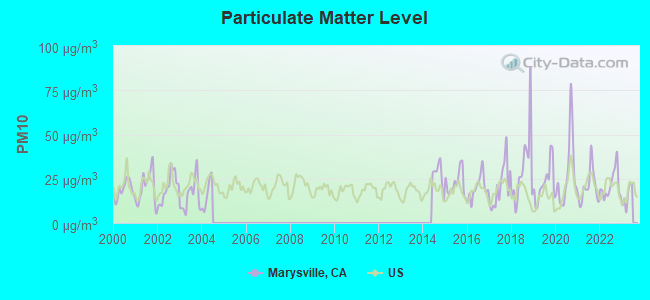
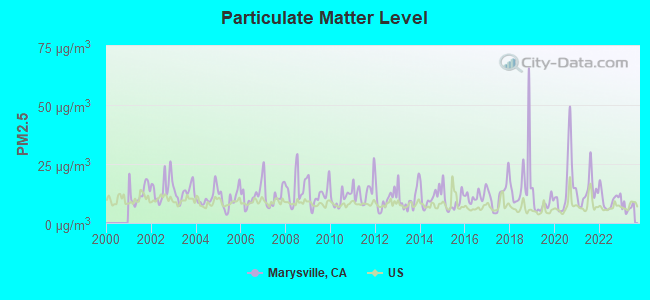
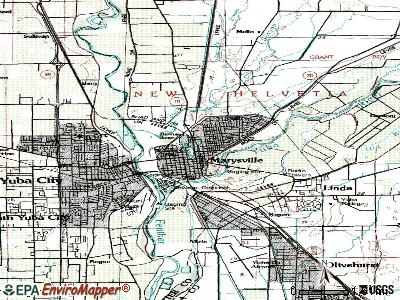
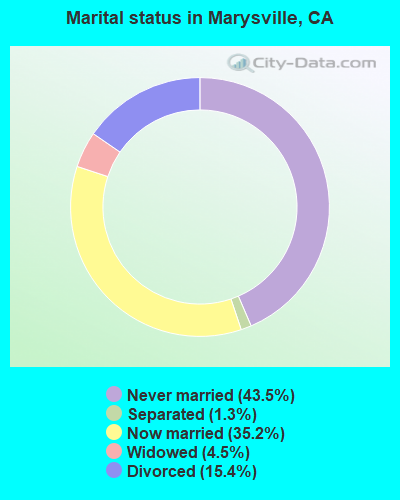
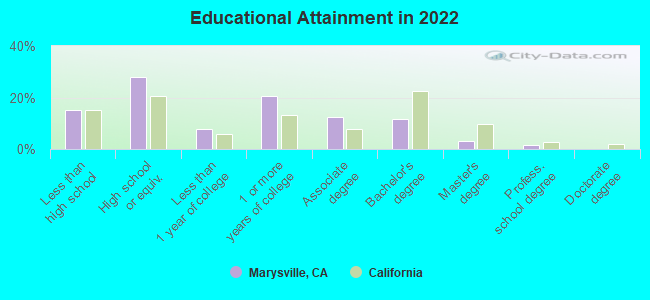
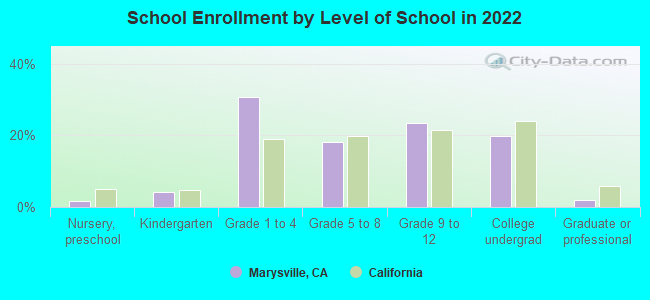
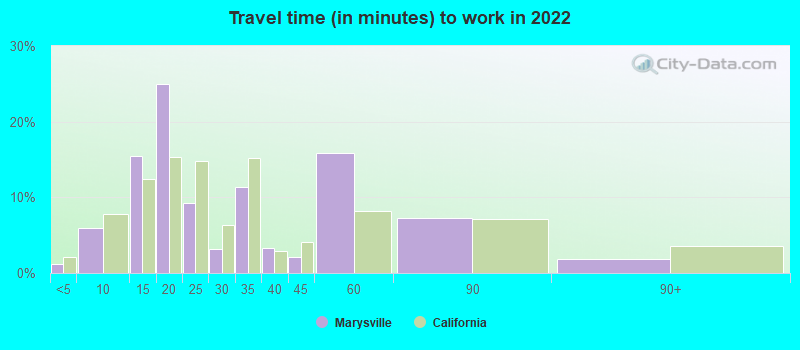
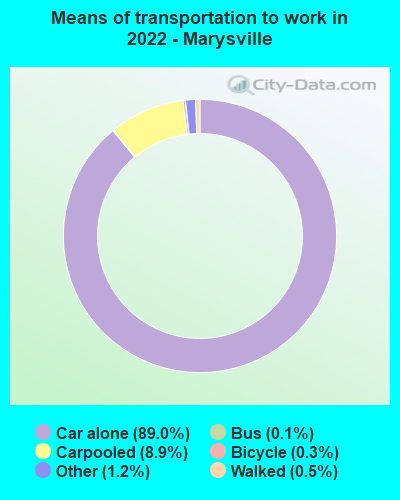
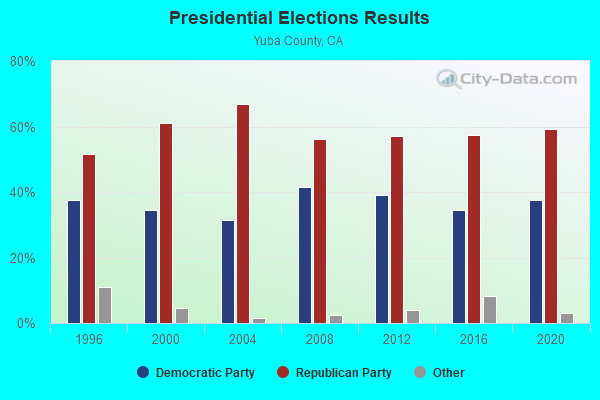
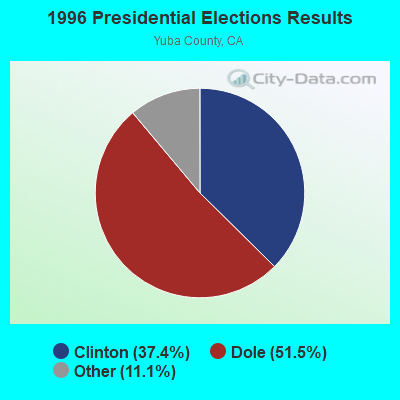
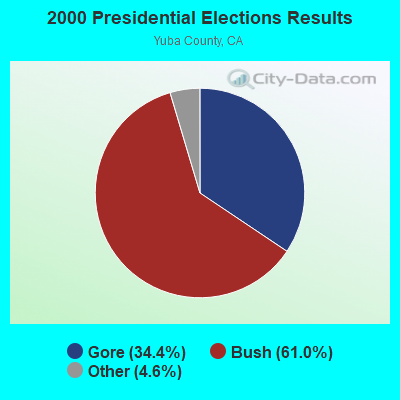
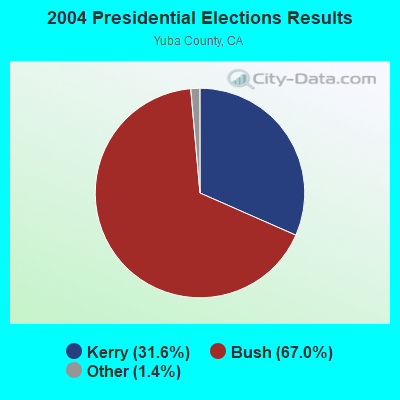
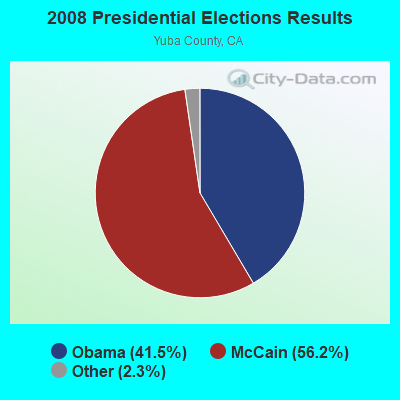
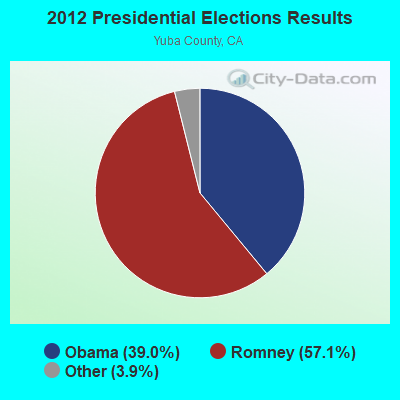
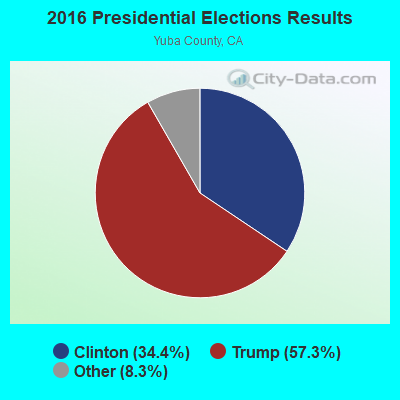
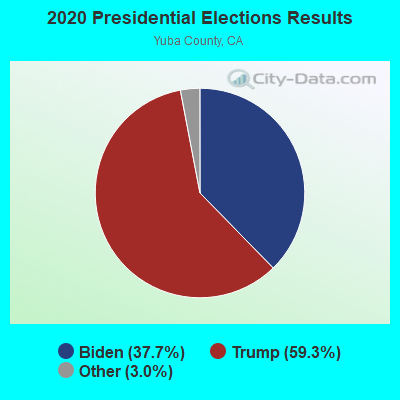
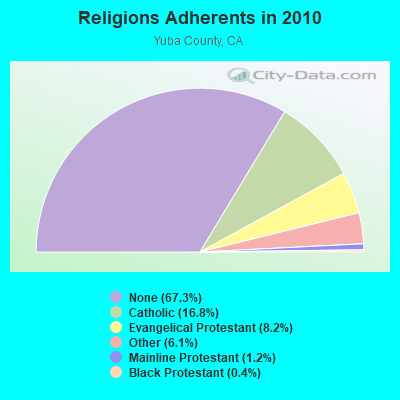
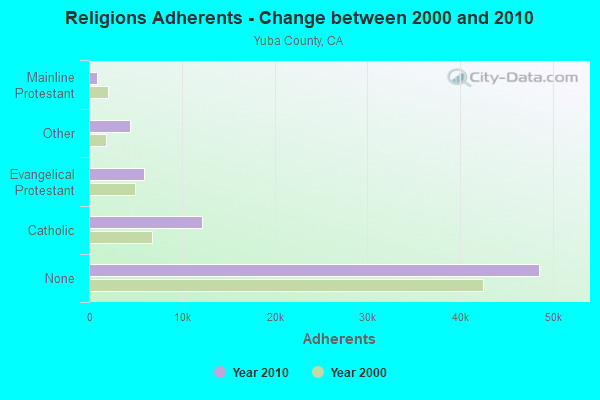
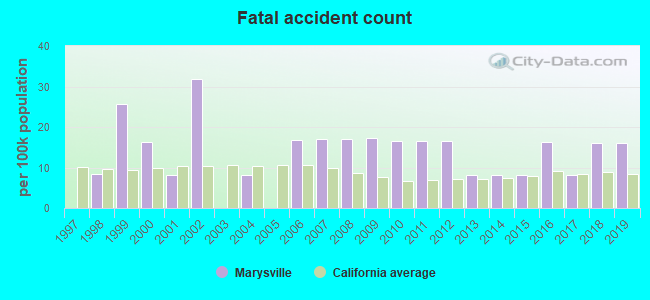
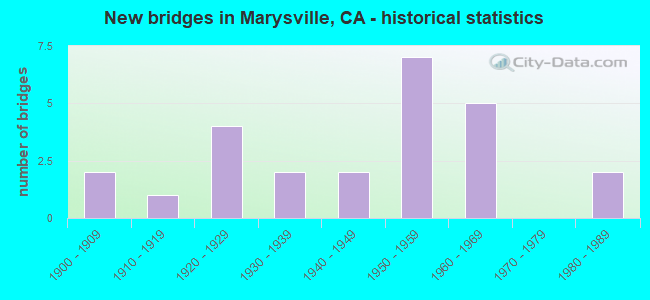
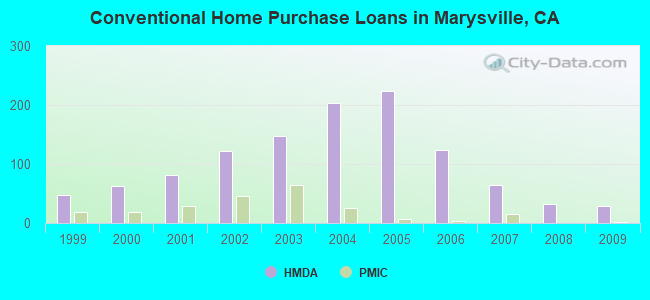
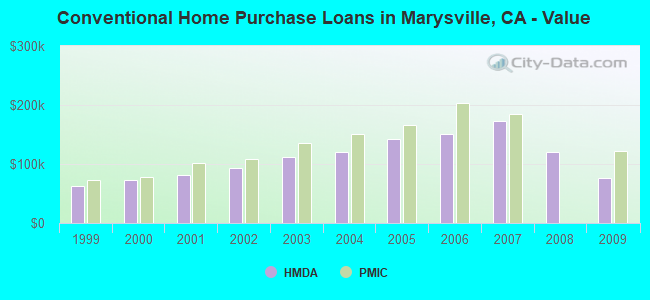
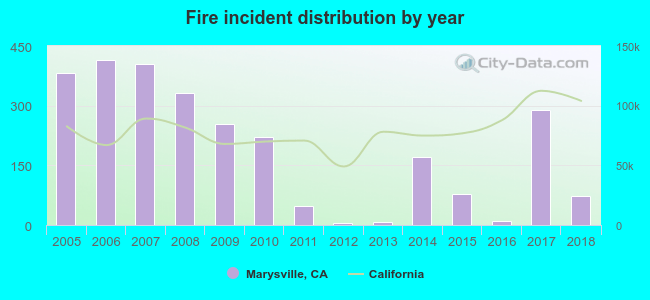 Based on the data from the years 2005 - 2018 the average number of fires per year is 192. The highest number of fire incidents - 415 took place in 2006, and the least - 6 in 2012. The data has a dropping trend.
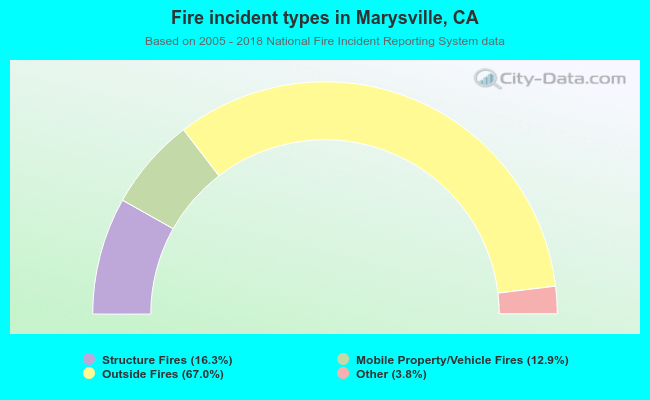 When looking into fire subcategories, the most reports belonged to: Outside Fires (67.0%), and Structure Fires (16.3%).