Mason, Ohio Submit your own pictures of this city and show them to the world
OSM Map
General Map
Google Map
MSN Map
OSM Map
General Map
Google Map
MSN Map
OSM Map
General Map
Google Map
MSN Map
OSM Map
General Map
Google Map
MSN Map
Please wait while loading the map...
Population in 2022: 35,520 (100% urban, 0% rural). Population change since 2000: +61.3%Males: 17,851 Females: 17,669
March 2022 cost of living index in Mason: 90.6 (less than average, U.S. average is 100) Percentage of residents living in poverty in 2022: 3.8%for White Non-Hispanic residents , 3.2% for Black residents , 2.4% for Hispanic or Latino residents , 9.4% for other race residents , 4.0% for two or more races residents )
Profiles of local businesses
Business Search - 14 Million verified businesses
Data:
Median household income ($)
Median household income (% change since 2000)
Household income diversity
Ratio of average income to average house value (%)
Ratio of average income to average rent
Median household income ($) - White
Median household income ($) - Black or African American
Median household income ($) - Asian
Median household income ($) - Hispanic or Latino
Median household income ($) - American Indian and Alaska Native
Median household income ($) - Multirace
Median household income ($) - Other Race
Median household income for houses/condos with a mortgage ($)
Median household income for apartments without a mortgage ($)
Races - White alone (%)
Races - White alone (% change since 2000)
Races - Black alone (%)
Races - Black alone (% change since 2000)
Races - American Indian alone (%)
Races - American Indian alone (% change since 2000)
Races - Asian alone (%)
Races - Asian alone (% change since 2000)
Races - Hispanic (%)
Races - Hispanic (% change since 2000)
Races - Native Hawaiian and Other Pacific Islander alone (%)
Races - Native Hawaiian and Other Pacific Islander alone (% change since 2000)
Races - Two or more races (%)
Races - Two or more races (% change since 2000)
Races - Other race alone (%)
Races - Other race alone (% change since 2000)
Racial diversity
Unemployment (%)
Unemployment (% change since 2000)
Unemployment (%) - White
Unemployment (%) - Black or African American
Unemployment (%) - Asian
Unemployment (%) - Hispanic or Latino
Unemployment (%) - American Indian and Alaska Native
Unemployment (%) - Multirace
Unemployment (%) - Other Race
Population density (people per square mile)
Population - Males (%)
Population - Females (%)
Population - Males (%) - White
Population - Males (%) - Black or African American
Population - Males (%) - Asian
Population - Males (%) - Hispanic or Latino
Population - Males (%) - American Indian and Alaska Native
Population - Males (%) - Multirace
Population - Males (%) - Other Race
Population - Females (%) - White
Population - Females (%) - Black or African American
Population - Females (%) - Asian
Population - Females (%) - Hispanic or Latino
Population - Females (%) - American Indian and Alaska Native
Population - Females (%) - Multirace
Population - Females (%) - Other Race
Coronavirus confirmed cases (Apr 25, 2024)
Deaths caused by coronavirus (Apr 25, 2024)
Coronavirus confirmed cases (per 100k population) (Apr 25, 2024)
Deaths caused by coronavirus (per 100k population) (Apr 25, 2024)
Daily increase in number of cases (Apr 25, 2024)
Weekly increase in number of cases (Apr 25, 2024)
Cases doubled (in days) (Apr 25, 2024)
Hospitalized patients (Apr 18, 2022)
Negative test results (Apr 18, 2022)
Total test results (Apr 18, 2022)
COVID Vaccine doses distributed (per 100k population) (Sep 19, 2023)
COVID Vaccine doses administered (per 100k population) (Sep 19, 2023)
COVID Vaccine doses distributed (Sep 19, 2023)
COVID Vaccine doses administered (Sep 19, 2023)
Likely homosexual households (%)
Likely homosexual households (% change since 2000)
Likely homosexual households - Lesbian couples (%)
Likely homosexual households - Lesbian couples (% change since 2000)
Likely homosexual households - Gay men (%)
Likely homosexual households - Gay men (% change since 2000)
Cost of living index
Median gross rent ($)
Median contract rent ($)
Median monthly housing costs ($)
Median house or condo value ($)
Median house or condo value ($ change since 2000)
Mean house or condo value by units in structure - 1, detached ($)
Mean house or condo value by units in structure - 1, attached ($)
Mean house or condo value by units in structure - 2 ($)
Mean house or condo value by units in structure by units in structure - 3 or 4 ($)
Mean house or condo value by units in structure - 5 or more ($)
Mean house or condo value by units in structure - Boat, RV, van, etc. ($)
Mean house or condo value by units in structure - Mobile home ($)
Median house or condo value ($) - White
Median house or condo value ($) - Black or African American
Median house or condo value ($) - Asian
Median house or condo value ($) - Hispanic or Latino
Median house or condo value ($) - American Indian and Alaska Native
Median house or condo value ($) - Multirace
Median house or condo value ($) - Other Race
Median resident age
Resident age diversity
Median resident age - Males
Median resident age - Females
Median resident age - White
Median resident age - Black or African American
Median resident age - Asian
Median resident age - Hispanic or Latino
Median resident age - American Indian and Alaska Native
Median resident age - Multirace
Median resident age - Other Race
Median resident age - Males - White
Median resident age - Males - Black or African American
Median resident age - Males - Asian
Median resident age - Males - Hispanic or Latino
Median resident age - Males - American Indian and Alaska Native
Median resident age - Males - Multirace
Median resident age - Males - Other Race
Median resident age - Females - White
Median resident age - Females - Black or African American
Median resident age - Females - Asian
Median resident age - Females - Hispanic or Latino
Median resident age - Females - American Indian and Alaska Native
Median resident age - Females - Multirace
Median resident age - Females - Other Race
Commute - mean travel time to work (minutes)
Travel time to work - Less than 5 minutes (%)
Travel time to work - Less than 5 minutes (% change since 2000)
Travel time to work - 5 to 9 minutes (%)
Travel time to work - 5 to 9 minutes (% change since 2000)
Travel time to work - 10 to 19 minutes (%)
Travel time to work - 10 to 19 minutes (% change since 2000)
Travel time to work - 20 to 29 minutes (%)
Travel time to work - 20 to 29 minutes (% change since 2000)
Travel time to work - 30 to 39 minutes (%)
Travel time to work - 30 to 39 minutes (% change since 2000)
Travel time to work - 40 to 59 minutes (%)
Travel time to work - 40 to 59 minutes (% change since 2000)
Travel time to work - 60 to 89 minutes (%)
Travel time to work - 60 to 89 minutes (% change since 2000)
Travel time to work - 90 or more minutes (%)
Travel time to work - 90 or more minutes (% change since 2000)
Marital status - Never married (%)
Marital status - Now married (%)
Marital status - Separated (%)
Marital status - Widowed (%)
Marital status - Divorced (%)
Median family income ($)
Median family income (% change since 2000)
Median non-family income ($)
Median non-family income (% change since 2000)
Median per capita income ($)
Median per capita income (% change since 2000)
Median family income ($) - White
Median family income ($) - Black or African American
Median family income ($) - Asian
Median family income ($) - Hispanic or Latino
Median family income ($) - American Indian and Alaska Native
Median family income ($) - Multirace
Median family income ($) - Other Race
Median year house/condo built
Median year apartment built
Year house built - Built 2005 or later (%)
Year house built - Built 2000 to 2004 (%)
Year house built - Built 1990 to 1999 (%)
Year house built - Built 1980 to 1989 (%)
Year house built - Built 1970 to 1979 (%)
Year house built - Built 1960 to 1969 (%)
Year house built - Built 1950 to 1959 (%)
Year house built - Built 1940 to 1949 (%)
Year house built - Built 1939 or earlier (%)
Average household size
Household density (households per square mile)
Average household size - White
Average household size - Black or African American
Average household size - Asian
Average household size - Hispanic or Latino
Average household size - American Indian and Alaska Native
Average household size - Multirace
Average household size - Other Race
Occupied housing units (%)
Vacant housing units (%)
Owner occupied housing units (%)
Renter occupied housing units (%)
Vacancy status - For rent (%)
Vacancy status - For sale only (%)
Vacancy status - Rented or sold, not occupied (%)
Vacancy status - For seasonal, recreational, or occasional use (%)
Vacancy status - For migrant workers (%)
Vacancy status - Other vacant (%)
Residents with income below the poverty level (%)
Residents with income below 50% of the poverty level (%)
Children below poverty level (%)
Poor families by family type - Married-couple family (%)
Poor families by family type - Male, no wife present (%)
Poor families by family type - Female, no husband present (%)
Poverty status for native-born residents (%)
Poverty status for foreign-born residents (%)
Poverty among high school graduates not in families (%)
Poverty among people who did not graduate high school not in families (%)
Residents with income below the poverty level (%) - White
Residents with income below the poverty level (%) - Black or African American
Residents with income below the poverty level (%) - Asian
Residents with income below the poverty level (%) - Hispanic or Latino
Residents with income below the poverty level (%) - American Indian and Alaska Native
Residents with income below the poverty level (%) - Multirace
Residents with income below the poverty level (%) - Other Race
Air pollution - Air Quality Index (AQI)
Air pollution - CO
Air pollution - NO2
Air pollution - SO2
Air pollution - Ozone
Air pollution - PM10
Air pollution - PM25
Air pollution - Pb
Crime - Murders per 100,000 population
Crime - Rapes per 100,000 population
Crime - Robberies per 100,000 population
Crime - Assaults per 100,000 population
Crime - Burglaries per 100,000 population
Crime - Thefts per 100,000 population
Crime - Auto thefts per 100,000 population
Crime - Arson per 100,000 population
Crime - City-data.com crime index
Crime - Violent crime index
Crime - Property crime index
Crime - Murders per 100,000 population (5 year average)
Crime - Rapes per 100,000 population (5 year average)
Crime - Robberies per 100,000 population (5 year average)
Crime - Assaults per 100,000 population (5 year average)
Crime - Burglaries per 100,000 population (5 year average)
Crime - Thefts per 100,000 population (5 year average)
Crime - Auto thefts per 100,000 population (5 year average)
Crime - Arson per 100,000 population (5 year average)
Crime - City-data.com crime index (5 year average)
Crime - Violent crime index (5 year average)
Crime - Property crime index (5 year average)
1996 Presidential Elections Results (%) - Democratic Party (Clinton)
1996 Presidential Elections Results (%) - Republican Party (Dole)
1996 Presidential Elections Results (%) - Other
2000 Presidential Elections Results (%) - Democratic Party (Gore)
2000 Presidential Elections Results (%) - Republican Party (Bush)
2000 Presidential Elections Results (%) - Other
2004 Presidential Elections Results (%) - Democratic Party (Kerry)
2004 Presidential Elections Results (%) - Republican Party (Bush)
2004 Presidential Elections Results (%) - Other
2008 Presidential Elections Results (%) - Democratic Party (Obama)
2008 Presidential Elections Results (%) - Republican Party (McCain)
2008 Presidential Elections Results (%) - Other
2012 Presidential Elections Results (%) - Democratic Party (Obama)
2012 Presidential Elections Results (%) - Republican Party (Romney)
2012 Presidential Elections Results (%) - Other
2016 Presidential Elections Results (%) - Democratic Party (Clinton)
2016 Presidential Elections Results (%) - Republican Party (Trump)
2016 Presidential Elections Results (%) - Other
2020 Presidential Elections Results (%) - Democratic Party (Biden)
2020 Presidential Elections Results (%) - Republican Party (Trump)
2020 Presidential Elections Results (%) - Other
Ancestries Reported - Arab (%)
Ancestries Reported - Czech (%)
Ancestries Reported - Danish (%)
Ancestries Reported - Dutch (%)
Ancestries Reported - English (%)
Ancestries Reported - French (%)
Ancestries Reported - French Canadian (%)
Ancestries Reported - German (%)
Ancestries Reported - Greek (%)
Ancestries Reported - Hungarian (%)
Ancestries Reported - Irish (%)
Ancestries Reported - Italian (%)
Ancestries Reported - Lithuanian (%)
Ancestries Reported - Norwegian (%)
Ancestries Reported - Polish (%)
Ancestries Reported - Portuguese (%)
Ancestries Reported - Russian (%)
Ancestries Reported - Scotch-Irish (%)
Ancestries Reported - Scottish (%)
Ancestries Reported - Slovak (%)
Ancestries Reported - Subsaharan African (%)
Ancestries Reported - Swedish (%)
Ancestries Reported - Swiss (%)
Ancestries Reported - Ukrainian (%)
Ancestries Reported - United States (%)
Ancestries Reported - Welsh (%)
Ancestries Reported - West Indian (%)
Ancestries Reported - Other (%)
Educational Attainment - No schooling completed (%)
Educational Attainment - Less than high school (%)
Educational Attainment - High school or equivalent (%)
Educational Attainment - Less than 1 year of college (%)
Educational Attainment - 1 or more years of college (%)
Educational Attainment - Associate degree (%)
Educational Attainment - Bachelor's degree (%)
Educational Attainment - Master's degree (%)
Educational Attainment - Professional school degree (%)
Educational Attainment - Doctorate degree (%)
School Enrollment - Nursery, preschool (%)
School Enrollment - Kindergarten (%)
School Enrollment - Grade 1 to 4 (%)
School Enrollment - Grade 5 to 8 (%)
School Enrollment - Grade 9 to 12 (%)
School Enrollment - College undergrad (%)
School Enrollment - Graduate or professional (%)
School Enrollment - Not enrolled in school (%)
School enrollment - Public schools (%)
School enrollment - Private schools (%)
School enrollment - Not enrolled (%)
Median number of rooms in houses and condos
Median number of rooms in apartments
Housing units lacking complete plumbing facilities (%)
Housing units lacking complete kitchen facilities (%)
Density of houses
Urban houses (%)
Rural houses (%)
Households with people 60 years and over (%)
Households with people 65 years and over (%)
Households with people 75 years and over (%)
Households with one or more nonrelatives (%)
Households with no nonrelatives (%)
Population in households (%)
Family households (%)
Nonfamily households (%)
Population in families (%)
Family households with own children (%)
Median number of bedrooms in owner occupied houses
Mean number of bedrooms in owner occupied houses
Median number of bedrooms in renter occupied houses
Mean number of bedrooms in renter occupied houses
Median number of vehichles in owner occupied houses
Mean number of vehichles in owner occupied houses
Median number of vehichles in renter occupied houses
Mean number of vehichles in renter occupied houses
Mortgage status - with mortgage (%)
Mortgage status - with second mortgage (%)
Mortgage status - with home equity loan (%)
Mortgage status - with both second mortgage and home equity loan (%)
Mortgage status - without a mortgage (%)
Average family size
Average family size - White
Average family size - Black or African American
Average family size - Asian
Average family size - Hispanic or Latino
Average family size - American Indian and Alaska Native
Average family size - Multirace
Average family size - Other Race
Geographical mobility - Same house 1 year ago (%)
Geographical mobility - Moved within same county (%)
Geographical mobility - Moved from different county within same state (%)
Geographical mobility - Moved from different state (%)
Geographical mobility - Moved from abroad (%)
Place of birth - Born in state of residence (%)
Place of birth - Born in other state (%)
Place of birth - Native, outside of US (%)
Place of birth - Foreign born (%)
Housing units in structures - 1, detached (%)
Housing units in structures - 1, attached (%)
Housing units in structures - 2 (%)
Housing units in structures - 3 or 4 (%)
Housing units in structures - 5 to 9 (%)
Housing units in structures - 10 to 19 (%)
Housing units in structures - 20 to 49 (%)
Housing units in structures - 50 or more (%)
Housing units in structures - Mobile home (%)
Housing units in structures - Boat, RV, van, etc. (%)
House/condo owner moved in on average (years ago)
Renter moved in on average (years ago)
Year householder moved into unit - Moved in 1999 to March 2000 (%)
Year householder moved into unit - Moved in 1995 to 1998 (%)
Year householder moved into unit - Moved in 1990 to 1994 (%)
Year householder moved into unit - Moved in 1980 to 1989 (%)
Year householder moved into unit - Moved in 1970 to 1979 (%)
Year householder moved into unit - Moved in 1969 or earlier (%)
Means of transportation to work - Drove car alone (%)
Means of transportation to work - Carpooled (%)
Means of transportation to work - Public transportation (%)
Means of transportation to work - Bus or trolley bus (%)
Means of transportation to work - Streetcar or trolley car (%)
Means of transportation to work - Subway or elevated (%)
Means of transportation to work - Railroad (%)
Means of transportation to work - Ferryboat (%)
Means of transportation to work - Taxicab (%)
Means of transportation to work - Motorcycle (%)
Means of transportation to work - Bicycle (%)
Means of transportation to work - Walked (%)
Means of transportation to work - Other means (%)
Working at home (%)
Industry diversity
Most Common Industries - Agriculture, forestry, fishing and hunting, and mining (%)
Most Common Industries - Agriculture, forestry, fishing and hunting (%)
Most Common Industries - Mining, quarrying, and oil and gas extraction (%)
Most Common Industries - Construction (%)
Most Common Industries - Manufacturing (%)
Most Common Industries - Wholesale trade (%)
Most Common Industries - Retail trade (%)
Most Common Industries - Transportation and warehousing, and utilities (%)
Most Common Industries - Transportation and warehousing (%)
Most Common Industries - Utilities (%)
Most Common Industries - Information (%)
Most Common Industries - Finance and insurance, and real estate and rental and leasing (%)
Most Common Industries - Finance and insurance (%)
Most Common Industries - Real estate and rental and leasing (%)
Most Common Industries - Professional, scientific, and management, and administrative and waste management services (%)
Most Common Industries - Professional, scientific, and technical services (%)
Most Common Industries - Management of companies and enterprises (%)
Most Common Industries - Administrative and support and waste management services (%)
Most Common Industries - Educational services, and health care and social assistance (%)
Most Common Industries - Educational services (%)
Most Common Industries - Health care and social assistance (%)
Most Common Industries - Arts, entertainment, and recreation, and accommodation and food services (%)
Most Common Industries - Arts, entertainment, and recreation (%)
Most Common Industries - Accommodation and food services (%)
Most Common Industries - Other services, except public administration (%)
Most Common Industries - Public administration (%)
Occupation diversity
Most Common Occupations - Management, business, science, and arts occupations (%)
Most Common Occupations - Management, business, and financial occupations (%)
Most Common Occupations - Management occupations (%)
Most Common Occupations - Business and financial operations occupations (%)
Most Common Occupations - Computer, engineering, and science occupations (%)
Most Common Occupations - Computer and mathematical occupations (%)
Most Common Occupations - Architecture and engineering occupations (%)
Most Common Occupations - Life, physical, and social science occupations (%)
Most Common Occupations - Education, legal, community service, arts, and media occupations (%)
Most Common Occupations - Community and social service occupations (%)
Most Common Occupations - Legal occupations (%)
Most Common Occupations - Education, training, and library occupations (%)
Most Common Occupations - Arts, design, entertainment, sports, and media occupations (%)
Most Common Occupations - Healthcare practitioners and technical occupations (%)
Most Common Occupations - Health diagnosing and treating practitioners and other technical occupations (%)
Most Common Occupations - Health technologists and technicians (%)
Most Common Occupations - Service occupations (%)
Most Common Occupations - Healthcare support occupations (%)
Most Common Occupations - Protective service occupations (%)
Most Common Occupations - Fire fighting and prevention, and other protective service workers including supervisors (%)
Most Common Occupations - Law enforcement workers including supervisors (%)
Most Common Occupations - Food preparation and serving related occupations (%)
Most Common Occupations - Building and grounds cleaning and maintenance occupations (%)
Most Common Occupations - Personal care and service occupations (%)
Most Common Occupations - Sales and office occupations (%)
Most Common Occupations - Sales and related occupations (%)
Most Common Occupations - Office and administrative support occupations (%)
Most Common Occupations - Natural resources, construction, and maintenance occupations (%)
Most Common Occupations - Farming, fishing, and forestry occupations (%)
Most Common Occupations - Construction and extraction occupations (%)
Most Common Occupations - Installation, maintenance, and repair occupations (%)
Most Common Occupations - Production, transportation, and material moving occupations (%)
Most Common Occupations - Production occupations (%)
Most Common Occupations - Transportation occupations (%)
Most Common Occupations - Material moving occupations (%)
People in Group quarters - Institutionalized population (%)
People in Group quarters - Correctional institutions (%)
People in Group quarters - Federal prisons and detention centers (%)
People in Group quarters - Halfway houses (%)
People in Group quarters - Local jails and other confinement facilities (including police lockups) (%)
People in Group quarters - Military disciplinary barracks (%)
People in Group quarters - State prisons (%)
People in Group quarters - Other types of correctional institutions (%)
People in Group quarters - Nursing homes (%)
People in Group quarters - Hospitals/wards, hospices, and schools for the handicapped (%)
People in Group quarters - Hospitals/wards and hospices for chronically ill (%)
People in Group quarters - Hospices or homes for chronically ill (%)
People in Group quarters - Military hospitals or wards for chronically ill (%)
People in Group quarters - Other hospitals or wards for chronically ill (%)
People in Group quarters - Hospitals or wards for drug/alcohol abuse (%)
People in Group quarters - Mental (Psychiatric) hospitals or wards (%)
People in Group quarters - Schools, hospitals, or wards for the mentally retarded (%)
People in Group quarters - Schools, hospitals, or wards for the physically handicapped (%)
People in Group quarters - Institutions for the deaf (%)
People in Group quarters - Institutions for the blind (%)
People in Group quarters - Orthopedic wards and institutions for the physically handicapped (%)
People in Group quarters - Wards in general hospitals for patients who have no usual home elsewhere (%)
People in Group quarters - Wards in military hospitals for patients who have no usual home elsewhere (%)
People in Group quarters - Juvenile institutions (%)
People in Group quarters - Long-term care (%)
People in Group quarters - Homes for abused, dependent, and neglected children (%)
People in Group quarters - Residential treatment centers for emotionally disturbed children (%)
People in Group quarters - Training schools for juvenile delinquents (%)
People in Group quarters - Short-term care, detention or diagnostic centers for delinquent children (%)
People in Group quarters - Type of juvenile institution unknown (%)
People in Group quarters - Noninstitutionalized population (%)
People in Group quarters - College dormitories (includes college quarters off campus) (%)
People in Group quarters - Military quarters (%)
People in Group quarters - On base (%)
People in Group quarters - Barracks, unaccompanied personnel housing (UPH), (Enlisted/Officer), ;and similar group living quarters for military personnel (%)
People in Group quarters - Transient quarters for temporary residents (%)
People in Group quarters - Military ships (%)
People in Group quarters - Group homes (%)
People in Group quarters - Homes or halfway houses for drug/alcohol abuse (%)
People in Group quarters - Homes for the mentally ill (%)
People in Group quarters - Homes for the mentally retarded (%)
People in Group quarters - Homes for the physically handicapped (%)
People in Group quarters - Other group homes (%)
People in Group quarters - Religious group quarters (%)
People in Group quarters - Dormitories (%)
People in Group quarters - Agriculture workers' dormitories on farms (%)
People in Group quarters - Job Corps and vocational training facilities (%)
People in Group quarters - Other workers' dormitories (%)
People in Group quarters - Crews of maritime vessels (%)
People in Group quarters - Other nonhousehold living situations (%)
People in Group quarters - Other noninstitutional group quarters (%)
Residents speaking English at home (%)
Residents speaking English at home - Born in the United States (%)
Residents speaking English at home - Native, born elsewhere (%)
Residents speaking English at home - Foreign born (%)
Residents speaking Spanish at home (%)
Residents speaking Spanish at home - Born in the United States (%)
Residents speaking Spanish at home - Native, born elsewhere (%)
Residents speaking Spanish at home - Foreign born (%)
Residents speaking other language at home (%)
Residents speaking other language at home - Born in the United States (%)
Residents speaking other language at home - Native, born elsewhere (%)
Residents speaking other language at home - Foreign born (%)
Class of Workers - Employee of private company (%)
Class of Workers - Self-employed in own incorporated business (%)
Class of Workers - Private not-for-profit wage and salary workers (%)
Class of Workers - Local government workers (%)
Class of Workers - State government workers (%)
Class of Workers - Federal government workers (%)
Class of Workers - Self-employed workers in own not incorporated business and Unpaid family workers (%)
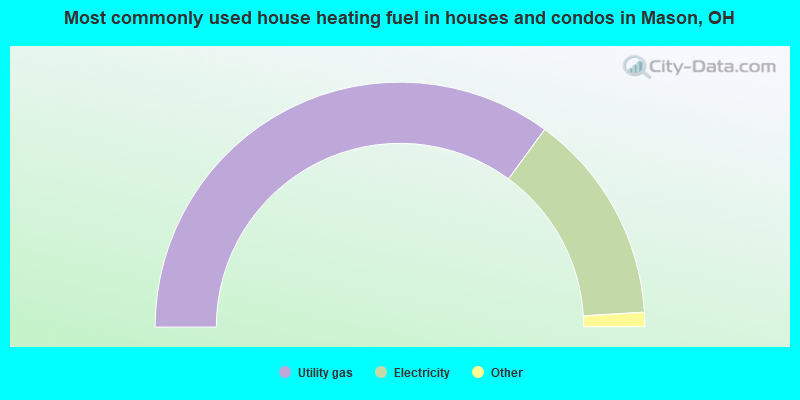
House heating fuel used in houses and condos - Utility gas (%)
House heating fuel used in houses and condos - Bottled, tank, or LP gas (%)
House heating fuel used in houses and condos - Electricity (%)
House heating fuel used in houses and condos - Fuel oil, kerosene, etc. (%)
House heating fuel used in houses and condos - Coal or coke (%)
House heating fuel used in houses and condos - Wood (%)
House heating fuel used in houses and condos - Solar energy (%)
House heating fuel used in houses and condos - Other fuel (%)
House heating fuel used in houses and condos - No fuel used (%)
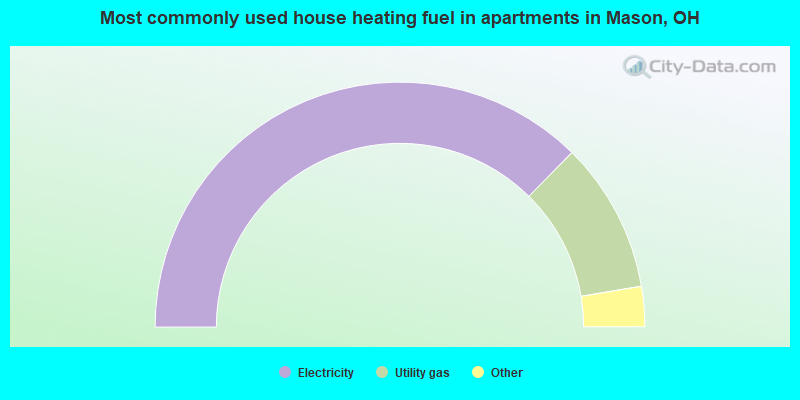
House heating fuel used in apartments - Utility gas (%)
House heating fuel used in apartments - Bottled, tank, or LP gas (%)
House heating fuel used in apartments - Electricity (%)
House heating fuel used in apartments - Fuel oil, kerosene, etc. (%)
House heating fuel used in apartments - Coal or coke (%)
House heating fuel used in apartments - Wood (%)
House heating fuel used in apartments - Solar energy (%)
House heating fuel used in apartments - Other fuel (%)
House heating fuel used in apartments - No fuel used (%)
Armed forces status - In Armed Forces (%)
Armed forces status - Civilian (%)
Armed forces status - Civilian - Veteran (%)
Armed forces status - Civilian - Nonveteran (%)
Fatal accidents locations in years 2005-2021
Fatal accidents locations in 2005
Fatal accidents locations in 2006
Fatal accidents locations in 2007
Fatal accidents locations in 2008
Fatal accidents locations in 2009
Fatal accidents locations in 2010
Fatal accidents locations in 2011
Fatal accidents locations in 2012
Fatal accidents locations in 2013
Fatal accidents locations in 2014
Fatal accidents locations in 2015
Fatal accidents locations in 2016
Fatal accidents locations in 2017
Fatal accidents locations in 2018
Fatal accidents locations in 2019
Fatal accidents locations in 2020
Fatal accidents locations in 2021
Alcohol use - People drinking some alcohol every month (%)
Alcohol use - People not drinking at all (%)
Alcohol use - Average days/month drinking alcohol
Alcohol use - Average drinks/week
Alcohol use - Average days/year people drink much
Audiometry - Average condition of hearing (%)
Audiometry - People that can hear a whisper from across a quiet room (%)
Audiometry - People that can hear normal voice from across a quiet room (%)
Audiometry - Ears ringing, roaring, buzzing (%)
Audiometry - Had a job exposure to loud noise (%)
Audiometry - Had off-work exposure to loud noise (%)
Blood Pressure & Cholesterol - Has high blood pressure (%)
Blood Pressure & Cholesterol - Checking blood pressure at home (%)
Blood Pressure & Cholesterol - Frequently checking blood cholesterol (%)
Blood Pressure & Cholesterol - Has high cholesterol level (%)
Consumer Behavior - Money monthly spent on food at supermarket/grocery store
Consumer Behavior - Money monthly spent on food at other stores
Consumer Behavior - Money monthly spent on eating out
Consumer Behavior - Money monthly spent on carryout/delivered foods
Consumer Behavior - Income spent on food at supermarket/grocery store (%)
Consumer Behavior - Income spent on food at other stores (%)
Consumer Behavior - Income spent on eating out (%)
Consumer Behavior - Income spent on carryout/delivered foods (%)
Current Health Status - General health condition (%)
Current Health Status - Blood donors (%)
Current Health Status - Has blood ever tested for HIV virus (%)
Current Health Status - Left-handed people (%)
Dermatology - People using sunscreen (%)
Diabetes - Diabetics (%)
Diabetes - Had a blood test for high blood sugar (%)
Diabetes - People taking insulin (%)
Diet Behavior & Nutrition - Diet health (%)
Diet Behavior & Nutrition - Milk product consumption (# of products/month)
Diet Behavior & Nutrition - Meals not home prepared (#/week)
Diet Behavior & Nutrition - Meals from fast food or pizza place (#/week)
Diet Behavior & Nutrition - Ready-to-eat foods (#/month)
Diet Behavior & Nutrition - Frozen meals/pizza (#/month)
Drug Use - People that ever used marijuana or hashish (%)
Drug Use - Ever used hard drugs (%)
Drug Use - Ever used any form of cocaine (%)
Drug Use - Ever used heroin (%)
Drug Use - Ever used methamphetamine (%)
Health Insurance - People covered by health insurance (%)
Kidney Conditions-Urology - Avg. # of times urinating at night
Medical Conditions - People with asthma (%)
Medical Conditions - People with anemia (%)
Medical Conditions - People with psoriasis (%)
Medical Conditions - People with overweight (%)
Medical Conditions - Elderly people having difficulties in thinking or remembering (%)
Medical Conditions - People who ever received blood transfusion (%)
Medical Conditions - People having trouble seeing even with glass/contacts (%)
Medical Conditions - People with arthritis (%)
Medical Conditions - People with gout (%)
Medical Conditions - People with congestive heart failure (%)
Medical Conditions - People with coronary heart disease (%)
Medical Conditions - People with angina pectoris (%)
Medical Conditions - People who ever had heart attack (%)
Medical Conditions - People who ever had stroke (%)
Medical Conditions - People with emphysema (%)
Medical Conditions - People with thyroid problem (%)
Medical Conditions - People with chronic bronchitis (%)
Medical Conditions - People with any liver condition (%)
Medical Conditions - People who ever had cancer or malignancy (%)
Mental Health - People who have little interest in doing things (%)
Mental Health - People feeling down, depressed, or hopeless (%)
Mental Health - People who have trouble sleeping or sleeping too much (%)
Mental Health - People feeling tired or having little energy (%)
Mental Health - People with poor appetite or overeating (%)
Mental Health - People feeling bad about themself (%)
Mental Health - People who have trouble concentrating on things (%)
Mental Health - People moving or speaking slowly or too fast (%)
Mental Health - People having thoughts they would be better off dead (%)
Oral Health - Average years since last visit a dentist
Oral Health - People embarrassed because of mouth (%)
Oral Health - People with gum disease (%)
Oral Health - General health of teeth and gums (%)
Oral Health - Average days a week using dental floss/device
Oral Health - Average days a week using mouthwash for dental problem
Oral Health - Average number of teeth
Pesticide Use - Households using pesticides to control insects (%)
Pesticide Use - Households using pesticides to kill weeds (%)
Physical Activity - People doing vigorous-intensity work activities (%)
Physical Activity - People doing moderate-intensity work activities (%)
Physical Activity - People walking or bicycling (%)
Physical Activity - People doing vigorous-intensity recreational activities (%)
Physical Activity - People doing moderate-intensity recreational activities (%)
Physical Activity - Average hours a day doing sedentary activities
Physical Activity - Average hours a day watching TV or videos
Physical Activity - Average hours a day using computer
Physical Functioning - People having limitations keeping them from working (%)
Physical Functioning - People limited in amount of work they can do (%)
Physical Functioning - People that need special equipment to walk (%)
Physical Functioning - People experiencing confusion/memory problems (%)
Physical Functioning - People requiring special healthcare equipment (%)
Prescription Medications - Average number of prescription medicines taking
Preventive Aspirin Use - Adults 40+ taking low-dose aspirin (%)
Reproductive Health - Vaginal deliveries (%)
Reproductive Health - Cesarean deliveries (%)
Reproductive Health - Deliveries resulted in a live birth (%)
Reproductive Health - Pregnancies resulted in a delivery (%)
Reproductive Health - Women breastfeeding newborns (%)
Reproductive Health - Women that had a hysterectomy (%)
Reproductive Health - Women that had both ovaries removed (%)
Reproductive Health - Women that have ever taken birth control pills (%)
Reproductive Health - Women taking birth control pills (%)
Reproductive Health - Women that have ever used Depo-Provera or injectables (%)
Reproductive Health - Women that have ever used female hormones (%)
Sexual Behavior - People 18+ that ever had sex (vaginal, anal, or oral) (%)
Sexual Behavior - Males 18+ that ever had vaginal sex with a woman (%)
Sexual Behavior - Males 18+ that ever performed oral sex on a woman (%)
Sexual Behavior - Males 18+ that ever had anal sex with a woman (%)
Sexual Behavior - Males 18+ that ever had any sex with a man (%)
Sexual Behavior - Females 18+ that ever had vaginal sex with a man (%)
Sexual Behavior - Females 18+ that ever performed oral sex on a man (%)
Sexual Behavior - Females 18+ that ever had anal sex with a man (%)
Sexual Behavior - Females 18+ that ever had any kind of sex with a woman (%)
Sexual Behavior - Average age people first had sex
Sexual Behavior - Average number of female sex partners in lifetime (males 18+)
Sexual Behavior - Average number of female vaginal sex partners in lifetime (males 18+)
Sexual Behavior - Average age people first performed oral sex on a woman (18+)
Sexual Behavior - Average number of woman performed oral sex on in lifetime (18+)
Sexual Behavior - Average number of male sex partners in lifetime (males 18+)
Sexual Behavior - Average number of male anal sex partners in lifetime (males 18+)
Sexual Behavior - Average age people first performed oral sex on a man (18+)
Sexual Behavior - Average number of male oral sex partners in lifetime (18+)
Sexual Behavior - People using protection when performing oral sex (%)
Sexual Behavior - Average number of times people have vaginal or anal sex a year
Sexual Behavior - People having sex without condom (%)
Sexual Behavior - Average number of male sex partners in lifetime (females 18+)
Sexual Behavior - Average number of male vaginal sex partners in lifetime (females 18+)
Sexual Behavior - Average number of female sex partners in lifetime (females 18+)
Sexual Behavior - Circumcised males 18+ (%)
Sleep Disorders - Average hours sleeping at night
Sleep Disorders - People that has trouble sleeping (%)
Smoking-Cigarette Use - People smoking cigarettes (%)
Taste & Smell - People 40+ having problems with smell (%)
Taste & Smell - People 40+ having problems with taste (%)
Taste & Smell - People 40+ that ever had wisdom teeth removed (%)
Taste & Smell - People 40+ that ever had tonsils teeth removed (%)
Taste & Smell - People 40+ that ever had a loss of consciousness because of a head injury (%)
Taste & Smell - People 40+ that ever had a broken nose or other serious injury to face or skull (%)
Taste & Smell - People 40+ that ever had two or more sinus infections (%)
Weight - Average height (inches)
Weight - Average weight (pounds)
Weight - Average BMI
Weight - People that are obese (%)
Weight - People that ever were obese (%)
Weight - People trying to lose weight (%)
According to our research of Ohio and other state lists, there were 11 registered sex offenders living in Mason, Ohio as of April 25, 2024 . The ratio of all residents to sex offenders in Mason is 2,918 to 1.The ratio of registered sex offenders to all residents in this city is much lower than the state average.
Officers per 1,000 residents here:
1.47Ohio average:
2.43
Latest news from Mason, OH collected exclusively by city-data.com from local newspapers, TV, and radio stations
Ancestries: German (13.8%), English (8.7%), American (6.2%), Irish (3.8%), African (2.0%), Polish (1.9%).
Current Local Time:
Land area: 17.6 square miles.
Population density: 2,017 people per square mile (low).
5,945 residents are foreign born (12.3% Asia , 1.8% Europe ).
Median real estate property taxes paid for housing units with mortgages in 2022: $4,950 (1.1%)Median real estate property taxes paid for housing units with no mortgage in 2022: $3,779 (1.2%)
Nearest city with pop. 50,000+: Middletown, OH
Nearest city with pop. 200,000+: Cincinnati, OH
Nearest city with pop. 1,000,000+: Chicago, IL
Nearest cities:
Latitude: 39.36 N, Longitude: 84.31 W
Daytime population change due to commuting: +10,319 (+28.9%)Workers who live and work in this city: 7,247 (37.7%)
Single-family new house construction building permits:
2022: 34 buildings , average cost: $708,8002021: 144 buildings , average cost: $495,6002020: 128 buildings , average cost: $450,5002019: 118 buildings , average cost: $371,3002018: 170 buildings , average cost: $301,7002017: 178 buildings , average cost: $262,7002016: 144 buildings , average cost: $252,7002015: 132 buildings , average cost: $233,7002014: 142 buildings , average cost: $243,3002013: 83 buildings , average cost: $309,6002012: 46 buildings , average cost: $311,7002011: 42 buildings , average cost: $320,9002010: 46 buildings , average cost: $288,4002009: 34 buildings , average cost: $243,5002008: 39 buildings , average cost: $300,8002007: 77 buildings , average cost: $326,3002006: 147 buildings , average cost: $176,7002005: 305 buildings , average cost: $167,1002004: 291 buildings , average cost: $157,6002003: 394 buildings , average cost: $155,9002002: 489 buildings , average cost: $153,5002001: 592 buildings , average cost: $138,8002000: 550 buildings , average cost: $141,2001999: 651 buildings , average cost: $135,1001998: 606 buildings , average cost: $134,3001997: 659 buildings , average cost: $123,400Unemployment in December 2023:
Population change in the 1990s: +10,493 (+91.1%).
Most common occupations in Mason, OH (%)
Both Males Females
Other management occupations, except farmers and farm managers (6.1%)
Sales representatives, services, wholesale and manufacturing (5.7%)
Computer specialists (4.4%)
Other sales and related occupations, including supervisors (4.0%)
Engineers (4.0%)
Secretaries and administrative assistants (3.6%)
Other office and administrative support workers, including supervisors (3.4%)
Sales representatives, services, wholesale and manufacturing (7.7%)
Other management occupations, except farmers and farm managers (7.6%)
Engineers (6.2%)
Computer specialists (5.5%)
Advertising, marketing, promotions, public relations, and sales managers (4.3%)
Other production occupations, including supervisors (4.3%)
Other sales and related occupations, including supervisors (3.7%)
Secretaries and administrative assistants (7.7%)
Other office and administrative support workers, including supervisors (5.8%)
Preschool, kindergarten, elementary, and middle school teachers (5.3%)
Other sales and related occupations, including supervisors (4.4%)
Registered nurses (4.4%)
Other management occupations, except farmers and farm managers (4.2%)
Information and record clerks, except customer service representatives (3.6%)
Tornado activity:
Mason-area historical tornado activity is slightly above Ohio state average. It is 60% greater than the overall U.S. average.
On 4/3/1974, a category F5 (max. wind speeds 261-318 mph) tornado 19.5 miles away from the Mason city center killed 3 people and injured 210 people .
On 6/2/1990, a category F4 (max. wind speeds 207-260 mph) tornado 1.1 miles away from the city center injured 37 people and caused between $5,000,000 and $50,000,000 in damages.
Earthquake activity:
Mason-area historical earthquake activity is significantly above Ohio state average. It is 38% greater than the overall U.S. average. On 7/27/1980 at 18:52:21, a magnitude 5.2 (5.1 MB, 4.7 MS, 5.0 UK, 5.2 UK, Class: Moderate, Intensity: VI - VII) earthquake occurred 82.2 miles away from the city center On 4/18/2008 at 09:36:59, a magnitude 5.4 (5.1 MB, 4.8 MS, 5.4 MW, 5.2 MW) earthquake occurred 202.3 miles away from Mason center On 4/18/2008 at 09:36:59, a magnitude 5.2 (5.2 MW, Depth: 8.9 mi) earthquake occurred 202.3 miles away from Mason center On 9/7/1988 at 02:28:09, a magnitude 4.6 (4.5 MB, 4.6 LG, Class: Light, Intensity: IV - V) earthquake occurred 87.2 miles away from the city center On 6/10/1987 at 23:48:54, a magnitude 5.1 (4.9 MB, 4.4 MS, 4.6 MS, 5.1 LG) earthquake occurred 195.4 miles away from Mason center On 7/12/1986 at 08:19:37, a magnitude 4.5 (4.5 MB) earthquake occurred 81.6 miles away from Mason center Magnitude types: regional Lg-wave magnitude (LG), body-wave magnitude (MB), surface-wave magnitude (MS), moment magnitude (MW) Natural disasters: The number of natural disasters in Warren County (10) is smaller than the US average (15).Major Disasters (Presidential) Declared: 6Emergencies Declared: 3Floods: 4, Heavy Rains: 2, Storms: 2, Blizzard: 1, Hurricane: 1, Mudslide: 1, Snow: 1, Snowstorm: 1, Tornado: 1, Tropical Depression: 1, Wind: 1, Winter Storm: 1, Other: 1 (Note: some incidents may be assigned to more than one category). Hospitals in Mason: BROOKSIDE EXTENDED CARE CENTER (780 SNIDER ROAD) COMMUNITY CONCEPTS INC/HOME 3 (959 TRADEWIND DRIVE) HOSPICE OF SOUTHWEST OHIO, INC (7264 COLUMBIA ROAD, SUITE 200) Home Health Centers in Mason: A-PLUS CARE, INC (4770 DUKE DRIVE, SUITE 205) ACCLAIM HOME HEALTH SERVICES, INC (4770 DUKE DRIVE, SUITE 195) INDUS HOME HEALTH CARE, INC (7588 CENTRAL PARKE BOULEVARD, SUITE 207) OMNI HOME CARE (4770 DUKE DRIVE, SUITE 170) PRIME HOME CARE, LLC (1233 CASTLE DRIVE, SUITE A1) Nursing Homes in Mason: CEDAR VILLAGE (5467 CEDAR VILLAGE DRIVE) MASON HEALTH CARE CENTER (5640 COX-SMITH ROAD) MCV HEALTH CARE FACILITIES, INC (411 WESTERN ROW ROAD) Airports located in Mason: Amtrak station near Mason: 14 miles: HAMILTON (M. L. KING BLVD AT HENRY ST.) Services: public payphones, free short-term parking, call for taxi service, public transit connection.
College/University in Mason: Strayer University-Ohio Full-time enrollment: 969; Location: 4605 Duke Dr; Private, for-profit; Website: www.strayer.edu/ohio/mason; Offers Master's degree )
Colleges/universities with over 2000 students nearest to Mason:
University of Cincinnati-Blue Ash College (about 10 miles; Blue Ash, OH ; Full-time enrollment: 3,711)
Miami University-Hamilton (about 14 miles; Hamilton, OH ; FT enrollment: 2,906)
Xavier University (about 17 miles; Cincinnati, OH ; FT enrollment: 6,143)
Cincinnati State Technical and Community College (about 19 miles; Cincinnati, OH ; FT enrollment: 8,757)
University of Cincinnati-Main Campus (about 20 miles; Cincinnati, OH ; FT enrollment: 28,747)
University of Cincinnati-Clermont College (about 21 miles; Batavia, OH ; FT enrollment: 2,739)
Fortis College-Centerville (about 22 miles; Centerville, OH ; FT enrollment: 4,527)
Public high schools in Mason:
Private high school in Mason: MARS HILL ACADEMY Students: 294, Location: 4230 AERO DR, Grades: KG-12)
Public elementary/middle schools in Mason:
Private elementary/middle schools in Mason: ST SUSANNA ELEMENTARY SCHOOL Students: 645, Location: 500 READING RD, Grades: 1-8)
MONTESSORI ACADEMY OF CINCINNATI Students: 197, Location: 8293 DUKE BLVD, Grades: PK-8)
ROYALMONT ACADEMY Students: 189, Location: 723 WESTERN ROW RD, Grades: PK-8)
LIBERTY BIBLE ACADEMY Students: 185, Location: 4900 OLD IRWIN SIMPSON RD, Grades: PK-8)
ADVENTURES IN LEARNING Students: 9, Location: 1288 STATE ROUTE 42, Grades: PK-T1)
See full list of schools located in Mason Library in Mason: MASON PUBLIC LIBRARY Operating income: $1,348,637; Location: 200 READING RD.; 162,112 books ; 15,000 e-books ; 17,679 audio materials ; 11,120 video materials ; 8 local licensed databases ; 266 state licensed databases ; 4 other licensed databases ; 300 print serial subscriptions ; 10 electronic serial subscriptions )
Notable locations in Mason: (A) , Castle Industrial Park (B) , Western Row Industrial Park (C) , Western Row Golf Course (D) , Mason Interstate Industrial Park (E) , Kings Mill Business Park (F) , Kings Island Amusement Park (G) , Jack Nicklaus Sports Center (H) , Crooked Tree Golf Course (I) , Mason Fire and Emergency Medical Services Station 52 South (J) , Kings Island Fire Department (K) , Mason Fire and Emergency Medical Services Station 51 (L) . Display/hide their locations on the map
Shopping Centers: (1) , Van Leunens Shopping Center (2) . Display/hide their locations on the map
Churches in Mason include: (A) , Faith Christian Fellowship Church (B) , Saint Susanna Catholic Church (C) , Vineyard Community Church (D) . Display/hide their locations on the map
Cemeteries: (1) , Keltner Cemetery (2) , Cline Family Cemetery (3) , Rose Hill Cemetery (4) . Display/hide their locations on the map
Reservoirs: (A) , Pine Hill Lake (B) , Shadow Lake (C) . Display/hide their locations on the map
Streams, rivers, and creeks: (A) , Hudsons Run (B) , Hoff Run (C) , Davis Run (D) , Union Run (E) . Display/hide their locations on the map
Parks in Mason include: (1) , Meadows Park (2) , Ciutan Park (3) , Corwin M Nixon Pine Hill Lakes Park (4) . Display/hide their locations on the map
Tourist attraction:
Hotels:
Birthplace of: Dan Patrick - Radio personality, Michael Muñoz - College football player, Brant Daugherty - Television actor, Carl Richburg - College basketball player (Miami (OHIO) RedHawks), Percy Coleman (baseball) - Baseball player, Zach Marshall - College football player (Maryland Terrapins).
Warren County has a predicted average indoor radon screening level greater than 4 pCi/L (pico curies per liter) - Highest Potential Average household size: This city:
2.8 peopleOhio:
2.4 people
Percentage of family households: This city:
74.5%Whole state:
65.0%
Percentage of households with unmarried partners: This city:
3.5%Whole state:
6.8%
Likely homosexual households (counted as self-reported same-sex unmarried-partner households)
Lesbian couples: 0.2% of all households Gay men: 0.2% of all households
110 people in group homes intended for adults in 2010people in nursing facilities/skilled-nursing facilities in 2010people in other nonhousehold living situations in 2000people in nursing homes in 2000
Banks with most branches in Mason (2011 data):
PNC Bank, National Association: Deerfield Township Branch, Cedar Village Branch, Kings Mill Branch, Tylersville And Snider Branch. Info updated 2012/03/20: Bank assets: $263,309.6 mil, Deposits: $197,343.0 mil, headquarters in Wilmington, DE, positive income , Commercial Lending Specialization, 3085 total offices , Holding Company: Pnc Financial Services Group, Inc., The
Fifth Third Bank: Mason Banking Center Branch, Deerfield Township Bank Mart Branch, Mason Bank Mart Branch. Info updated 2009/10/05: Bank assets: $114,540.4 mil, Deposits: $89,689.1 mil, headquarters in Cincinnati, OH, positive income , Commercial Lending Specialization, 1378 total offices , Holding Company: Fifth Third Bancorp
LCNB National Bank: Mason Christian Village Branch at 411 Western Row Road, branch established on 2005/11/01; The Mason Branch at 1050 Reading Road, branch established on 1977/06/13. Info updated 2010/06/02: Bank assets: $787.1 mil, Deposits: $664.9 mil, headquarters in Lebanon, OH, positive income , Commercial Lending Specialization, 26 total offices , Holding Company: Lcnb Corp.
U.S. Bank National Association: P & G Mason Branch at 8700 Mason-Montgomery Road, branch established on 1995/07/17; Mason Deerfield Branch at 5100 Socialville Foster Road, branch established on 2007/12/17. Info updated 2012/01/30: Bank assets: $330,470.8 mil, Deposits: $236,091.5 mil, headquarters in Cincinnati, OH, positive income , 3121 total offices , Holding Company: U.S. Bancorp
First Financial Bank, National Association: Arbor Square Branch at Arbor Square Dr, branch established on 2004/03/22; Mason-Montgomery Branch at 7420 South Mason-Montgomery Road, branch established on 2007/02/12. Info updated 2009/09/21: Bank assets: $6,663.4 mil, Deposits: $5,754.9 mil, headquarters in Hamilton, OH, positive income , Commercial Lending Specialization, 101 total offices , Holding Company: First Financial Bancorp
Peoples First Savings Bank: at 225 Reading Road, branch established on 1909/01/01. Info updated 2012/01/04: Bank assets: $50.5 mil, Deposits: $37.2 mil, local headquarters , positive income , Mortgage Lending Specialization, 2 total offices
The National Bank and Trust Company: Snider Road Office at 6210 Snider Road, branch established on 2008/02/14. Info updated 2010/03/22: Bank assets: $675.5 mil, Deposits: $589.3 mil, headquarters in Wilmington, OH, positive income , Commercial Lending Specialization, 24 total offices , Holding Company: Nb&T Financial Group, Inc.
KeyBank National Association: Mason Branch at 6643 Western Row Road, branch established on 1986/11/26. Info updated 2008/03/03: Bank assets: $86,198.8 mil, Deposits: $64,214.8 mil, headquarters in Cleveland, OH, positive income , Commercial Lending Specialization, 1067 total offices , Holding Company: Keycorp
The Huntington National Bank: Deerfield Office Branch at 5085 Deerfield Boulevard, branch established on 2004/07/12. Info updated 2012/04/02: Bank assets: $54,183.4 mil, Deposits: $44,300.3 mil, headquarters in Columbus, OH, positive income , Commercial Lending Specialization, 878 total offices , Holding Company: Huntington Bancshares Incorporated
5 other banks with 5 local branches
For population 15 years and over in Mason:
Never married: 24.2%Now married: 61.8%Separated: 0.6%Widowed: 4.7%Divorced: 8.6% For population 25 years and over in Mason:
High school or higher: 97.5%Bachelor's degree or higher: 61.8%Graduate or professional degree: 25.9%Unemployed: 3.1%Mean travel time to work (commute): 22.7 minutes
Education Gini index (Inequality in education) Here:
8.9Ohio average:
11.0
Religion statistics for Mason, OH (based on Warren County data)
Religion Adherents Congregations Evangelical Protestant 31,559 117 Catholic 19,509 5 Mainline Protestant 10,874 35 Black Protestant 191 1 Other 97 4 None 150,463 -
Source: Clifford Grammich, Kirk Hadaway, Richard Houseal, Dale E.Jones, Alexei Krindatch, Richie Stanley and Richard H.Taylor. 2012. 2010 U.S.Religion Census: Religious Congregations & Membership Study. Association of Statisticians of American Religious Bodies. Jones, Dale E., et al. 2002. Congregations and Membership in the United States 2000. Nashville, TN: Glenmary Research Center. Graphs represent county-level data
Food Environment Statistics: Number of grocery stores : 21Here :
1.03 / 10,000 pop.Ohio :
1.89 / 10,000 pop.
Number of supercenters and club stores : 2Warren County :
0.10 / 10,000 pop.State :
0.13 / 10,000 pop.
Number of convenience stores (no gas) : 17This county :
0.83 / 10,000 pop.Ohio :
1.25 / 10,000 pop.
Number of convenience stores (with gas) : 52This county :
2.55 / 10,000 pop.State :
2.93 / 10,000 pop.
Number of full-service restaurants : 111Warren County :
5.45 / 10,000 pop.State :
6.25 / 10,000 pop.
Adult diabetes rate : This county :
9.2%Ohio :
10.3%
Adult obesity rate : Warren County :
27.2%Ohio :
29.1%
Low-income preschool obesity rate : Health and Nutrition:
Average overall health of teeth and gums : This city:
45.9%Ohio:
47.8%
People feeling badly about themselves : People not drinking alcohol at all : This city:
11.6%State:
10.4%
Average hours sleeping at night : General health condition : Average condition of hearing : More about Health and Nutrition of Mason, OH Residents
Local government employment and payroll (March 2022)
Function
Full-time employees
Monthly full-time payroll
Average yearly full-time wage
Part-time employees
Monthly part-time payroll
Police Protection - Officers
42 $346,259 $98,931 0 $0 Firefighters
41 $370,965 $108,575 5 $12,080 Streets and Highways
18 $126,286 $84,191 0 $0 Financial Administration
16 $100,933 $75,700 7 $16,906 Parks and Recreation
16 $99,061 $74,296 119 $138,849 Judicial and Legal
15 $69,994 $55,995 5 $19,142 Other and Unallocable
12 $90,676 $90,676 0 $0 Sewerage
11 $82,461 $89,957 0 $0 Other Government Administration
9 $83,064 $110,752 15 $15,687 Police - Other
5 $25,015 $60,036 2 $1,818 Fire - Other
1 $4,491 $53,892 0 $0
Totals for Government
186 $1,399,205 $90,271 153 $204,482
Mason government finances - Expenditure in 2021 (per resident):
Construction - Regular Highways: $8,194,000 ($230.69)
Sewerage: $1,714,000 ($48.25)Parks and Recreation: $320,000 ($9.01)Current Operations - General - Other: $13,920,000 ($391.89)
Parks and Recreation: $10,572,000 ($297.64)Regular Highways: $7,931,000 ($223.28)Police Protection: $7,654,000 ($215.48)Housing and Community Development: $5,905,000 ($166.24)Sewerage: $5,394,000 ($151.86)Judicial and Legal Services: $1,946,000 ($54.79)Central Staff Services: $1,786,000 ($50.28)Financial Administration: $1,488,000 ($41.89)General Public Buildings: $1,485,000 ($41.81)Corrections - Other: $224,000 ($6.31)General - Interest on Debt: $2,354,000 ($66.27)
Other Capital Outlay - General - Other: $4,220,000 ($118.81)
Judicial and Legal Services: $1,000 ($0.03)Total Salaries and Wages: $4,452,000 ($125.34)
Mason government finances - Revenue in 2021 (per resident):
Charges - Sewerage: $11,003,000 ($309.77)
Parks and Recreation: $8,138,000 ($229.11)Other: $5,459,000 ($153.69)Miscellaneous - Special Assessments: $4,458,000 ($125.51)
Interest Earnings: $1,958,000 ($55.12)General Revenue - Other: $1,815,000 ($51.10)State Intergovernmental - Highways: $4,130,000 ($116.27)
Sewerage: $1,399,000 ($39.39)Other: $939,000 ($26.44)General Local Government Support: $680,000 ($19.14)Tax - Individual Income: $30,571,000 ($860.67)
Property: $18,370,000 ($517.17)Other License: $3,130,000 ($88.12)
Mason government finances - Debt in 2021 (per resident):
Long Term Debt - Beginning Outstanding - Unspecified Public Purpose: $47,760,000 ($1344.59)
Outstanding Unspecified Public Purpose: $37,020,000 ($1042.23)Beginning Outstanding - Public Debt for Private Purpose: $11,495,000 ($323.62)Outstanding Nonguaranteed - Industrial Revenue: $11,055,000 ($311.23)Retired Unspecified Public Purpose: $10,740,000 ($302.36)Retired Nonguaranteed - Public Debt for Private Purpose: $440,000 ($12.39)
Mason government finances - Cash and Securities in 2021 (per resident):
Bond Funds - Cash and Securities: $9,338,000 ($262.89)
Other Funds - Cash and Securities: $115,510,000 ($3251.97)
Sinking Funds - Cash and Securities: $16,327,000 ($459.66)
9.23% of this county's 2021 resident taxpayers lived in other counties in 2020 ($85,617 average adjusted gross income )
Here:
9.23%Ohio average:
5.68%
0.02% of residents moved from foreign countries ($170 average AGI )Warren County:
0.02%Ohio average:
0.01%
Top counties from which taxpayers relocated into this county between 2020 and 2021:
Businesses in Mason, OH
Name Count Name Count
AT&T 1 Lane Bryant 1 Advance Auto Parts 1 Lowe's 1 Ann Taylor 1 Marriott 1 Applebee's 1 MasterBrand Cabinets 2 AutoZone 1 McDonald's 2 Baymont Inn 1 Microtel 1 Bed Bath & Beyond 1 Motel 6 1 Best Western 1 New York & Co 1 Blockbuster 1 Nike 2 Buffalo Wild Wings 1 Outback 1 Burger King 2 Outback Steakhouse 1 Buybuy BABY 1 Panda Express 1 CVS 1 Panera Bread 1 Chick-Fil-A 1 Penske 1 Chico's 1 PetSmart 1 Chipotle 1 Pizza Hut 1 Coldwater Creek 1 Popeyes 1 Comfort Suites 1 Quiznos 1 DHL 1 Red Robin 1 Decora Cabinetry 2 Ruby Tuesday 1 Domino's Pizza 1 Sprint Nextel 1 Dunkin Donuts 1 Staples 1 FedEx 4 Starbucks 4 Firestone Complete Auto Care 1 Subway 5 GNC 1 Super 8 1 GameStop 2 T-Mobile 1 Gymboree 1 Taco Bell 1 H&R Block 2 Talbots 1 Hilton 1 U-Haul 3 Holiday Inn 1 UPS 9 Home Depot 1 Waffle House 2 IHOP 1 Walgreens 2 JoS. A. Bank 1 Walmart 1 Kroger 2 Wendy's 4 La Quinta 1 Whole Foods Market 1
Strongest AM radio stations in Mason:
WLW (700 AM; 50 kW; CINCINNATI, OH; Owner: JACOR BROADCASTING CORPORATION)
WSAI (1530 AM; 50 kW; CINCINNATI, OH; Owner: JACOR BROADCASTING CORPORATION)
WCNW (1560 AM; daytime; 5 kW; FAIRFIELD, OH)
WCKY (1360 AM; 5 kW; CINCINNATI, OH; Owner: JACOR BROADCASTING CORPORATION)
WCIN (1480 AM; 5 kW; CINCINNATI, OH)
WKRC (550 AM; 5 kW; CINCINNATI, OH; Owner: JACOR BROADCASTING CORPORATION)
WTVN (610 AM; 50 kW; COLUMBUS, OH; Owner: CITICASTERS LICENSES, L.P.)
WONE (980 AM; 5 kW; DAYTON, OH; Owner: CITICASTERS LICENSES, L.P.)
WPFB (910 AM; 1 kW; MIDDLETOWN, OH)
WHIO (1290 AM; 5 kW; DAYTON, OH; Owner: CXR HOLDINGS, INC.)
WING (1410 AM; 5 kW; DAYTON, OH)
WHAS (840 AM; 50 kW; LOUISVILLE, KY; Owner: CLEAR CHANNEL BROADCASTING LICENSES, INC.)
WMOH (1450 AM; 1 kW; HAMILTON, OH; Owner: THE MIAMI RIVER BROADCASTING COMPANY)
Strongest FM radio stations in Mason:
WYGY (96.5 FM; LEBANON, OH; Owner: WVAE LICO, INC.)
WLHS (89.9 FM; WEST CHESTER, OH; Owner: LAKOTA LOCAL SCHOOL DISTRICT)
WAQZ (97.3 FM; FORT THOMAS, KY; Owner: INFINITY RADIO OPERATIONS INC.)
WMOJ (94.9 FM; FAIRFIELD, OH; Owner: WVAE LICO, INC.)
WGRR (103.5 FM; HAMILTON, OH; Owner: INFINITY RADIO OPERATIONS INC.)
WPFB-FM (105.9 FM; MIDDLETOWN, OH; Owner: RADIO STATIONS WPAY/WPFB, INC.)
WRRM (98.5 FM; CINCINNATI, OH; Owner: WRRM LICO, INC)
WUBE-FM (105.1 FM; CINCINNATI, OH; Owner: INFINITY RADIO OPERATIONS INC.)
WKRQ (101.9 FM; CINCINNATI, OH; Owner: INFINITY RADIO OPERATIONS INC.)
WGUC (90.9 FM; CINCINNATI, OH; Owner: CINCINNATI CLASSICAL PUBLIC RADIO, INC.)
WKFS (107.1 FM; MILFORD, OH; Owner: JACOR BROADCASTING CORPORATION)
WOFX-FM (92.5 FM; CINCINNATI, OH; Owner: JACOR BROADCASTING CORPORATION)
WVMX (94.1 FM; CINCINNATI, OH; Owner: CITICASTERS LICENSES, L.P.)
WEBN (102.7 FM; CINCINNATI, OH; Owner: JACOR BROADCASTING CORPORATION)
WHKO (99.1 FM; DAYTON, OH; Owner: CXR HOLDINGS, INC.)
WVXU (91.7 FM; CINCINNATI, OH; Owner: XAVIER UNIVERSITY)
WAKW (93.3 FM; CINCINNATI, OH; Owner: PILLAR OF FIRE)
WMKV (89.3 FM; READING, OH; Owner: LIFESPHERE)
WLQT (99.9 FM; KETTERING, OH; Owner: CITICASTERS LICENSES, L.P.)
WMMX (107.7 FM; DAYTON, OH; Owner: CITICASTERS LICENSES, L.P.)
TV broadcast stations around Mason:
WLWT (Channel 5; CINCINNATI, OH; Owner: OHIO/OKLAHOMA HEARST-ARGYLE TV, INC)
WCPO-TV (Channel 9; CINCINNATI, OH; Owner: SCRIPPS HOWARD BROADCASTING COMPANY)
WKRC-TV (Channel 12; CINCINNATI, OH; Owner: CITICASTERS CO.)
WHIO-TV (Channel 7; DAYTON, OH; Owner: WHIO-TV HOLDINGS, INC.)
WSTR-TV (Channel 64; CINCINNATI, OH; Owner: WSTR LICENSEE, INC.)
WDTN (Channel 2; DAYTON, OH; Owner: WDTN BROADCASTING, LLC)
WCET (Channel 48; CINCINNATI, OH; Owner: THE GREATER CINCINNATI TV EDUC'L. FOUNDATION)
WXIX-TV (Channel 19; NEWPORT, KY; Owner: RAYCOM NATIONAL, INC.)
WKOI (Channel 43; RICHMOND, IN; Owner: TRINITY BROADCASTING OF INDIANA, INC.)
WPTD (Channel 16; DAYTON, OH; Owner: GREATER DAYTON PUBLIC TV, INC.)
WKEF (Channel 22; DAYTON, OH; Owner: WKEF LICENSEE L.P.)
WRGT-TV (Channel 45; DAYTON, OH; Owner: WRGT LICENSEE, LLC)
WBQC-CA (Channel 25; CINCINNATI, OH; Owner: ELLIOTT B. BLOCK)
WOTH-LP (Channel 35; CINCINNATI, OH; Owner: ELLIOTT B. BLOCK)
WPTO (Channel 14; OXFORD, OH; Owner: GREATER DAYTON PUBLIC TELEVISION, INC.)
W61DE (Channel 61; CINCINNATI, OH; Owner: TRINITY BROADCASTING NETWORK)
WWRD-LP (Channel 55; CENTERVILLE, OH; Owner: LIFE BROADCASTING NETWORK)
WBDT (Channel 26; SPRINGFIELD, OH; Owner: ACME TV LICENSES OF OHIO, LLC)
WRCX-LP (Channel 51; DAYTON, OH; Owner: ROSS COMMUNICATIONS, LTD.)
National Bridge Inventory (NBI) Statistics 34 Number of bridges223ft / 68.2m Total length698,435 Total average daily traffic61,656 Total average daily truck traffic
New bridges - historical statistics
1 1930-1939 1 1950-1959 3 1960-1969 6 1970-1979 1 1980-1989 13 1990-1999 3 2000-2009 6 2010-2019
See full National Bridge Inventory statistics for Mason, OH
Home Mortgage Disclosure Act Aggregated Statistics For Year 2009(Based on 1 full and 4 partial tracts) A) FHA, FSA/RHS & VA B) Conventional C) Refinancings D) Home Improvement Loans E) Loans on Dwellings For 5+ Families F) Non-occupant Loans on G) Loans On Manufactured Number Average Value Number Average Value Number Average Value Number Average Value Number Average Value Number Average Value Number Average Value
LOANS ORIGINATED 163 $161,843 332 $222,540 1,728 $209,322 32 $42,173 1 $2,083,940 36 $180,689 2 $135,940 APPLICATIONS APPROVED, NOT ACCEPTED 13 $151,435 20 $259,811 111 $217,550 7 $22,934 0 $0 1 $75,580 2 $304,540 APPLICATIONS DENIED 24 $160,781 27 $216,014 353 $240,885 17 $47,205 0 $0 11 $168,612 0 $0 APPLICATIONS WITHDRAWN 17 $173,356 26 $258,061 183 $215,404 6 $235,187 0 $0 8 $124,226 0 $0 FILES CLOSED FOR INCOMPLETENESS 1 $110,570 4 $204,742 57 $230,024 4 $49,630 0 $0 3 $111,193 0 $0
Aggregated Statistics For Year 2008(Based on 1 full and 4 partial tracts) A) FHA, FSA/RHS & VA B) Conventional C) Refinancings D) Home Improvement Loans E) Loans on Dwellings For 5+ Families F) Non-occupant Loans on G) Loans On Manufactured Number Average Value Number Average Value Number Average Value Number Average Value Number Average Value Number Average Value Number Average Value
LOANS ORIGINATED 105 $168,498 428 $228,565 521 $204,481 46 $62,172 1 $276,940 54 $122,581 2 $25,260 APPLICATIONS APPROVED, NOT ACCEPTED 1 $111,340 42 $237,662 64 $194,642 8 $24,952 0 $0 2 $123,940 3 $35,203 APPLICATIONS DENIED 18 $138,900 41 $265,236 227 $228,603 35 $42,297 0 $0 16 $231,197 4 $64,225 APPLICATIONS WITHDRAWN 12 $164,628 44 $242,929 121 $223,277 4 $79,345 0 $0 8 $186,949 0 $0 FILES CLOSED FOR INCOMPLETENESS 0 $0 8 $222,892 25 $204,140 3 $79,577 0 $0 0 $0 0 $0
Aggregated Statistics For Year 2007(Based on 1 full and 4 partial tracts) A) FHA, FSA/RHS & VA B) Conventional C) Refinancings D) Home Improvement Loans E) Loans on Dwellings For 5+ Families F) Non-occupant Loans on G) Loans On Manufactured Number Average Value Number Average Value Number Average Value Number Average Value Number Average Value Number Average Value Number Average Value
LOANS ORIGINATED 52 $159,696 675 $207,206 507 $182,627 52 $33,921 6 $2,214,543 60 $150,639 3 $34,413 APPLICATIONS APPROVED, NOT ACCEPTED 1 $137,530 64 $218,900 116 $168,005 25 $29,148 0 $0 10 $86,376 0 $0 APPLICATIONS DENIED 7 $158,490 90 $228,150 311 $177,018 35 $39,983 0 $0 30 $166,397 3 $34,210 APPLICATIONS WITHDRAWN 8 $182,588 54 $226,199 117 $197,457 11 $45,904 0 $0 4 $185,892 0 $0 FILES CLOSED FOR INCOMPLETENESS 1 $156,070 17 $163,405 52 $229,568 1 $66,830 0 $0 3 $149,853 0 $0
Aggregated Statistics For Year 2006(Based on 1 full and 4 partial tracts) A) FHA, FSA/RHS & VA B) Conventional C) Refinancings D) Home Improvement Loans E) Loans on Dwellings For 5+ Families F) Non-occupant Loans on G) Loans On Manufactured Number Average Value Number Average Value Number Average Value Number Average Value Number Average Value Number Average Value Number Average Value
LOANS ORIGINATED 55 $145,625 1,010 $196,690 597 $175,124 100 $48,171 1 $5,971,390 83 $148,225 1 $67,360 APPLICATIONS APPROVED, NOT ACCEPTED 2 $196,270 93 $177,310 129 $168,344 17 $32,826 0 $0 11 $151,648 2 $7,955 APPLICATIONS DENIED 3 $127,470 117 $187,542 340 $169,727 44 $81,448 0 $0 27 $143,125 1 $36,370 APPLICATIONS WITHDRAWN 7 $160,247 93 $196,417 181 $180,252 13 $109,532 1 $50,100 16 $183,800 2 $106,900 FILES CLOSED FOR INCOMPLETENESS 2 $138,290 18 $153,117 76 $168,410 3 $136,153 0 $0 2 $214,330 0 $0
Aggregated Statistics For Year 2005(Based on 1 full and 4 partial tracts) A) FHA, FSA/RHS & VA B) Conventional C) Refinancings D) Home Improvement Loans E) Loans on Dwellings For 5+ Families F) Non-occupant Loans on G) Loans On Manufactured Number Average Value Number Average Value Number Average Value Number Average Value Number Average Value Number Average Value Number Average Value
LOANS ORIGINATED 69 $142,833 1,107 $200,183 732 $182,710 70 $57,270 3 $5,656,497 102 $177,590 1 $21,190 APPLICATIONS APPROVED, NOT ACCEPTED 2 $163,820 120 $188,846 124 $160,480 18 $27,023 0 $0 12 $87,308 1 $20,230 APPLICATIONS DENIED 12 $134,540 114 $210,968 367 $166,678 60 $35,474 0 $0 28 $126,096 12 $35,634 APPLICATIONS WITHDRAWN 8 $122,162 92 $196,857 243 $175,864 18 $174,407 0 $0 20 $145,743 1 $17,340 FILES CLOSED FOR INCOMPLETENESS 2 $152,855 27 $213,101 70 $182,997 5 $33,706 0 $0 5 $139,646 0 $0
Aggregated Statistics For Year 2004(Based on 1 full and 4 partial tracts) A) FHA, FSA/RHS & VA B) Conventional C) Refinancings D) Home Improvement Loans E) Loans on Dwellings For 5+ Families F) Non-occupant Loans on G) Loans On Manufactured Number Average Value Number Average Value Number Average Value Number Average Value Number Average Value Number Average Value Number Average Value
LOANS ORIGINATED 67 $135,118 1,050 $198,489 1,038 $177,143 81 $54,997 2 $355,260 69 $124,108 1 $7,710 APPLICATIONS APPROVED, NOT ACCEPTED 1 $191,120 105 $188,548 163 $159,141 17 $37,214 0 $0 7 $101,101 1 $21,520 APPLICATIONS DENIED 13 $140,004 99 $167,885 349 $161,395 48 $38,969 0 $0 17 $150,328 6 $25,320 APPLICATIONS WITHDRAWN 9 $132,187 130 $195,959 236 $164,162 17 $63,601 0 $0 11 $130,044 0 $0 FILES CLOSED FOR INCOMPLETENESS 3 $96,397 28 $183,162 71 $144,354 5 $85,198 0 $0 1 $104,560 0 $0
Aggregated Statistics For Year 2003(Based on 1 full and 4 partial tracts) A) FHA, FSA/RHS & VA B) Conventional C) Refinancings D) Home Improvement Loans E) Loans on Dwellings For 5+ Families F) Non-occupant Loans on Number Average Value Number Average Value Number Average Value Number Average Value Number Average Value Number Average Value
LOANS ORIGINATED 94 $129,459 1,053 $185,634 3,077 $171,817 40 $28,585 1 $1,049,160 77 $132,436 APPLICATIONS APPROVED, NOT ACCEPTED 2 $102,190 80 $182,655 292 $168,431 19 $24,641 0 $0 9 $147,770 APPLICATIONS DENIED 15 $111,285 76 $143,179 402 $146,146 43 $37,657 0 $0 16 $113,451 APPLICATIONS WITHDRAWN 6 $120,985 99 $193,861 278 $166,937 10 $52,381 0 $0 9 $150,251 FILES CLOSED FOR INCOMPLETENESS 6 $141,872 38 $176,913 119 $166,559 2 $113,540 0 $0 3 $265,897
Aggregated Statistics For Year 2002(Based on 1 full and 3 partial tracts) A) FHA, FSA/RHS & VA B) Conventional C) Refinancings D) Home Improvement Loans E) Loans on Dwellings For 5+ Families F) Non-occupant Loans on Number Average Value Number Average Value Number Average Value Number Average Value Number Average Value Number Average Value
LOANS ORIGINATED 85 $130,162 772 $183,419 1,891 $169,996 71 $29,188 1 $126,310 46 $116,999 APPLICATIONS APPROVED, NOT ACCEPTED 5 $139,970 81 $170,549 214 $157,880 23 $24,060 0 $0 3 $107,737 APPLICATIONS DENIED 12 $129,875 50 $116,335 325 $146,597 26 $17,976 0 $0 8 $100,045 APPLICATIONS WITHDRAWN 12 $129,980 73 $187,993 194 $147,945 6 $13,088 0 $0 7 $112,570 FILES CLOSED FOR INCOMPLETENESS 3 $105,133 30 $113,915 59 $196,323 2 $337,815 0 $0 1 $60,360
Aggregated Statistics For Year 2001(Based on 1 full and 3 partial tracts) A) FHA, FSA/RHS & VA B) Conventional C) Refinancings D) Home Improvement Loans E) Loans on Dwellings For 5+ Families F) Non-occupant Loans on Number Average Value Number Average Value Number Average Value Number Average Value Number Average Value Number Average Value
LOANS ORIGINATED 98 $124,141 765 $169,315 1,312 $163,800 69 $23,201 1 $134,730 52 $119,065 APPLICATIONS APPROVED, NOT ACCEPTED 6 $97,035 79 $179,221 168 $136,356 26 $15,314 0 $0 3 $92,650 APPLICATIONS DENIED 6 $119,727 53 $142,845 275 $131,490 30 $19,992 0 $0 9 $119,493 APPLICATIONS WITHDRAWN 8 $138,001 36 $153,774 178 $157,508 11 $19,705 1 $255,420 1 $175,340 FILES CLOSED FOR INCOMPLETENESS 4 $107,672 8 $133,128 39 $173,005 2 $41,225 0 $0 2 $74,270
Aggregated Statistics For Year 2000(Based on 1 full and 3 partial tracts) A) FHA, FSA/RHS & VA B) Conventional C) Refinancings D) Home Improvement Loans E) Loans on Dwellings For 5+ Families F) Non-occupant Loans on Number Average Value Number Average Value Number Average Value Number Average Value Number Average Value Number Average Value
LOANS ORIGINATED 81 $117,973 829 $162,488 253 $113,384 112 $14,780 2 $2,068,145 34 $135,058 APPLICATIONS APPROVED, NOT ACCEPTED 7 $92,863 80 $163,314 68 $96,489 34 $21,537 0 $0 4 $99,865 APPLICATIONS DENIED 13 $99,008 73 $115,841 148 $112,853 58 $20,258 0 $0 6 $104,190 APPLICATIONS WITHDRAWN 9 $123,694 63 $161,980 65 $81,268 10 $95,782 1 $2,890,200 4 $92,458 FILES CLOSED FOR INCOMPLETENESS 4 $107,780 15 $138,179 16 $123,508 3 $10,067 0 $0 0 $0
Aggregated Statistics For Year 1999(Based on 1 full and 4 partial tracts) A) FHA, FSA/RHS & VA B) Conventional C) Refinancings D) Home Improvement Loans E) Loans on Dwellings For 5+ Families F) Non-occupant Loans on Number Average Value Number Average Value Number Average Value Number Average Value Number Average Value Number Average Value
LOANS ORIGINATED 115 $109,366 884 $162,986 634 $124,864 133 $13,273 1 $626,020 32 $113,589 APPLICATIONS APPROVED, NOT ACCEPTED 3 $113,713 78 $138,947 141 $111,958 35 $11,330 0 $0 5 $84,594 APPLICATIONS DENIED 9 $109,818 104 $119,902 190 $103,725 76 $15,443 0 $0 10 $150,716 APPLICATIONS WITHDRAWN 4 $108,285 71 $162,630 106 $124,426 24 $53,825 0 $0 3 $83,637 FILES CLOSED FOR INCOMPLETENESS 1 $106,560 14 $159,029 31 $132,249 1 $19,960 0 $0 1 $118,490
Detailed HMDA statistics for the following Tracts:
0319.02
, 0319.03 , 0319.04 , 0320.03 , 0320.05
Private Mortgage Insurance Companies Aggregated Statistics For Year 2009(Based on 1 full and 4 partial tracts) A) Conventional B) Refinancings Number Average Value Number Average Value
LOANS ORIGINATED 48 $207,855 33 $213,606 APPLICATIONS APPROVED, NOT ACCEPTED 10 $220,526 18 $212,954 APPLICATIONS DENIED 7 $163,713 5 $217,768 APPLICATIONS WITHDRAWN 1 $178,210 1 $282,260 FILES CLOSED FOR INCOMPLETENESS 0 $0 2 $230,270
Aggregated Statistics For Year 2008(Based on 1 full and 4 partial tracts) A) Conventional B) Refinancings C) Non-occupant Loans on Number Average Value Number Average Value Number Average Value
LOANS ORIGINATED 110 $200,261 48 $180,585 12 $104,953 APPLICATIONS APPROVED, NOT ACCEPTED 22 $175,195 20 $179,190 3 $115,093 APPLICATIONS DENIED 13 $314,264 8 $137,844 5 $157,698 APPLICATIONS WITHDRAWN 5 $428,204 3 $143,373 0 $0 FILES CLOSED FOR INCOMPLETENESS 3 $862,903 1 $301,710 2 $660,435
Aggregated Statistics For Year 2007(Based on 1 full and 4 partial tracts) A) Conventional B) Refinancings C) Non-occupant Loans on Number Average Value Number Average Value Number Average Value
LOANS ORIGINATED 156 $168,821 64 $210,194 6 $149,920 APPLICATIONS APPROVED, NOT ACCEPTED 20 $157,108 11 $228,498 4 $125,948 APPLICATIONS DENIED 1 $254,700 0 $0 1 $254,700 APPLICATIONS WITHDRAWN 8 $171,734 6 $178,447 1 $89,110 FILES CLOSED FOR INCOMPLETENESS 0 $0 1 $515,950 1 $222,770
Aggregated Statistics For Year 2006(Based on 1 full and 4 partial tracts) A) Conventional B) Refinancings C) Non-occupant Loans on Number Average Value Number Average Value Number Average Value
LOANS ORIGINATED 138 $169,928 40 $166,921 13 $150,764 APPLICATIONS APPROVED, NOT ACCEPTED 26 $188,295 15 $214,415 4 $137,400 APPLICATIONS DENIED 3 $108,400 1 $314,750 2 $119,485 APPLICATIONS WITHDRAWN 6 $297,147 8 $152,888 1 $151,570 FILES CLOSED FOR INCOMPLETENESS 0 $0 0 $0 0 $0
Aggregated Statistics For Year 2005(Based on 1 full and 4 partial tracts) A) Conventional B) Refinancings C) Non-occupant Loans on Number Average Value Number Average Value Number Average Value
LOANS ORIGINATED 132 $199,213 51 $196,613 16 $157,762 APPLICATIONS APPROVED, NOT ACCEPTED 26 $193,268 20 $187,284 7 $163,400 APPLICATIONS DENIED 0 $0 1 $156,650 0 $0 APPLICATIONS WITHDRAWN 5 $212,844 13 $142,143 3 $133,040 FILES CLOSED FOR INCOMPLETENESS 1 $191,600 1 $173,090 1 $159,990
Aggregated Statistics For Year 2004(Based on 1 full and 4 partial tracts) A) Conventional B) Refinancings C) Non-occupant Loans on Number Average Value Number Average Value Number Average Value
LOANS ORIGINATED 145 $190,149 71 $180,540 11 $113,146 APPLICATIONS APPROVED, NOT ACCEPTED 39 $210,454 38 $157,594 3 $98,113 APPLICATIONS DENIED 2 $267,440 1 $77,650 0 $0 APPLICATIONS WITHDRAWN 10 $225,302 14 $182,144 2 $173,135 FILES CLOSED FOR INCOMPLETENESS 4 $142,635 2 $172,790 0 $0
Aggregated Statistics For Year 2003(Based on 1 full and 4 partial tracts) A) Conventional B) Refinancings C) Non-occupant Loans on Number Average Value Number Average Value Number Average Value
LOANS ORIGINATED 215 $187,586 264 $165,684 10 $116,580 APPLICATIONS APPROVED, NOT ACCEPTED 43 $200,467 78 $164,878 3 $94,167 APPLICATIONS DENIED 1 $123,320 2 $160,700 0 $0 APPLICATIONS WITHDRAWN 12 $183,921 12 $165,552 1 $99,890 FILES CLOSED FOR INCOMPLETENESS 1 $85,510 1 $145,020 0 $0
Aggregated Statistics For Year 2002(Based on 1 full and 3 partial tracts) A) Conventional B) Refinancings C) Non-occupant Loans on Number Average Value Number Average Value Number Average Value
LOANS ORIGINATED 208 $169,384 166 $157,974 6 $100,410 APPLICATIONS APPROVED, NOT ACCEPTED 32 $171,705 45 $154,332 1 $50,300 APPLICATIONS DENIED 3 $179,397 5 $190,974 2 $196,595 APPLICATIONS WITHDRAWN 7 $158,900 19 $165,763 2 $137,675 FILES CLOSED FOR INCOMPLETENESS 1 $194,610 1 $117,530 0 $0
Aggregated Statistics For Year 2001(Based on 1 full and 3 partial tracts) A) Conventional B) Refinancings C) Non-occupant Loans on Number Average Value Number Average Value Number Average Value
LOANS ORIGINATED 224 $170,767 161 $149,999 9 $117,598 APPLICATIONS APPROVED, NOT ACCEPTED 27 $174,150 29 $142,790 2 $80,990 APPLICATIONS DENIED 2 $112,510 5 $113,108 1 $152,600 APPLICATIONS WITHDRAWN 6 $138,005 6 $166,297 0 $0 FILES CLOSED FOR INCOMPLETENESS 6 $239,140 0 $0 0 $0
Aggregated Statistics For Year 2000(Based on 1 full and 3 partial tracts) A) Conventional B) Refinancings C) Non-occupant Loans on Number Average Value Number Average Value Number Average Value
LOANS ORIGINATED 191 $169,436 22 $135,121 4 $78,815 APPLICATIONS APPROVED, NOT ACCEPTED 25 $191,844 6 $146,742 1 $106,660 APPLICATIONS DENIED 4 $147,615 1 $229,920 1 $93,560 APPLICATIONS WITHDRAWN 5 $234,172 0 $0 0 $0 FILES CLOSED FOR INCOMPLETENESS 2 $229,090 0 $0 0 $0
Aggregated Statistics For Year 1999(Based on 1 full and 4 partial tracts) A) Conventional B) Refinancings C) Non-occupant Loans on Number Average Value Number Average Value Number Average Value
LOANS ORIGINATED 281 $164,977 104 $137,956 5 $76,918 APPLICATIONS APPROVED, NOT ACCEPTED 27 $205,280 24 $125,971 0 $0 APPLICATIONS DENIED 11 $160,014 3 $120,467 1 $92,990 APPLICATIONS WITHDRAWN 9 $207,006 1 $138,780 0 $0 FILES CLOSED FOR INCOMPLETENESS 2 $187,540 0 $0 0 $0
Detailed PMIC statistics for the following Tracts:
0319.02
, 0319.03 , 0319.04 , 0320.03 , 0320.05 Fire-safe hotels and motels in Mason, Ohio:
Comfort Suites Kings Island, 5457 Kings Center Dr, Mason, Ohio 45040 Phone: (513) 336-9000, Fax: (513) 336-9007
La Quinta Inn & Suites Cincinnati North East, 9918 Escort Dr, Mason, Ohio 45040 Phone: (513) 459-1111, Fax: (513) 459-1168
Hampton Inn, 5323 BCH Blvd, Mason, Ohio 45040 Phone: (513) 459-8900, Fax: (513) 459-8850
Cincinnati Marriott Northeast, 9664 Mason-Montgomery Rd, Mason, Ohio 45040 Phone: (513) 459-9800, Fax: (513) 459-9808
Hyatt Place, 5070 Natorp Blvd, Mason, Ohio 45040 Phone: (513) 574-0003, Fax: (513) 754-0039
Super8 Mason, 5589 State Rt 741/Kings Mills Rd, Mason, Ohio 45040 Phone: (513) 398-8075, Fax: (513) 459-1043
Microtel Inn & Suites, 5324 Beach Blvd, Mason, Ohio 45040 Phone: (513) 754-1500, Fax: (513) 754-1550
Kings Island Resort & Conference Ctr, 5691 Kings Island Dr, Mason, Ohio 45040 Phone: (513) 398-0115, Fax: (513) 398-2684
11 other hotels and motels
All 19 fire-safe hotels and motels in Mason, Ohio
Most common first names in Mason, OH among deceased individuals Name Count Lived (average)
Mary 86 80.0 years James 78 69.3 years John 77 72.4 years William 76 74.1 years Robert 73 74.5 years Ruth 62 84.4 years Charles 56 76.2 years George 50 77.2 years Dorothy 47 80.3 years Helen 44 80.9 years
Most common last names in Mason, OH among deceased individuals Last name Count Lived (average)
Smith 32 76.1 years Jones 29 77.9 years Miller 24 77.2 years Johnson 21 69.1 years Davis 20 78.7 years Wilson 19 74.7 years Thompson 17 72.8 years Williams 16 75.4 years Brown 16 79.9 years Clark 16 77.7 years
Mason compared to Ohio state average:
Median household income above state average. Median house value above state average. Unemployed percentage significantly below state average. Foreign-born population percentage significantly above state average. Renting percentage below state average. Length of stay since moving in significantly above state average. Number of rooms per house above state average. House age significantly below state average. Percentage of population with a bachelor's degree or higher significantly above state average.
#50 on the list of "Top 101 cities with the largest racial income disparity between any two races with at least 200 householders"
#30 on the list of "Top 101 counties with the largest decrease in the number of births per 1000 residents 2000-2006 to 2007-2013 (pop 50,000+)"
#71 on the list of "Top 101 counties with the lowest surface withdrawal of fresh water for public supply (pop. 50,000+)"
Top Patent Applicants
Foster B. Stulen (130)
John A. Hibner (128)
Mark S. Zeiner (126)
Jason L. Harris (112)
Gregory J. Bakos (110)
Shailendra K. Parihar (103)
Mark Robert Sivik (84)
Dimitris Ioannis Collias (59)
Faiz Feisal Sherman (50)
Nicholas Joseph Kray (49)
Total of 3748 patent applications in 2008-2024.
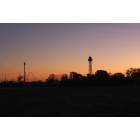

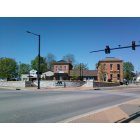
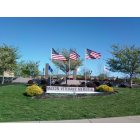

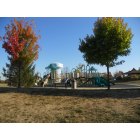


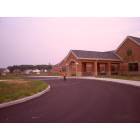


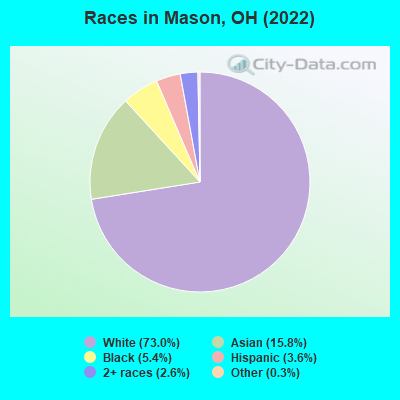
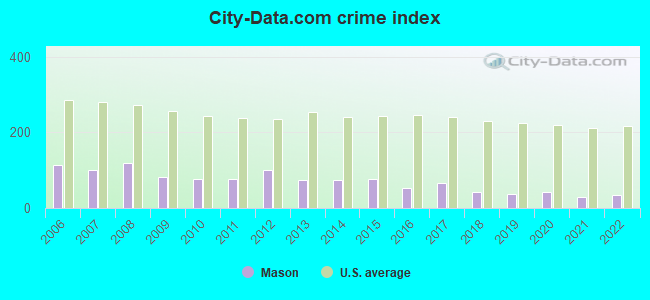
 Recent articles from our blog. Our writers, many of them Ph.D. graduates or candidates, create easy-to-read articles on a wide variety of topics.


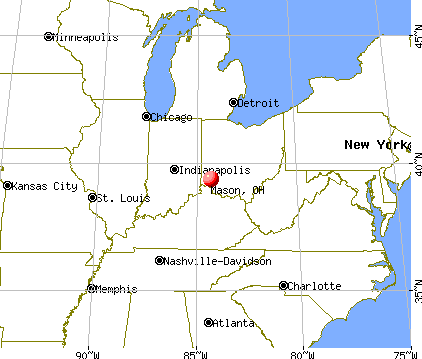
 (10.8 miles
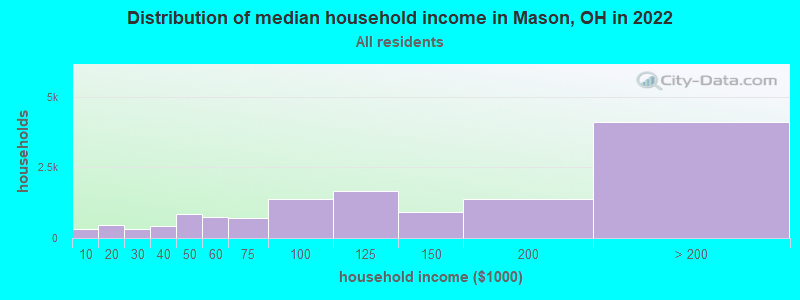
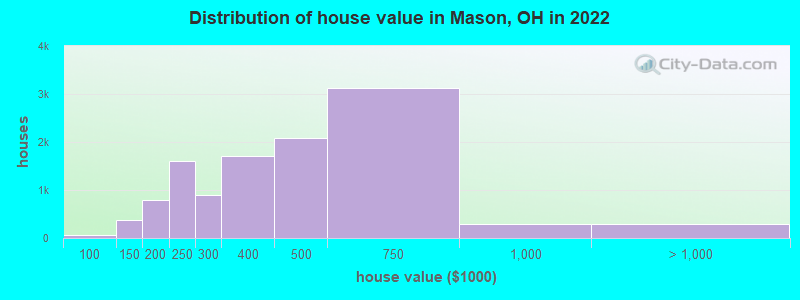
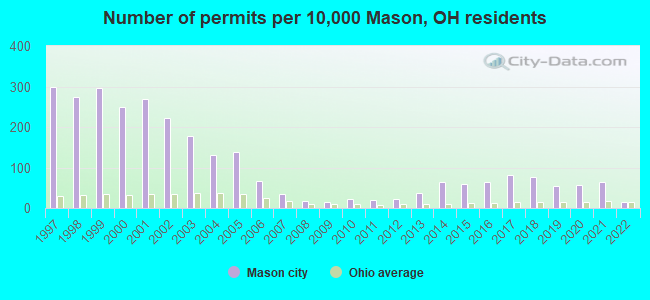
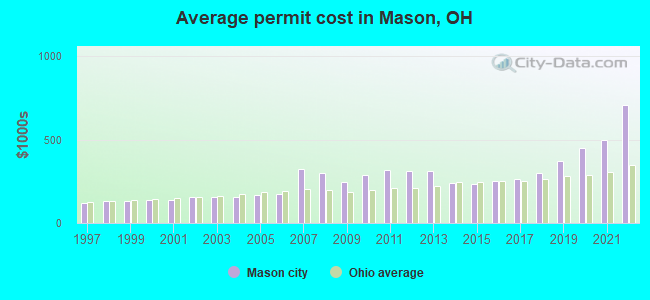
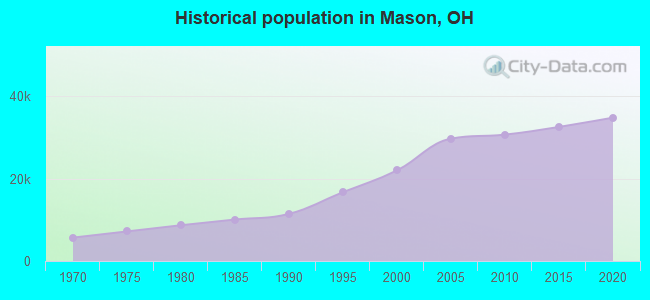
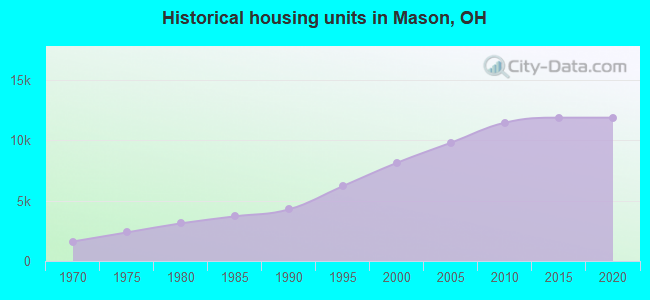
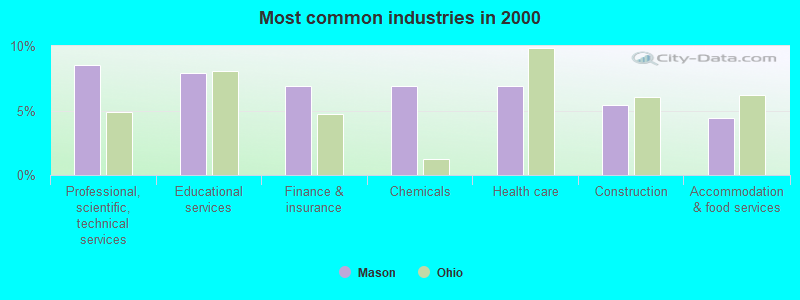
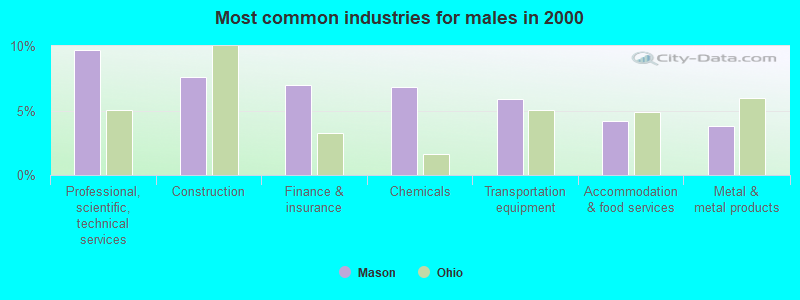
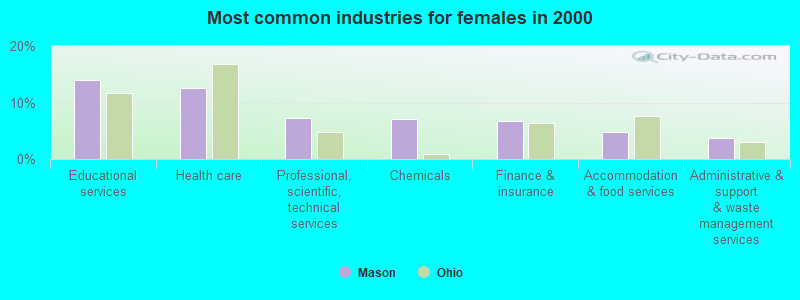
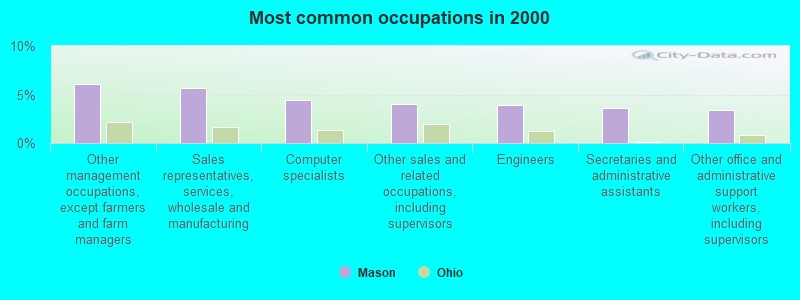
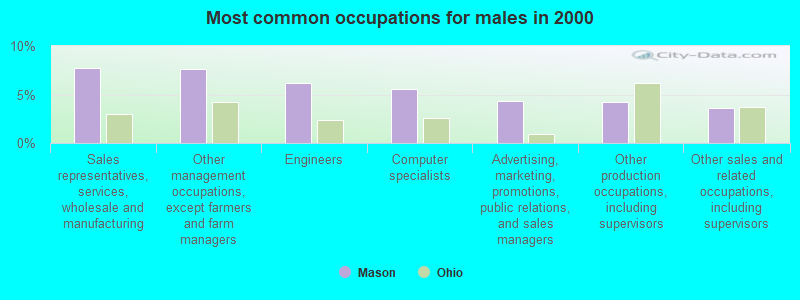
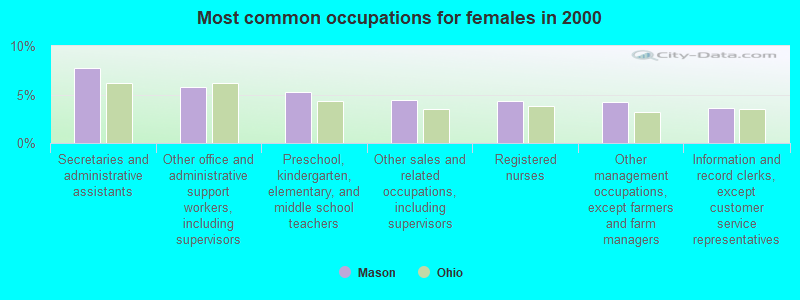
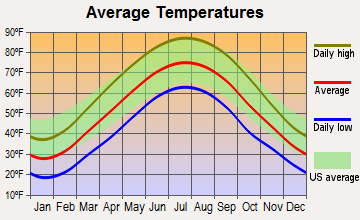
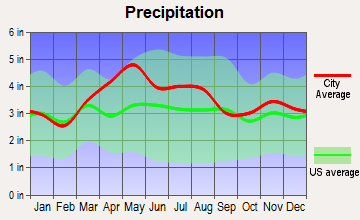
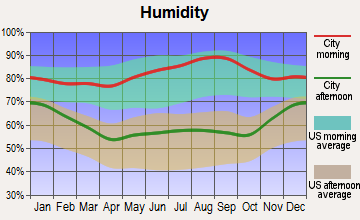
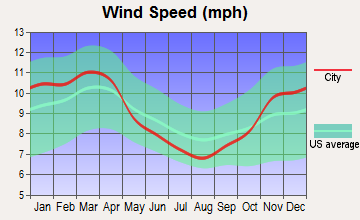
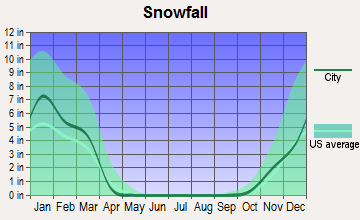
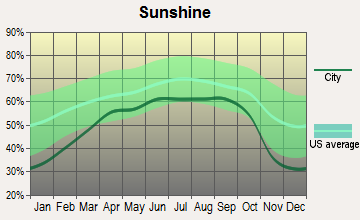
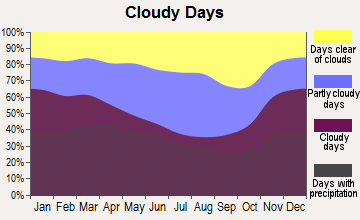


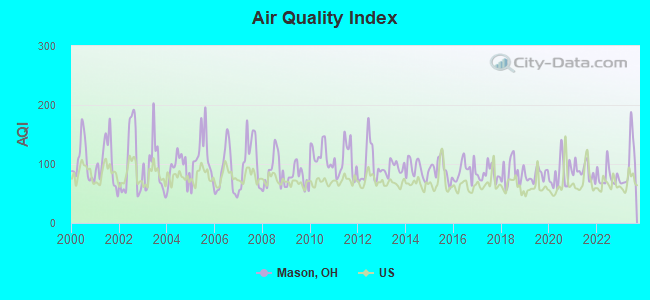
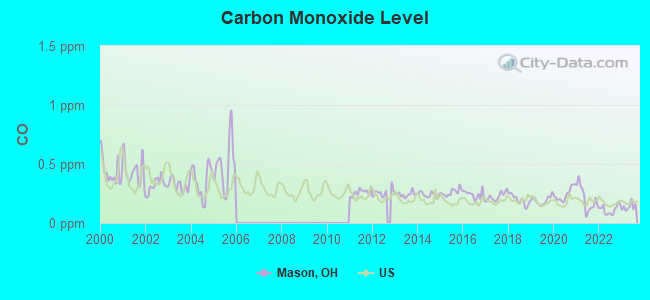
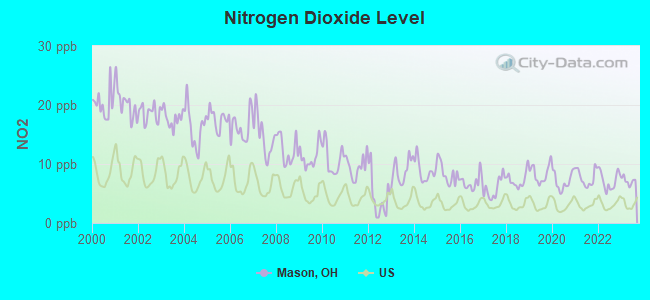
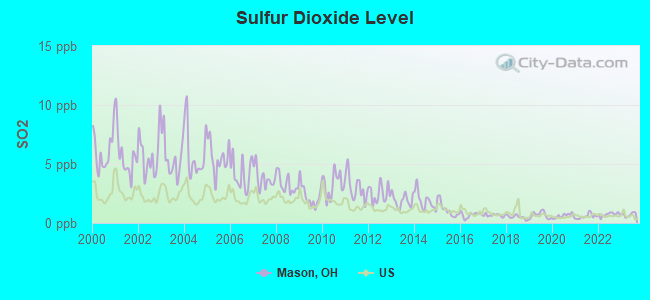
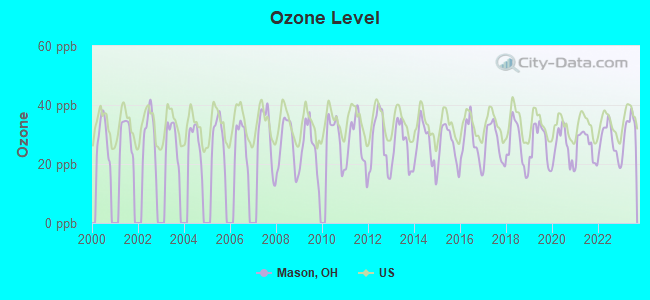
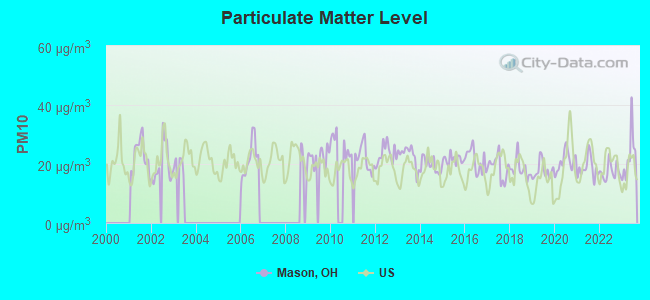
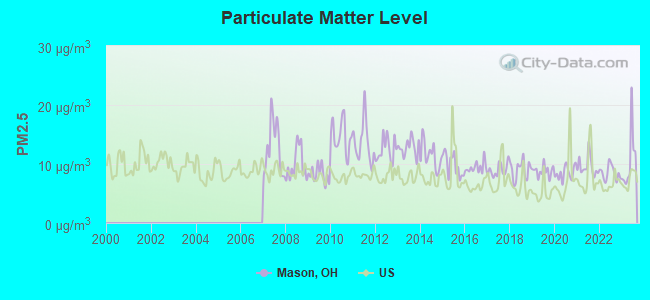

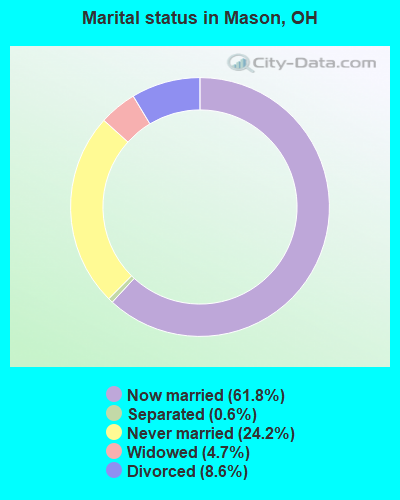
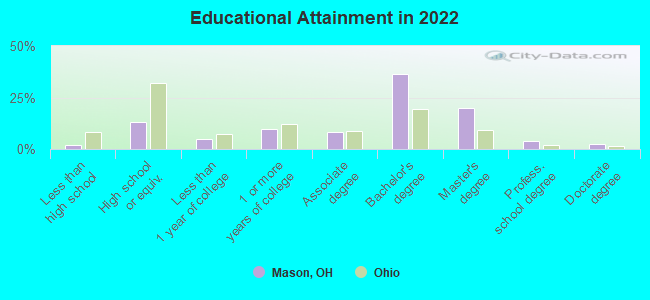
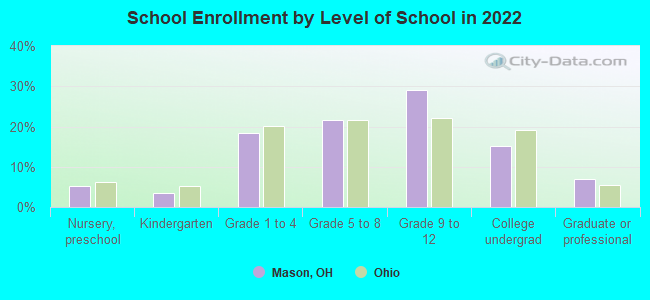
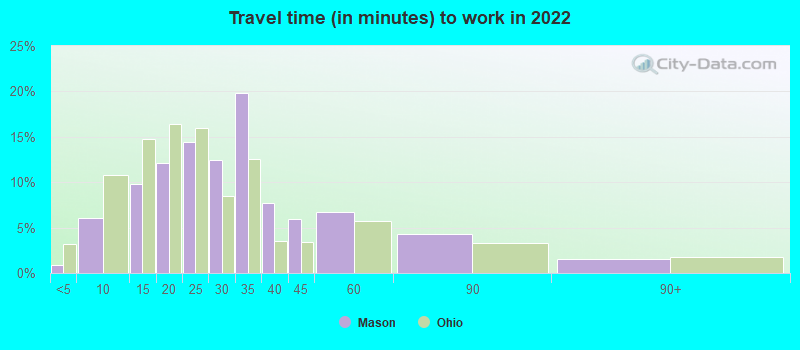
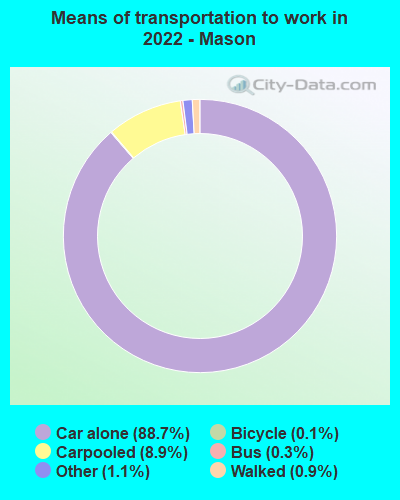
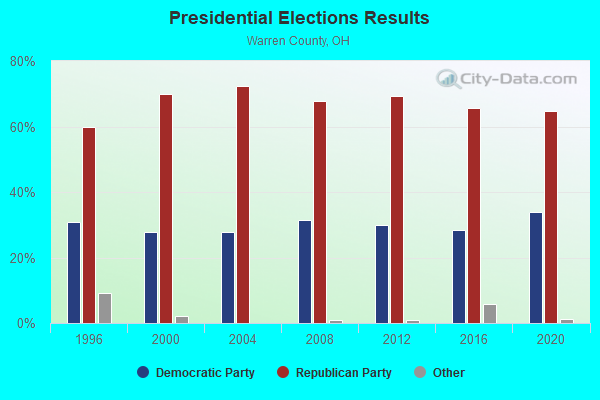
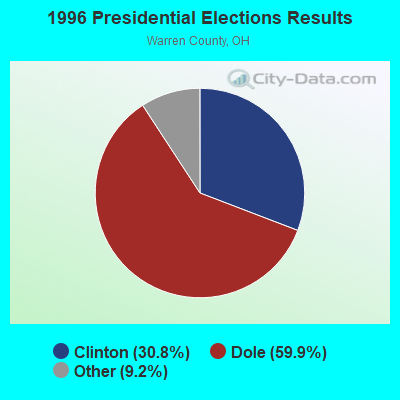

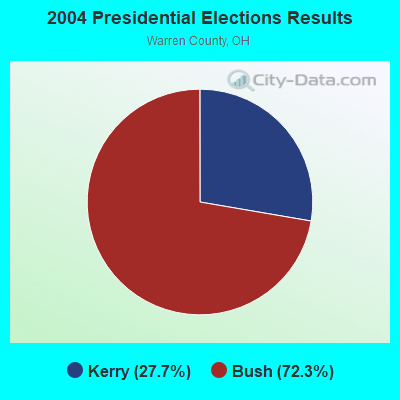
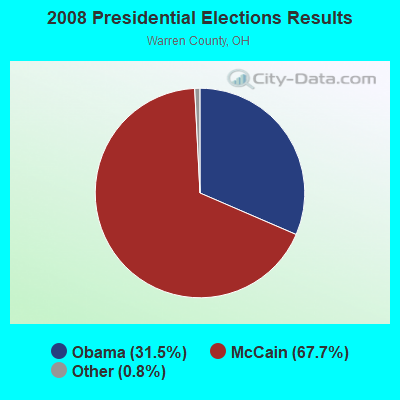
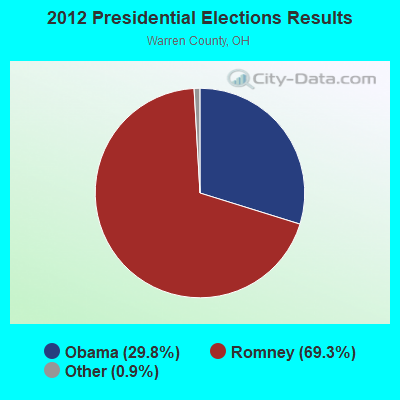
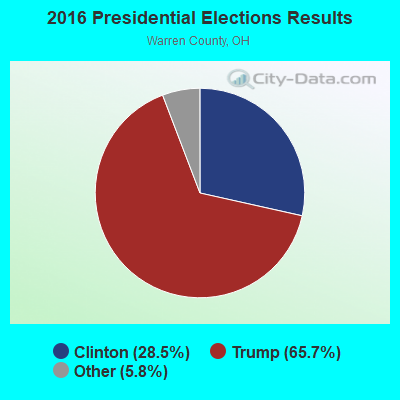

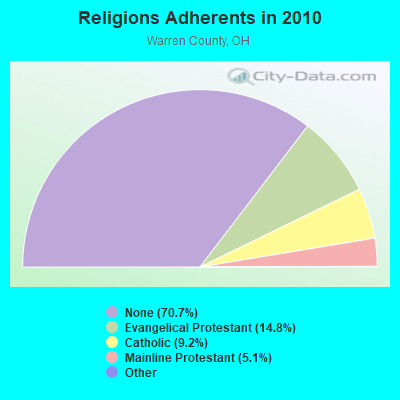
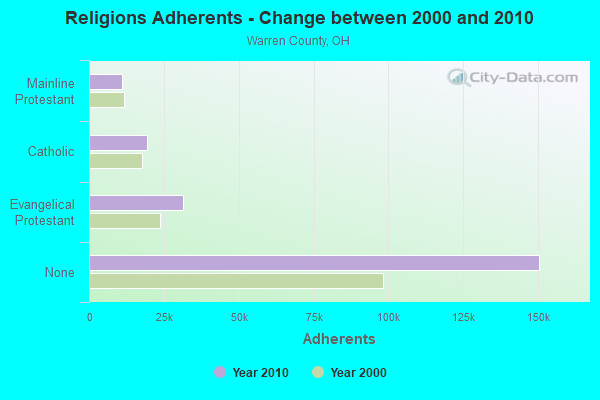
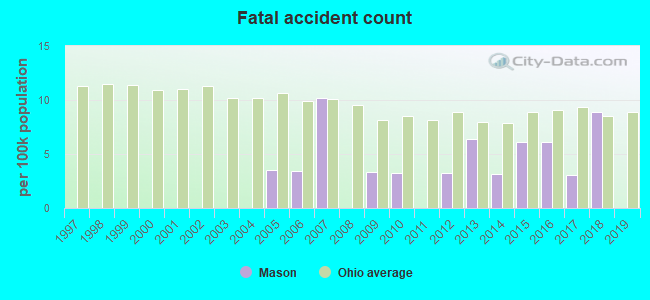
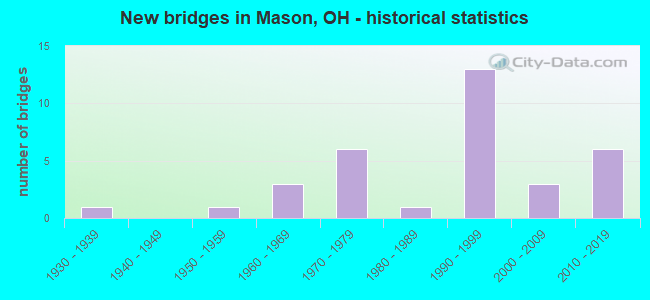
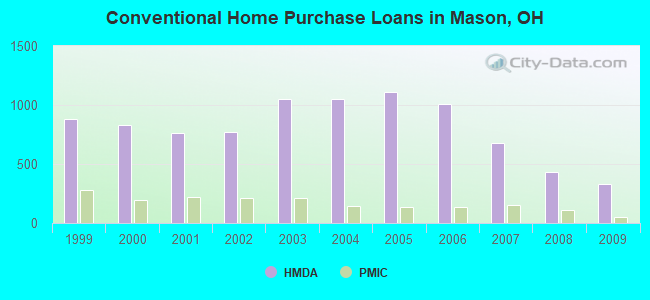
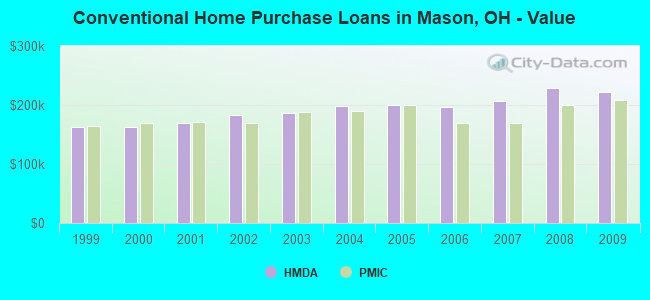
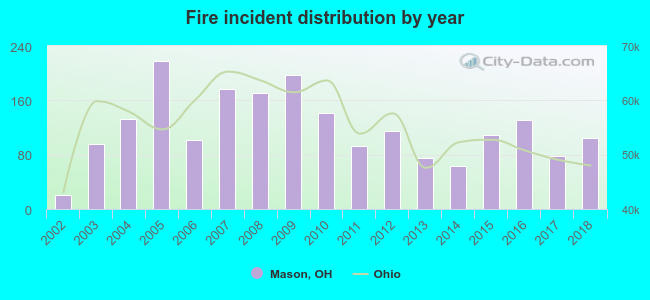 According to the data from the years 2002 - 2018 the average number of fires per year is 119. The highest number of fire incidents - 218 took place in 2005, and the least - 21 in 2002. The data has an increasing trend.
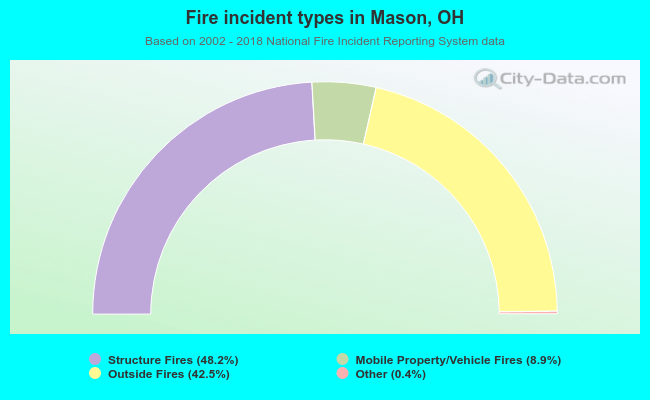 When looking into fire subcategories, the most incidents belonged to: Structure Fires (48.2%), and Outside Fires (42.5%).