Massillon, Ohio Submit your own pictures of this city and show them to the world
OSM Map
General Map
Google Map
MSN Map
OSM Map
General Map
Google Map
MSN Map
OSM Map
General Map
Google Map
MSN Map
OSM Map
General Map
Google Map
MSN Map
Please wait while loading the map...
Population in 2022: 32,292 (100% urban, 0% rural). Population change since 2000: +3.1%Males: 15,935 Females: 16,357
March 2022 cost of living index in Massillon: 89.1 (less than average, U.S. average is 100) Percentage of residents living in poverty in 2022: 14.5%for White Non-Hispanic residents , 37.1% for Black residents , 30.1% for Hispanic or Latino residents , 5.3% for American Indian residents , 29.8% for other race residents , 24.1% for two or more races residents )
Profiles of local businesses
Business Search - 14 Million verified businesses
Data:
Median household income ($)
Median household income (% change since 2000)
Household income diversity
Ratio of average income to average house value (%)
Ratio of average income to average rent
Median household income ($) - White
Median household income ($) - Black or African American
Median household income ($) - Asian
Median household income ($) - Hispanic or Latino
Median household income ($) - American Indian and Alaska Native
Median household income ($) - Multirace
Median household income ($) - Other Race
Median household income for houses/condos with a mortgage ($)
Median household income for apartments without a mortgage ($)
Races - White alone (%)
Races - White alone (% change since 2000)
Races - Black alone (%)
Races - Black alone (% change since 2000)
Races - American Indian alone (%)
Races - American Indian alone (% change since 2000)
Races - Asian alone (%)
Races - Asian alone (% change since 2000)
Races - Hispanic (%)
Races - Hispanic (% change since 2000)
Races - Native Hawaiian and Other Pacific Islander alone (%)
Races - Native Hawaiian and Other Pacific Islander alone (% change since 2000)
Races - Two or more races (%)
Races - Two or more races (% change since 2000)
Races - Other race alone (%)
Races - Other race alone (% change since 2000)
Racial diversity
Unemployment (%)
Unemployment (% change since 2000)
Unemployment (%) - White
Unemployment (%) - Black or African American
Unemployment (%) - Asian
Unemployment (%) - Hispanic or Latino
Unemployment (%) - American Indian and Alaska Native
Unemployment (%) - Multirace
Unemployment (%) - Other Race
Population density (people per square mile)
Population - Males (%)
Population - Females (%)
Population - Males (%) - White
Population - Males (%) - Black or African American
Population - Males (%) - Asian
Population - Males (%) - Hispanic or Latino
Population - Males (%) - American Indian and Alaska Native
Population - Males (%) - Multirace
Population - Males (%) - Other Race
Population - Females (%) - White
Population - Females (%) - Black or African American
Population - Females (%) - Asian
Population - Females (%) - Hispanic or Latino
Population - Females (%) - American Indian and Alaska Native
Population - Females (%) - Multirace
Population - Females (%) - Other Race
Coronavirus confirmed cases (Apr 17, 2024)
Deaths caused by coronavirus (Apr 17, 2024)
Coronavirus confirmed cases (per 100k population) (Apr 17, 2024)
Deaths caused by coronavirus (per 100k population) (Apr 17, 2024)
Daily increase in number of cases (Apr 17, 2024)
Weekly increase in number of cases (Apr 17, 2024)
Cases doubled (in days) (Apr 17, 2024)
Hospitalized patients (Apr 18, 2022)
Negative test results (Apr 18, 2022)
Total test results (Apr 18, 2022)
COVID Vaccine doses distributed (per 100k population) (Sep 19, 2023)
COVID Vaccine doses administered (per 100k population) (Sep 19, 2023)
COVID Vaccine doses distributed (Sep 19, 2023)
COVID Vaccine doses administered (Sep 19, 2023)
Likely homosexual households (%)
Likely homosexual households (% change since 2000)
Likely homosexual households - Lesbian couples (%)
Likely homosexual households - Lesbian couples (% change since 2000)
Likely homosexual households - Gay men (%)
Likely homosexual households - Gay men (% change since 2000)
Cost of living index
Median gross rent ($)
Median contract rent ($)
Median monthly housing costs ($)
Median house or condo value ($)
Median house or condo value ($ change since 2000)
Mean house or condo value by units in structure - 1, detached ($)
Mean house or condo value by units in structure - 1, attached ($)
Mean house or condo value by units in structure - 2 ($)
Mean house or condo value by units in structure by units in structure - 3 or 4 ($)
Mean house or condo value by units in structure - 5 or more ($)
Mean house or condo value by units in structure - Boat, RV, van, etc. ($)
Mean house or condo value by units in structure - Mobile home ($)
Median house or condo value ($) - White
Median house or condo value ($) - Black or African American
Median house or condo value ($) - Asian
Median house or condo value ($) - Hispanic or Latino
Median house or condo value ($) - American Indian and Alaska Native
Median house or condo value ($) - Multirace
Median house or condo value ($) - Other Race
Median resident age
Resident age diversity
Median resident age - Males
Median resident age - Females
Median resident age - White
Median resident age - Black or African American
Median resident age - Asian
Median resident age - Hispanic or Latino
Median resident age - American Indian and Alaska Native
Median resident age - Multirace
Median resident age - Other Race
Median resident age - Males - White
Median resident age - Males - Black or African American
Median resident age - Males - Asian
Median resident age - Males - Hispanic or Latino
Median resident age - Males - American Indian and Alaska Native
Median resident age - Males - Multirace
Median resident age - Males - Other Race
Median resident age - Females - White
Median resident age - Females - Black or African American
Median resident age - Females - Asian
Median resident age - Females - Hispanic or Latino
Median resident age - Females - American Indian and Alaska Native
Median resident age - Females - Multirace
Median resident age - Females - Other Race
Commute - mean travel time to work (minutes)
Travel time to work - Less than 5 minutes (%)
Travel time to work - Less than 5 minutes (% change since 2000)
Travel time to work - 5 to 9 minutes (%)
Travel time to work - 5 to 9 minutes (% change since 2000)
Travel time to work - 10 to 19 minutes (%)
Travel time to work - 10 to 19 minutes (% change since 2000)
Travel time to work - 20 to 29 minutes (%)
Travel time to work - 20 to 29 minutes (% change since 2000)
Travel time to work - 30 to 39 minutes (%)
Travel time to work - 30 to 39 minutes (% change since 2000)
Travel time to work - 40 to 59 minutes (%)
Travel time to work - 40 to 59 minutes (% change since 2000)
Travel time to work - 60 to 89 minutes (%)
Travel time to work - 60 to 89 minutes (% change since 2000)
Travel time to work - 90 or more minutes (%)
Travel time to work - 90 or more minutes (% change since 2000)
Marital status - Never married (%)
Marital status - Now married (%)
Marital status - Separated (%)
Marital status - Widowed (%)
Marital status - Divorced (%)
Median family income ($)
Median family income (% change since 2000)
Median non-family income ($)
Median non-family income (% change since 2000)
Median per capita income ($)
Median per capita income (% change since 2000)
Median family income ($) - White
Median family income ($) - Black or African American
Median family income ($) - Asian
Median family income ($) - Hispanic or Latino
Median family income ($) - American Indian and Alaska Native
Median family income ($) - Multirace
Median family income ($) - Other Race
Median year house/condo built
Median year apartment built
Year house built - Built 2005 or later (%)
Year house built - Built 2000 to 2004 (%)
Year house built - Built 1990 to 1999 (%)
Year house built - Built 1980 to 1989 (%)
Year house built - Built 1970 to 1979 (%)
Year house built - Built 1960 to 1969 (%)
Year house built - Built 1950 to 1959 (%)
Year house built - Built 1940 to 1949 (%)
Year house built - Built 1939 or earlier (%)
Average household size
Household density (households per square mile)
Average household size - White
Average household size - Black or African American
Average household size - Asian
Average household size - Hispanic or Latino
Average household size - American Indian and Alaska Native
Average household size - Multirace
Average household size - Other Race
Occupied housing units (%)
Vacant housing units (%)
Owner occupied housing units (%)
Renter occupied housing units (%)
Vacancy status - For rent (%)
Vacancy status - For sale only (%)
Vacancy status - Rented or sold, not occupied (%)
Vacancy status - For seasonal, recreational, or occasional use (%)
Vacancy status - For migrant workers (%)
Vacancy status - Other vacant (%)
Residents with income below the poverty level (%)
Residents with income below 50% of the poverty level (%)
Children below poverty level (%)
Poor families by family type - Married-couple family (%)
Poor families by family type - Male, no wife present (%)
Poor families by family type - Female, no husband present (%)
Poverty status for native-born residents (%)
Poverty status for foreign-born residents (%)
Poverty among high school graduates not in families (%)
Poverty among people who did not graduate high school not in families (%)
Residents with income below the poverty level (%) - White
Residents with income below the poverty level (%) - Black or African American
Residents with income below the poverty level (%) - Asian
Residents with income below the poverty level (%) - Hispanic or Latino
Residents with income below the poverty level (%) - American Indian and Alaska Native
Residents with income below the poverty level (%) - Multirace
Residents with income below the poverty level (%) - Other Race
Air pollution - Air Quality Index (AQI)
Air pollution - CO
Air pollution - NO2
Air pollution - SO2
Air pollution - Ozone
Air pollution - PM10
Air pollution - PM25
Air pollution - Pb
Crime - Murders per 100,000 population
Crime - Rapes per 100,000 population
Crime - Robberies per 100,000 population
Crime - Assaults per 100,000 population
Crime - Burglaries per 100,000 population
Crime - Thefts per 100,000 population
Crime - Auto thefts per 100,000 population
Crime - Arson per 100,000 population
Crime - City-data.com crime index
Crime - Violent crime index
Crime - Property crime index
Crime - Murders per 100,000 population (5 year average)
Crime - Rapes per 100,000 population (5 year average)
Crime - Robberies per 100,000 population (5 year average)
Crime - Assaults per 100,000 population (5 year average)
Crime - Burglaries per 100,000 population (5 year average)
Crime - Thefts per 100,000 population (5 year average)
Crime - Auto thefts per 100,000 population (5 year average)
Crime - Arson per 100,000 population (5 year average)
Crime - City-data.com crime index (5 year average)
Crime - Violent crime index (5 year average)
Crime - Property crime index (5 year average)
1996 Presidential Elections Results (%) - Democratic Party (Clinton)
1996 Presidential Elections Results (%) - Republican Party (Dole)
1996 Presidential Elections Results (%) - Other
2000 Presidential Elections Results (%) - Democratic Party (Gore)
2000 Presidential Elections Results (%) - Republican Party (Bush)
2000 Presidential Elections Results (%) - Other
2004 Presidential Elections Results (%) - Democratic Party (Kerry)
2004 Presidential Elections Results (%) - Republican Party (Bush)
2004 Presidential Elections Results (%) - Other
2008 Presidential Elections Results (%) - Democratic Party (Obama)
2008 Presidential Elections Results (%) - Republican Party (McCain)
2008 Presidential Elections Results (%) - Other
2012 Presidential Elections Results (%) - Democratic Party (Obama)
2012 Presidential Elections Results (%) - Republican Party (Romney)
2012 Presidential Elections Results (%) - Other
2016 Presidential Elections Results (%) - Democratic Party (Clinton)
2016 Presidential Elections Results (%) - Republican Party (Trump)
2016 Presidential Elections Results (%) - Other
2020 Presidential Elections Results (%) - Democratic Party (Biden)
2020 Presidential Elections Results (%) - Republican Party (Trump)
2020 Presidential Elections Results (%) - Other
Ancestries Reported - Arab (%)
Ancestries Reported - Czech (%)
Ancestries Reported - Danish (%)
Ancestries Reported - Dutch (%)
Ancestries Reported - English (%)
Ancestries Reported - French (%)
Ancestries Reported - French Canadian (%)
Ancestries Reported - German (%)
Ancestries Reported - Greek (%)
Ancestries Reported - Hungarian (%)
Ancestries Reported - Irish (%)
Ancestries Reported - Italian (%)
Ancestries Reported - Lithuanian (%)
Ancestries Reported - Norwegian (%)
Ancestries Reported - Polish (%)
Ancestries Reported - Portuguese (%)
Ancestries Reported - Russian (%)
Ancestries Reported - Scotch-Irish (%)
Ancestries Reported - Scottish (%)
Ancestries Reported - Slovak (%)
Ancestries Reported - Subsaharan African (%)
Ancestries Reported - Swedish (%)
Ancestries Reported - Swiss (%)
Ancestries Reported - Ukrainian (%)
Ancestries Reported - United States (%)
Ancestries Reported - Welsh (%)
Ancestries Reported - West Indian (%)
Ancestries Reported - Other (%)
Educational Attainment - No schooling completed (%)
Educational Attainment - Less than high school (%)
Educational Attainment - High school or equivalent (%)
Educational Attainment - Less than 1 year of college (%)
Educational Attainment - 1 or more years of college (%)
Educational Attainment - Associate degree (%)
Educational Attainment - Bachelor's degree (%)
Educational Attainment - Master's degree (%)
Educational Attainment - Professional school degree (%)
Educational Attainment - Doctorate degree (%)
School Enrollment - Nursery, preschool (%)
School Enrollment - Kindergarten (%)
School Enrollment - Grade 1 to 4 (%)
School Enrollment - Grade 5 to 8 (%)
School Enrollment - Grade 9 to 12 (%)
School Enrollment - College undergrad (%)
School Enrollment - Graduate or professional (%)
School Enrollment - Not enrolled in school (%)
School enrollment - Public schools (%)
School enrollment - Private schools (%)
School enrollment - Not enrolled (%)
Median number of rooms in houses and condos
Median number of rooms in apartments
Housing units lacking complete plumbing facilities (%)
Housing units lacking complete kitchen facilities (%)
Density of houses
Urban houses (%)
Rural houses (%)
Households with people 60 years and over (%)
Households with people 65 years and over (%)
Households with people 75 years and over (%)
Households with one or more nonrelatives (%)
Households with no nonrelatives (%)
Population in households (%)
Family households (%)
Nonfamily households (%)
Population in families (%)
Family households with own children (%)
Median number of bedrooms in owner occupied houses
Mean number of bedrooms in owner occupied houses
Median number of bedrooms in renter occupied houses
Mean number of bedrooms in renter occupied houses
Median number of vehichles in owner occupied houses
Mean number of vehichles in owner occupied houses
Median number of vehichles in renter occupied houses
Mean number of vehichles in renter occupied houses
Mortgage status - with mortgage (%)
Mortgage status - with second mortgage (%)
Mortgage status - with home equity loan (%)
Mortgage status - with both second mortgage and home equity loan (%)
Mortgage status - without a mortgage (%)
Average family size
Average family size - White
Average family size - Black or African American
Average family size - Asian
Average family size - Hispanic or Latino
Average family size - American Indian and Alaska Native
Average family size - Multirace
Average family size - Other Race
Geographical mobility - Same house 1 year ago (%)
Geographical mobility - Moved within same county (%)
Geographical mobility - Moved from different county within same state (%)
Geographical mobility - Moved from different state (%)
Geographical mobility - Moved from abroad (%)
Place of birth - Born in state of residence (%)
Place of birth - Born in other state (%)
Place of birth - Native, outside of US (%)
Place of birth - Foreign born (%)
Housing units in structures - 1, detached (%)
Housing units in structures - 1, attached (%)
Housing units in structures - 2 (%)
Housing units in structures - 3 or 4 (%)
Housing units in structures - 5 to 9 (%)
Housing units in structures - 10 to 19 (%)
Housing units in structures - 20 to 49 (%)
Housing units in structures - 50 or more (%)
Housing units in structures - Mobile home (%)
Housing units in structures - Boat, RV, van, etc. (%)
House/condo owner moved in on average (years ago)
Renter moved in on average (years ago)
Year householder moved into unit - Moved in 1999 to March 2000 (%)
Year householder moved into unit - Moved in 1995 to 1998 (%)
Year householder moved into unit - Moved in 1990 to 1994 (%)
Year householder moved into unit - Moved in 1980 to 1989 (%)
Year householder moved into unit - Moved in 1970 to 1979 (%)
Year householder moved into unit - Moved in 1969 or earlier (%)
Means of transportation to work - Drove car alone (%)
Means of transportation to work - Carpooled (%)
Means of transportation to work - Public transportation (%)
Means of transportation to work - Bus or trolley bus (%)
Means of transportation to work - Streetcar or trolley car (%)
Means of transportation to work - Subway or elevated (%)
Means of transportation to work - Railroad (%)
Means of transportation to work - Ferryboat (%)
Means of transportation to work - Taxicab (%)
Means of transportation to work - Motorcycle (%)
Means of transportation to work - Bicycle (%)
Means of transportation to work - Walked (%)
Means of transportation to work - Other means (%)
Working at home (%)
Industry diversity
Most Common Industries - Agriculture, forestry, fishing and hunting, and mining (%)
Most Common Industries - Agriculture, forestry, fishing and hunting (%)
Most Common Industries - Mining, quarrying, and oil and gas extraction (%)
Most Common Industries - Construction (%)
Most Common Industries - Manufacturing (%)
Most Common Industries - Wholesale trade (%)
Most Common Industries - Retail trade (%)
Most Common Industries - Transportation and warehousing, and utilities (%)
Most Common Industries - Transportation and warehousing (%)
Most Common Industries - Utilities (%)
Most Common Industries - Information (%)
Most Common Industries - Finance and insurance, and real estate and rental and leasing (%)
Most Common Industries - Finance and insurance (%)
Most Common Industries - Real estate and rental and leasing (%)
Most Common Industries - Professional, scientific, and management, and administrative and waste management services (%)
Most Common Industries - Professional, scientific, and technical services (%)
Most Common Industries - Management of companies and enterprises (%)
Most Common Industries - Administrative and support and waste management services (%)
Most Common Industries - Educational services, and health care and social assistance (%)
Most Common Industries - Educational services (%)
Most Common Industries - Health care and social assistance (%)
Most Common Industries - Arts, entertainment, and recreation, and accommodation and food services (%)
Most Common Industries - Arts, entertainment, and recreation (%)
Most Common Industries - Accommodation and food services (%)
Most Common Industries - Other services, except public administration (%)
Most Common Industries - Public administration (%)
Occupation diversity
Most Common Occupations - Management, business, science, and arts occupations (%)
Most Common Occupations - Management, business, and financial occupations (%)
Most Common Occupations - Management occupations (%)
Most Common Occupations - Business and financial operations occupations (%)
Most Common Occupations - Computer, engineering, and science occupations (%)
Most Common Occupations - Computer and mathematical occupations (%)
Most Common Occupations - Architecture and engineering occupations (%)
Most Common Occupations - Life, physical, and social science occupations (%)
Most Common Occupations - Education, legal, community service, arts, and media occupations (%)
Most Common Occupations - Community and social service occupations (%)
Most Common Occupations - Legal occupations (%)
Most Common Occupations - Education, training, and library occupations (%)
Most Common Occupations - Arts, design, entertainment, sports, and media occupations (%)
Most Common Occupations - Healthcare practitioners and technical occupations (%)
Most Common Occupations - Health diagnosing and treating practitioners and other technical occupations (%)
Most Common Occupations - Health technologists and technicians (%)
Most Common Occupations - Service occupations (%)
Most Common Occupations - Healthcare support occupations (%)
Most Common Occupations - Protective service occupations (%)
Most Common Occupations - Fire fighting and prevention, and other protective service workers including supervisors (%)
Most Common Occupations - Law enforcement workers including supervisors (%)
Most Common Occupations - Food preparation and serving related occupations (%)
Most Common Occupations - Building and grounds cleaning and maintenance occupations (%)
Most Common Occupations - Personal care and service occupations (%)
Most Common Occupations - Sales and office occupations (%)
Most Common Occupations - Sales and related occupations (%)
Most Common Occupations - Office and administrative support occupations (%)
Most Common Occupations - Natural resources, construction, and maintenance occupations (%)
Most Common Occupations - Farming, fishing, and forestry occupations (%)
Most Common Occupations - Construction and extraction occupations (%)
Most Common Occupations - Installation, maintenance, and repair occupations (%)
Most Common Occupations - Production, transportation, and material moving occupations (%)
Most Common Occupations - Production occupations (%)
Most Common Occupations - Transportation occupations (%)
Most Common Occupations - Material moving occupations (%)
People in Group quarters - Institutionalized population (%)
People in Group quarters - Correctional institutions (%)
People in Group quarters - Federal prisons and detention centers (%)
People in Group quarters - Halfway houses (%)
People in Group quarters - Local jails and other confinement facilities (including police lockups) (%)
People in Group quarters - Military disciplinary barracks (%)
People in Group quarters - State prisons (%)
People in Group quarters - Other types of correctional institutions (%)
People in Group quarters - Nursing homes (%)
People in Group quarters - Hospitals/wards, hospices, and schools for the handicapped (%)
People in Group quarters - Hospitals/wards and hospices for chronically ill (%)
People in Group quarters - Hospices or homes for chronically ill (%)
People in Group quarters - Military hospitals or wards for chronically ill (%)
People in Group quarters - Other hospitals or wards for chronically ill (%)
People in Group quarters - Hospitals or wards for drug/alcohol abuse (%)
People in Group quarters - Mental (Psychiatric) hospitals or wards (%)
People in Group quarters - Schools, hospitals, or wards for the mentally retarded (%)
People in Group quarters - Schools, hospitals, or wards for the physically handicapped (%)
People in Group quarters - Institutions for the deaf (%)
People in Group quarters - Institutions for the blind (%)
People in Group quarters - Orthopedic wards and institutions for the physically handicapped (%)
People in Group quarters - Wards in general hospitals for patients who have no usual home elsewhere (%)
People in Group quarters - Wards in military hospitals for patients who have no usual home elsewhere (%)
People in Group quarters - Juvenile institutions (%)
People in Group quarters - Long-term care (%)
People in Group quarters - Homes for abused, dependent, and neglected children (%)
People in Group quarters - Residential treatment centers for emotionally disturbed children (%)
People in Group quarters - Training schools for juvenile delinquents (%)
People in Group quarters - Short-term care, detention or diagnostic centers for delinquent children (%)
People in Group quarters - Type of juvenile institution unknown (%)
People in Group quarters - Noninstitutionalized population (%)
People in Group quarters - College dormitories (includes college quarters off campus) (%)
People in Group quarters - Military quarters (%)
People in Group quarters - On base (%)
People in Group quarters - Barracks, unaccompanied personnel housing (UPH), (Enlisted/Officer), ;and similar group living quarters for military personnel (%)
People in Group quarters - Transient quarters for temporary residents (%)
People in Group quarters - Military ships (%)
People in Group quarters - Group homes (%)
People in Group quarters - Homes or halfway houses for drug/alcohol abuse (%)
People in Group quarters - Homes for the mentally ill (%)
People in Group quarters - Homes for the mentally retarded (%)
People in Group quarters - Homes for the physically handicapped (%)
People in Group quarters - Other group homes (%)
People in Group quarters - Religious group quarters (%)
People in Group quarters - Dormitories (%)
People in Group quarters - Agriculture workers' dormitories on farms (%)
People in Group quarters - Job Corps and vocational training facilities (%)
People in Group quarters - Other workers' dormitories (%)
People in Group quarters - Crews of maritime vessels (%)
People in Group quarters - Other nonhousehold living situations (%)
People in Group quarters - Other noninstitutional group quarters (%)
Residents speaking English at home (%)
Residents speaking English at home - Born in the United States (%)
Residents speaking English at home - Native, born elsewhere (%)
Residents speaking English at home - Foreign born (%)
Residents speaking Spanish at home (%)
Residents speaking Spanish at home - Born in the United States (%)
Residents speaking Spanish at home - Native, born elsewhere (%)
Residents speaking Spanish at home - Foreign born (%)
Residents speaking other language at home (%)
Residents speaking other language at home - Born in the United States (%)
Residents speaking other language at home - Native, born elsewhere (%)
Residents speaking other language at home - Foreign born (%)
Class of Workers - Employee of private company (%)
Class of Workers - Self-employed in own incorporated business (%)
Class of Workers - Private not-for-profit wage and salary workers (%)
Class of Workers - Local government workers (%)
Class of Workers - State government workers (%)
Class of Workers - Federal government workers (%)
Class of Workers - Self-employed workers in own not incorporated business and Unpaid family workers (%)
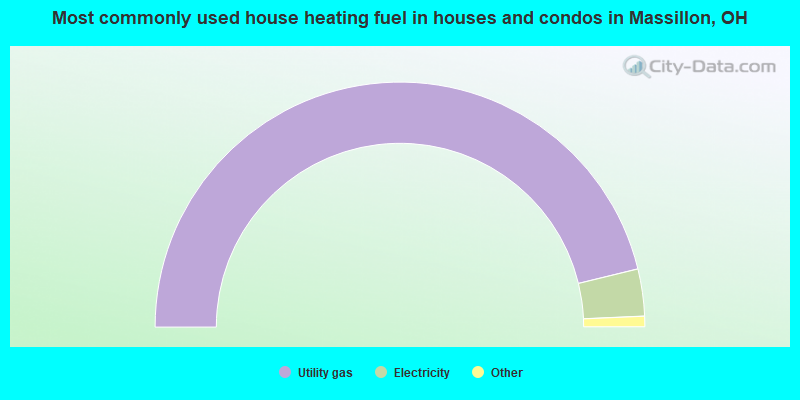
House heating fuel used in houses and condos - Utility gas (%)
House heating fuel used in houses and condos - Bottled, tank, or LP gas (%)
House heating fuel used in houses and condos - Electricity (%)
House heating fuel used in houses and condos - Fuel oil, kerosene, etc. (%)
House heating fuel used in houses and condos - Coal or coke (%)
House heating fuel used in houses and condos - Wood (%)
House heating fuel used in houses and condos - Solar energy (%)
House heating fuel used in houses and condos - Other fuel (%)
House heating fuel used in houses and condos - No fuel used (%)
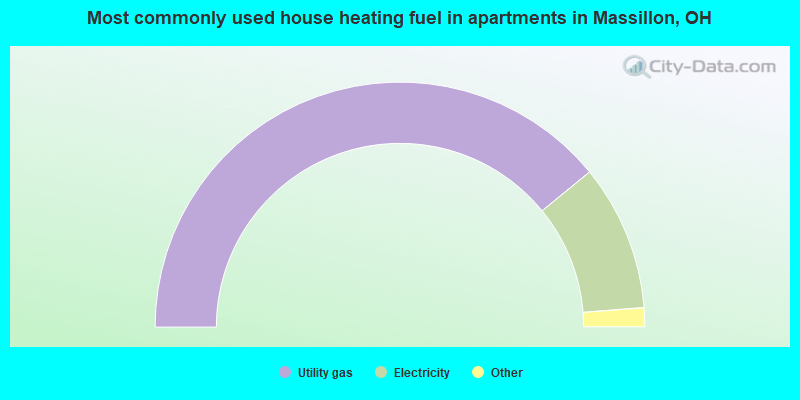
House heating fuel used in apartments - Utility gas (%)
House heating fuel used in apartments - Bottled, tank, or LP gas (%)
House heating fuel used in apartments - Electricity (%)
House heating fuel used in apartments - Fuel oil, kerosene, etc. (%)
House heating fuel used in apartments - Coal or coke (%)
House heating fuel used in apartments - Wood (%)
House heating fuel used in apartments - Solar energy (%)
House heating fuel used in apartments - Other fuel (%)
House heating fuel used in apartments - No fuel used (%)
Armed forces status - In Armed Forces (%)
Armed forces status - Civilian (%)
Armed forces status - Civilian - Veteran (%)
Armed forces status - Civilian - Nonveteran (%)
Fatal accidents locations in years 2005-2021
Fatal accidents locations in 2005
Fatal accidents locations in 2006
Fatal accidents locations in 2007
Fatal accidents locations in 2008
Fatal accidents locations in 2009
Fatal accidents locations in 2010
Fatal accidents locations in 2011
Fatal accidents locations in 2012
Fatal accidents locations in 2013
Fatal accidents locations in 2014
Fatal accidents locations in 2015
Fatal accidents locations in 2016
Fatal accidents locations in 2017
Fatal accidents locations in 2018
Fatal accidents locations in 2019
Fatal accidents locations in 2020
Fatal accidents locations in 2021
Alcohol use - People drinking some alcohol every month (%)
Alcohol use - People not drinking at all (%)
Alcohol use - Average days/month drinking alcohol
Alcohol use - Average drinks/week
Alcohol use - Average days/year people drink much
Audiometry - Average condition of hearing (%)
Audiometry - People that can hear a whisper from across a quiet room (%)
Audiometry - People that can hear normal voice from across a quiet room (%)
Audiometry - Ears ringing, roaring, buzzing (%)
Audiometry - Had a job exposure to loud noise (%)
Audiometry - Had off-work exposure to loud noise (%)
Blood Pressure & Cholesterol - Has high blood pressure (%)
Blood Pressure & Cholesterol - Checking blood pressure at home (%)
Blood Pressure & Cholesterol - Frequently checking blood cholesterol (%)
Blood Pressure & Cholesterol - Has high cholesterol level (%)
Consumer Behavior - Money monthly spent on food at supermarket/grocery store
Consumer Behavior - Money monthly spent on food at other stores
Consumer Behavior - Money monthly spent on eating out
Consumer Behavior - Money monthly spent on carryout/delivered foods
Consumer Behavior - Income spent on food at supermarket/grocery store (%)
Consumer Behavior - Income spent on food at other stores (%)
Consumer Behavior - Income spent on eating out (%)
Consumer Behavior - Income spent on carryout/delivered foods (%)
Current Health Status - General health condition (%)
Current Health Status - Blood donors (%)
Current Health Status - Has blood ever tested for HIV virus (%)
Current Health Status - Left-handed people (%)
Dermatology - People using sunscreen (%)
Diabetes - Diabetics (%)
Diabetes - Had a blood test for high blood sugar (%)
Diabetes - People taking insulin (%)
Diet Behavior & Nutrition - Diet health (%)
Diet Behavior & Nutrition - Milk product consumption (# of products/month)
Diet Behavior & Nutrition - Meals not home prepared (#/week)
Diet Behavior & Nutrition - Meals from fast food or pizza place (#/week)
Diet Behavior & Nutrition - Ready-to-eat foods (#/month)
Diet Behavior & Nutrition - Frozen meals/pizza (#/month)
Drug Use - People that ever used marijuana or hashish (%)
Drug Use - Ever used hard drugs (%)
Drug Use - Ever used any form of cocaine (%)
Drug Use - Ever used heroin (%)
Drug Use - Ever used methamphetamine (%)
Health Insurance - People covered by health insurance (%)
Kidney Conditions-Urology - Avg. # of times urinating at night
Medical Conditions - People with asthma (%)
Medical Conditions - People with anemia (%)
Medical Conditions - People with psoriasis (%)
Medical Conditions - People with overweight (%)
Medical Conditions - Elderly people having difficulties in thinking or remembering (%)
Medical Conditions - People who ever received blood transfusion (%)
Medical Conditions - People having trouble seeing even with glass/contacts (%)
Medical Conditions - People with arthritis (%)
Medical Conditions - People with gout (%)
Medical Conditions - People with congestive heart failure (%)
Medical Conditions - People with coronary heart disease (%)
Medical Conditions - People with angina pectoris (%)
Medical Conditions - People who ever had heart attack (%)
Medical Conditions - People who ever had stroke (%)
Medical Conditions - People with emphysema (%)
Medical Conditions - People with thyroid problem (%)
Medical Conditions - People with chronic bronchitis (%)
Medical Conditions - People with any liver condition (%)
Medical Conditions - People who ever had cancer or malignancy (%)
Mental Health - People who have little interest in doing things (%)
Mental Health - People feeling down, depressed, or hopeless (%)
Mental Health - People who have trouble sleeping or sleeping too much (%)
Mental Health - People feeling tired or having little energy (%)
Mental Health - People with poor appetite or overeating (%)
Mental Health - People feeling bad about themself (%)
Mental Health - People who have trouble concentrating on things (%)
Mental Health - People moving or speaking slowly or too fast (%)
Mental Health - People having thoughts they would be better off dead (%)
Oral Health - Average years since last visit a dentist
Oral Health - People embarrassed because of mouth (%)
Oral Health - People with gum disease (%)
Oral Health - General health of teeth and gums (%)
Oral Health - Average days a week using dental floss/device
Oral Health - Average days a week using mouthwash for dental problem
Oral Health - Average number of teeth
Pesticide Use - Households using pesticides to control insects (%)
Pesticide Use - Households using pesticides to kill weeds (%)
Physical Activity - People doing vigorous-intensity work activities (%)
Physical Activity - People doing moderate-intensity work activities (%)
Physical Activity - People walking or bicycling (%)
Physical Activity - People doing vigorous-intensity recreational activities (%)
Physical Activity - People doing moderate-intensity recreational activities (%)
Physical Activity - Average hours a day doing sedentary activities
Physical Activity - Average hours a day watching TV or videos
Physical Activity - Average hours a day using computer
Physical Functioning - People having limitations keeping them from working (%)
Physical Functioning - People limited in amount of work they can do (%)
Physical Functioning - People that need special equipment to walk (%)
Physical Functioning - People experiencing confusion/memory problems (%)
Physical Functioning - People requiring special healthcare equipment (%)
Prescription Medications - Average number of prescription medicines taking
Preventive Aspirin Use - Adults 40+ taking low-dose aspirin (%)
Reproductive Health - Vaginal deliveries (%)
Reproductive Health - Cesarean deliveries (%)
Reproductive Health - Deliveries resulted in a live birth (%)
Reproductive Health - Pregnancies resulted in a delivery (%)
Reproductive Health - Women breastfeeding newborns (%)
Reproductive Health - Women that had a hysterectomy (%)
Reproductive Health - Women that had both ovaries removed (%)
Reproductive Health - Women that have ever taken birth control pills (%)
Reproductive Health - Women taking birth control pills (%)
Reproductive Health - Women that have ever used Depo-Provera or injectables (%)
Reproductive Health - Women that have ever used female hormones (%)
Sexual Behavior - People 18+ that ever had sex (vaginal, anal, or oral) (%)
Sexual Behavior - Males 18+ that ever had vaginal sex with a woman (%)
Sexual Behavior - Males 18+ that ever performed oral sex on a woman (%)
Sexual Behavior - Males 18+ that ever had anal sex with a woman (%)
Sexual Behavior - Males 18+ that ever had any sex with a man (%)
Sexual Behavior - Females 18+ that ever had vaginal sex with a man (%)
Sexual Behavior - Females 18+ that ever performed oral sex on a man (%)
Sexual Behavior - Females 18+ that ever had anal sex with a man (%)
Sexual Behavior - Females 18+ that ever had any kind of sex with a woman (%)
Sexual Behavior - Average age people first had sex
Sexual Behavior - Average number of female sex partners in lifetime (males 18+)
Sexual Behavior - Average number of female vaginal sex partners in lifetime (males 18+)
Sexual Behavior - Average age people first performed oral sex on a woman (18+)
Sexual Behavior - Average number of woman performed oral sex on in lifetime (18+)
Sexual Behavior - Average number of male sex partners in lifetime (males 18+)
Sexual Behavior - Average number of male anal sex partners in lifetime (males 18+)
Sexual Behavior - Average age people first performed oral sex on a man (18+)
Sexual Behavior - Average number of male oral sex partners in lifetime (18+)
Sexual Behavior - People using protection when performing oral sex (%)
Sexual Behavior - Average number of times people have vaginal or anal sex a year
Sexual Behavior - People having sex without condom (%)
Sexual Behavior - Average number of male sex partners in lifetime (females 18+)
Sexual Behavior - Average number of male vaginal sex partners in lifetime (females 18+)
Sexual Behavior - Average number of female sex partners in lifetime (females 18+)
Sexual Behavior - Circumcised males 18+ (%)
Sleep Disorders - Average hours sleeping at night
Sleep Disorders - People that has trouble sleeping (%)
Smoking-Cigarette Use - People smoking cigarettes (%)
Taste & Smell - People 40+ having problems with smell (%)
Taste & Smell - People 40+ having problems with taste (%)
Taste & Smell - People 40+ that ever had wisdom teeth removed (%)
Taste & Smell - People 40+ that ever had tonsils teeth removed (%)
Taste & Smell - People 40+ that ever had a loss of consciousness because of a head injury (%)
Taste & Smell - People 40+ that ever had a broken nose or other serious injury to face or skull (%)
Taste & Smell - People 40+ that ever had two or more sinus infections (%)
Weight - Average height (inches)
Weight - Average weight (pounds)
Weight - Average BMI
Weight - People that are obese (%)
Weight - People that ever were obese (%)
Weight - People trying to lose weight (%)
Officers per 1,000 residents here:
1.55Ohio average:
2.11
Latest news from Massillon, OH collected exclusively by city-data.com from local newspapers, TV, and radio stations
Ancestries: German (24.6%), American (11.3%), Irish (8.4%), Italian (6.3%), English (5.4%), African (3.8%).
Current Local Time:
Land area: 16.7 square miles.
Population density: 1,928 people per square mile (low).
470 residents are foreign born
Median real estate property taxes paid for housing units with mortgages in 2022: $1,905 (1.4%)Median real estate property taxes paid for housing units with no mortgage in 2022: $1,883 (1.5%)
Nearest city with pop. 50,000+: Canton, OH
Nearest city with pop. 200,000+: Akron, OH
Nearest city with pop. 1,000,000+: Chicago, IL
Nearest cities:
Latitude: 40.80 N, Longitude: 81.52 W
Daytime population change due to commuting: +2,236 (+7.0%)Workers who live and work in this city: 6,451 (40.1%)
Single-family new house construction building permits:
2022: 48 buildings , average cost: $116,7002021: 57 buildings , average cost: $116,7002020: 52 buildings , average cost: $116,7002019: 46 buildings , average cost: $116,7002018: 48 buildings , average cost: $116,7002017: 48 buildings , average cost: $116,7002016: 46 buildings , average cost: $116,8002015: 42 buildings , average cost: $116,5002014: 42 buildings , average cost: $117,8002013: 31 buildings , average cost: $108,6002012: 28 buildings , average cost: $108,8002011: 16 buildings , average cost: $106,7002010: 35 buildings , average cost: $113,4002009: 38 buildings , average cost: $108,9002008: 47 buildings , average cost: $108,9002007: 84 buildings , average cost: $108,9002006: 119 buildings , average cost: $108,9002005: 164 buildings , average cost: $109,0002004: 176 buildings , average cost: $108,8002003: 173 buildings , average cost: $109,6002002: 109 buildings , average cost: $114,1002001: 86 buildings , average cost: $125,4002000: 115 buildings , average cost: $120,2001999: 141 buildings , average cost: $120,8001998: 60 buildings , average cost: $115,4001997: 55 buildings , average cost: $99,900Unemployment in December 2023:
Population change in the 1990s: +160 (+0.5%).
Most common occupations in Massillon, OH (%)
Both Males Females
Other production occupations, including supervisors (7.5%)
Metal workers and plastic workers (6.3%)
Laborers and material movers, hand (4.2%)
Other office and administrative support workers, including supervisors (3.6%)
Other sales and related occupations, including supervisors (3.6%)
Secretaries and administrative assistants (3.1%)
Driver/sales workers and truck drivers (3.0%)
Metal workers and plastic workers (10.0%)
Other production occupations, including supervisors (9.4%)
Driver/sales workers and truck drivers (5.7%)
Laborers and material movers, hand (5.3%)
Other sales and related occupations, including supervisors (4.1%)
Electrical equipment mechanics and other installation, maintenance, and repair workers, including supervisors (3.9%)
Material recording, scheduling, dispatching, and distributing workers (3.8%)
Secretaries and administrative assistants (6.4%)
Other office and administrative support workers, including supervisors (6.3%)
Other production occupations, including supervisors (5.5%)
Nursing, psychiatric, and home health aides (4.2%)
Preschool, kindergarten, elementary, and middle school teachers (4.0%)
Cashiers (3.7%)
Registered nurses (3.6%)
Tornado activity:
Massillon-area historical tornado activity is near Ohio state average. It is 12% greater than the overall U.S. average.
On 5/31/1985, a category F5 (max. wind speeds 261-318 mph) tornado 34.1 miles away from the Massillon city center killed 18 people and injured 310 people and caused between $50,000,000 and $500,000,000 in damages.
On 4/11/1965, a category F4 (max. wind speeds 207-260 mph) tornado 40.3 miles away from the city center killed 18 people and injured 200 people and caused between $5,000,000 and $50,000,000 in damages.
Earthquake activity:
Massillon-area historical earthquake activity is significantly above Ohio state average. It is 45% smaller than the overall U.S. average. On 9/25/1998 at 19:52:52, a magnitude 5.2 (4.8 MB, 4.3 MS, 5.2 LG, 4.5 MW, Depth: 3.1 mi, Class: Moderate, Intensity: VI - VII) earthquake occurred 75.9 miles away from Massillon center On 1/31/1986 at 16:46:43, a magnitude 5.0 (5.0 MB) earthquake occurred 58.9 miles away from the city center On 8/23/2011 at 17:51:04, a magnitude 5.8 (5.8 MW, Depth: 3.7 mi) earthquake occurred 276.8 miles away from the city center On 7/27/1980 at 18:52:21, a magnitude 5.2 (5.1 MB, 4.7 MS, 5.0 UK, 5.2 UK) earthquake occurred 220.8 miles away from the city center On 7/12/1986 at 08:19:37, a magnitude 4.5 (4.5 MB, Class: Light, Intensity: IV - V) earthquake occurred 150.5 miles away from Massillon center On 12/31/2011 at 20:05:01, a magnitude 4.0 (4.0 ML, Depth: 3.1 mi) earthquake occurred 49.3 miles away from the city center Magnitude types: regional Lg-wave magnitude (LG), body-wave magnitude (MB), local magnitude (ML), surface-wave magnitude (MS), moment magnitude (MW) Natural disasters: The number of natural disasters in Stark County (10) is smaller than the US average (15).Major Disasters (Presidential) Declared: 6Emergencies Declared: 3Floods: 6, Storms: 5, Tornadoes: 3, Snowstorms: 2, Winds: 2, Blizzard: 1, Hurricane: 1, Mudslide: 1, Winter Storm: 1, Other: 1 (Note: some incidents may be assigned to more than one category). Hospitals in Massillon: AFFINITY MEDICAL CENTER (Proprietary, provides emergency services, 875 EIGHTH STREET NE) ART INC-19TH STREET HOME (115 19TH STREET SE) ART INC-TREMONT HOME (1865 TREMONT AVENUE SE) HEARTLAND BEHAVIORAL HEALTHCARE ("3000 ERIE SW, PO BOX 540") LEEDA HOME 6 (1620 FOREST AVENUE SE) MASSILLON COMMUNITY HOSPITAL (provides emergency services, 875 EIGHTH STREET NE) PDS-CARNEGIE (3927 CARNEGIE AVENUE NW) VOCA OF OHIO/KAYLYNN STREET HOME (512 KAYLYNN STREET SE) Nursing Homes in Massillon: AMHERST MEADOWS (1610 FIRST STREET NE) HANOVER HOUSE (435 AVIS AVENUE NW) HOSPITALITY HOUSE (205 ROHR AVENUE NW) LAURELS OF MASSILLON, THE (2000 SHERMAN CIRCLE NE) LEGENDS CARE CENTER (2311 NAVE ROAD SE) MASSILLON COMMUNITY SKILLED NU (875 EIGHTH STREET NE) MEADOW WIND HEALTH CARE CTR INC (300 23RD STREET NE) PARKVIEW MANOR NURSING HOME (54 PINE STREET SOUTHEAST) ROSE LANE NURSING AND REHABILITATION (5425 HIGH MILL AVENUE NW) WALNUT HILLS CARE CENTER INC (1236 HURON ROAD SE) Dialysis Facilities in Massillon: FMC - MASSILLON DIALYSIS CENTER (2474 LINCOLN WAY EAST) Home Health Centers in Massillon: COMPLETE HEALTHCARE SERVICES, INC (830 AMHERST ROAD, NE, SUITE 207) MASSILLON COM HOSP PROF HOME C (875 EIGHTH STREET NE) Amtrak station near Massillon: 20 miles: AKRON (906 E. BOWERY ST.) Services: enclosed waiting area, public restrooms, public payphones, free short-term parking, free long-term parking, taxi stand.
Colleges/universities with over 2000 students nearest to Massillon:
Kent State University at Stark (about 7 miles; Canton, OH ; Full-time enrollment: 3,259)
Stark State College (about 7 miles; North Canton, OH ; FT enrollment: 7,707)
Malone University (about 8 miles; Canton, OH ; FT enrollment: 2,201)
Walsh University (about 10 miles; North Canton, OH ; FT enrollment: 2,553)
University of Akron Main Campus (about 20 miles; Akron, OH ; FT enrollment: 22,216)
The College of Wooster (about 22 miles; Wooster, OH ; FT enrollment: 2,112)
University of Mount Union (about 23 miles; Alliance, OH ; FT enrollment: 2,302)
Public high schools in Massillon: WASHINGTON HIGH SCHOOL Students: 1,229, Location: 1 PAUL E BROWN DR SE, Grades: 9-12)TUSLAW HIGH SCHOOL Students: 529, Location: 1847 MANCHESTER AVE NW, Grades: 9-12)INDIAN RIVER (IRJCF) Students: 209, Location: 2775 INDIAN RIVER RD, Grades: 9-12)MASSILLON DIGITAL ACADEMY, INC Students: 52, Location: 930 17TH ST NE, Grades: 4-12, Charter school )JACKSON HIGH SCHOOL Location: 7600 FULTON DR NW, Grades: 9-12)
PERRY HIGH SCHOOL Location: 3737 13TH ST SW, Grades: 9-12)
R G DRAGE CAREER TECHNICAL CTR Location: 2800 RICHVILLE DR SE, Grades: 9-12)
Private high school in Massillon: MASSILLON CHRISTIAN SCHOOL Students: 88, Location: 965 OVERLOOK AVE SW, Grades: KG-12)
Biggest public elementary/middle schools in Massillon: JACKSON MEMORIAL MIDDLE SCHOOL Students: 1,415, Location: 7355 MUDBROOK RD NW, Grades: 6-8)MASSILLON JUNIOR HIGH SCHOOL Students: 772, Location: 250 29TH ST NW, Grades: 7-8)SAUDER ELEMENTARY SCHOOL Students: 704, Location: 7503 MUDBROOK RD NW, Grades: KG-5)TUSLAW MIDDLE SCHOOL Students: 687, Location: 1723 MANCHESTER AVE NW, Grades: 5-8)STRAUSSER ELEMENTARY SCHOOL Students: 669, Location: 8646 STRAUSSER ST NW, Grades: KG-5)AMHERST ELEMENTARY SCHOOL Students: 483, Location: 8750 JANE ST NW, Grades: KG-5)GENOA ELEMENTARY SCHOOL Students: 389, Location: 519 GENOA AVE SW, Grades: KG-4)GORRELL ELEMENTARY SCHOOL Students: 361, Location: 2420 SCHULER AVE NW, Grades: KG-3)MASSILLON INTERMEDIATE SCHOOL Location: 250 29TH ST NW, Grades: 4-6)
EDISON MIDDLE SCHOOL Location: 4201 13TH ST SW, Grades: 7-8)
Private elementary/middle schools in Massillon: ST MARY ELEMENTARY SCHOOL Students: 206, Location: 640 1ST ST NE, Grades: PK-8)
ST BARBARA ELEMENTARY SCHOOL Students: 153, Location: 2809 LINCOLN WAY NW, Grades: PK-8)
See full list of schools located in Massillon Library in Massillon: MASSILLON PUBLIC LIBRARY Operating income: $2,543,444; Location: 208 LINCOLN WAY E.; 139,544 books ; 1,608 e-books ; 12,946 audio materials ; 14,914 video materials ; 20 local licensed databases ; 266 state licensed databases ; 262 print serial subscriptions )
Notable locations in Massillon: (A) , Finelrock Industrial Park (B) , Smith Ambulance of Stark - Summit (C) , Massillon Fire Department Station 4 (D) , West Side Branch Massillon Public Library (E) , Massillon Public Library (F) , Massillon Womans Club (G) , Massillon City Hall (H) , Massillon Boys Club (I) , First Baptist Church Childrens Center (J) , Massillon Fire Department Station 3 (K) , Massillon Fire Department Station 2 (L) , Massillon Fire Department Station 1 (M) , Massillon Museum (N) , Ohio Military Museum (O) . Display/hide their locations on the map
Shopping Centers: (1) , Duncan Plaza Shopping Center (2) , Amherst Park Shopping Center (3) , Massillon Towne Plaza Shopping Center (4) , Hills and Dales Mini-Mall Shopping Center (5) , Meadows Plaza Shopping Center (6) , Oakpark Centre Shopping Center (7) . Display/hide their locations on the map
Churches in Massillon include: (A) , First Church of God (B) , First Christian Church (C) , Shiloh Baptist Church (D) , Oak Avenue African Methodist Episcopal Zion Church (E) , Church of God in Christ (F) , Saint Josephs Catholic Church (G) , First Assembly of God Church (H) , First Baptist Church (I) . Display/hide their locations on the map
Cemeteries: (1) , Trinity Lutheran Cemetery (2) , Saint Mary Catholic Cemetery (3) , Old Kendal Cemetery (4) , Old Quaker Cemetery (5) , Saint Josephs Cemetery (6) , Massillon Cemetery (7) . Display/hide their locations on the map
Creeks: (A) , Newman Creek (B) , Wetmore Creek (C) . Display/hide their locations on the map
Parks in Massillon include: (1) , Veterans Park (2) , Agathon Ball Field (3) , Walnut Hills Park (4) , Shirver Park (5) , Arthur Genschaft Memorial Park (6) , Wampler Park (7) , Wales Park (8) , Paul Brown Tiger Stadium Park (9) . Display/hide their locations on the map
Tourist attraction: (1) . Display/hide its approximate location on the map
Hotels: (1) , Crown Motel (4001 Lincoln Way East) (2) , Country Motel (12268 Lincoln Way Northwest) (3) , Hampton Inn Canton/Massillon (44 First Street Southwest) (4) , Chase Motel (3400 Lincoln Way East) (5) . Display/hide their approximate locations on the map
Court: (1) . Display/hide its approximate location on the map
Birthplace of: Bob Fothergill - Baseball player, Don James (American football) - Football player and coach, Harry Stuhldreher - Football player and coach, Tom Weiskopf - Professional golfer, Alex Wood (American football) - Football coach, Bill Edwards (American football coach) - Football player and coach, Bobby Knight - (born 1940), basketball coach, Dennis Franklin - Football player, Jack Oliver (scientist) - Soilder, Joe Sparma - Baseball player.
Stark County has a predicted average indoor radon screening level greater than 4 pCi/L (pico curies per liter) - Highest Potential Drinking water stations with addresses in Massillon and their reported violations in the past:
AQUA OHIO - MANSFIELD SYSTEM 1 (Population served: 1,160, Groundwater):
Past monitoring violations:
Monitoring and Reporting (DBP) - Between JAN-2013 and SEP-2013, Contaminant: Total Haloacetic Acids (HAA5). Follow-up actions: St Violation/Reminder Notice (NOV-20-2013), St Public Notif requested (NOV-20-2013)
Monitoring and Reporting (DBP) - Between JAN-2013 and SEP-2013, Contaminant: TTHM. Follow-up actions: St Violation/Reminder Notice (NOV-20-2013), St Public Notif requested (NOV-20-2013)
Population served: 945, Purch surface water):
Past health violations:
MCL, Monthly (TCR) - In JUN-2012, Contaminant: Coliform. Follow-up actions: St Public Notif requested (JUN-18-2012), St Violation/Reminder Notice (JUN-18-2012), St Public Notif received (JUL-11-2012)
Past monitoring violations:
Monitoring and Reporting (DBP) - Between APR-2012 and JUN-2012, Contaminant: TTHM. Follow-up actions: St Public Notif requested (SEP-04-2012), St Violation/Reminder Notice (SEP-04-2012), St Compliance achieved (SEP-10-2012), St Public Notif received (JUL-01-2013)
Monitoring and Reporting (DBP) - Between APR-2012 and JUN-2012, Contaminant: Total Haloacetic Acids (HAA5). Follow-up actions: St Public Notif requested (SEP-04-2012), St Violation/Reminder Notice (SEP-04-2012), St Compliance achieved (SEP-10-2012), St Public Notif received (JUL-01-2013)
One minor monitoring violation
Population served: 763, Groundwater):
Past monitoring violations:
Monitoring and Reporting (DBP) - Between JAN-2013 and SEP-2013, Contaminant: Total Haloacetic Acids (HAA5). Follow-up actions: St Violation/Reminder Notice (NOV-20-2013), St Public Notif requested (NOV-20-2013)
Monitoring and Reporting (DBP) - Between JAN-2013 and SEP-2013, Contaminant: TTHM. Follow-up actions: St Violation/Reminder Notice (NOV-20-2013), St Public Notif requested (NOV-20-2013)
Population served: 702, Groundwater):
Past monitoring violations:
Monitoring and Reporting (DBP) - Between JAN-2013 and SEP-2013, Contaminant: Total Haloacetic Acids (HAA5). Follow-up actions: St Violation/Reminder Notice (NOV-20-2013), St Public Notif requested (NOV-20-2013)
Monitoring and Reporting (DBP) - Between JAN-2013 and SEP-2013, Contaminant: TTHM. Follow-up actions: St Violation/Reminder Notice (NOV-20-2013), St Public Notif requested (NOV-20-2013)
Population served: 525, Groundwater):
Past monitoring violations:
Monitoring and Reporting (DBP) - Between JAN-2013 and SEP-2013, Contaminant: Total Haloacetic Acids (HAA5). Follow-up actions: St Violation/Reminder Notice (NOV-20-2013), St Public Notif requested (NOV-20-2013)
Monitoring and Reporting (DBP) - Between JAN-2013 and SEP-2013, Contaminant: TTHM. Follow-up actions: St Violation/Reminder Notice (NOV-20-2013), St Public Notif requested (NOV-20-2013)
Population served: 360, Groundwater):
Past monitoring violations:
2 regular monitoring violations
Population served: 200, Groundwater):
Past health violations:
MCL, Monthly (TCR) - Between OCT-2011 and DEC-2011, Contaminant: Coliform. Follow-up actions: St Violation/Reminder Notice (OCT-26-2011), St Public Notif requested (OCT-26-2011)
Past monitoring violations:
5 regular monitoring violations
Population served: 175, Groundwater):
Past health violations:
MCL, Monthly (TCR) - Between APR-2010 and JUN-2010, Contaminant: Coliform. Follow-up actions: St Violation/Reminder Notice (JUL-13-2010), St Public Notif requested (JUL-13-2010), St Compliance achieved (AUG-16-2011), St Public Notif received (JUN-19-2012)
Past monitoring violations:
One routine major monitoring violation
One minor monitoring violation
One regular monitoring violation
Drinking water stations with addresses in Massillon that have no violations reported:
AQUA OHIO - MASSILLON PWS (Population served: 90,000, Primary Water Source Type: Groundwater)
AQUA OHIO - BEECHCREST (Population served: 1,800, Primary Water Source Type: Purch groundwater)
KENTUCKY FRIED CHICKEN/TACO BELL-HARTVIL (Population served: 500, Primary Water Source Type: Groundwater)
WACO MARATHON (Population served: 450, Primary Water Source Type: Groundwater)
AQUA OHIO - MANSFIELD SYSTEM 6 (Population served: 405, Primary Water Source Type: Groundwater)
FIRESTONE TRACE PWS (Population served: 249, Primary Water Source Type: Groundwater)
MIDWAY MARATHON (Population served: 240, Primary Water Source Type: Groundwater)
AQUA OHIO - MANSFIELD SYSTEM 8 (Population served: 170, Primary Water Source Type: Groundwater)
AQUA OHIO - MANSFIELD SYSTEM 5 (Population served: 123, Primary Water Source Type: Groundwater)
AQUA OHIO - MANSFIELD SYSTEM 9 (Population served: 120, Primary Water Source Type: Groundwater)
Average household size: This city:
2.4 peopleOhio:
2.4 people
Percentage of family households: This city:
62.9%Whole state:
65.0%
Percentage of households with unmarried partners: This city:
8.7%Whole state:
6.8%
Likely homosexual households (counted as self-reported same-sex unmarried-partner households)
Lesbian couples: 0.4% of all households Gay men: 0.2% of all households
People in group quarters in Massillon in 2010:
348 people in nursing facilities/skilled-nursing facilities
225 people in correctional facilities intended for juveniles
139 people in other noninstitutional facilities
102 people in mental (psychiatric) hospitals and psychiatric units in other hospitals
88 people in group homes intended for adults
21 people in college/university student housing
20 people in emergency and transitional shelters (with sleeping facilities) for people experiencing homelessness
8 people in residential treatment centers for juveniles (non-correctional)
People in group quarters in Massillon in 2000:
284 people in nursing homes
262 people in training schools for juvenile delinquents
143 people in mental (psychiatric) hospitals or wards
90 people in homes for the mentally retarded
30 people in other noninstitutional group quarters
16 people in other group homes
13 people in other nonhousehold living situations
8 people in wards in general hospitals for patients who have no usual home elsewhere
6 people in college dormitories (includes college quarters off campus)
Banks with branches in Massillon (2011 data):
Firstmerit Bank, National Association: Amherst Branch, Foxboro Branch, Perry West Branch, Mayflower Branch, Downtown Massillon Branch. Info updated 2010/05/17: Bank assets: $14,420.6 mil, Deposits: $11,497.6 mil, headquarters in Akron, OH, positive income , Commercial Lending Specialization, 213 total offices , Holding Company: Firstmerit Corporation
The Huntington National Bank: Wales Square Office Branch, Noble's Pond Branch, Massillon Branch, Perry Branch. Info updated 2012/04/02: Bank assets: $54,183.4 mil, Deposits: $44,300.3 mil, headquarters in Columbus, OH, positive income , Commercial Lending Specialization, 878 total offices , Holding Company: Huntington Bancshares Incorporated
First National Bank: Downtown Massillon Branch at 211 Lincoln Way East, branch established on 1892/01/01; Mayflower Branch at 2312 Lincoln Way West, branch established on 1892/01/01. Info updated 2006/11/03: Bank assets: $403.3 mil, Deposits: $341.3 mil, headquarters in Orrville, OH, positive income , Commercial Lending Specialization, 14 total offices , Holding Company: National Bancshares Corporation
RBS Citizens, National Association: Massilon at 54 Federal Avenue N.E., branch established on 1923/01/01; Wales Square at 2200 Wales Avenue N W, branch established on 1887/01/01. Info updated 2007/09/19: Bank assets: $106,940.6 mil, Deposits: $75,690.2 mil, headquarters in Providence, RI, positive income , 1135 total offices , Holding Company: Uk Financial Investments Limited
Woodforest National Bank: Massillon Walmart Branch at 1 Massillon Market Place Drive, branch established on 2008/03/08. Info updated 2011/05/10: Bank assets: $3,488.9 mil, Deposits: $3,097.6 mil, headquarters in Houston, TX, positive income , Commercial Lending Specialization, 766 total offices , Holding Company: Woodforest Financial Group Employee Stock Ownership Plan (With 401(K) Provisions)
JPMorgan Chase Bank, National Association: New Massillon Branch at 11 Lincoln Way West, branch established on 1999/01/16. Info updated 2011/11/10: Bank assets: $1,811,678.0 mil, Deposits: $1,190,738.0 mil, headquarters in Columbus, OH, positive income , International Specialization, 5577 total offices , Holding Company: Jpmorgan Chase & Co.
KeyBank National Association: Whales Square Branch at 7925 Hills And Dales Road, N.W., branch established on 1974/09/20. Info updated 2008/03/03: Bank assets: $86,198.8 mil, Deposits: $64,214.8 mil, headquarters in Cleveland, OH, positive income , Commercial Lending Specialization, 1067 total offices , Holding Company: Keycorp
PNC Bank, National Association: Lake Avenue Branch at 438 Lake Avenue, branch established on 1995/07/11. Info updated 2012/03/20: Bank assets: $263,309.6 mil, Deposits: $197,343.0 mil, headquarters in Wilmington, DE, positive income , Commercial Lending Specialization, 3085 total offices , Holding Company: Pnc Financial Services Group, Inc., The
For population 15 years and over in Massillon:
Never married: 32.1%Now married: 42.7%Separated: 2.0%Widowed: 6.4%Divorced: 16.8% For population 25 years and over in Massillon:
High school or higher: 91.2%Bachelor's degree or higher: 15.9%Graduate or professional degree: 5.0%Unemployed: 4.6%Mean travel time to work (commute): 20.2 minutes
Education Gini index (Inequality in education) Here:
8.4Ohio average:
11.0
Religion statistics for Massillon, OH (based on Stark County data)
Religion Adherents Congregations Evangelical Protestant 60,957 224 Catholic 55,831 28 Mainline Protestant 45,340 127 Black Protestant 5,327 25 Orthodox 5,014 8 Other 3,929 24 None 199,188 -
Source: Clifford Grammich, Kirk Hadaway, Richard Houseal, Dale E.Jones, Alexei Krindatch, Richie Stanley and Richard H.Taylor. 2012. 2010 U.S.Religion Census: Religious Congregations & Membership Study. Association of Statisticians of American Religious Bodies. Jones, Dale E., et al. 2002. Congregations and Membership in the United States 2000. Nashville, TN: Glenmary Research Center. Graphs represent county-level data
Food Environment Statistics: Number of grocery stores : 71Here :
1.87 / 10,000 pop.Ohio :
1.89 / 10,000 pop.
Number of supercenters and club stores : 5This county :
0.13 / 10,000 pop.Ohio :
0.13 / 10,000 pop.
Number of convenience stores (no gas) : 34Here :
0.90 / 10,000 pop.Ohio :
1.25 / 10,000 pop.
Number of convenience stores (with gas) : 102Stark County :
2.69 / 10,000 pop.Ohio :
2.93 / 10,000 pop.
Number of full-service restaurants : 253Stark County :
6.67 / 10,000 pop.Ohio :
6.25 / 10,000 pop.
Adult diabetes rate : Stark County :
10.9%Ohio :
10.3%
Adult obesity rate : Stark County :
30.3%State :
29.1%
Low-income preschool obesity rate : This county :
12.5%State :
11.9%
Health and Nutrition: Healthy diet rate : Massillon:
50.8%Ohio:
50.4%
Average overall health of teeth and gums : This city:
48.3%Ohio:
47.8%
People feeling badly about themselves : Massillon:
20.5%Ohio:
20.6%
People not drinking alcohol at all : Average hours sleeping at night : Overweight people : Massillon:
35.0%Ohio:
34.3%
General health condition : Massillon:
57.1%State:
57.0%
Average condition of hearing : Massillon:
78.6%Ohio:
79.1%
More about Health and Nutrition of Massillon, OH Residents
Local government employment and payroll (March 2022)
Function
Full-time employees
Monthly full-time payroll
Average yearly full-time wage
Part-time employees
Monthly part-time payroll
Judicial and Legal
54 $208,094 $46,243 5 $12,114 Firefighters
48 $288,679 $72,170 0 $0 Police Protection - Officers
38 $232,998 $73,578 0 $0 Sewerage
35 $154,023 $52,808 0 $0 Streets and Highways
19 $82,234 $51,937 0 $0 Solid Waste Management
13 $44,624 $41,191 0 $0 Parks and Recreation
12 $47,953 $47,953 61 $28,398 Financial Administration
8 $30,608 $45,912 2 $5,477 Health
8 $34,547 $51,821 1 $1,100 Other Government Administration
6 $27,045 $54,090 13 $7,291 Other and Unallocable
5 $17,065 $40,956 0 $0 Housing and Community Development (Local)
5 $16,824 $40,378 0 $0 Police - Other
2 $6,041 $36,246 0 $0
Totals for Government
253 $1,190,735 $56,478 82 $54,380
Massillon government finances - Expenditure in 2018 (per resident):
Construction - General - Other: $1,306,000 ($40.44)
Current Operations - Police Protection: $7,855,000 ($243.25)
Sewerage: $6,049,000 ($187.32)Local Fire Protection: $5,022,000 ($155.52)Judicial and Legal Services: $4,413,000 ($136.66)Parks and Recreation: $4,043,000 ($125.20)Regular Highways: $3,429,000 ($106.19)Financial Administration: $2,747,000 ($85.07)General - Other: $1,235,000 ($38.24)Solid Waste Management: $1,152,000 ($35.67)Health - Other: $739,000 ($22.88)General Public Buildings: $666,000 ($20.62)Central Staff Services: $500,000 ($15.48)Housing and Community Development: $37,000 ($1.15)General - Interest on Debt: $1,073,000 ($33.23)
Intergovernmental to State - Sewerage: $2,062,000 ($63.85)
General - Other: $25,000 ($0.77)Other Capital Outlay - Sewerage: $195,000 ($6.04)
General - Other: $38,000 ($1.18)Total Salaries and Wages: $2,345,000 ($72.62)
Massillon government finances - Revenue in 2018 (per resident):
Charges - Sewerage: $9,693,000 ($300.17)
Parks and Recreation: $1,949,000 ($60.36)Other: $1,379,000 ($42.70)Solid Waste Management: $1,166,000 ($36.11)Miscellaneous - Fines and Forfeits: $2,671,000 ($82.71)
General Revenue - Other: $1,388,000 ($42.98)Interest Earnings: $513,000 ($15.89)Donations From Private Sources: $122,000 ($3.78)State Intergovernmental - Other: $3,287,000 ($101.79)
General Local Government Support: $1,515,000 ($46.92)Sewerage: $195,000 ($6.04)Tax - Individual Income: $19,108,000 ($591.73)
Property: $2,113,000 ($65.43)Other License: $573,000 ($17.74)
Massillon government finances - Cash and Securities in 2018 (per resident):
Other Funds - Cash and Securities: $9,994,000 ($309.49)
Businesses in Massillon, OH
Name Count Name Count
AT&T 1 MasterBrand Cabinets 3 Advance Auto Parts 1 McDonald's 3 Applebee's 1 Menards 1 Arby's 1 Nissan 1 AutoZone 1 OfficeMax 1 Bath & Body Works 1 Panera Bread 1 Blockbuster 1 Papa John's Pizza 1 Buffalo Wild Wings 1 Payless 1 Burger King 2 Penske 1 Circle K 1 PetSmart 1 Curves 2 Pizza Hut 1 Dairy Queen 3 RadioShack 2 Fashion Bug 1 Rite Aid 3 FedEx 4 SONIC Drive-In 1 Ford 1 Sears 1 GNC 3 Starbucks 2 GameStop 2 Subaru 1 H&R Block 1 Subway 7 Home Depot 1 T-Mobile 2 Honda 1 Taco Bell 2 Hyundai 1 Target 1 IHOP 1 U-Haul 3 KFC 1 UPS 4 Kmart 1 Verizon Wireless 1 Lane Furniture 1 Walgreens 1 Little Caesars Pizza 2 Walmart 1 Long John Silver's 1 Wendy's 2 Lowe's 1 YMCA 2
Strongest AM radio stations in Massillon:
WRCW (1060 AM; daytime; 5 kW; CANTON, OH)
WHBC (1480 AM; 15 kW; CANTON, OH; Owner: NM LICENSING, LLC)
WKNR (850 AM; 50 kW; CLEVELAND, OH; Owner: CARON BROADCASTING, INC.)
WTAM (1100 AM; 50 kW; CLEVELAND, OH; Owner: JACOR BROADCASTING CORPORATION)
WHK (1220 AM; 50 kW; CLEVELAND, OH; Owner: CARON BROADCASTING, INC.)
WTIG (990 AM; 0 kW; MASSILLON, OH; Owner: WTIG, INC.)
WCER (900 AM; 0 kW; CANTON, OH; Owner: MELODYNAMIC BROACASTING CORPORATION)
WHLO (640 AM; 5 kW; AKRON, OH; Owner: CLEAR CHANNEL BROADCASTING LICENSES, INC.)
WAKR (1590 AM; 5 kW; AKRON, OH; Owner: RUBBER CITY RADIO GROUP, INC.)
WWVA (1170 AM; 53 kW; WHEELING, WV; Owner: CAPSTAR TX LIMITED PARTNERSHIP)
WINW (1520 AM; daytime; 1 kW; CANTON, OH)
KDKA (1020 AM; 50 kW; PITTSBURGH, PA; Owner: INFINITY BROADCASTING OPERATIONS, INC.)
WWMK (1260 AM; 10 kW; CLEVELAND, OH; Owner: ABC, INC.)
Strongest FM radio stations in Massillon:
WRQK-FM (106.9 FM; CANTON, OH; Owner: CUMULUS LICENSING CORP.)
WKDD (98.1 FM; CANTON, OH; Owner: CITICASTERS LICENSES, L.P.)
WONE-FM (97.5 FM; AKRON, OH; Owner: RUBBER CITY RADIO GROUP, INC.)
WHBC-FM (94.1 FM; CANTON, OH; Owner: NM LICENSING, LLC)
WKSU-FM (89.7 FM; KENT, OH; Owner: KENT STATE UNIVERSITY)
WQMX (94.9 FM; MEDINA, OH; Owner: RUBBER CITY RADIO GROUP, INC)
WZIP (88.1 FM; AKRON, OH; Owner: THE UNIVERSITY OF AKRON)
WNPQ (95.9 FM; NEW PHILADELPHIA, OH; Owner: TUSCARAWAS BROADCASTING COMPANY)
WOFN (88.7 FM; BEACH CITY, OH; Owner: CREATIVE EDUCATIONAL MEDIA CORP.)
WZKL (92.5 FM; ALLIANCE, OH; Owner: D. A. PETERSON, INC.)
WJER-FM (101.7 FM; DOVER, OH; Owner: WJER RADIO, INC.)
WMJI (105.7 FM; CLEVELAND, OH; Owner: CITICASTERS LICENSES, L.P.)
WMXY (98.9 FM; YOUNGSTOWN, OH; Owner: CITICASTERS LICENSES, L.P.)
WAPS (91.3 FM; AKRON, OH; Owner: BOARD OF EDUCATION, AKRON CITY SCHOOL DISTRICT)
WQAL (104.1 FM; CLEVELAND, OH; Owner: INFINITY RADIO OPERATIONS INC.)
WAKS (96.5 FM; AKRON, OH; Owner: CAPSTAR TX LIMITED PARTNERSHIP)
WMVX (106.5 FM; CLEVELAND, OH; Owner: JACOR BROADCASTING CORPORATION)
WNCX (98.5 FM; CLEVELAND, OH; Owner: INFINITY RADIO OF CLEVELAND INC.)
WQXK (105.1 FM; SALEM, OH; Owner: CUMULUS LICENSING CORP.)
WDOK (102.1 FM; CLEVELAND, OH; Owner: INFINITY RADIO OPERATIONS INC.)
TV broadcast stations around Massillon:
WDLI (Channel 17; CANTON, OH; Owner: TRINITY BROADCASTING NETWORK, INC.)
WVPX (Channel 23; AKRON, OH; Owner: PAXSON AKRON LICENSE, INC.)
WEAO (Channel 49; AKRON, OH; Owner: NORTHEASTERN EDUCATIONAL TELEVISION OF OHIO, INC.)
WAKN-LP (Channel 11; AKRON, OH; Owner: AKRON TELEVISION, INC.)
WIVM-LP (Channel 52; CANTON, OH; Owner: LUCINDA DeVAUL-TONGES)
WKYC-TV (Channel 3; CLEVELAND, OH; Owner: WKYC-TV, INC.)
WKBN-TV (Channel 27; YOUNGSTOWN, OH; Owner: PIEDMONT TELEVISION OF YOUNGSTOWN LICENSE LLC)
WOIO (Channel 19; SHAKER HEIGHTS, OH; Owner: RAYCOM NATIONAL, INC.)
WBNX-TV (Channel 55; AKRON, OH; Owner: WINSTON BROADCASTING NETWORK, INC.)
WAOH-LP (Channel 29; AKRON, OH; Owner: MEDIA-COM TELEVISION, INC.)
WNEO (Channel 45; ALLIANCE, OH; Owner: NORTHEASTERN EDUCATIONAL TELEVISION OF OHIO, INC.)
WQHS-TV (Channel 61; CLEVELAND, OH; Owner: UNIVISION CLEVELAND LLC)
W35AX (Channel 35; CLEVELAND, OH; Owner: MEDIA-COM TELEVISION, INC.)
WOAC (Channel 67; CANTON, OH; Owner: WRAY, INC.)
WUAB (Channel 43; LORAIN, OH; Owner: RAYCOM NATIONAL, INC.)
WVIZ (Channel 25; CLEVELAND, OH; Owner: IDEASTREAM)
WJW (Channel 8; CLEVELAND, OH; Owner: WJW LICENSE, INC.)
Medal of Honor Recipients
Medal of Honor Recipients born in Massillon: George V. Kelley, Robert R . Scott.
National Bridge Inventory (NBI) Statistics 72 Number of bridges968ft / 295m Total length489,352 Total average daily traffic65,772 Total average daily truck traffic
New bridges - historical statistics
1 1910-1919 1 1920-1929 1 1930-1939 5 1940-1949 14 1950-1959 21 1960-1969 21 1970-1979 1 1980-1989 2 1990-1999 3 2000-2009 1 2010-2019 1 2020-2022
See full National Bridge Inventory statistics for Massillon, OH
Home Mortgage Disclosure Act Aggregated Statistics For Year 2009(Based on 6 full and 7 partial tracts) A) FHA, FSA/RHS & VA B) Conventional C) Refinancings D) Home Improvement Loans E) Loans on Dwellings For 5+ Families F) Non-occupant Loans on G) Loans On Manufactured Number Average Value Number Average Value Number Average Value Number Average Value Number Average Value Number Average Value Number Average Value
LOANS ORIGINATED 140 $86,093 76 $88,857 290 $106,861 29 $28,670 0 $0 24 $79,905 1 $37,750 APPLICATIONS APPROVED, NOT ACCEPTED 12 $67,197 3 $67,453 37 $81,276 10 $19,043 0 $0 2 $74,690 2 $29,565 APPLICATIONS DENIED 23 $78,288 14 $72,443 233 $99,620 48 $23,837 1 $80,000 23 $66,507 1 $26,500 APPLICATIONS WITHDRAWN 13 $73,252 2 $147,770 70 $103,764 6 $24,113 0 $0 3 $93,760 0 $0 FILES CLOSED FOR INCOMPLETENESS 1 $46,070 2 $112,065 14 $113,396 3 $11,623 0 $0 1 $35,930 0 $0
Aggregated Statistics For Year 2008(Based on 7 full and 7 partial tracts) A) FHA, FSA/RHS & VA B) Conventional C) Refinancings D) Home Improvement Loans E) Loans on Dwellings For 5+ Families F) Non-occupant Loans on G) Loans On Manufactured Number Average Value Number Average Value Number Average Value Number Average Value Number Average Value Number Average Value Number Average Value
LOANS ORIGINATED 112 $89,292 108 $98,205 252 $93,619 37 $22,828 0 $0 42 $99,634 4 $18,888 APPLICATIONS APPROVED, NOT ACCEPTED 4 $107,218 7 $70,486 55 $73,988 13 $21,998 0 $0 10 $67,657 2 $24,665 APPLICATIONS DENIED 19 $73,843 27 $77,397 306 $88,314 73 $27,256 1 $144,000 31 $69,002 10 $34,033 APPLICATIONS WITHDRAWN 11 $82,561 9 $75,912 92 $93,428 10 $75,261 0 $0 14 $56,422 0 $0 FILES CLOSED FOR INCOMPLETENESS 2 $98,645 7 $78,054 17 $93,023 4 $59,348 0 $0 3 $51,633 0 $0
Aggregated Statistics For Year 2007(Based on 7 full and 7 partial tracts) A) FHA, FSA/RHS & VA B) Conventional C) Refinancings D) Home Improvement Loans E) Loans on Dwellings For 5+ Families F) Non-occupant Loans on G) Loans On Manufactured Number Average Value Number Average Value Number Average Value Number Average Value Number Average Value Number Average Value Number Average Value
LOANS ORIGINATED 51 $84,266 295 $84,818 391 $82,785 101 $32,123 1 $139,260 84 $62,391 10 $50,886 APPLICATIONS APPROVED, NOT ACCEPTED 1 $60,930 30 $62,270 83 $86,929 20 $28,606 0 $0 16 $59,845 3 $41,947 APPLICATIONS DENIED 12 $80,211 73 $72,540 498 $84,353 123 $45,628 1 $600,000 51 $67,278 6 $26,743 APPLICATIONS WITHDRAWN 3 $121,193 30 $78,731 178 $94,695 28 $46,475 0 $0 19 $64,711 0 $0 FILES CLOSED FOR INCOMPLETENESS 1 $55,040 12 $69,556 55 $101,044 5 $37,058 0 $0 6 $57,622 0 $0
Aggregated Statistics For Year 2006(Based on 7 full and 7 partial tracts) A) FHA, FSA/RHS & VA B) Conventional C) Refinancings D) Home Improvement Loans E) Loans on Dwellings For 5+ Families F) Non-occupant Loans on G) Loans On Manufactured Number Average Value Number Average Value Number Average Value Number Average Value Number Average Value Number Average Value Number Average Value
LOANS ORIGINATED 59 $96,149 445 $82,519 514 $77,170 93 $30,497 0 $0 133 $58,942 3 $37,660 APPLICATIONS APPROVED, NOT ACCEPTED 1 $83,220 52 $84,428 144 $83,481 21 $19,013 0 $0 22 $72,959 3 $59,217 APPLICATIONS DENIED 10 $80,603 112 $66,097 516 $84,909 168 $26,432 1 $150,000 39 $66,872 10 $43,251 APPLICATIONS WITHDRAWN 0 $0 50 $75,905 250 $95,175 29 $61,926 0 $0 15 $60,833 0 $0 FILES CLOSED FOR INCOMPLETENESS 1 $60,000 12 $79,432 95 $92,156 1 $25,320 0 $0 4 $65,518 0 $0
Aggregated Statistics For Year 2005(Based on 7 full and 7 partial tracts) A) FHA, FSA/RHS & VA B) Conventional C) Refinancings D) Home Improvement Loans E) Loans on Dwellings For 5+ Families F) Non-occupant Loans on G) Loans On Manufactured Number Average Value Number Average Value Number Average Value Number Average Value Number Average Value Number Average Value Number Average Value
LOANS ORIGINATED 65 $89,294 468 $83,340 638 $84,556 75 $45,343 1 $303,000 126 $61,546 3 $66,197 APPLICATIONS APPROVED, NOT ACCEPTED 2 $94,540 56 $88,076 146 $76,677 25 $38,616 0 $0 20 $72,607 3 $40,497 APPLICATIONS DENIED 6 $65,567 132 $72,482 625 $84,427 136 $31,897 0 $0 49 $59,959 10 $49,343 APPLICATIONS WITHDRAWN 1 $125,620 59 $82,422 384 $99,335 55 $104,801 0 $0 23 $83,843 1 $44,590 FILES CLOSED FOR INCOMPLETENESS 1 $73,040 11 $67,983 63 $92,056 4 $47,720 0 $0 1 $73,000 0 $0
Aggregated Statistics For Year 2004(Based on 7 full and 7 partial tracts) A) FHA, FSA/RHS & VA B) Conventional C) Refinancings D) Home Improvement Loans E) Loans on Dwellings For 5+ Families F) Non-occupant Loans on G) Loans On Manufactured Number Average Value Number Average Value Number Average Value Number Average Value Number Average Value Number Average Value Number Average Value
LOANS ORIGINATED 64 $89,595 392 $86,919 692 $86,245 82 $43,582 3 $659,550 117 $64,875 5 $29,906 APPLICATIONS APPROVED, NOT ACCEPTED 6 $83,313 55 $69,154 163 $80,582 16 $27,672 0 $0 11 $77,753 0 $0 APPLICATIONS DENIED 6 $56,342 107 $75,864 639 $82,802 108 $36,395 0 $0 52 $63,916 6 $78,395 APPLICATIONS WITHDRAWN 3 $74,843 37 $84,482 365 $92,763 18 $49,211 1 $75,610 16 $82,170 1 $44,480 FILES CLOSED FOR INCOMPLETENESS 1 $83,390 20 $84,206 58 $85,417 11 $52,515 0 $0 7 $67,261 0 $0
Aggregated Statistics For Year 2003(Based on 7 full and 7 partial tracts) A) FHA, FSA/RHS & VA B) Conventional C) Refinancings D) Home Improvement Loans F) Non-occupant Loans on Number Average Value Number Average Value Number Average Value Number Average Value Number Average Value
LOANS ORIGINATED 76 $94,017 380 $86,271 1,204 $84,487 51 $20,217 141 $65,718 APPLICATIONS APPROVED, NOT ACCEPTED 3 $63,760 37 $66,692 220 $81,233 18 $23,180 15 $60,009 APPLICATIONS DENIED 10 $77,334 76 $62,699 621 $82,132 87 $15,440 43 $47,329 APPLICATIONS WITHDRAWN 9 $70,527 32 $90,361 371 $89,269 6 $65,993 16 $61,234 FILES CLOSED FOR INCOMPLETENESS 4 $67,695 9 $74,436 106 $85,978 0 $0 10 $68,076
Aggregated Statistics For Year 2002(Based on 7 full and 5 partial tracts) A) FHA, FSA/RHS & VA B) Conventional C) Refinancings D) Home Improvement Loans E) Loans on Dwellings For 5+ Families F) Non-occupant Loans on Number Average Value Number Average Value Number Average Value Number Average Value Number Average Value Number Average Value
LOANS ORIGINATED 89 $81,853 332 $78,735 878 $77,546 66 $13,361 1 $181,570 124 $58,183 APPLICATIONS APPROVED, NOT ACCEPTED 4 $86,528 24 $66,084 221 $74,990 15 $14,941 0 $0 13 $61,280 APPLICATIONS DENIED 10 $81,734 45 $50,615 509 $75,447 108 $12,351 0 $0 34 $49,924 APPLICATIONS WITHDRAWN 3 $89,333 24 $67,341 281 $81,703 7 $24,120 0 $0 9 $59,838 FILES CLOSED FOR INCOMPLETENESS 1 $73,000 8 $72,450 82 $79,089 0 $0 0 $0 5 $51,296
Aggregated Statistics For Year 2001(Based on 7 full and 5 partial tracts) A) FHA, FSA/RHS & VA B) Conventional C) Refinancings D) Home Improvement Loans E) Loans on Dwellings For 5+ Families F) Non-occupant Loans on Number Average Value Number Average Value Number Average Value Number Average Value Number Average Value Number Average Value
LOANS ORIGINATED 88 $79,635 295 $75,724 926 $73,999 68 $14,676 0 $0 89 $56,584 APPLICATIONS APPROVED, NOT ACCEPTED 5 $90,294 25 $54,994 213 $70,861 23 $22,646 1 $88,000 12 $46,318 APPLICATIONS DENIED 11 $59,973 72 $49,824 649 $68,266 129 $13,994 0 $0 30 $49,525 APPLICATIONS WITHDRAWN 5 $66,382 29 $71,092 279 $74,994 16 $18,003 0 $0 9 $63,494 FILES CLOSED FOR INCOMPLETENESS 2 $62,050 9 $94,887 72 $80,920 1 $24,710 0 $0 4 $103,750
Aggregated Statistics For Year 2000(Based on 7 full and 5 partial tracts) A) FHA, FSA/RHS & VA B) Conventional C) Refinancings D) Home Improvement Loans E) Loans on Dwellings For 5+ Families F) Non-occupant Loans on Number Average Value Number Average Value Number Average Value Number Average Value Number Average Value Number Average Value
LOANS ORIGINATED 89 $75,422 309 $69,212 432 $58,775 101 $12,157 1 $212,000 68 $56,169 APPLICATIONS APPROVED, NOT ACCEPTED 2 $66,040 35 $57,273 155 $59,438 46 $18,987 0 $0 11 $46,200 APPLICATIONS DENIED 3 $62,143 84 $49,670 359 $56,198 129 $13,688 0 $0 26 $48,432 APPLICATIONS WITHDRAWN 4 $74,462 40 $61,512 152 $57,905 15 $30,847 1 $60,000 8 $51,219 FILES CLOSED FOR INCOMPLETENESS 0 $0 13 $44,153 48 $65,566 0 $0 0 $0 4 $47,000
Aggregated Statistics For Year 1999(Based on 7 full and 6 partial tracts) A) FHA, FSA/RHS & VA B) Conventional C) Refinancings D) Home Improvement Loans E) Loans on Dwellings For 5+ Families F) Non-occupant Loans on Number Average Value Number Average Value Number Average Value Number Average Value Number Average Value Number Average Value
LOANS ORIGINATED 99 $72,258 351 $72,618 754 $58,923 103 $13,018 2 $277,870 78 $47,558 APPLICATIONS APPROVED, NOT ACCEPTED 3 $60,327 48 $56,253 265 $56,308 53 $14,083 0 $0 18 $62,554 APPLICATIONS DENIED 10 $72,561 119 $53,420 415 $56,710 175 $11,529 0 $0 27 $42,669 APPLICATIONS WITHDRAWN 12 $68,997 31 $61,535 212 $59,362 18 $37,059 0 $0 10 $48,010 FILES CLOSED FOR INCOMPLETENESS 2 $82,500 12 $54,182 78 $57,764 1 $19,940 0 $0 4 $41,325
Detailed mortgage data for all 14 tracts in Massillon, OH
Private Mortgage Insurance Companies Aggregated Statistics For Year 2009(Based on 2 full and 6 partial tracts) A) Conventional B) Refinancings C) Non-occupant Loans on Number Average Value Number Average Value Number Average Value
LOANS ORIGINATED 9 $109,286 7 $137,479 2 $31,735 APPLICATIONS APPROVED, NOT ACCEPTED 5 $129,976 4 $141,078 0 $0 APPLICATIONS DENIED 4 $92,652 1 $149,440 0 $0 APPLICATIONS WITHDRAWN 1 $215,120 1 $223,840 0 $0 FILES CLOSED FOR INCOMPLETENESS 0 $0 0 $0 0 $0
Aggregated Statistics For Year 2008(Based on 6 full and 7 partial tracts) A) Conventional B) Refinancings C) Non-occupant Loans on Number Average Value Number Average Value Number Average Value
LOANS ORIGINATED 47 $116,117 22 $105,300 8 $57,946 APPLICATIONS APPROVED, NOT ACCEPTED 24 $111,795 18 $110,838 4 $80,370 APPLICATIONS DENIED 3 $101,623 1 $191,500 1 $74,860 APPLICATIONS WITHDRAWN 4 $132,340 3 $86,743 0 $0 FILES CLOSED FOR INCOMPLETENESS 1 $356,240 3 $128,823 3 $128,823
Aggregated Statistics For Year 2007(Based on 7 full and 7 partial tracts) A) Conventional B) Refinancings C) Non-occupant Loans on D) Loans On Manufactured Number Average Value Number Average Value Number Average Value Number Average Value
LOANS ORIGINATED 148 $91,894 48 $101,892 11 $57,355 1 $61,930 APPLICATIONS APPROVED, NOT ACCEPTED 11 $85,482 18 $97,997 3 $61,610 0 $0 APPLICATIONS DENIED 7 $93,714 1 $164,900 0 $0 0 $0 APPLICATIONS WITHDRAWN 8 $107,205 5 $113,442 0 $0 0 $0 FILES CLOSED FOR INCOMPLETENESS 0 $0 0 $0 0 $0 0 $0
Aggregated Statistics For Year 2006(Based on 6 full and 7 partial tracts) A) Conventional B) Refinancings C) Non-occupant Loans on D) Loans On Manufactured Number Average Value Number Average Value Number Average Value Number Average Value
LOANS ORIGINATED 109 $85,949 34 $96,432 17 $54,367 2 $75,965 APPLICATIONS APPROVED, NOT ACCEPTED 11 $94,667 20 $106,740 0 $0 1 $69,850 APPLICATIONS DENIED 6 $38,203 1 $83,000 4 $22,682 0 $0 APPLICATIONS WITHDRAWN 5 $64,600 5 $93,324 1 $36,730 1 $34,930 FILES CLOSED FOR INCOMPLETENESS 0 $0 1 $78,000 1 $78,000 0 $0
Aggregated Statistics For Year 2005(Based on 7 full and 7 partial tracts) A) Conventional B) Refinancings C) Non-occupant Loans on D) Loans On Manufactured Number Average Value Number Average Value Number Average Value Number Average Value
LOANS ORIGINATED 94 $90,522 42 $101,032 15 $58,506 1 $117,000 APPLICATIONS APPROVED, NOT ACCEPTED 9 $110,996 27 $99,774 2 $105,500 0 $0 APPLICATIONS DENIED 5 $68,520 5 $108,964 3 $69,210 0 $0 APPLICATIONS WITHDRAWN 0 $0 3 $137,193 0 $0 0 $0 FILES CLOSED FOR INCOMPLETENESS 0 $0 2 $101,085 0 $0 0 $0
Aggregated Statistics For Year 2004(Based on 7 full and 7 partial tracts) A) Conventional B) Refinancings C) Non-occupant Loans on Number Average Value Number Average Value Number Average Value
LOANS ORIGINATED 85 $80,900 62 $102,398 24 $53,736 APPLICATIONS APPROVED, NOT ACCEPTED 12 $89,921 39 $99,986 3 $74,667 APPLICATIONS DENIED 1 $41,000 3 $163,500 1 $41,000 APPLICATIONS WITHDRAWN 3 $87,197 11 $103,959 0 $0 FILES CLOSED FOR INCOMPLETENESS 0 $0 0 $0 0 $0
Aggregated Statistics For Year 2003(Based on 7 full and 7 partial tracts) A) Conventional B) Refinancings C) Non-occupant Loans on Number Average Value Number Average Value Number Average Value
LOANS ORIGINATED 135 $92,959 123 $98,714 21 $62,281 APPLICATIONS APPROVED, NOT ACCEPTED 17 $92,378 51 $100,671 4 $69,042 APPLICATIONS DENIED 2 $63,290 3 $102,003 2 $57,050 APPLICATIONS WITHDRAWN 2 $96,640 20 $92,759 1 $110,620 FILES CLOSED FOR INCOMPLETENESS 0 $0 2 $74,500 0 $0
Aggregated Statistics For Year 2002(Based on 7 full and 5 partial tracts) A) Conventional B) Refinancings C) Non-occupant Loans on Number Average Value Number Average Value Number Average Value
LOANS ORIGINATED 112 $84,809 99 $97,813 14 $68,628 APPLICATIONS APPROVED, NOT ACCEPTED 9 $121,232 30 $104,914 2 $74,170 APPLICATIONS DENIED 3 $40,000 4 $64,500 3 $53,000 APPLICATIONS WITHDRAWN 5 $69,984 16 $110,539 4 $98,808 FILES CLOSED FOR INCOMPLETENESS 0 $0 2 $89,000 0 $0
Aggregated Statistics For Year 2001(Based on 7 full and 5 partial tracts) A) Conventional B) Refinancings C) Non-occupant Loans on Number Average Value Number Average Value Number Average Value
LOANS ORIGINATED 97 $91,618 119 $91,859 16 $56,924 APPLICATIONS APPROVED, NOT ACCEPTED 14 $101,296 22 $96,088 2 $49,645 APPLICATIONS DENIED 0 $0 8 $74,530 1 $64,000 APPLICATIONS WITHDRAWN 0 $0 6 $95,017 1 $81,000 FILES CLOSED FOR INCOMPLETENESS 2 $72,000 2 $65,850 2 $72,000
Aggregated Statistics For Year 2000(Based on 7 full and 5 partial tracts) A) Conventional B) Refinancings C) Non-occupant Loans on Number Average Value Number Average Value Number Average Value
LOANS ORIGINATED 93 $82,407 27 $77,079 17 $60,358 APPLICATIONS APPROVED, NOT ACCEPTED 8 $81,135 6 $75,297 2 $75,000 APPLICATIONS DENIED 3 $49,613 9 $87,598 1 $72,000 APPLICATIONS WITHDRAWN 1 $63,000 3 $77,090 0 $0 FILES CLOSED FOR INCOMPLETENESS 1 $33,240 1 $82,810 1 $82,810
Aggregated Statistics For Year 1999(Based on 7 full and 6 partial tracts) A) Conventional B) Refinancings C) Non-occupant Loans on Number Average Value Number Average Value Number Average Value
LOANS ORIGINATED 107 $84,101 56 $76,262 7 $55,949 APPLICATIONS APPROVED, NOT ACCEPTED 9 $118,258 7 $80,004 0 $0 APPLICATIONS DENIED 5 $65,250 6 $94,880 0 $0 APPLICATIONS WITHDRAWN 3 $76,893 1 $73,560 1 $50,000 FILES CLOSED FOR INCOMPLETENESS 2 $139,460 0 $0 0 $0
Most common first names in Massillon, OH among deceased individuals Name Count Lived (average)
Mary 657 79.5 years John 544 74.6 years William 461 73.9 years Robert 421 70.5 years James 371 70.2 years Helen 319 79.4 years Charles 318 73.5 years George 280 76.2 years Margaret 236 77.8 years Joseph 229 74.6 years
Most common last names in Massillon, OH among deceased individuals Last name Count Lived (average)
Smith 248 76.8 years Miller 198 77.6 years Williams 113 73.0 years Brown 102 73.7 years Jones 95 76.4 years Snyder 86 77.0 years Davis 80 71.6 years Johnson 71 76.1 years Thomas 71 74.5 years Martin 68 71.0 years
Massillon compared to Ohio state average:
Median house value below state average. Unemployed percentage significantly below state average. Hispanic race population percentage below state average. Foreign-born population percentage significantly below state average.
#38 on the list of "Top 101 cities with the most residents born in Other Western Europe (population 500+)"
#67 on the list of "Top 101 cities with the largest percentage of people in training schools for juvenile delinquents (population 1,000+)"
#2 on the list of "Top 101 counties with the largest increase in the number of infant deaths per 1000 residents 2000-2006 to 2007-2013 (pop. 50,000+)"
#23 on the list of "Top 101 counties with the lowest percentage of residents relocating from other counties between 2010 and 2011 (pop. 50,000+)"
#25 on the list of "Top 101 counties with the lowest percentage of residents relocating to other counties in 2011 (pop. 50,000+)"
#27 on the list of "Top 101 counties with the lowest percentage of residents relocating to foreign countries in 2011"
#27 on the list of "Top 101 counties with the highest number of infant deaths per 1000 residents 2007-2013 (pop. 50,000+)"
Top Patent Applicants
Jay Paul Drummond (41)
Xiaolan Ai (23)
Gary Robert Burg (22)
Patrick M. Culpepper (14)
Gerald P. Fox (13)
David L. Kraft (13)
Mindaugas Rackaitis (12)
Dale Eugene Wells (12)
Jay D. White (12)
Craig Kneidel (12)
Total of 496 patent applications in 2008-2024.
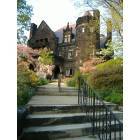
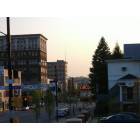

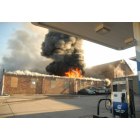
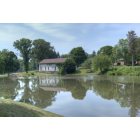

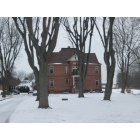


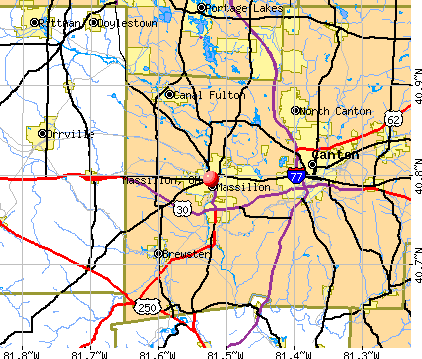


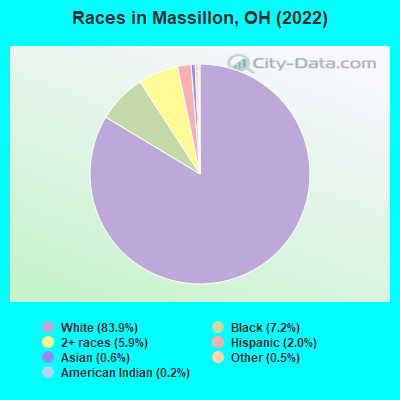
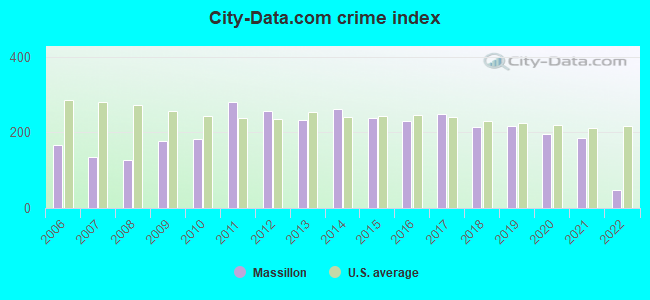
 Recent articles from our blog. Our writers, many of them Ph.D. graduates or candidates, create easy-to-read articles on a wide variety of topics.


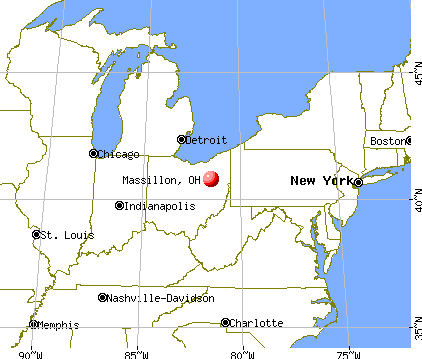
 (7.7 miles
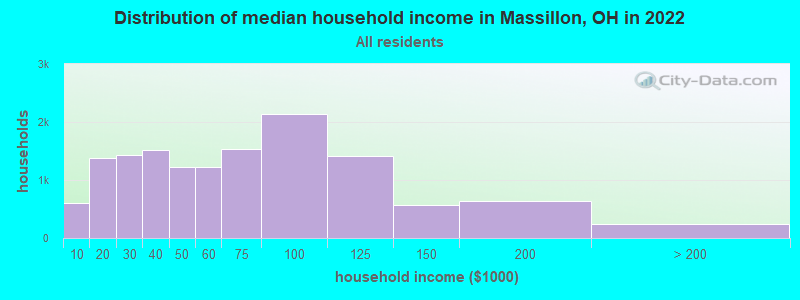
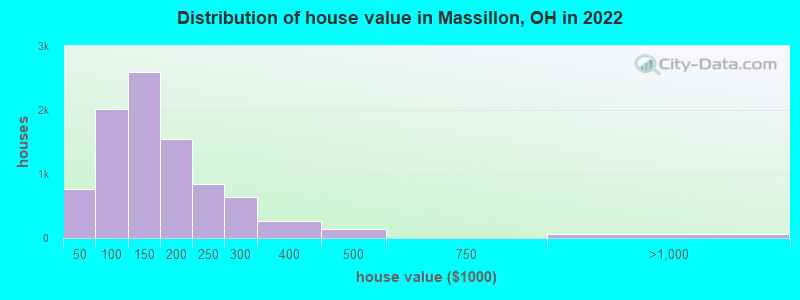
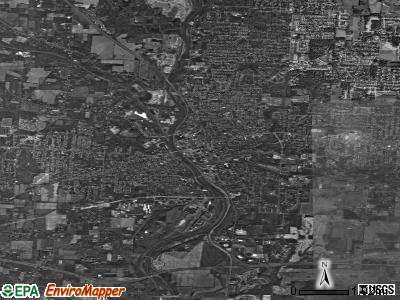
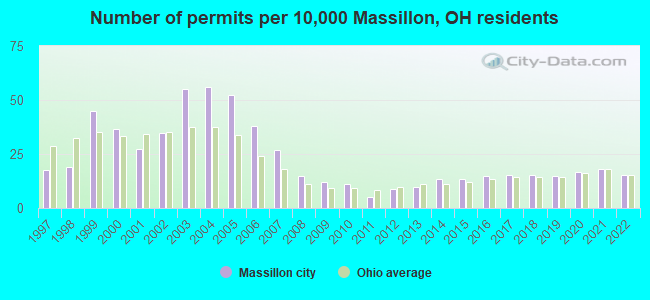
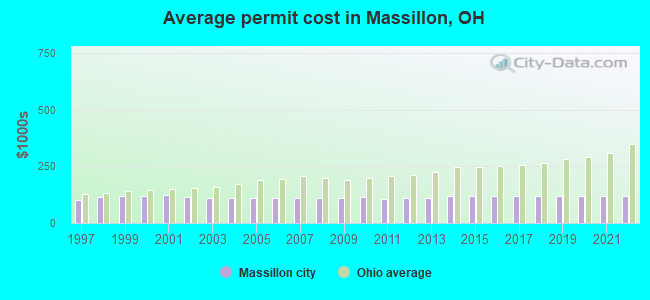
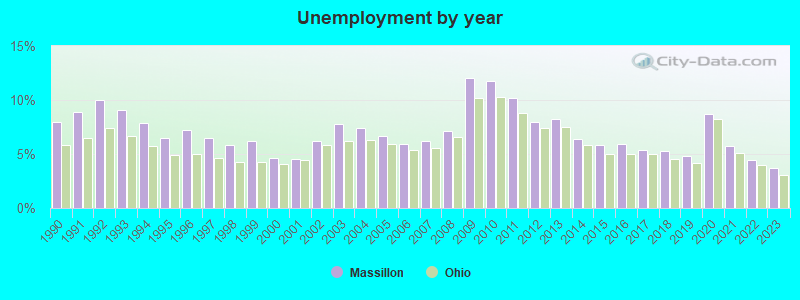
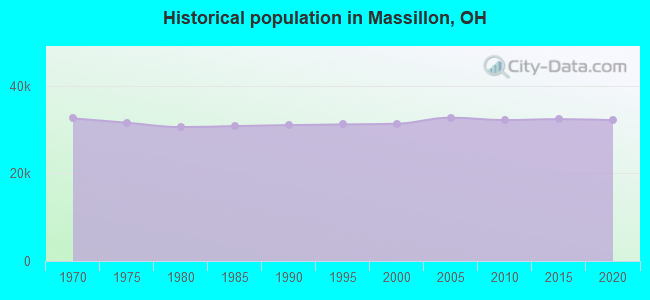
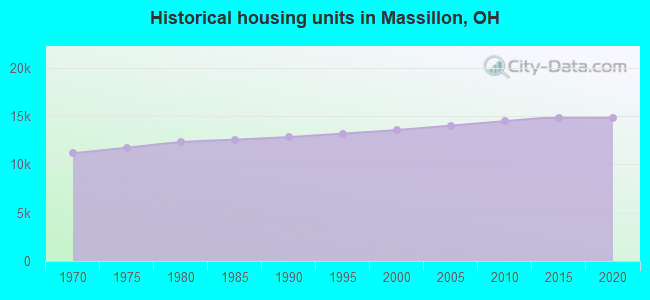
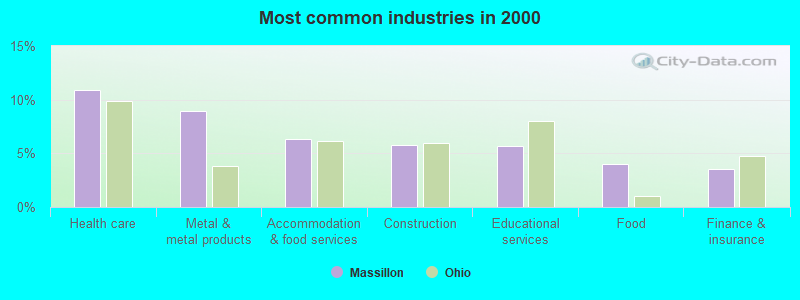
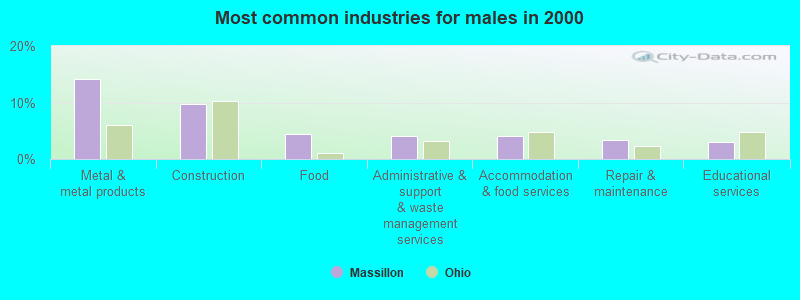
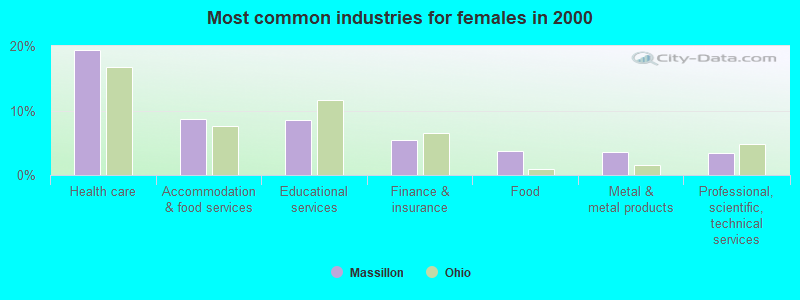
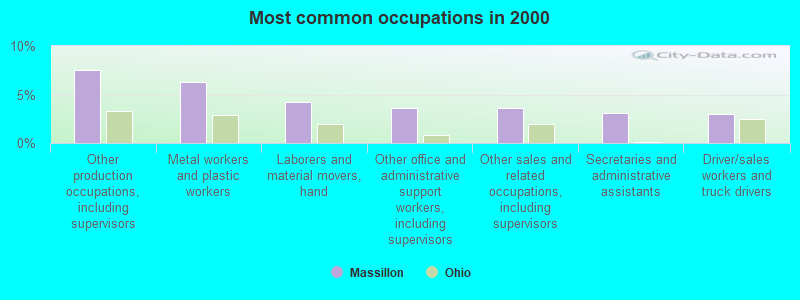
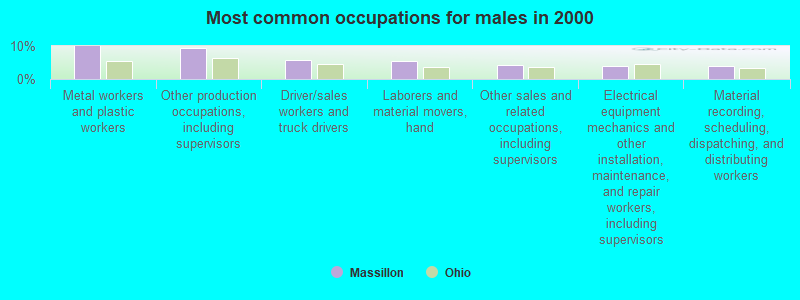
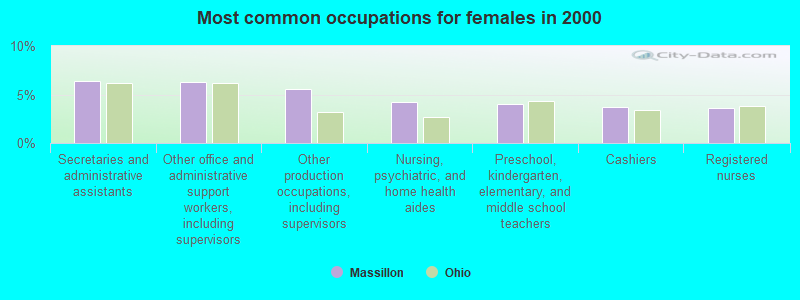
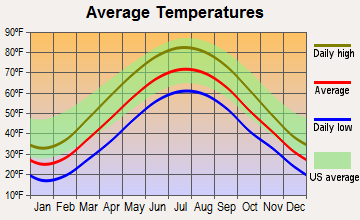
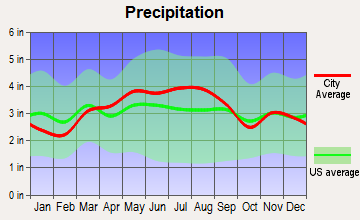
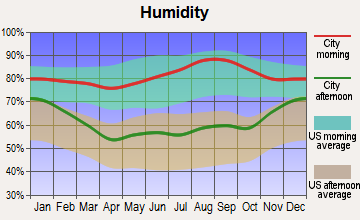
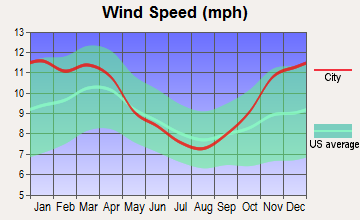
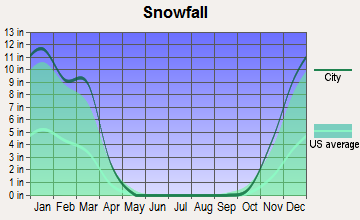
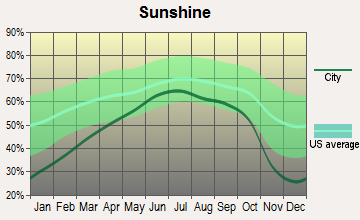
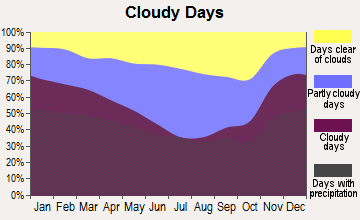
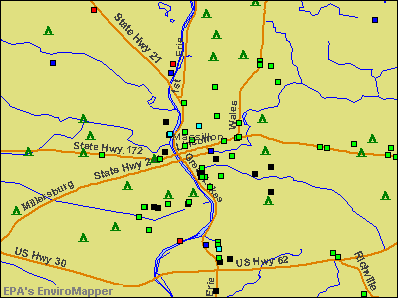

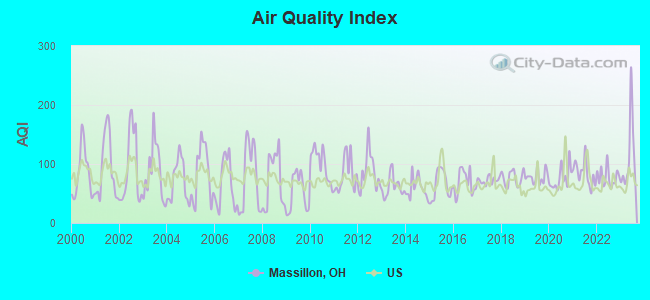
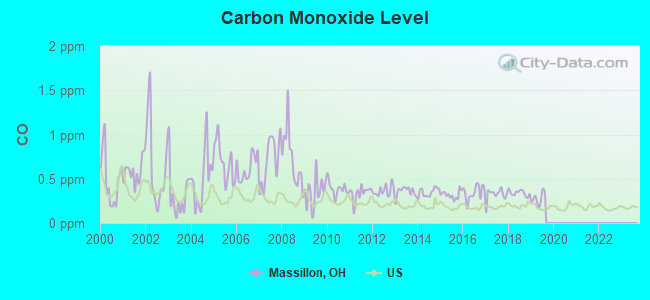
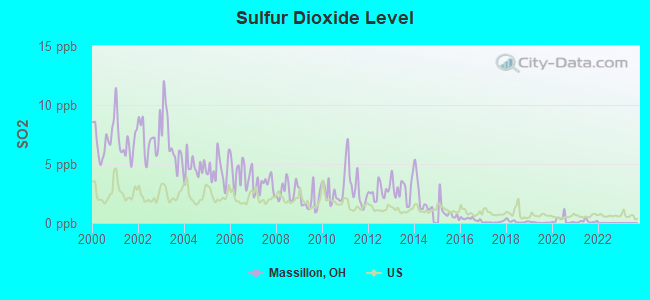
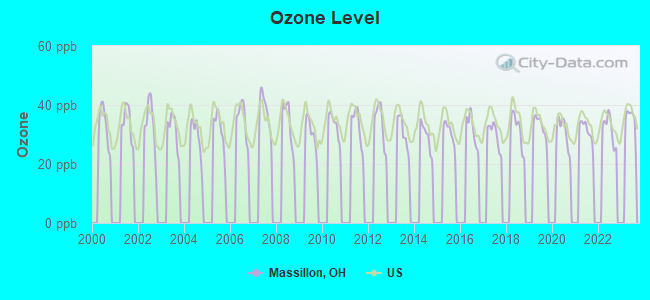
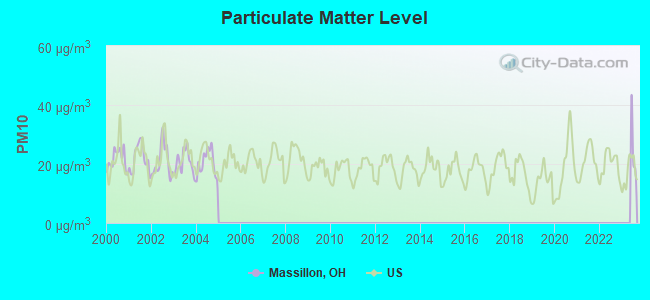
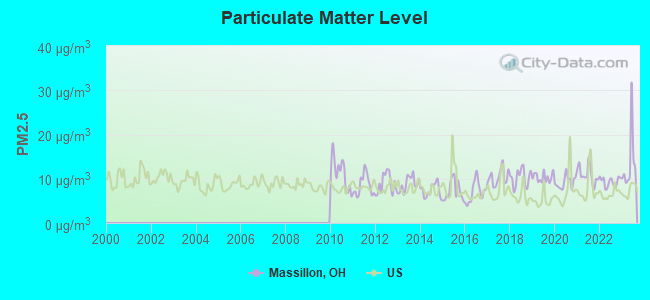

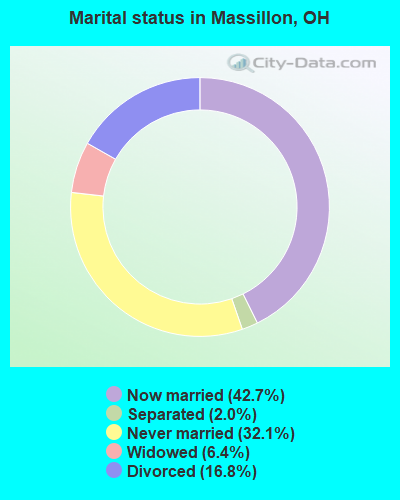
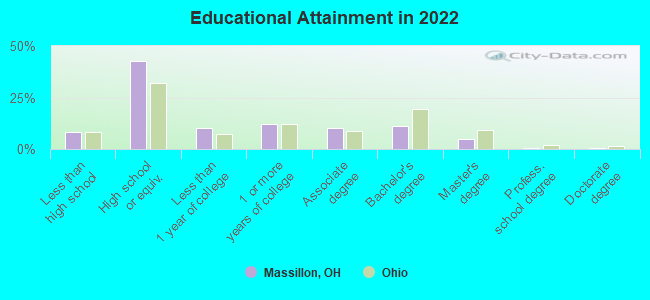
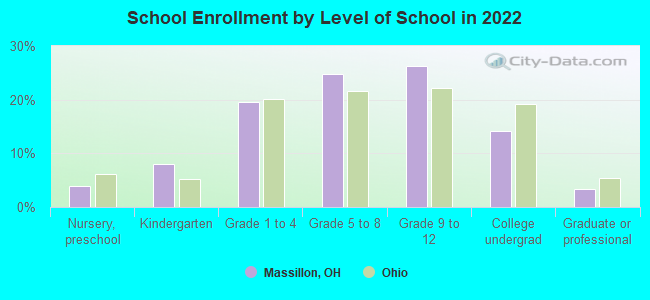
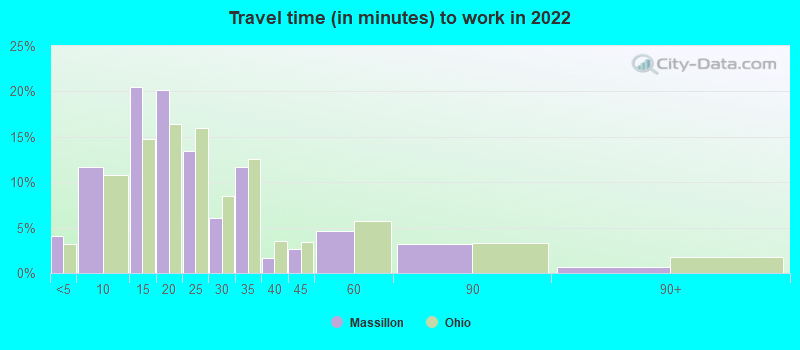
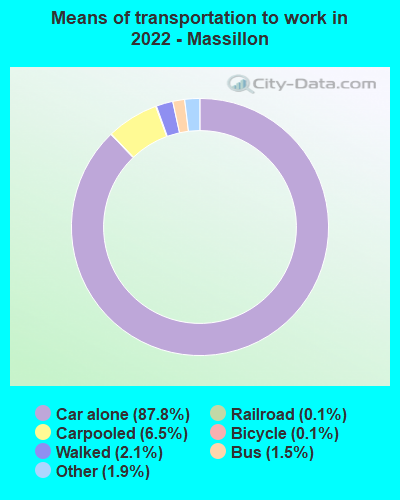
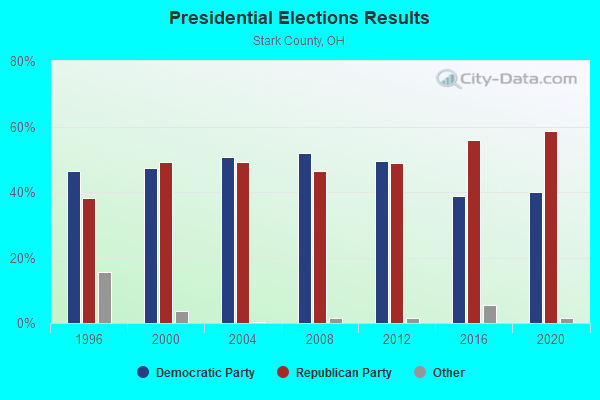
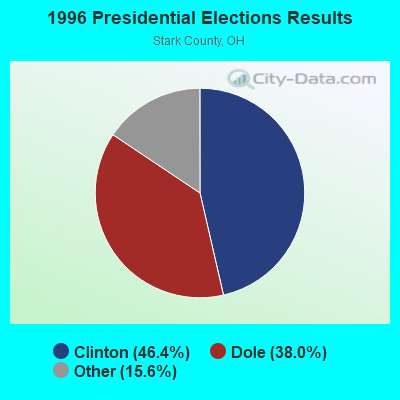
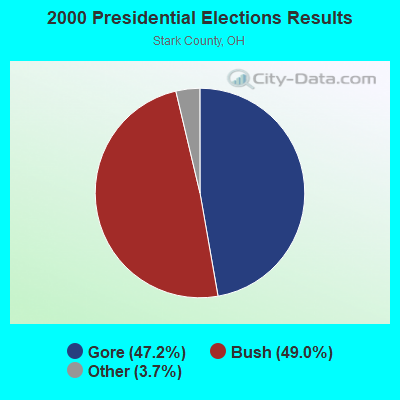
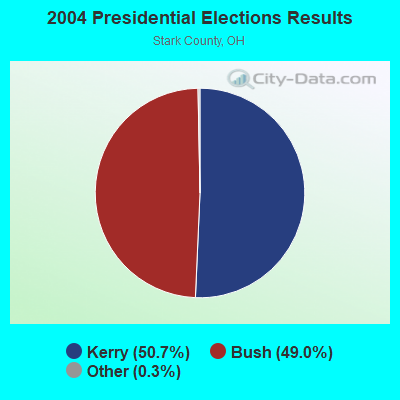
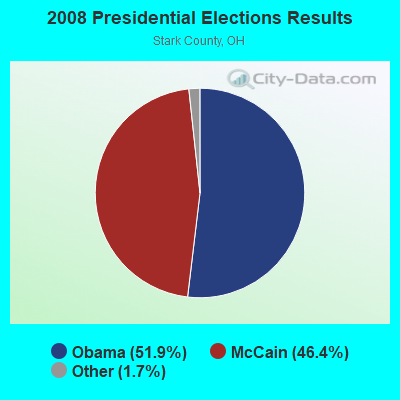
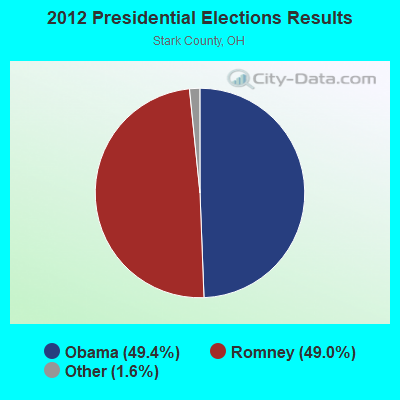
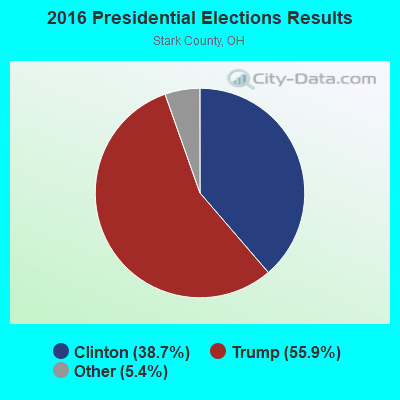
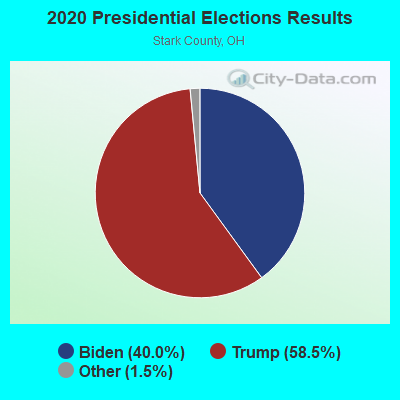
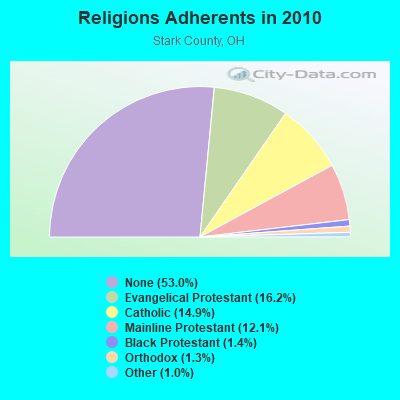
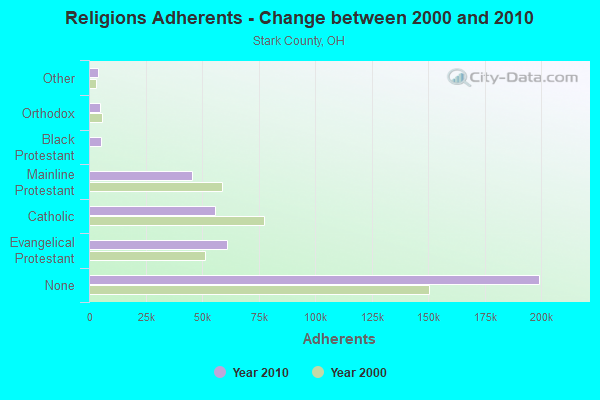
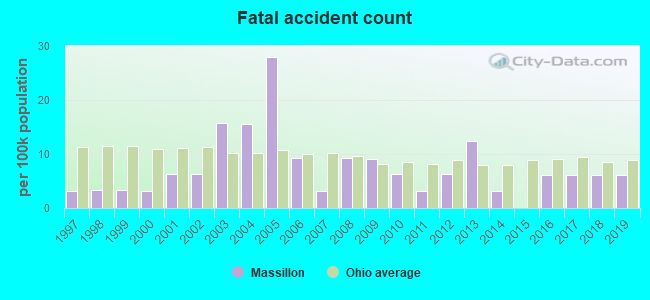
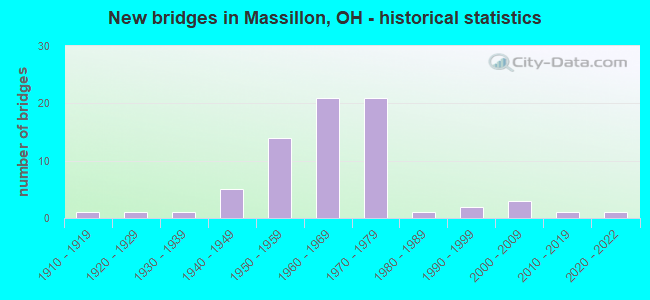
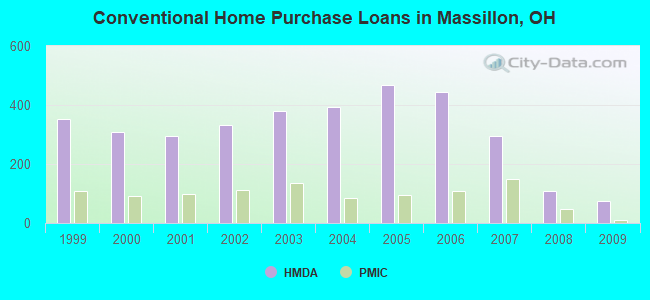
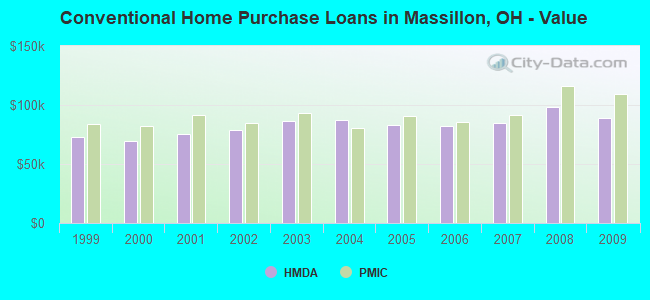
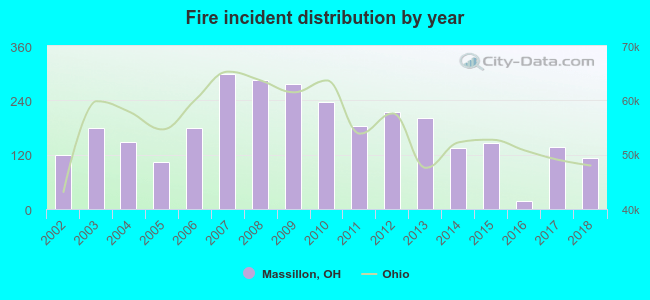 According to the data from the years 2002 - 2018 the average number of fire incidents per year is 175. The highest number of fires - 299 took place in 2007, and the least - 18 in 2016. The data has a decreasing trend.
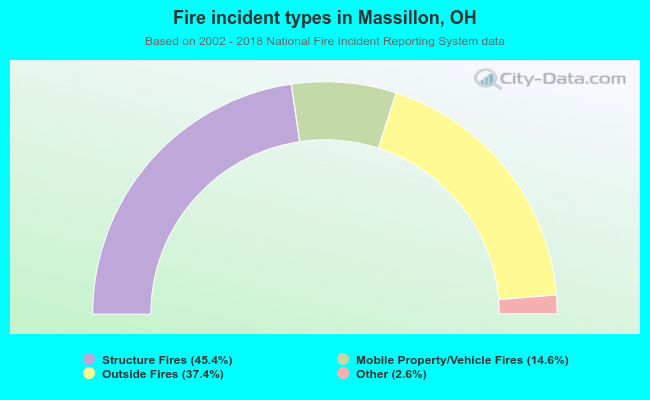 When looking into fire subcategories, the most reports belonged to: Structure Fires (45.4%), and Outside Fires (37.4%).