Medford, Massachusetts Submit your own pictures of this city and show them to the world
OSM Map
General Map
Google Map
MSN Map
OSM Map
General Map
Google Map
MSN Map
OSM Map
General Map
Google Map
MSN Map
OSM Map
General Map
Google Map
MSN Map
Please wait while loading the map...
Population in 2022: 65,399 (100% urban, 0% rural). Population change since 2000: +17.3%Males: 29,971 Females: 35,428
March 2022 cost of living index in Medford: 139.3 (high, U.S. average is 100) Percentage of residents living in poverty in 2022: 6.3%for White Non-Hispanic residents , 14.1% for Black residents , 4.8% for Hispanic or Latino residents , 50.0% for American Indian residents , 4.1% for other race residents , 5.2% for two or more races residents )
Profiles of local businesses
Business Search - 14 Million verified businesses
Data:
Median household income ($)
Median household income (% change since 2000)
Household income diversity
Ratio of average income to average house value (%)
Ratio of average income to average rent
Median household income ($) - White
Median household income ($) - Black or African American
Median household income ($) - Asian
Median household income ($) - Hispanic or Latino
Median household income ($) - American Indian and Alaska Native
Median household income ($) - Multirace
Median household income ($) - Other Race
Median household income for houses/condos with a mortgage ($)
Median household income for apartments without a mortgage ($)
Races - White alone (%)
Races - White alone (% change since 2000)
Races - Black alone (%)
Races - Black alone (% change since 2000)
Races - American Indian alone (%)
Races - American Indian alone (% change since 2000)
Races - Asian alone (%)
Races - Asian alone (% change since 2000)
Races - Hispanic (%)
Races - Hispanic (% change since 2000)
Races - Native Hawaiian and Other Pacific Islander alone (%)
Races - Native Hawaiian and Other Pacific Islander alone (% change since 2000)
Races - Two or more races (%)
Races - Two or more races (% change since 2000)
Races - Other race alone (%)
Races - Other race alone (% change since 2000)
Racial diversity
Unemployment (%)
Unemployment (% change since 2000)
Unemployment (%) - White
Unemployment (%) - Black or African American
Unemployment (%) - Asian
Unemployment (%) - Hispanic or Latino
Unemployment (%) - American Indian and Alaska Native
Unemployment (%) - Multirace
Unemployment (%) - Other Race
Population density (people per square mile)
Population - Males (%)
Population - Females (%)
Population - Males (%) - White
Population - Males (%) - Black or African American
Population - Males (%) - Asian
Population - Males (%) - Hispanic or Latino
Population - Males (%) - American Indian and Alaska Native
Population - Males (%) - Multirace
Population - Males (%) - Other Race
Population - Females (%) - White
Population - Females (%) - Black or African American
Population - Females (%) - Asian
Population - Females (%) - Hispanic or Latino
Population - Females (%) - American Indian and Alaska Native
Population - Females (%) - Multirace
Population - Females (%) - Other Race
Coronavirus confirmed cases (Apr 18, 2024)
Deaths caused by coronavirus (Apr 18, 2024)
Coronavirus confirmed cases (per 100k population) (Apr 18, 2024)
Deaths caused by coronavirus (per 100k population) (Apr 18, 2024)
Daily increase in number of cases (Apr 18, 2024)
Weekly increase in number of cases (Apr 18, 2024)
Cases doubled (in days) (Apr 18, 2024)
Hospitalized patients (Apr 18, 2022)
Negative test results (Apr 18, 2022)
Total test results (Apr 18, 2022)
COVID Vaccine doses distributed (per 100k population) (Sep 19, 2023)
COVID Vaccine doses administered (per 100k population) (Sep 19, 2023)
COVID Vaccine doses distributed (Sep 19, 2023)
COVID Vaccine doses administered (Sep 19, 2023)
Likely homosexual households (%)
Likely homosexual households (% change since 2000)
Likely homosexual households - Lesbian couples (%)
Likely homosexual households - Lesbian couples (% change since 2000)
Likely homosexual households - Gay men (%)
Likely homosexual households - Gay men (% change since 2000)
Cost of living index
Median gross rent ($)
Median contract rent ($)
Median monthly housing costs ($)
Median house or condo value ($)
Median house or condo value ($ change since 2000)
Mean house or condo value by units in structure - 1, detached ($)
Mean house or condo value by units in structure - 1, attached ($)
Mean house or condo value by units in structure - 2 ($)
Mean house or condo value by units in structure by units in structure - 3 or 4 ($)
Mean house or condo value by units in structure - 5 or more ($)
Mean house or condo value by units in structure - Boat, RV, van, etc. ($)
Mean house or condo value by units in structure - Mobile home ($)
Median house or condo value ($) - White
Median house or condo value ($) - Black or African American
Median house or condo value ($) - Asian
Median house or condo value ($) - Hispanic or Latino
Median house or condo value ($) - American Indian and Alaska Native
Median house or condo value ($) - Multirace
Median house or condo value ($) - Other Race
Median resident age
Resident age diversity
Median resident age - Males
Median resident age - Females
Median resident age - White
Median resident age - Black or African American
Median resident age - Asian
Median resident age - Hispanic or Latino
Median resident age - American Indian and Alaska Native
Median resident age - Multirace
Median resident age - Other Race
Median resident age - Males - White
Median resident age - Males - Black or African American
Median resident age - Males - Asian
Median resident age - Males - Hispanic or Latino
Median resident age - Males - American Indian and Alaska Native
Median resident age - Males - Multirace
Median resident age - Males - Other Race
Median resident age - Females - White
Median resident age - Females - Black or African American
Median resident age - Females - Asian
Median resident age - Females - Hispanic or Latino
Median resident age - Females - American Indian and Alaska Native
Median resident age - Females - Multirace
Median resident age - Females - Other Race
Commute - mean travel time to work (minutes)
Travel time to work - Less than 5 minutes (%)
Travel time to work - Less than 5 minutes (% change since 2000)
Travel time to work - 5 to 9 minutes (%)
Travel time to work - 5 to 9 minutes (% change since 2000)
Travel time to work - 10 to 19 minutes (%)
Travel time to work - 10 to 19 minutes (% change since 2000)
Travel time to work - 20 to 29 minutes (%)
Travel time to work - 20 to 29 minutes (% change since 2000)
Travel time to work - 30 to 39 minutes (%)
Travel time to work - 30 to 39 minutes (% change since 2000)
Travel time to work - 40 to 59 minutes (%)
Travel time to work - 40 to 59 minutes (% change since 2000)
Travel time to work - 60 to 89 minutes (%)
Travel time to work - 60 to 89 minutes (% change since 2000)
Travel time to work - 90 or more minutes (%)
Travel time to work - 90 or more minutes (% change since 2000)
Marital status - Never married (%)
Marital status - Now married (%)
Marital status - Separated (%)
Marital status - Widowed (%)
Marital status - Divorced (%)
Median family income ($)
Median family income (% change since 2000)
Median non-family income ($)
Median non-family income (% change since 2000)
Median per capita income ($)
Median per capita income (% change since 2000)
Median family income ($) - White
Median family income ($) - Black or African American
Median family income ($) - Asian
Median family income ($) - Hispanic or Latino
Median family income ($) - American Indian and Alaska Native
Median family income ($) - Multirace
Median family income ($) - Other Race
Median year house/condo built
Median year apartment built
Year house built - Built 2005 or later (%)
Year house built - Built 2000 to 2004 (%)
Year house built - Built 1990 to 1999 (%)
Year house built - Built 1980 to 1989 (%)
Year house built - Built 1970 to 1979 (%)
Year house built - Built 1960 to 1969 (%)
Year house built - Built 1950 to 1959 (%)
Year house built - Built 1940 to 1949 (%)
Year house built - Built 1939 or earlier (%)
Average household size
Household density (households per square mile)
Average household size - White
Average household size - Black or African American
Average household size - Asian
Average household size - Hispanic or Latino
Average household size - American Indian and Alaska Native
Average household size - Multirace
Average household size - Other Race
Occupied housing units (%)
Vacant housing units (%)
Owner occupied housing units (%)
Renter occupied housing units (%)
Vacancy status - For rent (%)
Vacancy status - For sale only (%)
Vacancy status - Rented or sold, not occupied (%)
Vacancy status - For seasonal, recreational, or occasional use (%)
Vacancy status - For migrant workers (%)
Vacancy status - Other vacant (%)
Residents with income below the poverty level (%)
Residents with income below 50% of the poverty level (%)
Children below poverty level (%)
Poor families by family type - Married-couple family (%)
Poor families by family type - Male, no wife present (%)
Poor families by family type - Female, no husband present (%)
Poverty status for native-born residents (%)
Poverty status for foreign-born residents (%)
Poverty among high school graduates not in families (%)
Poverty among people who did not graduate high school not in families (%)
Residents with income below the poverty level (%) - White
Residents with income below the poverty level (%) - Black or African American
Residents with income below the poverty level (%) - Asian
Residents with income below the poverty level (%) - Hispanic or Latino
Residents with income below the poverty level (%) - American Indian and Alaska Native
Residents with income below the poverty level (%) - Multirace
Residents with income below the poverty level (%) - Other Race
Air pollution - Air Quality Index (AQI)
Air pollution - CO
Air pollution - NO2
Air pollution - SO2
Air pollution - Ozone
Air pollution - PM10
Air pollution - PM25
Air pollution - Pb
Crime - Murders per 100,000 population
Crime - Rapes per 100,000 population
Crime - Robberies per 100,000 population
Crime - Assaults per 100,000 population
Crime - Burglaries per 100,000 population
Crime - Thefts per 100,000 population
Crime - Auto thefts per 100,000 population
Crime - Arson per 100,000 population
Crime - City-data.com crime index
Crime - Violent crime index
Crime - Property crime index
Crime - Murders per 100,000 population (5 year average)
Crime - Rapes per 100,000 population (5 year average)
Crime - Robberies per 100,000 population (5 year average)
Crime - Assaults per 100,000 population (5 year average)
Crime - Burglaries per 100,000 population (5 year average)
Crime - Thefts per 100,000 population (5 year average)
Crime - Auto thefts per 100,000 population (5 year average)
Crime - Arson per 100,000 population (5 year average)
Crime - City-data.com crime index (5 year average)
Crime - Violent crime index (5 year average)
Crime - Property crime index (5 year average)
1996 Presidential Elections Results (%) - Democratic Party (Clinton)
1996 Presidential Elections Results (%) - Republican Party (Dole)
1996 Presidential Elections Results (%) - Other
2000 Presidential Elections Results (%) - Democratic Party (Gore)
2000 Presidential Elections Results (%) - Republican Party (Bush)
2000 Presidential Elections Results (%) - Other
2004 Presidential Elections Results (%) - Democratic Party (Kerry)
2004 Presidential Elections Results (%) - Republican Party (Bush)
2004 Presidential Elections Results (%) - Other
2008 Presidential Elections Results (%) - Democratic Party (Obama)
2008 Presidential Elections Results (%) - Republican Party (McCain)
2008 Presidential Elections Results (%) - Other
2012 Presidential Elections Results (%) - Democratic Party (Obama)
2012 Presidential Elections Results (%) - Republican Party (Romney)
2012 Presidential Elections Results (%) - Other
2016 Presidential Elections Results (%) - Democratic Party (Clinton)
2016 Presidential Elections Results (%) - Republican Party (Trump)
2016 Presidential Elections Results (%) - Other
2020 Presidential Elections Results (%) - Democratic Party (Biden)
2020 Presidential Elections Results (%) - Republican Party (Trump)
2020 Presidential Elections Results (%) - Other
Ancestries Reported - Arab (%)
Ancestries Reported - Czech (%)
Ancestries Reported - Danish (%)
Ancestries Reported - Dutch (%)
Ancestries Reported - English (%)
Ancestries Reported - French (%)
Ancestries Reported - French Canadian (%)
Ancestries Reported - German (%)
Ancestries Reported - Greek (%)
Ancestries Reported - Hungarian (%)
Ancestries Reported - Irish (%)
Ancestries Reported - Italian (%)
Ancestries Reported - Lithuanian (%)
Ancestries Reported - Norwegian (%)
Ancestries Reported - Polish (%)
Ancestries Reported - Portuguese (%)
Ancestries Reported - Russian (%)
Ancestries Reported - Scotch-Irish (%)
Ancestries Reported - Scottish (%)
Ancestries Reported - Slovak (%)
Ancestries Reported - Subsaharan African (%)
Ancestries Reported - Swedish (%)
Ancestries Reported - Swiss (%)
Ancestries Reported - Ukrainian (%)
Ancestries Reported - United States (%)
Ancestries Reported - Welsh (%)
Ancestries Reported - West Indian (%)
Ancestries Reported - Other (%)
Educational Attainment - No schooling completed (%)
Educational Attainment - Less than high school (%)
Educational Attainment - High school or equivalent (%)
Educational Attainment - Less than 1 year of college (%)
Educational Attainment - 1 or more years of college (%)
Educational Attainment - Associate degree (%)
Educational Attainment - Bachelor's degree (%)
Educational Attainment - Master's degree (%)
Educational Attainment - Professional school degree (%)
Educational Attainment - Doctorate degree (%)
School Enrollment - Nursery, preschool (%)
School Enrollment - Kindergarten (%)
School Enrollment - Grade 1 to 4 (%)
School Enrollment - Grade 5 to 8 (%)
School Enrollment - Grade 9 to 12 (%)
School Enrollment - College undergrad (%)
School Enrollment - Graduate or professional (%)
School Enrollment - Not enrolled in school (%)
School enrollment - Public schools (%)
School enrollment - Private schools (%)
School enrollment - Not enrolled (%)
Median number of rooms in houses and condos
Median number of rooms in apartments
Housing units lacking complete plumbing facilities (%)
Housing units lacking complete kitchen facilities (%)
Density of houses
Urban houses (%)
Rural houses (%)
Households with people 60 years and over (%)
Households with people 65 years and over (%)
Households with people 75 years and over (%)
Households with one or more nonrelatives (%)
Households with no nonrelatives (%)
Population in households (%)
Family households (%)
Nonfamily households (%)
Population in families (%)
Family households with own children (%)
Median number of bedrooms in owner occupied houses
Mean number of bedrooms in owner occupied houses
Median number of bedrooms in renter occupied houses
Mean number of bedrooms in renter occupied houses
Median number of vehichles in owner occupied houses
Mean number of vehichles in owner occupied houses
Median number of vehichles in renter occupied houses
Mean number of vehichles in renter occupied houses
Mortgage status - with mortgage (%)
Mortgage status - with second mortgage (%)
Mortgage status - with home equity loan (%)
Mortgage status - with both second mortgage and home equity loan (%)
Mortgage status - without a mortgage (%)
Average family size
Average family size - White
Average family size - Black or African American
Average family size - Asian
Average family size - Hispanic or Latino
Average family size - American Indian and Alaska Native
Average family size - Multirace
Average family size - Other Race
Geographical mobility - Same house 1 year ago (%)
Geographical mobility - Moved within same county (%)
Geographical mobility - Moved from different county within same state (%)
Geographical mobility - Moved from different state (%)
Geographical mobility - Moved from abroad (%)
Place of birth - Born in state of residence (%)
Place of birth - Born in other state (%)
Place of birth - Native, outside of US (%)
Place of birth - Foreign born (%)
Housing units in structures - 1, detached (%)
Housing units in structures - 1, attached (%)
Housing units in structures - 2 (%)
Housing units in structures - 3 or 4 (%)
Housing units in structures - 5 to 9 (%)
Housing units in structures - 10 to 19 (%)
Housing units in structures - 20 to 49 (%)
Housing units in structures - 50 or more (%)
Housing units in structures - Mobile home (%)
Housing units in structures - Boat, RV, van, etc. (%)
House/condo owner moved in on average (years ago)
Renter moved in on average (years ago)
Year householder moved into unit - Moved in 1999 to March 2000 (%)
Year householder moved into unit - Moved in 1995 to 1998 (%)
Year householder moved into unit - Moved in 1990 to 1994 (%)
Year householder moved into unit - Moved in 1980 to 1989 (%)
Year householder moved into unit - Moved in 1970 to 1979 (%)
Year householder moved into unit - Moved in 1969 or earlier (%)
Means of transportation to work - Drove car alone (%)
Means of transportation to work - Carpooled (%)
Means of transportation to work - Public transportation (%)
Means of transportation to work - Bus or trolley bus (%)
Means of transportation to work - Streetcar or trolley car (%)
Means of transportation to work - Subway or elevated (%)
Means of transportation to work - Railroad (%)
Means of transportation to work - Ferryboat (%)
Means of transportation to work - Taxicab (%)
Means of transportation to work - Motorcycle (%)
Means of transportation to work - Bicycle (%)
Means of transportation to work - Walked (%)
Means of transportation to work - Other means (%)
Working at home (%)
Industry diversity
Most Common Industries - Agriculture, forestry, fishing and hunting, and mining (%)
Most Common Industries - Agriculture, forestry, fishing and hunting (%)
Most Common Industries - Mining, quarrying, and oil and gas extraction (%)
Most Common Industries - Construction (%)
Most Common Industries - Manufacturing (%)
Most Common Industries - Wholesale trade (%)
Most Common Industries - Retail trade (%)
Most Common Industries - Transportation and warehousing, and utilities (%)
Most Common Industries - Transportation and warehousing (%)
Most Common Industries - Utilities (%)
Most Common Industries - Information (%)
Most Common Industries - Finance and insurance, and real estate and rental and leasing (%)
Most Common Industries - Finance and insurance (%)
Most Common Industries - Real estate and rental and leasing (%)
Most Common Industries - Professional, scientific, and management, and administrative and waste management services (%)
Most Common Industries - Professional, scientific, and technical services (%)
Most Common Industries - Management of companies and enterprises (%)
Most Common Industries - Administrative and support and waste management services (%)
Most Common Industries - Educational services, and health care and social assistance (%)
Most Common Industries - Educational services (%)
Most Common Industries - Health care and social assistance (%)
Most Common Industries - Arts, entertainment, and recreation, and accommodation and food services (%)
Most Common Industries - Arts, entertainment, and recreation (%)
Most Common Industries - Accommodation and food services (%)
Most Common Industries - Other services, except public administration (%)
Most Common Industries - Public administration (%)
Occupation diversity
Most Common Occupations - Management, business, science, and arts occupations (%)
Most Common Occupations - Management, business, and financial occupations (%)
Most Common Occupations - Management occupations (%)
Most Common Occupations - Business and financial operations occupations (%)
Most Common Occupations - Computer, engineering, and science occupations (%)
Most Common Occupations - Computer and mathematical occupations (%)
Most Common Occupations - Architecture and engineering occupations (%)
Most Common Occupations - Life, physical, and social science occupations (%)
Most Common Occupations - Education, legal, community service, arts, and media occupations (%)
Most Common Occupations - Community and social service occupations (%)
Most Common Occupations - Legal occupations (%)
Most Common Occupations - Education, training, and library occupations (%)
Most Common Occupations - Arts, design, entertainment, sports, and media occupations (%)
Most Common Occupations - Healthcare practitioners and technical occupations (%)
Most Common Occupations - Health diagnosing and treating practitioners and other technical occupations (%)
Most Common Occupations - Health technologists and technicians (%)
Most Common Occupations - Service occupations (%)
Most Common Occupations - Healthcare support occupations (%)
Most Common Occupations - Protective service occupations (%)
Most Common Occupations - Fire fighting and prevention, and other protective service workers including supervisors (%)
Most Common Occupations - Law enforcement workers including supervisors (%)
Most Common Occupations - Food preparation and serving related occupations (%)
Most Common Occupations - Building and grounds cleaning and maintenance occupations (%)
Most Common Occupations - Personal care and service occupations (%)
Most Common Occupations - Sales and office occupations (%)
Most Common Occupations - Sales and related occupations (%)
Most Common Occupations - Office and administrative support occupations (%)
Most Common Occupations - Natural resources, construction, and maintenance occupations (%)
Most Common Occupations - Farming, fishing, and forestry occupations (%)
Most Common Occupations - Construction and extraction occupations (%)
Most Common Occupations - Installation, maintenance, and repair occupations (%)
Most Common Occupations - Production, transportation, and material moving occupations (%)
Most Common Occupations - Production occupations (%)
Most Common Occupations - Transportation occupations (%)
Most Common Occupations - Material moving occupations (%)
People in Group quarters - Institutionalized population (%)
People in Group quarters - Correctional institutions (%)
People in Group quarters - Federal prisons and detention centers (%)
People in Group quarters - Halfway houses (%)
People in Group quarters - Local jails and other confinement facilities (including police lockups) (%)
People in Group quarters - Military disciplinary barracks (%)
People in Group quarters - State prisons (%)
People in Group quarters - Other types of correctional institutions (%)
People in Group quarters - Nursing homes (%)
People in Group quarters - Hospitals/wards, hospices, and schools for the handicapped (%)
People in Group quarters - Hospitals/wards and hospices for chronically ill (%)
People in Group quarters - Hospices or homes for chronically ill (%)
People in Group quarters - Military hospitals or wards for chronically ill (%)
People in Group quarters - Other hospitals or wards for chronically ill (%)
People in Group quarters - Hospitals or wards for drug/alcohol abuse (%)
People in Group quarters - Mental (Psychiatric) hospitals or wards (%)
People in Group quarters - Schools, hospitals, or wards for the mentally retarded (%)
People in Group quarters - Schools, hospitals, or wards for the physically handicapped (%)
People in Group quarters - Institutions for the deaf (%)
People in Group quarters - Institutions for the blind (%)
People in Group quarters - Orthopedic wards and institutions for the physically handicapped (%)
People in Group quarters - Wards in general hospitals for patients who have no usual home elsewhere (%)
People in Group quarters - Wards in military hospitals for patients who have no usual home elsewhere (%)
People in Group quarters - Juvenile institutions (%)
People in Group quarters - Long-term care (%)
People in Group quarters - Homes for abused, dependent, and neglected children (%)
People in Group quarters - Residential treatment centers for emotionally disturbed children (%)
People in Group quarters - Training schools for juvenile delinquents (%)
People in Group quarters - Short-term care, detention or diagnostic centers for delinquent children (%)
People in Group quarters - Type of juvenile institution unknown (%)
People in Group quarters - Noninstitutionalized population (%)
People in Group quarters - College dormitories (includes college quarters off campus) (%)
People in Group quarters - Military quarters (%)
People in Group quarters - On base (%)
People in Group quarters - Barracks, unaccompanied personnel housing (UPH), (Enlisted/Officer), ;and similar group living quarters for military personnel (%)
People in Group quarters - Transient quarters for temporary residents (%)
People in Group quarters - Military ships (%)
People in Group quarters - Group homes (%)
People in Group quarters - Homes or halfway houses for drug/alcohol abuse (%)
People in Group quarters - Homes for the mentally ill (%)
People in Group quarters - Homes for the mentally retarded (%)
People in Group quarters - Homes for the physically handicapped (%)
People in Group quarters - Other group homes (%)
People in Group quarters - Religious group quarters (%)
People in Group quarters - Dormitories (%)
People in Group quarters - Agriculture workers' dormitories on farms (%)
People in Group quarters - Job Corps and vocational training facilities (%)
People in Group quarters - Other workers' dormitories (%)
People in Group quarters - Crews of maritime vessels (%)
People in Group quarters - Other nonhousehold living situations (%)
People in Group quarters - Other noninstitutional group quarters (%)
Residents speaking English at home (%)
Residents speaking English at home - Born in the United States (%)
Residents speaking English at home - Native, born elsewhere (%)
Residents speaking English at home - Foreign born (%)
Residents speaking Spanish at home (%)
Residents speaking Spanish at home - Born in the United States (%)
Residents speaking Spanish at home - Native, born elsewhere (%)
Residents speaking Spanish at home - Foreign born (%)
Residents speaking other language at home (%)
Residents speaking other language at home - Born in the United States (%)
Residents speaking other language at home - Native, born elsewhere (%)
Residents speaking other language at home - Foreign born (%)
Class of Workers - Employee of private company (%)
Class of Workers - Self-employed in own incorporated business (%)
Class of Workers - Private not-for-profit wage and salary workers (%)
Class of Workers - Local government workers (%)
Class of Workers - State government workers (%)
Class of Workers - Federal government workers (%)
Class of Workers - Self-employed workers in own not incorporated business and Unpaid family workers (%)
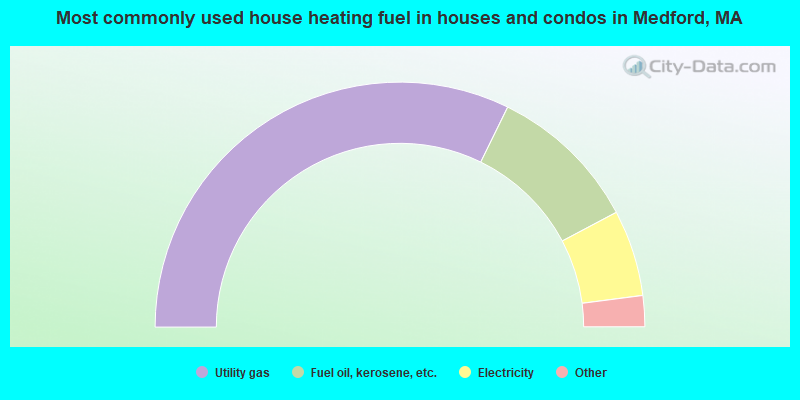
House heating fuel used in houses and condos - Utility gas (%)
House heating fuel used in houses and condos - Bottled, tank, or LP gas (%)
House heating fuel used in houses and condos - Electricity (%)
House heating fuel used in houses and condos - Fuel oil, kerosene, etc. (%)
House heating fuel used in houses and condos - Coal or coke (%)
House heating fuel used in houses and condos - Wood (%)
House heating fuel used in houses and condos - Solar energy (%)
House heating fuel used in houses and condos - Other fuel (%)
House heating fuel used in houses and condos - No fuel used (%)
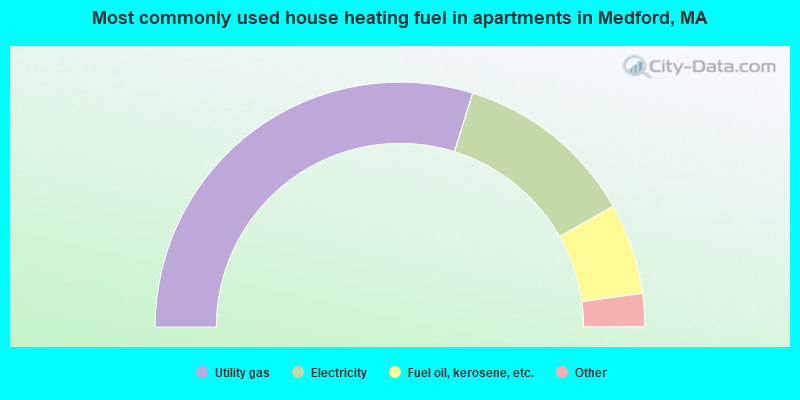
House heating fuel used in apartments - Utility gas (%)
House heating fuel used in apartments - Bottled, tank, or LP gas (%)
House heating fuel used in apartments - Electricity (%)
House heating fuel used in apartments - Fuel oil, kerosene, etc. (%)
House heating fuel used in apartments - Coal or coke (%)
House heating fuel used in apartments - Wood (%)
House heating fuel used in apartments - Solar energy (%)
House heating fuel used in apartments - Other fuel (%)
House heating fuel used in apartments - No fuel used (%)
Armed forces status - In Armed Forces (%)
Armed forces status - Civilian (%)
Armed forces status - Civilian - Veteran (%)
Armed forces status - Civilian - Nonveteran (%)
Fatal accidents locations in years 2005-2021
Fatal accidents locations in 2005
Fatal accidents locations in 2006
Fatal accidents locations in 2007
Fatal accidents locations in 2008
Fatal accidents locations in 2009
Fatal accidents locations in 2010
Fatal accidents locations in 2011
Fatal accidents locations in 2012
Fatal accidents locations in 2013
Fatal accidents locations in 2014
Fatal accidents locations in 2015
Fatal accidents locations in 2016
Fatal accidents locations in 2017
Fatal accidents locations in 2018
Fatal accidents locations in 2019
Fatal accidents locations in 2020
Fatal accidents locations in 2021
Alcohol use - People drinking some alcohol every month (%)
Alcohol use - People not drinking at all (%)
Alcohol use - Average days/month drinking alcohol
Alcohol use - Average drinks/week
Alcohol use - Average days/year people drink much
Audiometry - Average condition of hearing (%)
Audiometry - People that can hear a whisper from across a quiet room (%)
Audiometry - People that can hear normal voice from across a quiet room (%)
Audiometry - Ears ringing, roaring, buzzing (%)
Audiometry - Had a job exposure to loud noise (%)
Audiometry - Had off-work exposure to loud noise (%)
Blood Pressure & Cholesterol - Has high blood pressure (%)
Blood Pressure & Cholesterol - Checking blood pressure at home (%)
Blood Pressure & Cholesterol - Frequently checking blood cholesterol (%)
Blood Pressure & Cholesterol - Has high cholesterol level (%)
Consumer Behavior - Money monthly spent on food at supermarket/grocery store
Consumer Behavior - Money monthly spent on food at other stores
Consumer Behavior - Money monthly spent on eating out
Consumer Behavior - Money monthly spent on carryout/delivered foods
Consumer Behavior - Income spent on food at supermarket/grocery store (%)
Consumer Behavior - Income spent on food at other stores (%)
Consumer Behavior - Income spent on eating out (%)
Consumer Behavior - Income spent on carryout/delivered foods (%)
Current Health Status - General health condition (%)
Current Health Status - Blood donors (%)
Current Health Status - Has blood ever tested for HIV virus (%)
Current Health Status - Left-handed people (%)
Dermatology - People using sunscreen (%)
Diabetes - Diabetics (%)
Diabetes - Had a blood test for high blood sugar (%)
Diabetes - People taking insulin (%)
Diet Behavior & Nutrition - Diet health (%)
Diet Behavior & Nutrition - Milk product consumption (# of products/month)
Diet Behavior & Nutrition - Meals not home prepared (#/week)
Diet Behavior & Nutrition - Meals from fast food or pizza place (#/week)
Diet Behavior & Nutrition - Ready-to-eat foods (#/month)
Diet Behavior & Nutrition - Frozen meals/pizza (#/month)
Drug Use - People that ever used marijuana or hashish (%)
Drug Use - Ever used hard drugs (%)
Drug Use - Ever used any form of cocaine (%)
Drug Use - Ever used heroin (%)
Drug Use - Ever used methamphetamine (%)
Health Insurance - People covered by health insurance (%)
Kidney Conditions-Urology - Avg. # of times urinating at night
Medical Conditions - People with asthma (%)
Medical Conditions - People with anemia (%)
Medical Conditions - People with psoriasis (%)
Medical Conditions - People with overweight (%)
Medical Conditions - Elderly people having difficulties in thinking or remembering (%)
Medical Conditions - People who ever received blood transfusion (%)
Medical Conditions - People having trouble seeing even with glass/contacts (%)
Medical Conditions - People with arthritis (%)
Medical Conditions - People with gout (%)
Medical Conditions - People with congestive heart failure (%)
Medical Conditions - People with coronary heart disease (%)
Medical Conditions - People with angina pectoris (%)
Medical Conditions - People who ever had heart attack (%)
Medical Conditions - People who ever had stroke (%)
Medical Conditions - People with emphysema (%)
Medical Conditions - People with thyroid problem (%)
Medical Conditions - People with chronic bronchitis (%)
Medical Conditions - People with any liver condition (%)
Medical Conditions - People who ever had cancer or malignancy (%)
Mental Health - People who have little interest in doing things (%)
Mental Health - People feeling down, depressed, or hopeless (%)
Mental Health - People who have trouble sleeping or sleeping too much (%)
Mental Health - People feeling tired or having little energy (%)
Mental Health - People with poor appetite or overeating (%)
Mental Health - People feeling bad about themself (%)
Mental Health - People who have trouble concentrating on things (%)
Mental Health - People moving or speaking slowly or too fast (%)
Mental Health - People having thoughts they would be better off dead (%)
Oral Health - Average years since last visit a dentist
Oral Health - People embarrassed because of mouth (%)
Oral Health - People with gum disease (%)
Oral Health - General health of teeth and gums (%)
Oral Health - Average days a week using dental floss/device
Oral Health - Average days a week using mouthwash for dental problem
Oral Health - Average number of teeth
Pesticide Use - Households using pesticides to control insects (%)
Pesticide Use - Households using pesticides to kill weeds (%)
Physical Activity - People doing vigorous-intensity work activities (%)
Physical Activity - People doing moderate-intensity work activities (%)
Physical Activity - People walking or bicycling (%)
Physical Activity - People doing vigorous-intensity recreational activities (%)
Physical Activity - People doing moderate-intensity recreational activities (%)
Physical Activity - Average hours a day doing sedentary activities
Physical Activity - Average hours a day watching TV or videos
Physical Activity - Average hours a day using computer
Physical Functioning - People having limitations keeping them from working (%)
Physical Functioning - People limited in amount of work they can do (%)
Physical Functioning - People that need special equipment to walk (%)
Physical Functioning - People experiencing confusion/memory problems (%)
Physical Functioning - People requiring special healthcare equipment (%)
Prescription Medications - Average number of prescription medicines taking
Preventive Aspirin Use - Adults 40+ taking low-dose aspirin (%)
Reproductive Health - Vaginal deliveries (%)
Reproductive Health - Cesarean deliveries (%)
Reproductive Health - Deliveries resulted in a live birth (%)
Reproductive Health - Pregnancies resulted in a delivery (%)
Reproductive Health - Women breastfeeding newborns (%)
Reproductive Health - Women that had a hysterectomy (%)
Reproductive Health - Women that had both ovaries removed (%)
Reproductive Health - Women that have ever taken birth control pills (%)
Reproductive Health - Women taking birth control pills (%)
Reproductive Health - Women that have ever used Depo-Provera or injectables (%)
Reproductive Health - Women that have ever used female hormones (%)
Sexual Behavior - People 18+ that ever had sex (vaginal, anal, or oral) (%)
Sexual Behavior - Males 18+ that ever had vaginal sex with a woman (%)
Sexual Behavior - Males 18+ that ever performed oral sex on a woman (%)
Sexual Behavior - Males 18+ that ever had anal sex with a woman (%)
Sexual Behavior - Males 18+ that ever had any sex with a man (%)
Sexual Behavior - Females 18+ that ever had vaginal sex with a man (%)
Sexual Behavior - Females 18+ that ever performed oral sex on a man (%)
Sexual Behavior - Females 18+ that ever had anal sex with a man (%)
Sexual Behavior - Females 18+ that ever had any kind of sex with a woman (%)
Sexual Behavior - Average age people first had sex
Sexual Behavior - Average number of female sex partners in lifetime (males 18+)
Sexual Behavior - Average number of female vaginal sex partners in lifetime (males 18+)
Sexual Behavior - Average age people first performed oral sex on a woman (18+)
Sexual Behavior - Average number of woman performed oral sex on in lifetime (18+)
Sexual Behavior - Average number of male sex partners in lifetime (males 18+)
Sexual Behavior - Average number of male anal sex partners in lifetime (males 18+)
Sexual Behavior - Average age people first performed oral sex on a man (18+)
Sexual Behavior - Average number of male oral sex partners in lifetime (18+)
Sexual Behavior - People using protection when performing oral sex (%)
Sexual Behavior - Average number of times people have vaginal or anal sex a year
Sexual Behavior - People having sex without condom (%)
Sexual Behavior - Average number of male sex partners in lifetime (females 18+)
Sexual Behavior - Average number of male vaginal sex partners in lifetime (females 18+)
Sexual Behavior - Average number of female sex partners in lifetime (females 18+)
Sexual Behavior - Circumcised males 18+ (%)
Sleep Disorders - Average hours sleeping at night
Sleep Disorders - People that has trouble sleeping (%)
Smoking-Cigarette Use - People smoking cigarettes (%)
Taste & Smell - People 40+ having problems with smell (%)
Taste & Smell - People 40+ having problems with taste (%)
Taste & Smell - People 40+ that ever had wisdom teeth removed (%)
Taste & Smell - People 40+ that ever had tonsils teeth removed (%)
Taste & Smell - People 40+ that ever had a loss of consciousness because of a head injury (%)
Taste & Smell - People 40+ that ever had a broken nose or other serious injury to face or skull (%)
Taste & Smell - People 40+ that ever had two or more sinus infections (%)
Weight - Average height (inches)
Weight - Average weight (pounds)
Weight - Average BMI
Weight - People that are obese (%)
Weight - People that ever were obese (%)
Weight - People trying to lose weight (%)
According to our research of Massachusetts and other state lists, there were 10 registered sex offenders living in Medford, Massachusetts as of April 18, 2024 . The ratio of all residents to sex offenders in Medford is 5,799 to 1.The ratio of registered sex offenders to all residents in this city is much lower than the state average.
Officers per 1,000 residents here:
1.77Massachusetts average:
2.59
Latest news from Medford, MA collected exclusively by city-data.com from local newspapers, TV, and radio stations
Ancestries: Italian (15.0%), Irish (14.8%), Haitian (5.6%), American (4.9%), Brazilian (3.7%), English (3.3%).
Current Local Time:
Land area: 8.14 square miles.
Population density: 8,035 people per square mile (high).
15,083 residents are foreign born (9.1% Asia , 8.1% Latin America , 5.3% Europe ).
This city:
24.5%Massachusetts:
17.6%
Median real estate property taxes paid for housing units with mortgages in 2022: $5,907 (0.8%)Median real estate property taxes paid for housing units with no mortgage in 2022: $6,052 (0.9%)
Nearest city with pop. 200,000+: Boston, MA
Nearest city with pop. 1,000,000+: Bronx, NY
Nearest cities:
Latitude: 42.42 N, Longitude: 71.11 W
Daytime population change due to commuting: -13,071 (-20.0%)Workers who live and work in this city: 13,326 (36.1%)
Single-family new house construction building permits:
2022: 3 buildings , average cost: $241,7002021: 7 buildings , average cost: $241,7002020: 6 buildings , average cost: $242,4002019: 4 buildings , average cost: $237,7002018: 1 building , cost: $266,0002017: 4 buildings , average cost: $152,6002016: 3 buildings , average cost: $152,6002015: 4 buildings , average cost: $152,6002014: 4 buildings , average cost: $152,6002013: 3 buildings , average cost: $186,8002012: 3 buildings , average cost: $180,3002007: 3 buildings , average cost: $74,3002006: 4 buildings , average cost: $74,3002005: 6 buildings , average cost: $74,3002004: 6 buildings , average cost: $74,3002003: 6 buildings , average cost: $74,3002002: 7 buildings , average cost: $74,3002001: 5 buildings , average cost: $74,3002000: 7 buildings , average cost: $74,3001999: 8 buildings , average cost: $74,3001998: 6 buildings , average cost: $74,3001997: 7 buildings , average cost: $74,300Unemployment in December 2023: Here:
3.1%Massachusetts:
3.5%
Most common occupations in Medford, MA (%)
Both Males Females
Other management occupations, except farmers and farm managers (8.5%)
Cooks and food preparation workers (5.3%)
Computer specialists (4.9%)
Secretaries and administrative assistants (3.6%)
Sales representatives, services, wholesale and manufacturing (2.7%)
Postsecondary teachers (2.5%)
Health technologists and technicians (2.5%)
Other management occupations, except farmers and farm managers (9.1%)
Computer specialists (8.1%)
Cooks and food preparation workers (4.7%)
Engineers (3.2%)
Building and grounds cleaning and maintenance occupations (3.0%)
Life and physical scientists (2.7%)
Sales representatives, services, wholesale and manufacturing (2.7%)
Other management occupations, except farmers and farm managers (8.0%)
Secretaries and administrative assistants (6.8%)
Cooks and food preparation workers (5.8%)
Health technologists and technicians (3.8%)
Retail sales workers, except cashiers (3.4%)
Other office and administrative support workers, including supervisors (3.3%)
Other financial specialists (3.1%)
Tornado activity:
Medford-area historical tornado activity is near Massachusetts state average. It is 42% smaller than the overall U.S. average.
On 6/9/1953, a category F4 (max. wind speeds 207-260 mph) tornado 22.6 miles away from the Medford city center killed 90 people and injured 1228 people and caused between $50,000,000 and $500,000,000 in damages.
On 9/29/1974, a category F3 (max. wind speeds 158-206 mph) tornado 13.9 miles away from the city center injured one person and caused between $50,000 and $500,000 in damages.
Earthquake activity:
Medford-area historical earthquake activity is significantly above Massachusetts state average. It is 73% smaller than the overall U.S. average. On 4/20/2002 at 10:50:47, a magnitude 5.3 (5.3 ML, Depth: 3.0 mi, Class: Moderate, Intensity: VI - VII) earthquake occurred 194.5 miles away from Medford center On 10/7/1983 at 10:18:46, a magnitude 5.3 (5.1 MB, 5.3 LG, 5.1 ML) earthquake occurred 194.5 miles away from Medford center On 1/19/1982 at 00:14:42, a magnitude 4.7 (4.5 MB, 4.7 MD, 4.5 LG, Class: Light, Intensity: IV - V) earthquake occurred 78.7 miles away from the city center On 10/16/2012 at 23:12:25, a magnitude 4.7 (4.7 ML, Depth: 10.0 mi) earthquake occurred 84.6 miles away from the city center On 4/20/2002 at 10:50:47, a magnitude 5.2 (5.2 MB, 4.2 MS, 5.2 MW, 5.0 MW) earthquake occurred 193.9 miles away from Medford center On 8/22/1992 at 12:20:32, a magnitude 4.8 (4.8 MB, 3.8 MS, 4.7 LG, Depth: 6.2 mi) earthquake occurred 232.9 miles away from Medford center Magnitude types: regional Lg-wave magnitude (LG), body-wave magnitude (MB), duration magnitude (MD), local magnitude (ML), surface-wave magnitude (MS), moment magnitude (MW) Natural disasters: The number of natural disasters in Middlesex County (31) is a lot greater than the US average (15).Major Disasters (Presidential) Declared: 17Emergencies Declared: 14Floods: 12, Storms: 9, Hurricanes: 6, Snowstorms: 6, Winter Storms: 5, Blizzards: 2, Snows: 2, Explosion: 1, Heavy Rain: 1, Snowfall: 1, Water Main Break: 1, Wind: 1 (Note: some incidents may be assigned to more than one category). Main business address for: MYSTIC FINANCIAL INC SAVINGS INSTITUTIONS, NOT FEDERALLY CHARTERED ), CENTURY BANCORP INC STATE COMMERCIAL BANKS ).
Hospitals and medical centers in Medford: COURTYARD NURSING CARE CENTER (200 GOVERNORS AVENUE)
EMERY RETIREMENT AND CONV HOME (34 GROVE ST)
GLEN RIDGE NURSING CARE CENTER (120 MURRAY STREET)
MAGOUN MANOR NURSING HOME (68 MAGOUN AVENUE)
MEDFORD REHABILITATION AND NURSING CENTER (300 WINTHROP STREET)
REST HAVEN NURSING HOME (96 MYSTIC ST)
WINTHROP HOUSE N H (300 WINTHROP ST)
MEDFORD DIALYSIS CENTER (BMA MEDFORD) (305 MYSTIC AVENUE)
WELLINGTON CIRCLE DIALYSIS CENTER (10 CABOT ROAD SUITE 103B)
GREATER MEDFORD VISITING NURSE ASSOC. (278 MYSTIC AVENUE, SUITE 204)
Amtrak stations near Medford: 5 miles: BOSTON, NORTH STATION (BOSTON, 126 CAUSEWAY ST.) Services: ticket office, enclosed waiting area.
6 miles: BACK BAY (BOSTON, 145 DARTMOUTH ST.) Services: ticket office, partially wheelchair accessible, enclosed waiting area, public restrooms, public payphones, vending machines, ATM, paid short-term parking, paid long-term parking, call for car rental service, taxi stand, public transit connection.
6 miles: BOSTON (SO. STA) (BOSTON, ATLANTIC AVE. & SUMMER ST.) Services: ticket office, fully wheelchair accessible, enclosed waiting area, public restrooms, public payphones, full-service food facilities and snack bar, ATM, paid short-term parking, paid long-term parking, call for car rental service, taxi stand, intercity bus service, public transit connection.
Colleges/Universities in Medford: Tufts University Full-time enrollment: 9,041; Private, not-for-profit; Website: www.tufts.edu; Offers Doctor's degree )
Lawrence Memorial Hospital School of Nursing Full-time enrollment: 141; Location: 170 Governors Ave; Private, not-for-profit; Website: www.lmregisnurse.org)
Elizabeth Grady School of Esthetics and Massage Therapy Full-time enrollment: 118; Location: 222 Boston Avenue; Private, for-profit; Website: elizabethgrady.edu)
Other colleges/universities with over 2000 students near Medford:
Lesley University (about 3 miles; Cambridge, MA ; Full-time enrollment: 4,317)
Harvard University (about 4 miles; Cambridge, MA ; FT enrollment: 20,857)
Cambridge College (about 4 miles; Cambridge, MA ; FT enrollment: 2,782)
Bunker Hill Community College (about 4 miles; Boston, MA ; FT enrollment: 8,814)
Massachusetts Institute of Technology (about 5 miles; Cambridge, MA ; FT enrollment: 13,548)
Emerson College (about 5 miles; Boston, MA ; FT enrollment: 4,657)
Suffolk University (about 5 miles; Boston, MA ; FT enrollment: 6,982)
Public high schools in Medford: MEDFORD HIGH Students: 1,332, Location: 489 WINTHROP STREET, Grades: PK-12)MEDFORD VOCATIONAL TECHNICAL HIGH Location: 489 WINTHROP STREET, Grades: 9-12)
CURTIS-TUFTS Location: 437 MAIN STREET, Grades: 9-12)
Public elementary/middle schools in Medford: BROOKS SCHOOL Students: 603, Location: 388 HIGH STREET, Grades: PK-5)MILTON FULLER ROBERTS Students: 591, Location: 35 COURT STREET, Grades: PK-5)JOHN J MCGLYNN ELEMENTARY SCHOOL Students: 549, Location: 3002 MYSTIC VALLEY PKWY, Grades: PK-5)JOHN J. MCGLYNN MIDDLE SCHOOL Students: 529, Location: 3004 MYSTIC VALLEY PARKWAY, Grades: 6-8)MADELEINE DUGGER ANDREWS Students: 522, Location: 3000 MYSTIC VALLEY PKWY, Grades: 6-8)CHRISTOPHER COLUMBUS Students: 449, Location: 37 HICKS AVENUE, Grades: PK-5)Private elementary/middle schools in Medford: ST JOSEPH ELEMENTARY SCHOOL Students: 482, Location: 132 HIGH ST, Grades: PK-8)
ST RAPHAEL ELEMENTARY SCHOOL Students: 373, Location: 516 HIGH ST, Grades: PK-8)
ELIOT-PEARSON CHILDREN'S SCHOOL Students: 80, Location: 105 COLLEGE AVE, Grades: PK-2)
See full list of schools located in Medford Library in Medford: MEDFORD PUBLIC LIBRARY Operating income: $1,359,876; Location: 111 HIGH ST.; 153,813 books ; 13,773 audio materials ; 8,939 video materials ; 10 local licensed databases ; 31 state licensed databases ; 3 other licensed databases ; 285 print serial subscriptions ; 4 electronic serial subscriptions )
Notable locations in Medford: (A) , Magoun Square (B) , Victory Field (C) , Wellington Circle Plaza (D) , Fellsway Plaza (E) , Hamilton Pool (F) , Memorial Steps (G) , Park Street Railroad Station (H) , Wellington Business Center (I) , Medford Fire Department Station 5 (J) , Medford Fire Department Station 6 (K) , Medford Fire Department Station 4 (L) , Medford Fire Department Station 3 (M) , Medford Fire Department Station 2 (N) , Medford Fire Department Station 1 Headquarters (O) , Anderson Hall (P) , Bacon Hall (Q) , Ballou Hall (R) , Barnum Hall (S) , Bendetson Hall (T) . Display/hide their locations on the map
Shopping Centers: (1) , Wellington Circle Shopping Center (2) , Meadow Glen Mall Shopping Center (3) , Wellington Circle Plaza Shopping Center (4) , Wellington Circle Shopping Plaza Shopping Center (5) . Display/hide their locations on the map
Main business address in Medford include: (A) , CENTURY BANCORP INC (B) . Display/hide their locations on the map
Churches in Medford include: (A) , First Church of Somerville (B) , Comunidade Evangelica Pentecostal Church (C) , Zion Christian Fellowship Church (D) , West Medford Congregational Church (E) , Wesley United Methodist Church (F) , Unitarian Universalist Church (G) , Temple Shalom (H) , Saint Raphael Church (I) . Display/hide their locations on the map
Cemeteries: (1) , Salem Street Burying Ground (2) . Display/hide their locations on the map
Lakes, reservoirs, and swamps: (A) , Quarter Mile Pond (B) , Mystic Reservoir (C) , South Reservoir (D) , Wrights Pond (E) , Salt Marsh (F) , Wellington Marsh (G) . Display/hide their locations on the map
Streams, rivers, and creeks: (A) , Little Creek (B) , Malden River (C) , Floyds Brook (D) , Brooks Brook (E) , Smelt Brook (F) . Display/hide their locations on the map
Parks in Medford include: (1) , Magoun Park (2) , Royal Park (3) , Tufts Park (4) , The Green (5) , The Quad (6) , Columbus Memorial Park (7) , Old Ship Street Historic District (8) , Gillis Field (9) . Display/hide their locations on the map
Tourist attraction:
Hotels:
Birthplace of: Maria Menounos - Television reporter, Michael Bloomberg - (born 1943), businesman, New York City mayor, William Francis Buckley - Army Colonel and CIA intelligence agency operative, Johnny Kelley - Distance runner, Bill Monbouquette - Baseball player and coach, Thayer David - Film actor, Lou Antonelli - Science fiction writer, Terri Lyne Carrington - Jazz drummer, Lincoln D. Faurer - General, William Ware Theiss - Costume designer.
Middlesex County has a predicted average indoor radon screening level greater than 4 pCi/L (pico curies per liter) - Highest Potential Drinking water stations with addresses in Medford that have no violations reported:
MEDFORD WATER DEPT. (MWRA) (Population served: 56,200, Primary Water Source Type: Purch surface water)
Average household size: This city:
2.4 peopleMassachusetts:
2.5 people
Percentage of family households: This city:
57.9%Whole state:
63.0%
Percentage of households with unmarried partners: This city:
7.1%Whole state:
7.0%
Likely homosexual households (counted as self-reported same-sex unmarried-partner households)
Lesbian couples: 0.8% of all households Gay men: 0.6% of all households
People in group quarters in Medford in 2010:
1,435 people in college/university student housing
465 people in nursing facilities/skilled-nursing facilities
23 people in group homes intended for adults
22 people in other noninstitutional facilities
14 people in residential treatment centers for juveniles (non-correctional)
People in group quarters in Medford in 2000:
1,569 people in college dormitories (includes college quarters off campus)
536 people in nursing homes
32 people in religious group quarters
24 people in homes for the mentally retarded
22 people in other noninstitutional group quarters
11 people in homes for the mentally ill
10 people in other nonhousehold living situations
Banks with most branches in Medford (2011 data):
RBS Citizens, National Association: Medford Stop & Shop Branch, Medford Square Branch, Spring Street Branch, West Medford Branch. Info updated 2007/09/19: Bank assets: $106,940.6 mil, Deposits: $75,690.2 mil, headquarters in Providence, RI, positive income , 1135 total offices , Holding Company: Uk Financial Investments Limited
Brookline Bank: Salem Street Branch, High Street Branch, Medford Bank Branch. Info updated 2011/07/21: Bank assets: $2,854.7 mil, Deposits: $2,040.1 mil, headquarters in Brookline, MA, positive income , Commercial Lending Specialization, 20 total offices , Holding Company: Brookline Bancorp, Inc.
Century Bank and Trust Company: Fellsway Plaza Branch, Medford Square Branch, Medford Branch. Info updated 2010/05/27: Bank assets: $2,740.5 mil, Deposits: $2,148.1 mil, headquarters in Somerville, MA, positive income , Mortgage Lending Specialization, 25 total offices , Holding Company: Century Bancorp, Inc.
Bank of America, National Association: Medford - Wellington Circle Branch at 684 Fellsway, branch established on 2002/06/05; Mystic Avenue Branch at 278 Mystic Avenue, branch established on 1971/02/16. Info updated 2009/11/18: Bank assets: $1,451,969.3 mil, Deposits: $1,077,176.8 mil, headquarters in Charlotte, NC, positive income , 5782 total offices , Holding Company: Bank Of America Corporation
Central Co-operative Bank: Internet Branch at 270 Mystic Avenue, branch established on 2001/04/01; Medford Branch at 270 Mystic Avenue, branch established on 2006/06/01. Info updated 2008/06/25: Bank assets: $520.7 mil, Deposits: $335.1 mil, headquarters in Somerville, MA, positive income , Commercial Lending Specialization, 11 total offices , Holding Company: Central Bancorp, Inc.
East Cambridge Savings Bank: Salem Street Office Branch at 243 Salem Street, branch established on 2007/02/01. Info updated 2007/04/09: Bank assets: $803.6 mil, Deposits: $690.6 mil, headquarters in Cambridge, MA, positive income , 9 total offices
East Boston Savings Bank: Medford Branch at 410 Riverside Avenue, branch established on 2009/08/25. Info updated 2011/06/07: Bank assets: $1,946.5 mil, Deposits: $1,609.3 mil, headquarters in Boston, MA, positive income , Commercial Lending Specialization, 24 total offices , Holding Company: Meridian Financial Services, Inc
Middlesex Federal Savings, F.A.: Riverside Ave Branch at 53 Riverside Avenue, branch established on 1890/01/01. Info updated 2011/11/28: Bank assets: $354.3 mil, Deposits: $285.8 mil, headquarters in Somerville, MA, negative income in the last year , 3 total offices
Eastern Bank: Wellington Circle Branch at 53 Locust Street, branch established on 1977/01/08. Info updated 2011/03/30: Bank assets: $7,812.9 mil, Deposits: $6,295.8 mil, headquarters in Boston, MA, positive income , Commercial Lending Specialization, 94 total offices , Holding Company: Eastern Bank Corporation
For population 15 years and over in Medford:
Never married: 42.6%Now married: 43.3%Separated: 2.1%Widowed: 6.5%Divorced: 5.4% For population 25 years and over in Medford:
High school or higher: 92.0%Bachelor's degree or higher: 58.4%Graduate or professional degree: 29.9%Unemployed: 2.5%Mean travel time to work (commute): 22.9 minutes
Education Gini index (Inequality in education) Here:
12.9Massachusetts average:
13.0
Religion statistics for Medford, MA (based on Middlesex County data)
Religion Adherents Congregations Catholic 718,209 107 Mainline Protestant 70,053 269 Other 68,480 199 Evangelical Protestant 41,270 304 Orthodox 23,641 28 Black Protestant 2,276 8 None 579,156 -
Source: Clifford Grammich, Kirk Hadaway, Richard Houseal, Dale E.Jones, Alexei Krindatch, Richie Stanley and Richard H.Taylor. 2012. 2010 U.S.Religion Census: Religious Congregations & Membership Study. Association of Statisticians of American Religious Bodies. Jones, Dale E., et al. 2002. Congregations and Membership in the United States 2000. Nashville, TN: Glenmary Research Center. Graphs represent county-level data
Food Environment Statistics: Number of grocery stores : 251This county :
1.71 / 10,000 pop.Massachusetts :
1.98 / 10,000 pop.
Number of supercenters and club stores : 5This county :
0.03 / 10,000 pop.Massachusetts :
0.05 / 10,000 pop.
Number of convenience stores (no gas) : 314Middlesex County :
2.14 / 10,000 pop.Massachusetts :
2.22 / 10,000 pop.
Number of convenience stores (with gas) : 203Middlesex County :
1.38 / 10,000 pop.Massachusetts :
1.77 / 10,000 pop.
Number of full-service restaurants : 1,153Middlesex County :
7.84 / 10,000 pop.State :
8.76 / 10,000 pop.
Adult diabetes rate : This county :
7.8%Massachusetts :
8.1%
Adult obesity rate : Here :
21.5%Massachusetts :
22.5%
Low-income preschool obesity rate : Health and Nutrition: Healthy diet rate : Medford:
55.5%Massachusetts:
50.5%
Average overall health of teeth and gums : Medford:
55.2%Massachusetts:
48.0%
Average BMI : This city:
27.8Massachusetts:
28.4
People feeling badly about themselves : Here:
17.8%Massachusetts:
20.7%
People not drinking alcohol at all : Here:
9.0%Massachusetts:
10.4%
Average hours sleeping at night : This city:
7.0Massachusetts:
6.8
General health condition : Average condition of hearing : This city:
81.0%Massachusetts:
79.2%
More about Health and Nutrition of Medford, MA Residents
Local government employment and payroll (March 2022)
Function
Full-time employees
Monthly full-time payroll
Average yearly full-time wage
Part-time employees
Monthly part-time payroll
Elementary and Secondary - Instruction
697 $4,324,932 $74,461 8 $9,135 Elementary and Secondary - Other Total
193 $762,347 $47,400 141 $148,777 Firefighters
107 $771,722 $86,548 0 $0 Police Protection - Officers
103 $798,834 $93,068 0 $0 Streets and Highways
34 $204,567 $72,200 0 $0 Other and Unallocable
25 $141,286 $67,817 0 $0 Financial Administration
20 $106,615 $63,969 0 $0 Local Libraries
19 $92,541 $58,447 0 $0 Other Government Administration
17 $89,991 $63,523 3 $8,632 Police - Other
15 $73,447 $58,758 20 $8,857 Water Supply
14 $79,281 $67,955 0 $0 Parks and Recreation
11 $62,672 $68,369 0 $0 Health
10 $61,422 $73,706 0 $0 Housing and Community Development (Local)
5 $34,676 $83,222 0 $0 Welfare
4 $24,001 $72,003 2 $2,758 Natural Resources
3 $16,183 $64,732 0 $0 Electric Power
2 $13,952 $83,712 0 $0 Fire - Other
1 $5,258 $63,096 0 $0
Totals for Government
1,280 $7,663,727 $71,847 174 $178,159
Medford government finances - Expenditure in 2021 (per resident):
Construction - General Public Buildings: $19,594,000 ($299.61)
Regular Highways: $831,000 ($12.71)Parks and Recreation: $131,000 ($2.00)Housing and Community Development: $98,000 ($1.50)Current Operations - Elementary and Secondary Education: $92,149,000 ($1409.03)
General - Other: $31,525,000 ($482.04)Water Utilities: $22,534,000 ($344.56)Local Fire Protection: $13,727,000 ($209.90)Police Protection: $13,573,000 ($207.54)Solid Waste Management: $7,299,000 ($111.61)Regular Highways: $4,386,000 ($67.07)Financial Administration: $1,974,000 ($30.18)Housing and Community Development: $1,809,000 ($27.66)Protective Inspection and Regulation - Other: $1,530,000 ($23.39)Libraries: $1,487,000 ($22.74)Parks and Recreation: $1,253,000 ($19.16)Central Staff Services: $897,000 ($13.72)Health - Other: $764,000 ($11.68)Judicial and Legal Services: $409,000 ($6.25)Public Welfare - Other: $371,000 ($5.67)General Public Buildings: $322,000 ($4.92)Natural Resources - Other: $7,000 ($0.11)General - Interest on Debt: $2,527,000 ($38.64)
Intergovernmental to Local - Other - Elementary and Secondary Education: $925,000 ($14.14)
Other - Central Staff Services: $31,000 ($0.47)Other - Health - Other: $20,000 ($0.31)Other - Transit Utilities: $1,000 ($0.02)Intergovernmental to State - Transit Utilities: $3,881,000 ($59.34)
General - Other: $54,000 ($0.83)Other Capital Outlay - Elementary and Secondary Education: $2,267,000 ($34.66)
General - Other: $2,115,000 ($32.34)Water Utilities: $653,000 ($9.98)Regular Highways: $361,000 ($5.52)Sewerage: $64,000 ($0.98)General Public Building: $2,000 ($0.03)Total Salaries and Wages: $55,931,000 ($855.23)
Medford government finances - Revenue in 2021 (per resident):
Charges - Other: $2,358,000 ($36.06)
Parking Facilities: $361,000 ($5.52)Elementary and Secondary Education School Lunch: $293,000 ($4.48)Parks and Recreation: $32,000 ($0.49)Elementary and Secondary Education - Other: $7,000 ($0.11)Federal Intergovernmental - Other: $23,712,000 ($362.57)
Housing and Community Development: $1,322,000 ($20.21)Miscellaneous - General Revenue - Other: $1,437,000 ($21.97)
Donations From Private Sources: $230,000 ($3.52)Interest Earnings: $169,000 ($2.58)Fines and Forfeits: $9,000 ($0.14)Revenue - Water Utilities: $26,864,000 ($410.77)
State Intergovernmental - Education: $20,099,000 ($307.33)
General Local Government Support: $15,249,000 ($233.17)Other: $4,082,000 ($62.42)Highways: $1,249,000 ($19.10)Public Welfare: $86,000 ($1.32)Housing and Community Development: $35,000 ($0.54)Water Utilities: $32,000 ($0.49)Tax - Property: $130,440,000 ($1994.53)
Other License: $2,296,000 ($35.11)Other Selective Sales: $1,241,000 ($18.98)
Medford government finances - Debt in 2021 (per resident):
Long Term Debt - Outstanding Unspecified Public Purpose: $72,557,000 ($1109.45)
Beginning Outstanding - Unspecified Public Purpose: $63,785,000 ($975.32)Issue, Unspecified Public Purpose: $15,840,000 ($242.21)Retired Unspecified Public Purpose: $7,068,000 ($108.08)Short Term Debt Outstanding - Beginning: $1,908,000 ($29.17)
Medford government finances - Cash and Securities in 2021 (per resident):
Bond Funds - Cash and Securities: $16,320,000 ($249.55)
Other Funds - Cash and Securities: $60,214,000 ($920.72)
6.91% of this county's 2021 resident taxpayers lived in other counties in 2020 ($102,955 average adjusted gross income )
Here:
6.91%Massachusetts average:
6.35%
0.01% of residents moved from foreign countries ($137 average AGI )Middlesex County:
0.01%Massachusetts average:
0.01%
Top counties from which taxpayers relocated into this county between 2020 and 2021:
8.22% of this county's 2020 resident taxpayers moved to other counties in 2021 ($123,369 average adjusted gross income )
Here:
8.22%Massachusetts average:
7.18%
0.01% of residents moved to foreign countries ($124 average AGI )Middlesex County:
0.01%Massachusetts average:
0.02%
Top counties to which taxpayers relocated from this county between 2020 and 2021:
Businesses in Medford, MA
Name Count Name Count
AT&T 1 Men's Wearhouse 1 Advance Auto Parts 1 Nike 2 AutoZone 1 Nissan 1 Avenue 1 Old Country Buffet 1 Bally Total Fitness 1 Panda Express 1 Burger King 1 Payless 2 CVS 3 Penske 1 Casual Male XL 1 Pizza Hut 1 Chipotle 1 Qdoba Mexican Grill 1 Circle K 1 Quiznos 1 Cold Stone Creamery 1 RadioShack 1 Curves 1 Rite Aid 2 Domino's Pizza 1 Shaw's 1 Dunkin Donuts 10 Spencer Gifts 1 Famous Footwear 1 Starbucks 2 FedEx 9 Stop & Shop 2 Foot Locker 1 Subway 1 Ford 1 Toys"R"Us 1 GNC 3 True Value 1 GameStop 2 U-Haul 1 H&R Block 2 UPS 6 Jones New York 1 Verizon Wireless 1 Kohl's 1 Volkswagen 1 LensCrafters 1 Walgreens 1 Marshalls 1 Wendy's 1 McDonald's 1 Whole Foods Market 1
Strongest AM radio stations in Medford:
WEZE (590 AM; 5 kW; BOSTON, MA; Owner: NEW ENGLAND CONTINENTAL MEDIA, INC.)
WILD (1090 AM; daytime; 5 kW; BOSTON, MA; Owner: RADIO ONE OF BOSTON LICENSES, LLC)
WRKO (680 AM; 50 kW; BOSTON, MA; Owner: ENTERCOM BOSTON LICENSE, LLC)
WWZN (1510 AM; 50 kW; BOSTON, MA; Owner: ROSE CITY RADIO CORPORATION)
WXKS (1430 AM; 5 kW; EVERETT, MA; Owner: AMFM RADIO LICENSES, L.L.C.)
WEEI (850 AM; 50 kW; BOSTON, MA; Owner: ENTERCOM BOSTON LICENSE, LLC)
WRCA (1330 AM; 25 kW; WALTHAM, MA; Owner: WRCA LICENSE, LLC)
WBZ (1030 AM; 50 kW; BOSTON, MA; Owner: INFINITY BROADCASTING OPERATIONS, INC.)
WBPS (1150 AM; 5 kW; BOSTON, MA; Owner: MEGA COMMUNICATIONS OF BOSTON LICENSEE, L.L.C.)
WROL (950 AM; 5 kW; BOSTON, MA; Owner: SCA LICENSE CORPORATION)
WUNR (1600 AM; 20 kW; BROOKLINE, MA; Owner: CHAMPION BROADCASTING SYSTEMS, INC.)
WKOX (1200 AM; 50 kW; FRAMINGHAM, MA; Owner: CAPSTAR TX LIMITED PARTNERSHIP)
WBIX (1060 AM; 40 kW; NATICK, MA; Owner: LANGER BROADCASTING CORPORATION)
Strongest FM radio stations in Medford:
WFNX (101.7 FM; LYNN, MA; Owner: MCC BROADCASTING COMPANY, INC.)
WXKS-FM (107.9 FM; MEDFORD, MA; Owner: AMFM RADIO LICENSES, L.L.C.)
WMJX (106.7 FM; BOSTON, MA; Owner: GREATER BOSTON RADIO, INC.)
WMFO (91.5 FM; MEDFORD, MA; Owner: TUFTS UNIVERSITY)
WBCN (104.1 FM; BOSTON, MA; Owner: HEMISPHERE BROADCASTING CORPORATION)
WZLX (100.7 FM; BOSTON, MA; Owner: INFINITY BROADCASTING CORPORATION OF BOSTON)
W267AI (101.3 FM; BOSTON, MA; Owner: MCC BROADCASTING COMPANY, INC.)
WERS (88.9 FM; BOSTON, MA; Owner: EMERSON COLLEGE)
WHRB (95.3 FM; CAMBRIDGE, MA; Owner: HARVARD RADIO BROADCASTING CO., INC.)
WBMX (98.5 FM; BOSTON, MA; Owner: INFINITY RADIO OPERATIONS INC.)
WJMN (94.5 FM; BOSTON, MA; Owner: AMFM RADIO LICENSES, L.L.C.)
WCRB (102.5 FM; WALTHAM, MA; Owner: CHARLES RIVER BROADCASTING WCRB LICE)
WTKK (96.9 FM; BOSTON, MA; Owner: GREATER BOSTON RADIO, INC.)
WROR-FM (105.7 FM; FRAMINGHAM, MA; Owner: GREATER BOSTON RADIO, INC.)
WBOS (92.9 FM; BROOKLINE, MA; Owner: GREATER BOSTON RADIO, INC.)
WGBH (89.7 FM; BOSTON, MA; Owner: WGBH EDUCATIONAL FOUNDATION)
WBUR-FM (90.9 FM; BOSTON, MA; Owner: TRUSTEES OF BOSTON UNIVERSITY)
WMBR (88.1 FM; CAMBRIDGE, MA; Owner: TECHNOLOGY BROADCASTING CORPORATION)
WODS (103.3 FM; BOSTON, MA; Owner: INFINITY BROADCASTING OPERATIONS, INC.)
WQSX (93.7 FM; LAWRENCE, MA; Owner: ENTERCOM BOSTON LICENSE, LLC)
TV broadcast stations around Medford:
WBPX (Channel 68; BOSTON, MA; Owner: PAXSON BOSTON-68 LICENSE, INC.)
WTMU-LP (Channel 32; BOSTON, MA; Owner: ZGS BOSTON, INC.)
WCEA-LP (Channel 58; BOSTON, MA; Owner: CHANNEL 19 TV CORPORATION)
WCVB-TV (Channel 5; BOSTON, MA; Owner: WCVB HEARST-ARGYLE TV, INC.)
WGBH-TV (Channel 2; BOSTON, MA; Owner: WGBH EDUCATIONAL FOUNDATION)
WHDH-TV (Channel 7; BOSTON, MA; Owner: WHDH-TV)
WMFP (Channel 62; LAWRENCE, MA; Owner: WSAH LICENSE, INC.)
WSBK-TV (Channel 38; BOSTON, MA; Owner: VIACOM INC.)
WLVI-TV (Channel 56; CAMBRIDGE, MA; Owner: WLVI, INC.)
WBZ-TV (Channel 4; BOSTON, MA; Owner: VIACOM INC.)
WGBX-TV (Channel 44; BOSTON, MA; Owner: WGBH EDUCATIONAL FOUNDATION)
WFXT (Channel 25; BOSTON, MA; Owner: FOX TELEVISION STATIONS INC.)
W40BO (Channel 40; BOSTON, MA; Owner: PAXSON COMMUNICATIONS LPTV, INC.)
WUTF (Channel 66; MARLBOROUGH, MA; Owner: TELEFUTURA BOSTON LLC)
WFXZ-CA (Channel 24; BOSTON, MA; Owner: BOSTON BROADCASTING CORP.)
WUNI (Channel 27; WORCESTER, MA; Owner: ENTRAVISION HOLDINGS, LLC)
WWDP (Channel 46; NORWELL, MA; Owner: NORWELL TELEVISION, LLC)
WLNE-TV (Channel 6; NEW BEDFORD, MA; Owner: FREEDOM BROADCASTING OF SOUTHERN NEW ENGLAND, INC.)
WNAC-TV (Channel 64; PROVIDENCE, RI; Owner: WNAC, LLC)
WPRI-TV (Channel 12; PROVIDENCE, RI; Owner: TVL BROADCASTING OF RHODE ISLAND, LLC)
WHDN-LP (Channel 26; BOSTON, MA; Owner: GUENTER MARKSTEINER)
WJAR (Channel 10; PROVIDENCE, RI; Owner: OUTLET BROADCASTING, INC.)
WNDS (Channel 50; DERRY, NH; Owner: CTV OF DERRY, INC)
National Bridge Inventory (NBI) Statistics 30 Number of bridges456ft / 139m Total length $162,182,000 Total costs2,321,505 Total average daily traffic187,898 Total average daily truck traffic
New bridges - historical statistics
2 Before 1900 4 1900-1909 1 1920-1929 1 1930-1939 4 1950-1959 12 1960-1969 1 1970-1979 2 1980-1989 2 1990-1999 1 2010-2019
See full National Bridge Inventory statistics for Medford, MA
FCC Registered Antenna Towers: 45 (
See the full list of FCC Registered Antenna Towers in Medford )
FCC Registered Commercial Land Mobile Towers: 1 (
See the full list of FCC Registered Commercial Land Mobile Towers in Medford, MA )
FCC Registered Private Land Mobile Towers: 11 (
See the full list of FCC Registered Private Land Mobile Towers )
FCC Registered Broadcast Land Mobile Towers: 23 (
See the full list of FCC Registered Broadcast Land Mobile Towers )
FCC Registered Microwave Towers: 45 (
See the full list of FCC Registered Microwave Towers in this town )
FCC Registered Paging Towers: 7 (
See the full list of FCC Registered Paging Towers )
FCC Registered Maritime Coast & Aviation Ground Towers: 2 (
See the full list of FCC Registered Maritime Coast & Aviation Ground Towers )
FCC Registered Amateur Radio Licenses: 173 (
See the full list of FCC Registered Amateur Radio Licenses in Medford )
FAA Registered Aircraft: 6
Aircraft: CESSNA 150M (Category: Land, Seats: 2, Weight: Up to 12,499 Pounds, Speed: 81 mph), Engine: CONT MOTOR 0-200 SERIES (100 HP) (4 Cycle)N-Number: 63220, N63220, N-63220, Serial Number: 15077186, Year manufactured: 1975, Airworthiness Date: 08/15/1975, Certificate Issue Date: 08/19/2014Registrant (Individual): Roberto S Tracy, 34 Alexander Ave, Medford, MA 02155Aircraft: PIPER PA-24-260 (Category: Land, Seats: 4, Weight: Up to 12,499 Pounds, Speed: 135 mph), Engine: LYCOMING TI0-540 SER (310 HP) (Reciprocating)N-Number: 9140P, N9140P, N-9140P, Serial Number: 24-4621, Year manufactured: 1966, Airworthiness Date: 12/27/1966, Certificate Issue Date: 02/23/1994Registrant (Individual): Stephen M King, 35 Martin St, Medford, MA 02155Aircraft: STINSON 108 (Category: Land, Seats: 4, Weight: Up to 12,499 Pounds, Speed: 84 mph), Engine: FRANKLIN 6A4150 SERIES (150 HP) (Reciprocating)N-Number: 8319K, N8319K, N-8319K, Serial Number: 1081319, Year manufactured: 1946Registrant (Individual): Walter S Withrow, 527 Fulton St, Medford, MA 02155Deregistered: Cancel Date: 05/16/2019Aircraft: SNYDER ICARUS II (Category: Land, Weight: Up to 12,499 Pounds, Speed: 60 mph), Engine: MCCULLOCH 4318A&E/0-100 (72 HP) (Reciprocating)N-Number: 87887, N87887, N-87887, Serial Number: F46, Year manufactured: 1976, Certificate Issue Date: 11/30/1976Registrant (Individual): Peter F Snyder, 30 Fulton St, Medford, MA 02155Deregistered: Cancel Date: 03/16/2018Aircraft: REARWIN 185 (Category: Land, Seats: 2, Weight: Up to 12,499 Pounds, Speed: 86 mph), Engine: CONT MOTOR C85 SERIES (85 HP) (Reciprocating)N-Number: 93244, N93244, N-93244, Serial Number: 1749, Year manufactured: 1946Registrant (Individual): Paul Amoroso, 64 Billings Ave, Medford, MA 02155Deregistered: Cancel Date: 04/06/2018Aircraft: PIPER PA-28-140 (Category: Land, Seats: 4, Weight: Up to 12,499 Pounds, Speed: 107 mph), Engine: LYCOMING 0-320 SERIES (180 HP) (Reciprocating)N-Number: 9884W, N9884W, N-9884W, Serial Number: 28-23404, Year manufactured: 1967, Airworthiness Date: 07/10/1967, Certificate Issue Date: 08/25/1989Registrant (Individual): David M Rajczewski, 149 George St, Medford, MA 02155Deregistered: Cancel Date: 02/08/2018
Home Mortgage Disclosure Act Aggregated Statistics For Year 2009(Based on 11 full tracts) A) FHA, FSA/RHS & VA B) Conventional C) Refinancings D) Home Improvement Loans E) Loans on Dwellings For 5+ Families F) Non-occupant Loans on G) Loans On Manufactured Number Average Value Number Average Value Number Average Value Number Average Value Number Average Value Number Average Value Number Average Value
LOANS ORIGINATED 104 $321,154 404 $250,785 1,470 $260,253 84 $114,333 4 $1,502,750 88 $266,989 2 $341,000 APPLICATIONS APPROVED, NOT ACCEPTED 6 $290,500 24 $259,042 95 $300,674 9 $119,667 0 $0 3 $210,333 0 $0 APPLICATIONS DENIED 20 $325,850 42 $240,381 344 $297,581 33 $136,545 0 $0 35 $271,086 0 $0 APPLICATIONS WITHDRAWN 25 $341,320 53 $262,679 284 $292,496 6 $167,167 2 $181,500 19 $300,526 0 $0 FILES CLOSED FOR INCOMPLETENESS 6 $347,833 10 $243,300 88 $271,057 6 $108,833 0 $0 4 $300,500 0 $0
Aggregated Statistics For Year 2008(Based on 11 full tracts) A) FHA, FSA/RHS & VA B) Conventional C) Refinancings D) Home Improvement Loans E) Loans on Dwellings For 5+ Families F) Non-occupant Loans on G) Loans On Manufactured Number Average Value Number Average Value Number Average Value Number Average Value Number Average Value Number Average Value Number Average Value
LOANS ORIGINATED 65 $348,738 478 $279,927 730 $262,285 69 $104,710 12 $624,667 117 $273,812 0 $0 APPLICATIONS APPROVED, NOT ACCEPTED 5 $343,200 44 $272,136 91 $281,264 10 $37,500 0 $0 12 $246,917 1 $534,000 APPLICATIONS DENIED 10 $310,200 55 $284,564 349 $293,860 46 $76,022 3 $339,333 22 $298,318 1 $45,000 APPLICATIONS WITHDRAWN 12 $352,667 74 $273,892 154 $297,058 5 $252,000 0 $0 18 $281,111 0 $0 FILES CLOSED FOR INCOMPLETENESS 0 $0 21 $266,619 42 $314,571 2 $344,500 0 $0 4 $314,250 0 $0
Aggregated Statistics For Year 2007(Based on 11 full tracts) A) FHA, FSA/RHS & VA B) Conventional C) Refinancings D) Home Improvement Loans E) Loans on Dwellings For 5+ Families F) Non-occupant Loans on G) Loans On Manufactured Number Average Value Number Average Value Number Average Value Number Average Value Number Average Value Number Average Value Number Average Value
LOANS ORIGINATED 11 $328,000 709 $254,039 804 $241,854 168 $90,923 14 $961,643 125 $291,136 2 $74,000 APPLICATIONS APPROVED, NOT ACCEPTED 1 $334,000 124 $275,831 138 $220,580 16 $74,875 2 $18,500 28 $247,036 0 $0 APPLICATIONS DENIED 2 $272,500 157 $290,064 525 $277,448 83 $98,735 3 $1,000,000 42 $327,929 1 $52,000 APPLICATIONS WITHDRAWN 3 $334,000 109 $279,789 222 $277,797 12 $135,833 0 $0 34 $322,441 0 $0 FILES CLOSED FOR INCOMPLETENESS 0 $0 21 $214,000 85 $332,247 2 $75,000 0 $0 2 $386,500 0 $0
Aggregated Statistics For Year 2006(Based on 11 full tracts) A) FHA, FSA/RHS & VA B) Conventional C) Refinancings D) Home Improvement Loans E) Loans on Dwellings For 5+ Families F) Non-occupant Loans on G) Loans On Manufactured Number Average Value Number Average Value Number Average Value Number Average Value Number Average Value Number Average Value Number Average Value
LOANS ORIGINATED 3 $320,333 921 $244,534 1,163 $248,232 233 $99,884 8 $439,500 170 $277,106 5 $85,600 APPLICATIONS APPROVED, NOT ACCEPTED 0 $0 122 $221,418 173 $250,740 24 $82,042 1 $1,468,000 15 $255,333 0 $0 APPLICATIONS DENIED 1 $360,000 221 $255,122 506 $280,152 104 $89,548 0 $0 51 $244,647 2 $207,500 APPLICATIONS WITHDRAWN 0 $0 142 $265,782 399 $290,867 26 $187,346 3 $57,667 31 $372,871 0 $0 FILES CLOSED FOR INCOMPLETENESS 0 $0 21 $244,714 87 $310,701 4 $143,750 0 $0 3 $250,667 0 $0
Aggregated Statistics For Year 2005(Based on 11 full tracts) A) FHA, FSA/RHS & VA B) Conventional C) Refinancings D) Home Improvement Loans E) Loans on Dwellings For 5+ Families F) Non-occupant Loans on G) Loans On Manufactured Number Average Value Number Average Value Number Average Value Number Average Value Number Average Value Number Average Value Number Average Value
LOANS ORIGINATED 2 $251,500 1,097 $261,861 1,348 $259,654 166 $137,608 7 $523,714 200 $307,655 1 $7,000 APPLICATIONS APPROVED, NOT ACCEPTED 0 $0 60 $244,683 144 $257,486 29 $99,586 1 $5,600,000 20 $257,200 1 $17,000 APPLICATIONS DENIED 0 $0 229 $245,686 540 $291,339 112 $116,804 1 $539,000 61 $261,836 1 $329,000 APPLICATIONS WITHDRAWN 0 $0 210 $256,871 592 $287,693 48 $178,438 4 $169,250 41 $295,293 1 $73,000 FILES CLOSED FOR INCOMPLETENESS 0 $0 27 $253,444 72 $316,736 3 $93,333 0 $0 9 $356,111 1 $195,000
Aggregated Statistics For Year 2004(Based on 11 full tracts) A) FHA, FSA/RHS & VA B) Conventional C) Refinancings D) Home Improvement Loans E) Loans on Dwellings For 5+ Families F) Non-occupant Loans on G) Loans On Manufactured Number Average Value Number Average Value Number Average Value Number Average Value Number Average Value Number Average Value Number Average Value
LOANS ORIGINATED 3 $342,667 933 $271,378 1,555 $245,167 170 $134,718 8 $648,375 193 $296,477 1 $50,000 APPLICATIONS APPROVED, NOT ACCEPTED 0 $0 83 $281,723 208 $249,130 34 $97,941 0 $0 24 $261,417 1 $30,000 APPLICATIONS DENIED 1 $272,000 138 $266,319 471 $260,064 123 $85,309 0 $0 43 $265,047 1 $85,000 APPLICATIONS WITHDRAWN 1 $217,000 88 $272,591 503 $251,089 28 $132,750 1 $493,000 30 $351,500 0 $0 FILES CLOSED FOR INCOMPLETENESS 1 $381,000 27 $245,593 89 $279,820 5 $109,000 0 $0 9 $179,333 0 $0
Aggregated Statistics For Year 2003(Based on 11 full tracts) A) FHA, FSA/RHS & VA B) Conventional C) Refinancings D) Home Improvement Loans E) Loans on Dwellings For 5+ Families F) Non-occupant Loans on Number Average Value Number Average Value Number Average Value Number Average Value Number Average Value Number Average Value
LOANS ORIGINATED 7 $267,286 702 $264,853 3,962 $201,209 100 $74,470 8 $1,041,125 303 $243,083 APPLICATIONS APPROVED, NOT ACCEPTED 0 $0 45 $258,378 402 $200,149 33 $69,424 1 $190,000 36 $262,222 APPLICATIONS DENIED 3 $286,000 104 $271,596 626 $221,751 78 $56,795 0 $0 59 $253,898 APPLICATIONS WITHDRAWN 1 $264,000 84 $254,000 574 $219,843 29 $44,759 0 $0 32 $236,094 FILES CLOSED FOR INCOMPLETENESS 0 $0 14 $264,071 56 $219,821 2 $24,000 0 $0 3 $235,000
Aggregated Statistics For Year 2002(Based on 11 full tracts) A) FHA, FSA/RHS & VA B) Conventional C) Refinancings D) Home Improvement Loans E) Loans on Dwellings For 5+ Families F) Non-occupant Loans on Number Average Value Number Average Value Number Average Value Number Average Value Number Average Value Number Average Value
LOANS ORIGINATED 10 $231,800 662 $238,924 2,665 $194,785 157 $59,376 12 $711,833 244 $227,553 APPLICATIONS APPROVED, NOT ACCEPTED 2 $233,000 50 $244,980 257 $185,825 51 $53,412 0 $0 18 $220,333 APPLICATIONS DENIED 1 $222,000 60 $258,767 404 $194,421 85 $49,835 1 $200,000 32 $221,312 APPLICATIONS WITHDRAWN 1 $261,000 55 $232,145 389 $195,162 36 $60,639 0 $0 15 $241,267 FILES CLOSED FOR INCOMPLETENESS 1 $298,000 20 $296,500 72 $217,319 1 $15,000 0 $0 8 $250,375
Aggregated Statistics For Year 2001(Based on 11 full tracts) A) FHA, FSA/RHS & VA B) Conventional C) Refinancings D) Home Improvement Loans E) Loans on Dwellings For 5+ Families F) Non-occupant Loans on Number Average Value Number Average Value Number Average Value Number Average Value Number Average Value Number Average Value
LOANS ORIGINATED 26 $209,000 604 $216,892 2,074 $183,202 120 $53,933 7 $296,857 167 $235,725 APPLICATIONS APPROVED, NOT ACCEPTED 3 $209,667 52 $205,173 200 $168,960 44 $50,273 0 $0 12 $214,750 APPLICATIONS DENIED 2 $247,000 63 $212,778 333 $168,414 95 $33,874 1 $396,000 25 $202,640 APPLICATIONS WITHDRAWN 2 $204,000 54 $240,407 359 $172,869 51 $45,353 1 $188,000 21 $210,714 FILES CLOSED FOR INCOMPLETENESS 2 $251,500 5 $194,600 64 $182,188 5 $101,000 0 $0 8 $180,875
Aggregated Statistics For Year 2000(Based on 11 full tracts) A) FHA, FSA/RHS & VA B) Conventional C) Refinancings D) Home Improvement Loans E) Loans on Dwellings For 5+ Families F) Non-occupant Loans on Number Average Value Number Average Value Number Average Value Number Average Value Number Average Value Number Average Value
LOANS ORIGINATED 26 $179,846 617 $189,066 505 $144,170 128 $33,320 4 $359,250 79 $184,722 APPLICATIONS APPROVED, NOT ACCEPTED 2 $175,000 59 $205,610 81 $140,630 46 $31,022 0 $0 2 $321,000 APPLICATIONS DENIED 2 $193,500 75 $197,707 224 $130,040 99 $41,061 1 $2,500,000 23 $152,087 APPLICATIONS WITHDRAWN 0 $0 52 $175,442 140 $115,471 26 $42,538 0 $0 12 $166,500 FILES CLOSED FOR INCOMPLETENESS 2 $169,000 9 $186,889 42 $167,548 1 $58,000 0 $0 2 $287,000
Aggregated Statistics For Year 1999(Based on 10 full and 1 partial tracts) A) FHA, FSA/RHS & VA B) Conventional C) Refinancings D) Home Improvement Loans E) Loans on Dwellings For 5+ Families F) Non-occupant Loans on Number Average Value Number Average Value Number Average Value Number Average Value Number Average Value Number Average Value
LOANS ORIGINATED 33 $184,170 664 $171,578 997 $131,677 106 $30,197 8 $322,982 127 $156,531 APPLICATIONS APPROVED, NOT ACCEPTED 2 $225,150 53 $194,079 142 $120,216 38 $28,676 0 $0 14 $98,876 APPLICATIONS DENIED 9 $163,793 85 $176,499 247 $128,119 75 $30,007 0 $0 33 $165,101 APPLICATIONS WITHDRAWN 7 $135,879 58 $184,616 212 $118,423 21 $58,027 0 $0 12 $161,772 FILES CLOSED FOR INCOMPLETENESS 3 $159,100 13 $143,866 58 $132,394 3 $42,140 0 $0 5 $128,836
Detailed mortgage data for all 11 tracts in Medford, MA
Private Mortgage Insurance Companies Aggregated Statistics For Year 2009(Based on 11 full tracts) A) Conventional B) Refinancings Number Average Value Number Average Value
LOANS ORIGINATED 63 $294,476 44 $319,614 APPLICATIONS APPROVED, NOT ACCEPTED 24 $262,000 25 $330,360 APPLICATIONS DENIED 11 $275,273 13 $314,077 APPLICATIONS WITHDRAWN 7 $232,429 5 $375,600 FILES CLOSED FOR INCOMPLETENESS 2 $393,500 1 $463,000
Aggregated Statistics For Year 2008(Based on 11 full tracts) A) Conventional B) Refinancings C) Non-occupant Loans on Number Average Value Number Average Value Number Average Value
LOANS ORIGINATED 146 $320,082 54 $334,944 2 $214,500 APPLICATIONS APPROVED, NOT ACCEPTED 42 $327,952 27 $377,889 1 $260,000 APPLICATIONS DENIED 10 $319,600 11 $331,909 3 $239,333 APPLICATIONS WITHDRAWN 4 $298,000 9 $345,111 0 $0 FILES CLOSED FOR INCOMPLETENESS 0 $0 1 $404,000 0 $0
Aggregated Statistics For Year 2007(Based on 11 full tracts) A) Conventional B) Refinancings C) Non-occupant Loans on Number Average Value Number Average Value Number Average Value
LOANS ORIGINATED 86 $321,919 39 $378,718 7 $335,571 APPLICATIONS APPROVED, NOT ACCEPTED 12 $317,583 15 $392,267 0 $0 APPLICATIONS DENIED 3 $372,667 2 $367,500 2 $280,000 APPLICATIONS WITHDRAWN 5 $357,400 2 $312,000 2 $336,000 FILES CLOSED FOR INCOMPLETENESS 1 $282,000 0 $0 0 $0
Aggregated Statistics For Year 2006(Based on 11 full tracts) A) Conventional B) Refinancings C) Non-occupant Loans on Number Average Value Number Average Value Number Average Value
LOANS ORIGINATED 48 $325,458 30 $382,033 1 $423,000 APPLICATIONS APPROVED, NOT ACCEPTED 12 $306,833 7 $361,000 0 $0 APPLICATIONS DENIED 0 $0 1 $365,000 0 $0 APPLICATIONS WITHDRAWN 1 $351,000 2 $491,000 0 $0 FILES CLOSED FOR INCOMPLETENESS 0 $0 1 $425,000 0 $0
Aggregated Statistics For Year 2005(Based on 11 full tracts) A) Conventional B) Refinancings C) Non-occupant Loans on Number Average Value Number Average Value Number Average Value
LOANS ORIGINATED 66 $340,167 17 $359,824 2 $524,500 APPLICATIONS APPROVED, NOT ACCEPTED 13 $311,846 3 $314,667 3 $362,000 APPLICATIONS DENIED 0 $0 1 $392,000 0 $0 APPLICATIONS WITHDRAWN 4 $328,750 5 $408,800 0 $0 FILES CLOSED FOR INCOMPLETENESS 2 $355,000 0 $0 0 $0
Aggregated Statistics For Year 2004(Based on 11 full tracts) A) Conventional B) Refinancings C) Non-occupant Loans on Number Average Value Number Average Value Number Average Value
LOANS ORIGINATED 94 $338,468 20 $322,650 7 $349,714 APPLICATIONS APPROVED, NOT ACCEPTED 13 $356,385 5 $334,000 0 $0 APPLICATIONS DENIED 1 $500,000 0 $0 0 $0 APPLICATIONS WITHDRAWN 3 $361,667 1 $298,000 0 $0 FILES CLOSED FOR INCOMPLETENESS 2 $377,500 0 $0 0 $0
Aggregated Statistics For Year 2003(Based on 11 full tracts) A) Conventional B) Refinancings C) Non-occupant Loans on Number Average Value Number Average Value Number Average Value
LOANS ORIGINATED 151 $308,318 55 $274,236 7 $358,429 APPLICATIONS APPROVED, NOT ACCEPTED 30 $311,200 16 $281,625 1 $225,000 APPLICATIONS DENIED 3 $346,667 1 $298,000 0 $0 APPLICATIONS WITHDRAWN 11 $337,000 1 $397,000 0 $0 FILES CLOSED FOR INCOMPLETENESS 4 $418,000 0 $0 0 $0
Aggregated Statistics For Year 2002(Based on 11 full tracts) A) Conventional B) Refinancings C) Non-occupant Loans on Number Average Value Number Average Value Number Average Value
LOANS ORIGINATED 167 $285,317 37 $270,081 10 $284,200 APPLICATIONS APPROVED, NOT ACCEPTED 15 $232,933 9 $261,000 0 $0 APPLICATIONS DENIED 4 $297,250 0 $0 0 $0 APPLICATIONS WITHDRAWN 4 $304,250 2 $342,500 0 $0 FILES CLOSED FOR INCOMPLETENESS 3 $297,000 1 $162,000 0 $0
Aggregated Statistics For Year 2001(Based on 11 full tracts) A) Conventional B) Refinancings C) Non-occupant Loans on Number Average Value Number Average Value Number Average Value
LOANS ORIGINATED 170 $250,676 46 $226,457 4 $231,250 APPLICATIONS APPROVED, NOT ACCEPTED 21 $250,857 8 $233,875 0 $0 APPLICATIONS DENIED 10 $229,700 0 $0 0 $0 APPLICATIONS WITHDRAWN 5 $221,600 0 $0 1 $324,000 FILES CLOSED FOR INCOMPLETENESS 0 $0 0 $0 0 $0
Aggregated Statistics For Year 2000(Based on 11 full tracts) A) Conventional B) Refinancings C) Non-occupant Loans on Number Average Value Number Average Value Number Average Value
LOANS ORIGINATED 205 $216,078 24 $203,958 5 $205,000 APPLICATIONS APPROVED, NOT ACCEPTED 32 $235,281 8 $225,875 0 $0 APPLICATIONS DENIED 6 $219,167 0 $0 0 $0 APPLICATIONS WITHDRAWN 3 $247,333 0 $0 0 $0 FILES CLOSED FOR INCOMPLETENESS 0 $0 1 $208,000 0 $0
Aggregated Statistics For Year 1999(Based on 10 full and 1 partial tracts) A) Conventional B) Refinancings C) Non-occupant Loans on Number Average Value Number Average Value Number Average Value
LOANS ORIGINATED 267 $196,219 30 $179,880 11 $181,753 APPLICATIONS APPROVED, NOT ACCEPTED 19 $222,946 10 $182,207 2 $180,605 APPLICATIONS DENIED 14 $219,856 2 $293,250 1 $77,780 APPLICATIONS WITHDRAWN 16 $178,878 2 $214,530 1 $77,780 FILES CLOSED FOR INCOMPLETENESS 2 $225,040 1 $120,260 0 $0
Fire-safe hotels and motels in Medford, Massachusetts:
Hyatt Place - Boston/Medford, 116 Riverside Ave NE, Medford, Massachusetts 02155 Phone: (781) 395-8500, Fax: (781) 395-0077
AC Hotel Boston North, 95 Station Lndg, Medford, Massachusetts 02155 Phone: (781) 819-2090
All 2 fire-safe hotels and motels in Medford, Massachusetts
Most common first names in Medford, MA among deceased individuals Name Count Lived (average)
Mary 1,018 80.9 years John 782 75.5 years Joseph 605 75.6 years William 409 74.0 years Margaret 387 80.9 years James 383 74.6 years Helen 314 80.5 years Charles 291 76.0 years Anna 275 82.4 years Frank 266 77.7 years
Most common last names in Medford, MA among deceased individuals Last name Count Lived (average)
Murphy 117 75.2 years Sullivan 109 77.3 years Smith 95 77.2 years Obrien 91 79.0 years Mccarthy 76 76.9 years Brown 65 77.8 years Doherty 59 77.8 years Johnson 59 78.9 years Anderson 52 78.7 years Walsh 50 75.6 years
Medford compared to Massachusetts state average:
Unemployed percentage significantly below state average. Hispanic race population percentage below state average. Foreign-born population percentage above state average. Percentage of population with a bachelor's degree or higher above state average.
#10 on the list of "Top 101 cities with the lowest number of arson incidents per 100,000 residents (population 50,000+)"
#13 on the list of "Top 101 cities with the smallest humidity differences during a year (population 50,000+)"
#13 on the list of "Top 101 cities with the smallest differences between morning and afternoon humidity (population 50,000+)"
#14 on the list of "Top 100 cities with oldest houses (pop. 50,000+)"
#17 on the list of "Top 101 cities with the largest percentage of likely lesbian couples (counted as self-reported female-female unmarried-partner households) (population 50,000+)"
#20 on the list of "Top 101 cities with the lowest number of assaults per 100,000 residents (population 50,000+)"
#22 on the list of "Top 101 cities with the highest average wind speeds (population 50,000+)"
#25 on the list of "Top 101 cities with the lowest number of rapes per 100,000 residents (population 50,000+)"
#26 on the list of "Top 101 cities with the smallest precipitation differences during a year (population 50,000+)"
#29 on the list of "Top 101 cities with the largest percentage of likely homosexual households (counted as self-reported same-sex unmarried-partner households) (population 50,000+)"
#37 on the list of "Top 101 cities with largest percentage of females in occupations: life, physical, and social science occupations (population 50,000+)"
#37 on the list of "Top 100 cities with old houses but young residents (pop. 50,000+)"
#38 on the list of "Top 101 cities with largest percentage of males in occupations: life, physical, and social science occupations (population 50,000+)"
#39 on the list of "Top 101 cities with the lowest percentage of single-parent households, population 50,000+"
#45 on the list of "Top 100 cities with highest percentage of college students (pop. 50,000+)"
#47 on the list of "Top 101 cities with the most residents born in Brazil (population 500+)"
#53 on the list of "Top 101 cities with largest percentage of females in industries: educational services (population 50,000+)"
#58 on the list of "Top 101 cities with the smallest city-data.com crime index per police officer (population 50,000+)"
#59 on the list of "Top 101 cities with largest percentage of males in industries: educational services (population 50,000+)"
#63 on the list of "Top 101 cities with the largest percentage of likely gay men couples (counted as self-reported male-male unmarried-partner households) (population 50,000+)"
#4 on the list of "Top 101 counties with the most Orthodox adherents"
#7 on the list of "Top 101 counties with the most Catholic adherents"
#7 on the list of "Top 101 counties with the most Mainline Protestant congregations"
#7 on the list of "Top 101 counties with the most Orthodox congregations"
#8 on the list of "Top 101 counties with the lowest percentage of residents that keep firearms around their homes"
Top Patent Applicants
Michael Muller (63)
Tirtha Chakraborty (52)
Jared Alden Judson (25)
Ulrich Herken (17)
Stefanie Roeper (17)
Deborah Choquette (16)
Markus Berheide (15)
Ross J. Wendell (14)
Feiling Wang (14)
Roy M. Pollock (13)
Total of 1833 patent applications in 2008-2024.

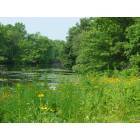


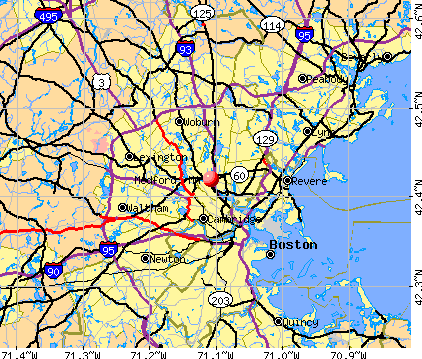


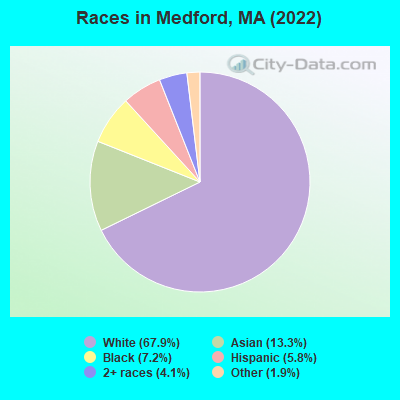
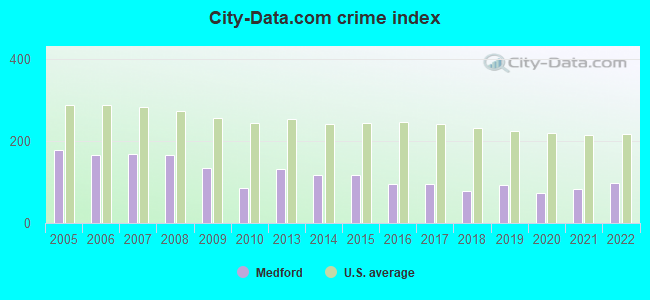
 Recent articles from our blog. Our writers, many of them Ph.D. graduates or candidates, create easy-to-read articles on a wide variety of topics.


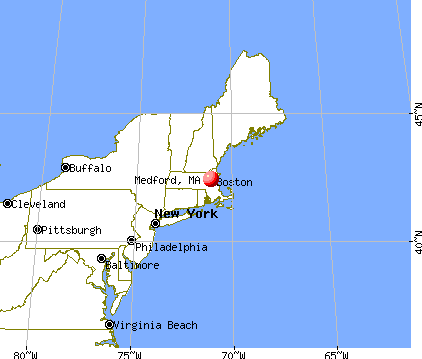
 (6.9 miles
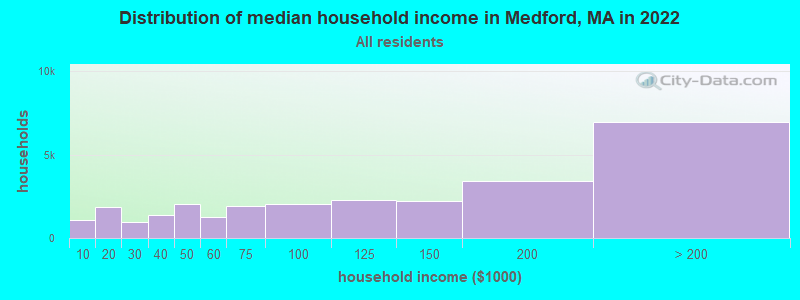
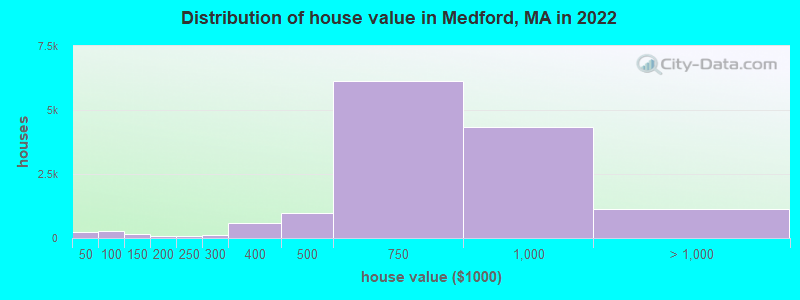
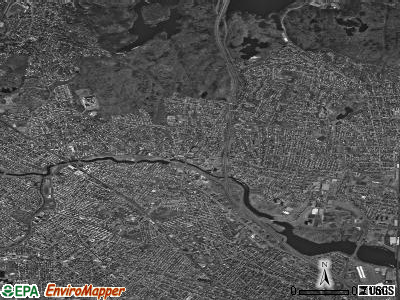
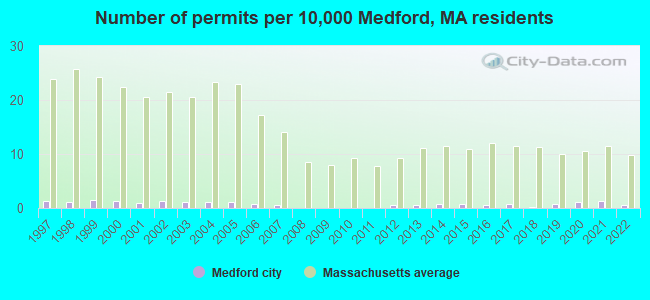
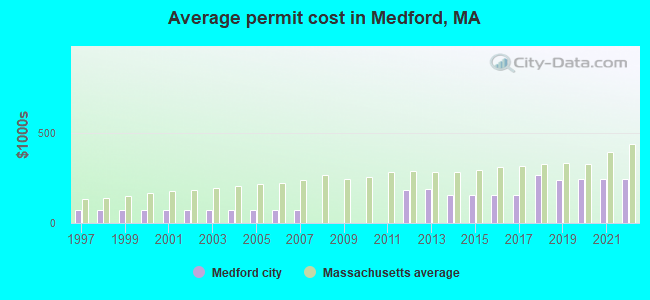
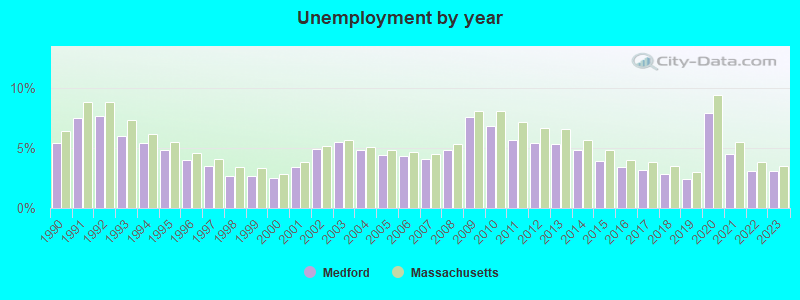
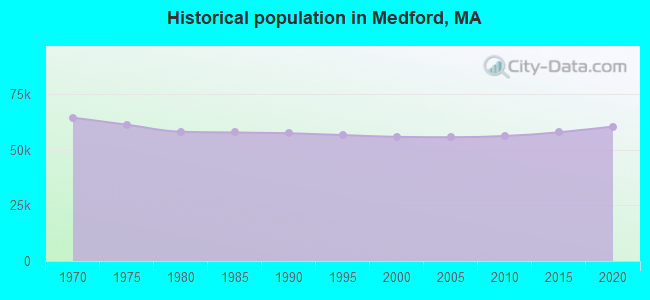
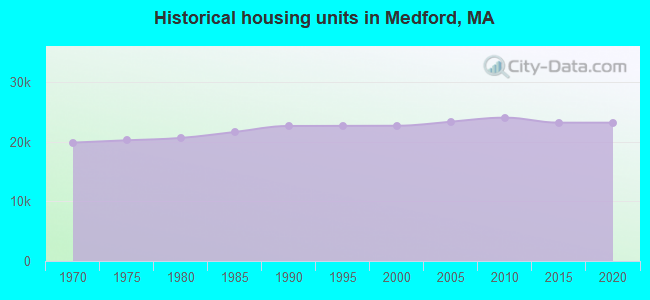
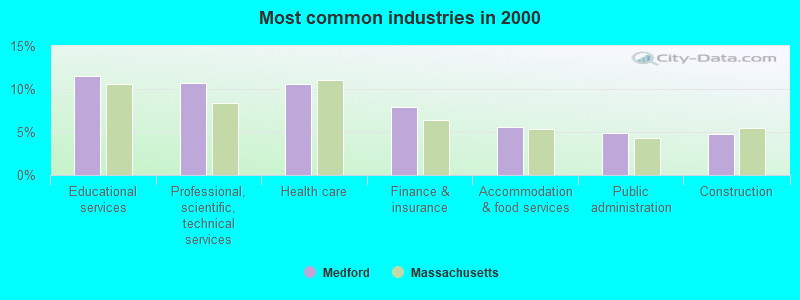
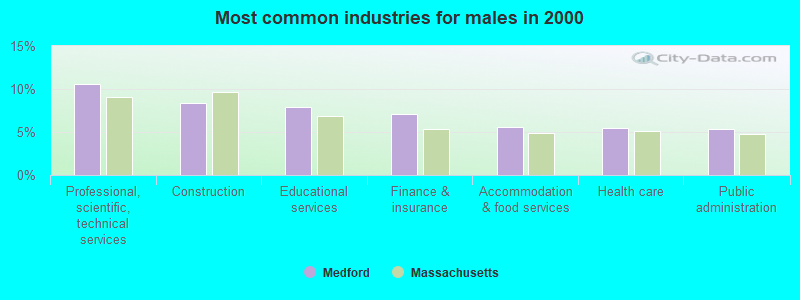
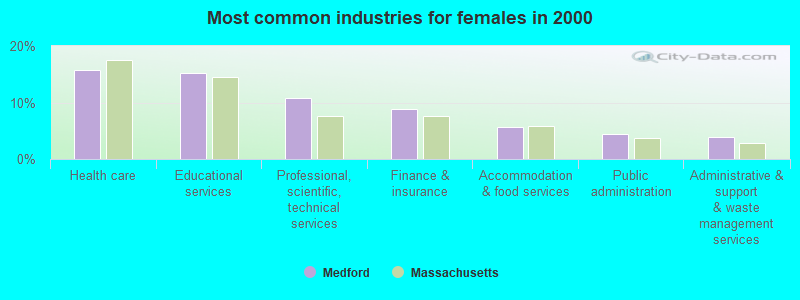
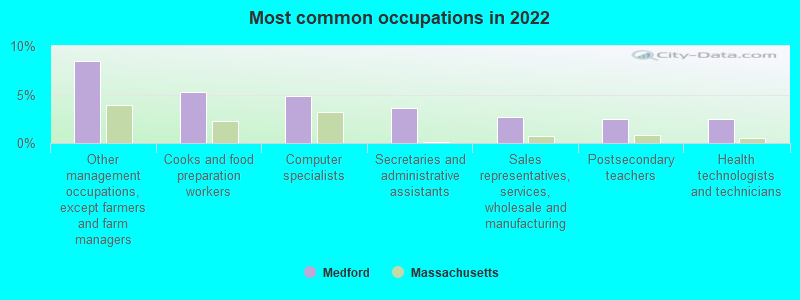
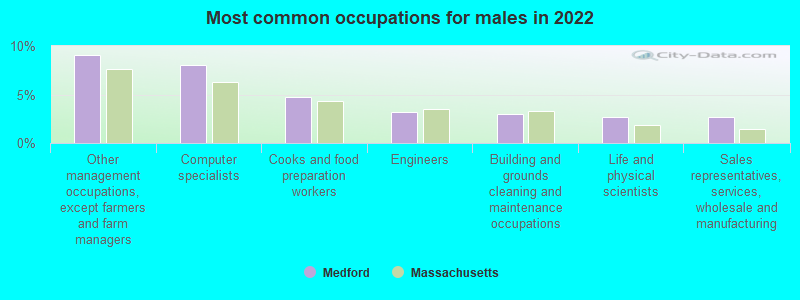
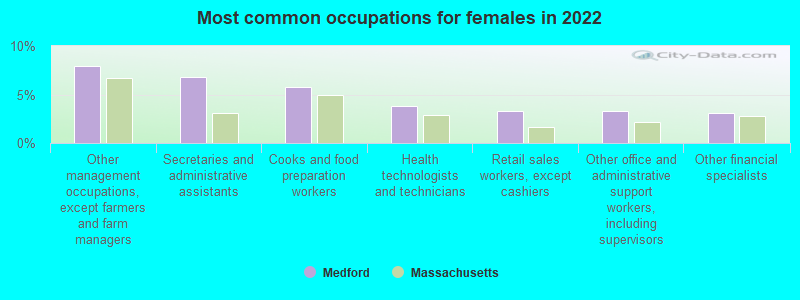
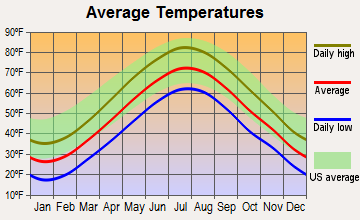
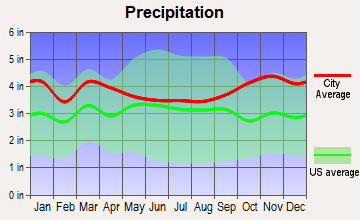
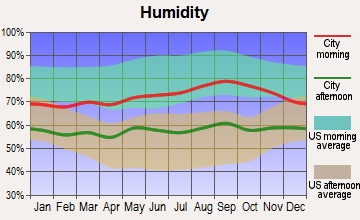
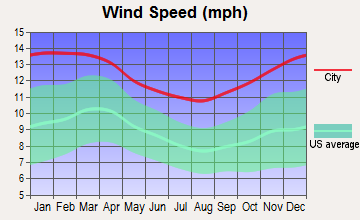
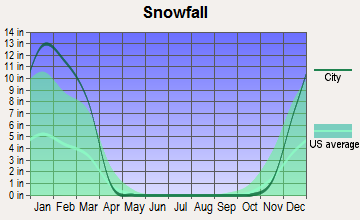
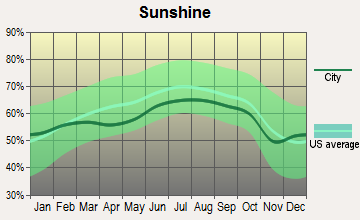
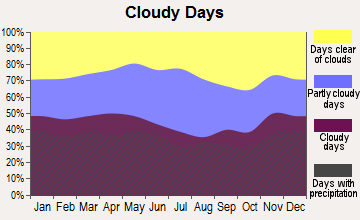
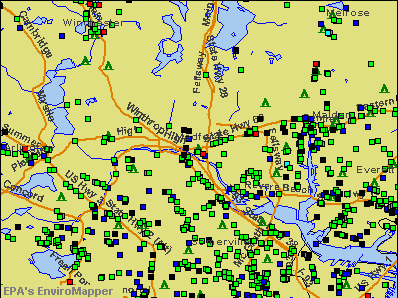

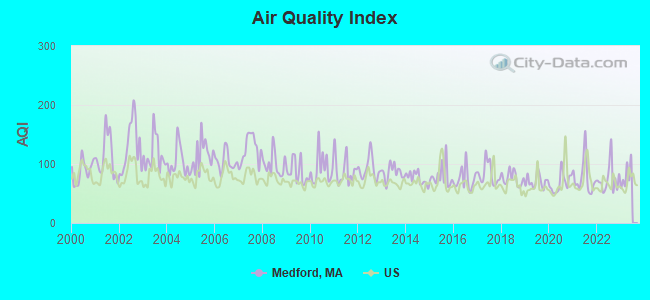

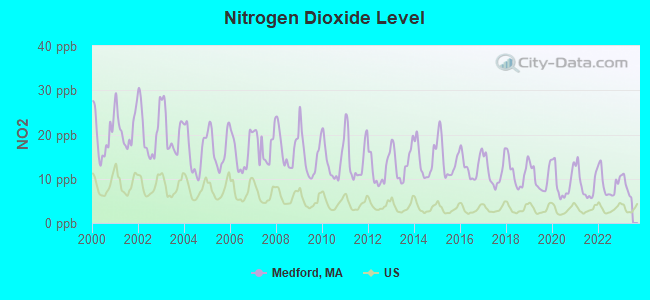
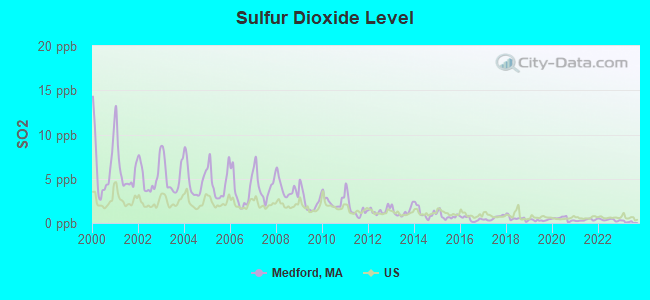
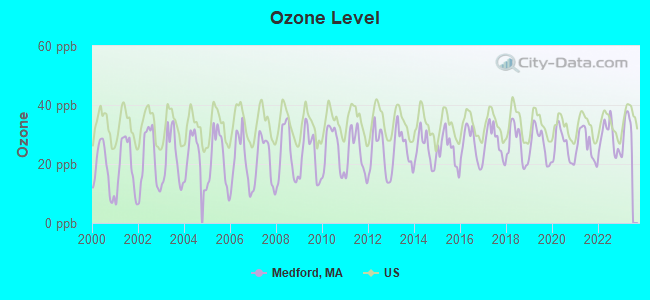
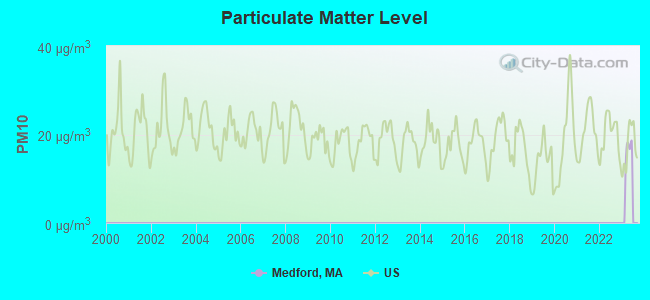
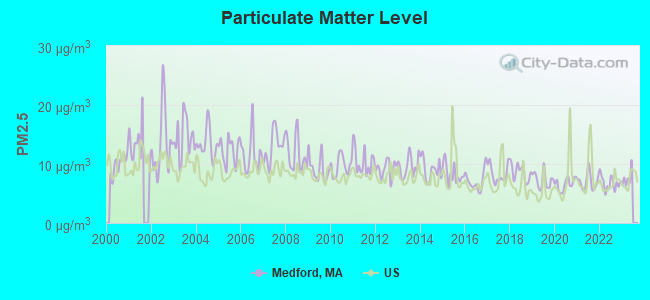

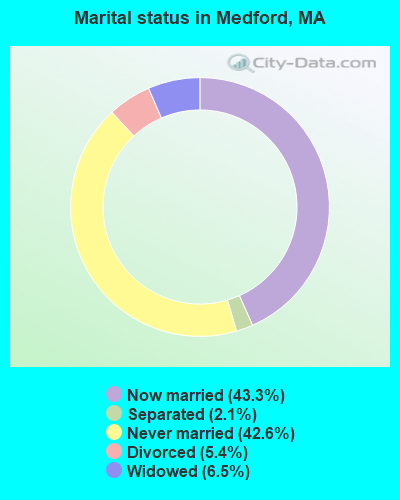
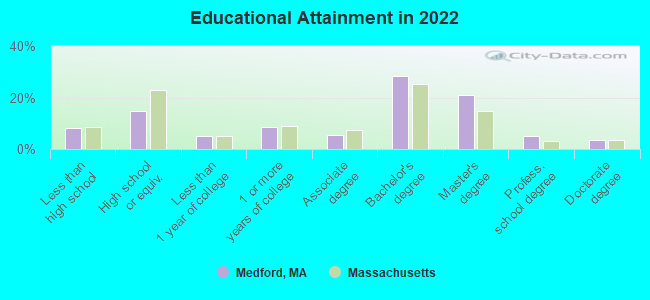
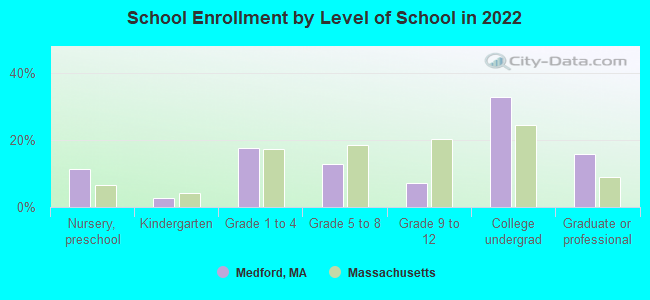
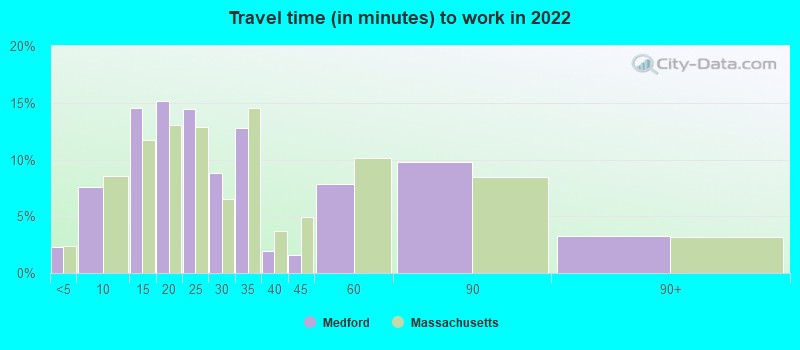
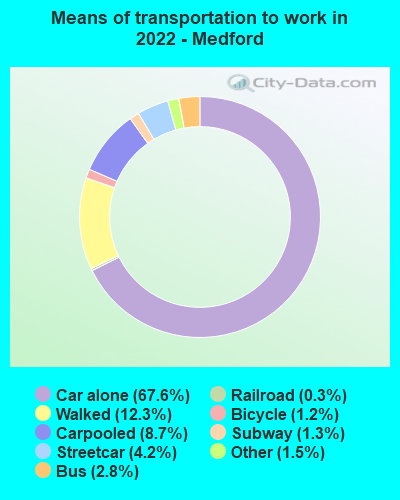
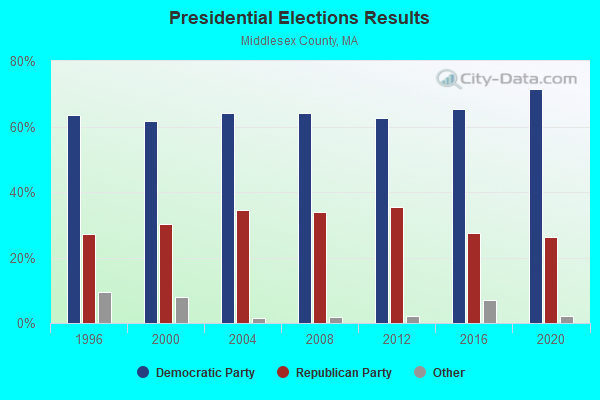
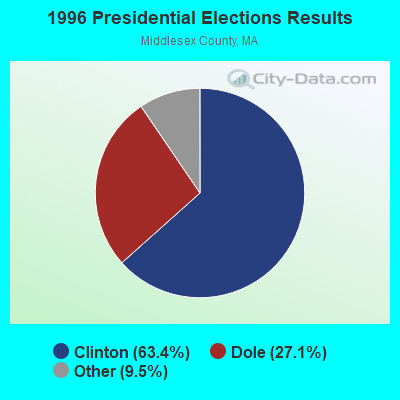
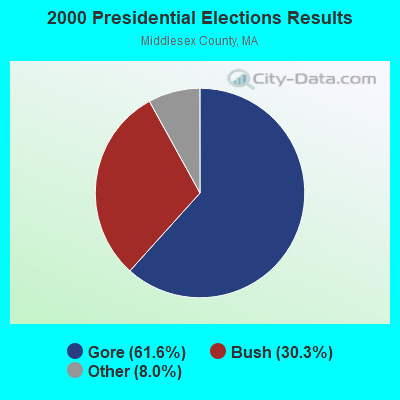
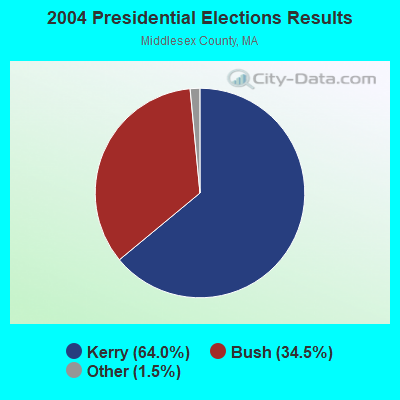
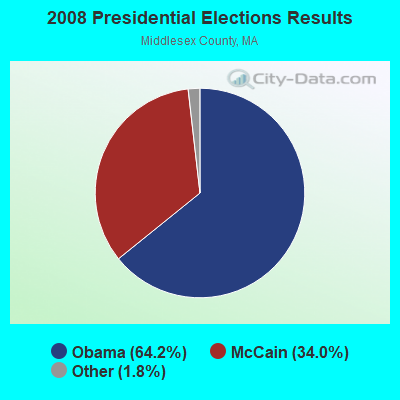
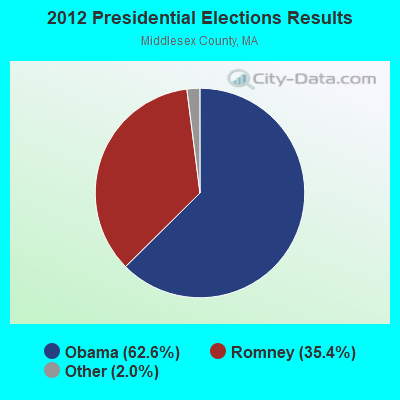
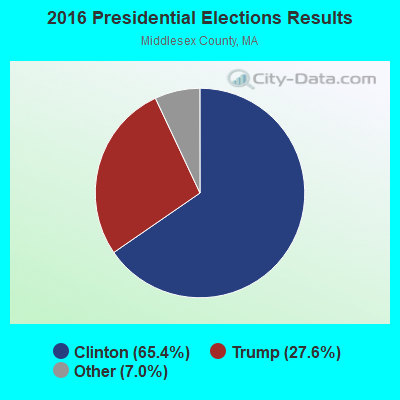
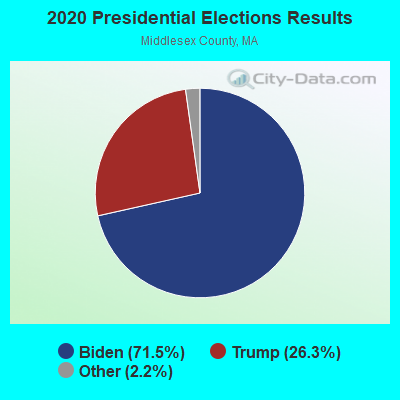
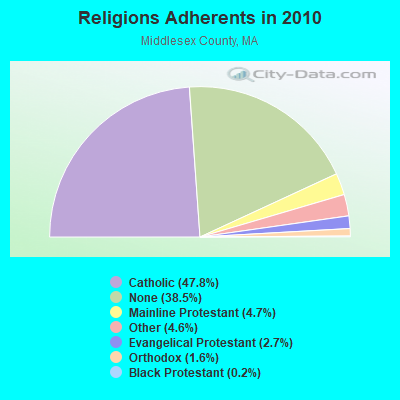
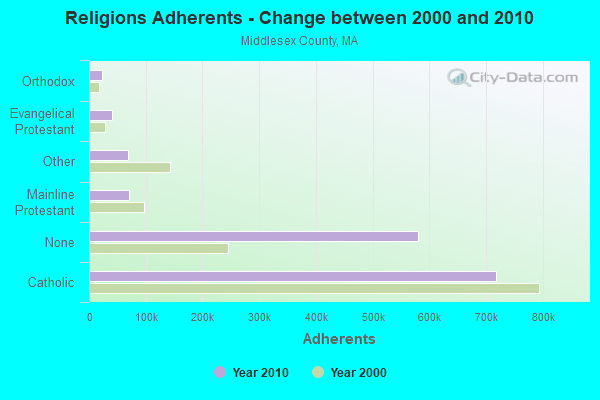
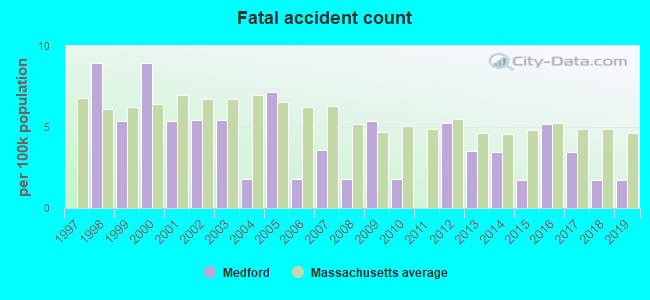
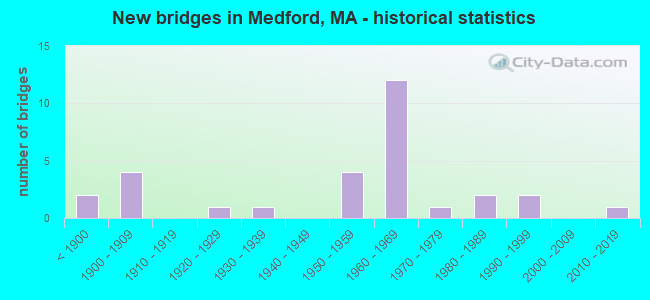
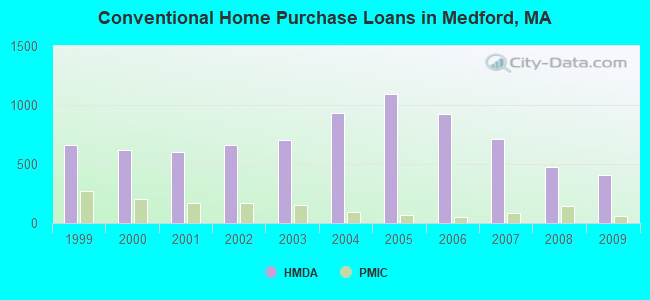
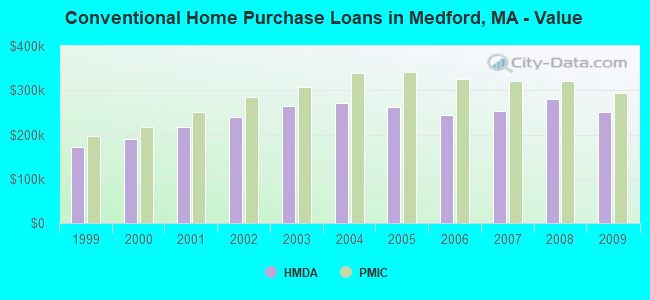
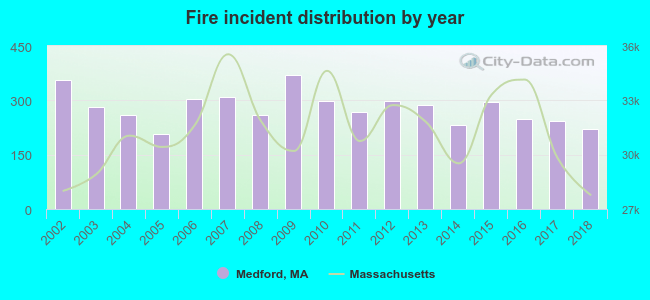 Based on the data from the years 2002 - 2018 the average number of fire incidents per year is 279. The highest number of reported fires - 371 took place in 2009, and the least - 206 in 2005. The data has a decreasing trend.
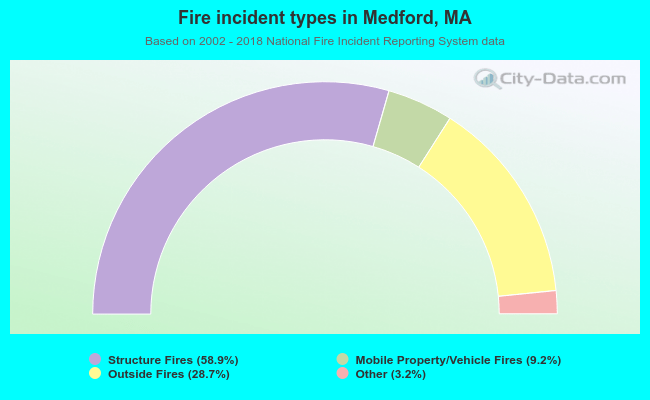 When looking into fire subcategories, the most reports belonged to: Structure Fires (58.9%), and Outside Fires (28.7%).