Miami Shores, Florida Submit your own pictures of this village and show them to the world
OSM Map
General Map
Google Map
MSN Map
OSM Map
General Map
Google Map
MSN Map
OSM Map
General Map
Google Map
MSN Map
OSM Map
General Map
Google Map
MSN Map
Please wait while loading the map...
Population in 2022: 11,569 (100% urban, 0% rural). Population change since 2000: +11.5%Males: 5,197 Females: 6,372
March 2022 cost of living index in Miami Shores: 108.7 (more than average, U.S. average is 100) Percentage of residents living in poverty in 2022: 7.4%for White Non-Hispanic residents , 27.2% for Black residents , 7.1% for Hispanic or Latino residents , 0.7% for other race residents , 0.9% for two or more races residents )
Profiles of local businesses
Business Search - 14 Million verified businesses
Data:
Median household income ($)
Median household income (% change since 2000)
Household income diversity
Ratio of average income to average house value (%)
Ratio of average income to average rent
Median household income ($) - White
Median household income ($) - Black or African American
Median household income ($) - Asian
Median household income ($) - Hispanic or Latino
Median household income ($) - American Indian and Alaska Native
Median household income ($) - Multirace
Median household income ($) - Other Race
Median household income for houses/condos with a mortgage ($)
Median household income for apartments without a mortgage ($)
Races - White alone (%)
Races - White alone (% change since 2000)
Races - Black alone (%)
Races - Black alone (% change since 2000)
Races - American Indian alone (%)
Races - American Indian alone (% change since 2000)
Races - Asian alone (%)
Races - Asian alone (% change since 2000)
Races - Hispanic (%)
Races - Hispanic (% change since 2000)
Races - Native Hawaiian and Other Pacific Islander alone (%)
Races - Native Hawaiian and Other Pacific Islander alone (% change since 2000)
Races - Two or more races (%)
Races - Two or more races (% change since 2000)
Races - Other race alone (%)
Races - Other race alone (% change since 2000)
Racial diversity
Unemployment (%)
Unemployment (% change since 2000)
Unemployment (%) - White
Unemployment (%) - Black or African American
Unemployment (%) - Asian
Unemployment (%) - Hispanic or Latino
Unemployment (%) - American Indian and Alaska Native
Unemployment (%) - Multirace
Unemployment (%) - Other Race
Population density (people per square mile)
Population - Males (%)
Population - Females (%)
Population - Males (%) - White
Population - Males (%) - Black or African American
Population - Males (%) - Asian
Population - Males (%) - Hispanic or Latino
Population - Males (%) - American Indian and Alaska Native
Population - Males (%) - Multirace
Population - Males (%) - Other Race
Population - Females (%) - White
Population - Females (%) - Black or African American
Population - Females (%) - Asian
Population - Females (%) - Hispanic or Latino
Population - Females (%) - American Indian and Alaska Native
Population - Females (%) - Multirace
Population - Females (%) - Other Race
Coronavirus confirmed cases (Apr 25, 2024)
Deaths caused by coronavirus (Apr 25, 2024)
Coronavirus confirmed cases (per 100k population) (Apr 25, 2024)
Deaths caused by coronavirus (per 100k population) (Apr 25, 2024)
Daily increase in number of cases (Apr 25, 2024)
Weekly increase in number of cases (Apr 25, 2024)
Cases doubled (in days) (Apr 25, 2024)
Hospitalized patients (Apr 18, 2022)
Negative test results (Apr 18, 2022)
Total test results (Apr 18, 2022)
COVID Vaccine doses distributed (per 100k population) (Sep 19, 2023)
COVID Vaccine doses administered (per 100k population) (Sep 19, 2023)
COVID Vaccine doses distributed (Sep 19, 2023)
COVID Vaccine doses administered (Sep 19, 2023)
Likely homosexual households (%)
Likely homosexual households (% change since 2000)
Likely homosexual households - Lesbian couples (%)
Likely homosexual households - Lesbian couples (% change since 2000)
Likely homosexual households - Gay men (%)
Likely homosexual households - Gay men (% change since 2000)
Cost of living index
Median gross rent ($)
Median contract rent ($)
Median monthly housing costs ($)
Median house or condo value ($)
Median house or condo value ($ change since 2000)
Mean house or condo value by units in structure - 1, detached ($)
Mean house or condo value by units in structure - 1, attached ($)
Mean house or condo value by units in structure - 2 ($)
Mean house or condo value by units in structure by units in structure - 3 or 4 ($)
Mean house or condo value by units in structure - 5 or more ($)
Mean house or condo value by units in structure - Boat, RV, van, etc. ($)
Mean house or condo value by units in structure - Mobile home ($)
Median house or condo value ($) - White
Median house or condo value ($) - Black or African American
Median house or condo value ($) - Asian
Median house or condo value ($) - Hispanic or Latino
Median house or condo value ($) - American Indian and Alaska Native
Median house or condo value ($) - Multirace
Median house or condo value ($) - Other Race
Median resident age
Resident age diversity
Median resident age - Males
Median resident age - Females
Median resident age - White
Median resident age - Black or African American
Median resident age - Asian
Median resident age - Hispanic or Latino
Median resident age - American Indian and Alaska Native
Median resident age - Multirace
Median resident age - Other Race
Median resident age - Males - White
Median resident age - Males - Black or African American
Median resident age - Males - Asian
Median resident age - Males - Hispanic or Latino
Median resident age - Males - American Indian and Alaska Native
Median resident age - Males - Multirace
Median resident age - Males - Other Race
Median resident age - Females - White
Median resident age - Females - Black or African American
Median resident age - Females - Asian
Median resident age - Females - Hispanic or Latino
Median resident age - Females - American Indian and Alaska Native
Median resident age - Females - Multirace
Median resident age - Females - Other Race
Commute - mean travel time to work (minutes)
Travel time to work - Less than 5 minutes (%)
Travel time to work - Less than 5 minutes (% change since 2000)
Travel time to work - 5 to 9 minutes (%)
Travel time to work - 5 to 9 minutes (% change since 2000)
Travel time to work - 10 to 19 minutes (%)
Travel time to work - 10 to 19 minutes (% change since 2000)
Travel time to work - 20 to 29 minutes (%)
Travel time to work - 20 to 29 minutes (% change since 2000)
Travel time to work - 30 to 39 minutes (%)
Travel time to work - 30 to 39 minutes (% change since 2000)
Travel time to work - 40 to 59 minutes (%)
Travel time to work - 40 to 59 minutes (% change since 2000)
Travel time to work - 60 to 89 minutes (%)
Travel time to work - 60 to 89 minutes (% change since 2000)
Travel time to work - 90 or more minutes (%)
Travel time to work - 90 or more minutes (% change since 2000)
Marital status - Never married (%)
Marital status - Now married (%)
Marital status - Separated (%)
Marital status - Widowed (%)
Marital status - Divorced (%)
Median family income ($)
Median family income (% change since 2000)
Median non-family income ($)
Median non-family income (% change since 2000)
Median per capita income ($)
Median per capita income (% change since 2000)
Median family income ($) - White
Median family income ($) - Black or African American
Median family income ($) - Asian
Median family income ($) - Hispanic or Latino
Median family income ($) - American Indian and Alaska Native
Median family income ($) - Multirace
Median family income ($) - Other Race
Median year house/condo built
Median year apartment built
Year house built - Built 2005 or later (%)
Year house built - Built 2000 to 2004 (%)
Year house built - Built 1990 to 1999 (%)
Year house built - Built 1980 to 1989 (%)
Year house built - Built 1970 to 1979 (%)
Year house built - Built 1960 to 1969 (%)
Year house built - Built 1950 to 1959 (%)
Year house built - Built 1940 to 1949 (%)
Year house built - Built 1939 or earlier (%)
Average household size
Household density (households per square mile)
Average household size - White
Average household size - Black or African American
Average household size - Asian
Average household size - Hispanic or Latino
Average household size - American Indian and Alaska Native
Average household size - Multirace
Average household size - Other Race
Occupied housing units (%)
Vacant housing units (%)
Owner occupied housing units (%)
Renter occupied housing units (%)
Vacancy status - For rent (%)
Vacancy status - For sale only (%)
Vacancy status - Rented or sold, not occupied (%)
Vacancy status - For seasonal, recreational, or occasional use (%)
Vacancy status - For migrant workers (%)
Vacancy status - Other vacant (%)
Residents with income below the poverty level (%)
Residents with income below 50% of the poverty level (%)
Children below poverty level (%)
Poor families by family type - Married-couple family (%)
Poor families by family type - Male, no wife present (%)
Poor families by family type - Female, no husband present (%)
Poverty status for native-born residents (%)
Poverty status for foreign-born residents (%)
Poverty among high school graduates not in families (%)
Poverty among people who did not graduate high school not in families (%)
Residents with income below the poverty level (%) - White
Residents with income below the poverty level (%) - Black or African American
Residents with income below the poverty level (%) - Asian
Residents with income below the poverty level (%) - Hispanic or Latino
Residents with income below the poverty level (%) - American Indian and Alaska Native
Residents with income below the poverty level (%) - Multirace
Residents with income below the poverty level (%) - Other Race
Air pollution - Air Quality Index (AQI)
Air pollution - CO
Air pollution - NO2
Air pollution - SO2
Air pollution - Ozone
Air pollution - PM10
Air pollution - PM25
Air pollution - Pb
Crime - Murders per 100,000 population
Crime - Rapes per 100,000 population
Crime - Robberies per 100,000 population
Crime - Assaults per 100,000 population
Crime - Burglaries per 100,000 population
Crime - Thefts per 100,000 population
Crime - Auto thefts per 100,000 population
Crime - Arson per 100,000 population
Crime - City-data.com crime index
Crime - Violent crime index
Crime - Property crime index
Crime - Murders per 100,000 population (5 year average)
Crime - Rapes per 100,000 population (5 year average)
Crime - Robberies per 100,000 population (5 year average)
Crime - Assaults per 100,000 population (5 year average)
Crime - Burglaries per 100,000 population (5 year average)
Crime - Thefts per 100,000 population (5 year average)
Crime - Auto thefts per 100,000 population (5 year average)
Crime - Arson per 100,000 population (5 year average)
Crime - City-data.com crime index (5 year average)
Crime - Violent crime index (5 year average)
Crime - Property crime index (5 year average)
1996 Presidential Elections Results (%) - Democratic Party (Clinton)
1996 Presidential Elections Results (%) - Republican Party (Dole)
1996 Presidential Elections Results (%) - Other
2000 Presidential Elections Results (%) - Democratic Party (Gore)
2000 Presidential Elections Results (%) - Republican Party (Bush)
2000 Presidential Elections Results (%) - Other
2004 Presidential Elections Results (%) - Democratic Party (Kerry)
2004 Presidential Elections Results (%) - Republican Party (Bush)
2004 Presidential Elections Results (%) - Other
2008 Presidential Elections Results (%) - Democratic Party (Obama)
2008 Presidential Elections Results (%) - Republican Party (McCain)
2008 Presidential Elections Results (%) - Other
2012 Presidential Elections Results (%) - Democratic Party (Obama)
2012 Presidential Elections Results (%) - Republican Party (Romney)
2012 Presidential Elections Results (%) - Other
2016 Presidential Elections Results (%) - Democratic Party (Clinton)
2016 Presidential Elections Results (%) - Republican Party (Trump)
2016 Presidential Elections Results (%) - Other
2020 Presidential Elections Results (%) - Democratic Party (Biden)
2020 Presidential Elections Results (%) - Republican Party (Trump)
2020 Presidential Elections Results (%) - Other
Ancestries Reported - Arab (%)
Ancestries Reported - Czech (%)
Ancestries Reported - Danish (%)
Ancestries Reported - Dutch (%)
Ancestries Reported - English (%)
Ancestries Reported - French (%)
Ancestries Reported - French Canadian (%)
Ancestries Reported - German (%)
Ancestries Reported - Greek (%)
Ancestries Reported - Hungarian (%)
Ancestries Reported - Irish (%)
Ancestries Reported - Italian (%)
Ancestries Reported - Lithuanian (%)
Ancestries Reported - Norwegian (%)
Ancestries Reported - Polish (%)
Ancestries Reported - Portuguese (%)
Ancestries Reported - Russian (%)
Ancestries Reported - Scotch-Irish (%)
Ancestries Reported - Scottish (%)
Ancestries Reported - Slovak (%)
Ancestries Reported - Subsaharan African (%)
Ancestries Reported - Swedish (%)
Ancestries Reported - Swiss (%)
Ancestries Reported - Ukrainian (%)
Ancestries Reported - United States (%)
Ancestries Reported - Welsh (%)
Ancestries Reported - West Indian (%)
Ancestries Reported - Other (%)
Educational Attainment - No schooling completed (%)
Educational Attainment - Less than high school (%)
Educational Attainment - High school or equivalent (%)
Educational Attainment - Less than 1 year of college (%)
Educational Attainment - 1 or more years of college (%)
Educational Attainment - Associate degree (%)
Educational Attainment - Bachelor's degree (%)
Educational Attainment - Master's degree (%)
Educational Attainment - Professional school degree (%)
Educational Attainment - Doctorate degree (%)
School Enrollment - Nursery, preschool (%)
School Enrollment - Kindergarten (%)
School Enrollment - Grade 1 to 4 (%)
School Enrollment - Grade 5 to 8 (%)
School Enrollment - Grade 9 to 12 (%)
School Enrollment - College undergrad (%)
School Enrollment - Graduate or professional (%)
School Enrollment - Not enrolled in school (%)
School enrollment - Public schools (%)
School enrollment - Private schools (%)
School enrollment - Not enrolled (%)
Median number of rooms in houses and condos
Median number of rooms in apartments
Housing units lacking complete plumbing facilities (%)
Housing units lacking complete kitchen facilities (%)
Density of houses
Urban houses (%)
Rural houses (%)
Households with people 60 years and over (%)
Households with people 65 years and over (%)
Households with people 75 years and over (%)
Households with one or more nonrelatives (%)
Households with no nonrelatives (%)
Population in households (%)
Family households (%)
Nonfamily households (%)
Population in families (%)
Family households with own children (%)
Median number of bedrooms in owner occupied houses
Mean number of bedrooms in owner occupied houses
Median number of bedrooms in renter occupied houses
Mean number of bedrooms in renter occupied houses
Median number of vehichles in owner occupied houses
Mean number of vehichles in owner occupied houses
Median number of vehichles in renter occupied houses
Mean number of vehichles in renter occupied houses
Mortgage status - with mortgage (%)
Mortgage status - with second mortgage (%)
Mortgage status - with home equity loan (%)
Mortgage status - with both second mortgage and home equity loan (%)
Mortgage status - without a mortgage (%)
Average family size
Average family size - White
Average family size - Black or African American
Average family size - Asian
Average family size - Hispanic or Latino
Average family size - American Indian and Alaska Native
Average family size - Multirace
Average family size - Other Race
Geographical mobility - Same house 1 year ago (%)
Geographical mobility - Moved within same county (%)
Geographical mobility - Moved from different county within same state (%)
Geographical mobility - Moved from different state (%)
Geographical mobility - Moved from abroad (%)
Place of birth - Born in state of residence (%)
Place of birth - Born in other state (%)
Place of birth - Native, outside of US (%)
Place of birth - Foreign born (%)
Housing units in structures - 1, detached (%)
Housing units in structures - 1, attached (%)
Housing units in structures - 2 (%)
Housing units in structures - 3 or 4 (%)
Housing units in structures - 5 to 9 (%)
Housing units in structures - 10 to 19 (%)
Housing units in structures - 20 to 49 (%)
Housing units in structures - 50 or more (%)
Housing units in structures - Mobile home (%)
Housing units in structures - Boat, RV, van, etc. (%)
House/condo owner moved in on average (years ago)
Renter moved in on average (years ago)
Year householder moved into unit - Moved in 1999 to March 2000 (%)
Year householder moved into unit - Moved in 1995 to 1998 (%)
Year householder moved into unit - Moved in 1990 to 1994 (%)
Year householder moved into unit - Moved in 1980 to 1989 (%)
Year householder moved into unit - Moved in 1970 to 1979 (%)
Year householder moved into unit - Moved in 1969 or earlier (%)
Means of transportation to work - Drove car alone (%)
Means of transportation to work - Carpooled (%)
Means of transportation to work - Public transportation (%)
Means of transportation to work - Bus or trolley bus (%)
Means of transportation to work - Streetcar or trolley car (%)
Means of transportation to work - Subway or elevated (%)
Means of transportation to work - Railroad (%)
Means of transportation to work - Ferryboat (%)
Means of transportation to work - Taxicab (%)
Means of transportation to work - Motorcycle (%)
Means of transportation to work - Bicycle (%)
Means of transportation to work - Walked (%)
Means of transportation to work - Other means (%)
Working at home (%)
Industry diversity
Most Common Industries - Agriculture, forestry, fishing and hunting, and mining (%)
Most Common Industries - Agriculture, forestry, fishing and hunting (%)
Most Common Industries - Mining, quarrying, and oil and gas extraction (%)
Most Common Industries - Construction (%)
Most Common Industries - Manufacturing (%)
Most Common Industries - Wholesale trade (%)
Most Common Industries - Retail trade (%)
Most Common Industries - Transportation and warehousing, and utilities (%)
Most Common Industries - Transportation and warehousing (%)
Most Common Industries - Utilities (%)
Most Common Industries - Information (%)
Most Common Industries - Finance and insurance, and real estate and rental and leasing (%)
Most Common Industries - Finance and insurance (%)
Most Common Industries - Real estate and rental and leasing (%)
Most Common Industries - Professional, scientific, and management, and administrative and waste management services (%)
Most Common Industries - Professional, scientific, and technical services (%)
Most Common Industries - Management of companies and enterprises (%)
Most Common Industries - Administrative and support and waste management services (%)
Most Common Industries - Educational services, and health care and social assistance (%)
Most Common Industries - Educational services (%)
Most Common Industries - Health care and social assistance (%)
Most Common Industries - Arts, entertainment, and recreation, and accommodation and food services (%)
Most Common Industries - Arts, entertainment, and recreation (%)
Most Common Industries - Accommodation and food services (%)
Most Common Industries - Other services, except public administration (%)
Most Common Industries - Public administration (%)
Occupation diversity
Most Common Occupations - Management, business, science, and arts occupations (%)
Most Common Occupations - Management, business, and financial occupations (%)
Most Common Occupations - Management occupations (%)
Most Common Occupations - Business and financial operations occupations (%)
Most Common Occupations - Computer, engineering, and science occupations (%)
Most Common Occupations - Computer and mathematical occupations (%)
Most Common Occupations - Architecture and engineering occupations (%)
Most Common Occupations - Life, physical, and social science occupations (%)
Most Common Occupations - Education, legal, community service, arts, and media occupations (%)
Most Common Occupations - Community and social service occupations (%)
Most Common Occupations - Legal occupations (%)
Most Common Occupations - Education, training, and library occupations (%)
Most Common Occupations - Arts, design, entertainment, sports, and media occupations (%)
Most Common Occupations - Healthcare practitioners and technical occupations (%)
Most Common Occupations - Health diagnosing and treating practitioners and other technical occupations (%)
Most Common Occupations - Health technologists and technicians (%)
Most Common Occupations - Service occupations (%)
Most Common Occupations - Healthcare support occupations (%)
Most Common Occupations - Protective service occupations (%)
Most Common Occupations - Fire fighting and prevention, and other protective service workers including supervisors (%)
Most Common Occupations - Law enforcement workers including supervisors (%)
Most Common Occupations - Food preparation and serving related occupations (%)
Most Common Occupations - Building and grounds cleaning and maintenance occupations (%)
Most Common Occupations - Personal care and service occupations (%)
Most Common Occupations - Sales and office occupations (%)
Most Common Occupations - Sales and related occupations (%)
Most Common Occupations - Office and administrative support occupations (%)
Most Common Occupations - Natural resources, construction, and maintenance occupations (%)
Most Common Occupations - Farming, fishing, and forestry occupations (%)
Most Common Occupations - Construction and extraction occupations (%)
Most Common Occupations - Installation, maintenance, and repair occupations (%)
Most Common Occupations - Production, transportation, and material moving occupations (%)
Most Common Occupations - Production occupations (%)
Most Common Occupations - Transportation occupations (%)
Most Common Occupations - Material moving occupations (%)
People in Group quarters - Institutionalized population (%)
People in Group quarters - Correctional institutions (%)
People in Group quarters - Federal prisons and detention centers (%)
People in Group quarters - Halfway houses (%)
People in Group quarters - Local jails and other confinement facilities (including police lockups) (%)
People in Group quarters - Military disciplinary barracks (%)
People in Group quarters - State prisons (%)
People in Group quarters - Other types of correctional institutions (%)
People in Group quarters - Nursing homes (%)
People in Group quarters - Hospitals/wards, hospices, and schools for the handicapped (%)
People in Group quarters - Hospitals/wards and hospices for chronically ill (%)
People in Group quarters - Hospices or homes for chronically ill (%)
People in Group quarters - Military hospitals or wards for chronically ill (%)
People in Group quarters - Other hospitals or wards for chronically ill (%)
People in Group quarters - Hospitals or wards for drug/alcohol abuse (%)
People in Group quarters - Mental (Psychiatric) hospitals or wards (%)
People in Group quarters - Schools, hospitals, or wards for the mentally retarded (%)
People in Group quarters - Schools, hospitals, or wards for the physically handicapped (%)
People in Group quarters - Institutions for the deaf (%)
People in Group quarters - Institutions for the blind (%)
People in Group quarters - Orthopedic wards and institutions for the physically handicapped (%)
People in Group quarters - Wards in general hospitals for patients who have no usual home elsewhere (%)
People in Group quarters - Wards in military hospitals for patients who have no usual home elsewhere (%)
People in Group quarters - Juvenile institutions (%)
People in Group quarters - Long-term care (%)
People in Group quarters - Homes for abused, dependent, and neglected children (%)
People in Group quarters - Residential treatment centers for emotionally disturbed children (%)
People in Group quarters - Training schools for juvenile delinquents (%)
People in Group quarters - Short-term care, detention or diagnostic centers for delinquent children (%)
People in Group quarters - Type of juvenile institution unknown (%)
People in Group quarters - Noninstitutionalized population (%)
People in Group quarters - College dormitories (includes college quarters off campus) (%)
People in Group quarters - Military quarters (%)
People in Group quarters - On base (%)
People in Group quarters - Barracks, unaccompanied personnel housing (UPH), (Enlisted/Officer), ;and similar group living quarters for military personnel (%)
People in Group quarters - Transient quarters for temporary residents (%)
People in Group quarters - Military ships (%)
People in Group quarters - Group homes (%)
People in Group quarters - Homes or halfway houses for drug/alcohol abuse (%)
People in Group quarters - Homes for the mentally ill (%)
People in Group quarters - Homes for the mentally retarded (%)
People in Group quarters - Homes for the physically handicapped (%)
People in Group quarters - Other group homes (%)
People in Group quarters - Religious group quarters (%)
People in Group quarters - Dormitories (%)
People in Group quarters - Agriculture workers' dormitories on farms (%)
People in Group quarters - Job Corps and vocational training facilities (%)
People in Group quarters - Other workers' dormitories (%)
People in Group quarters - Crews of maritime vessels (%)
People in Group quarters - Other nonhousehold living situations (%)
People in Group quarters - Other noninstitutional group quarters (%)
Residents speaking English at home (%)
Residents speaking English at home - Born in the United States (%)
Residents speaking English at home - Native, born elsewhere (%)
Residents speaking English at home - Foreign born (%)
Residents speaking Spanish at home (%)
Residents speaking Spanish at home - Born in the United States (%)
Residents speaking Spanish at home - Native, born elsewhere (%)
Residents speaking Spanish at home - Foreign born (%)
Residents speaking other language at home (%)
Residents speaking other language at home - Born in the United States (%)
Residents speaking other language at home - Native, born elsewhere (%)
Residents speaking other language at home - Foreign born (%)
Class of Workers - Employee of private company (%)
Class of Workers - Self-employed in own incorporated business (%)
Class of Workers - Private not-for-profit wage and salary workers (%)
Class of Workers - Local government workers (%)
Class of Workers - State government workers (%)
Class of Workers - Federal government workers (%)
Class of Workers - Self-employed workers in own not incorporated business and Unpaid family workers (%)
House heating fuel used in houses and condos - Utility gas (%)
House heating fuel used in houses and condos - Bottled, tank, or LP gas (%)
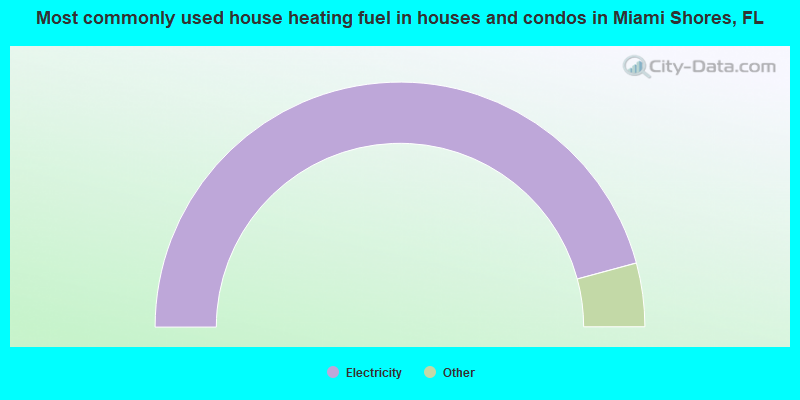
House heating fuel used in houses and condos - Electricity (%)
House heating fuel used in houses and condos - Fuel oil, kerosene, etc. (%)
House heating fuel used in houses and condos - Coal or coke (%)
House heating fuel used in houses and condos - Wood (%)
House heating fuel used in houses and condos - Solar energy (%)
House heating fuel used in houses and condos - Other fuel (%)
House heating fuel used in houses and condos - No fuel used (%)
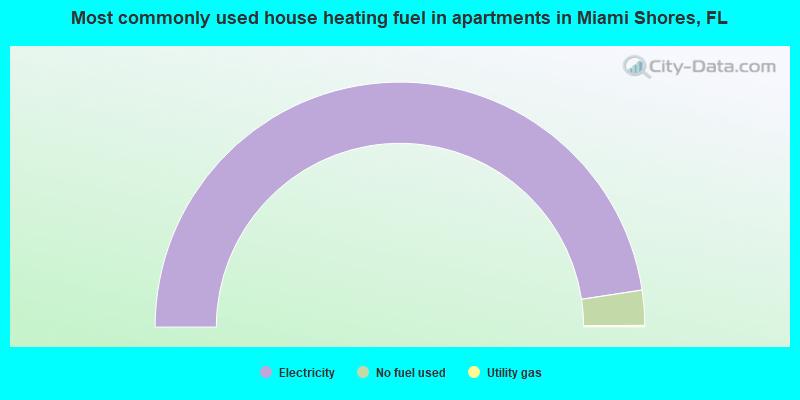
House heating fuel used in apartments - Utility gas (%)
House heating fuel used in apartments - Bottled, tank, or LP gas (%)
House heating fuel used in apartments - Electricity (%)
House heating fuel used in apartments - Fuel oil, kerosene, etc. (%)
House heating fuel used in apartments - Coal or coke (%)
House heating fuel used in apartments - Wood (%)
House heating fuel used in apartments - Solar energy (%)
House heating fuel used in apartments - Other fuel (%)
House heating fuel used in apartments - No fuel used (%)
Armed forces status - In Armed Forces (%)
Armed forces status - Civilian (%)
Armed forces status - Civilian - Veteran (%)
Armed forces status - Civilian - Nonveteran (%)
Fatal accidents locations in years 2005-2021
Fatal accidents locations in 2005
Fatal accidents locations in 2006
Fatal accidents locations in 2007
Fatal accidents locations in 2008
Fatal accidents locations in 2009
Fatal accidents locations in 2010
Fatal accidents locations in 2011
Fatal accidents locations in 2012
Fatal accidents locations in 2013
Fatal accidents locations in 2014
Fatal accidents locations in 2015
Fatal accidents locations in 2016
Fatal accidents locations in 2017
Fatal accidents locations in 2018
Fatal accidents locations in 2019
Fatal accidents locations in 2020
Fatal accidents locations in 2021
Alcohol use - People drinking some alcohol every month (%)
Alcohol use - People not drinking at all (%)
Alcohol use - Average days/month drinking alcohol
Alcohol use - Average drinks/week
Alcohol use - Average days/year people drink much
Audiometry - Average condition of hearing (%)
Audiometry - People that can hear a whisper from across a quiet room (%)
Audiometry - People that can hear normal voice from across a quiet room (%)
Audiometry - Ears ringing, roaring, buzzing (%)
Audiometry - Had a job exposure to loud noise (%)
Audiometry - Had off-work exposure to loud noise (%)
Blood Pressure & Cholesterol - Has high blood pressure (%)
Blood Pressure & Cholesterol - Checking blood pressure at home (%)
Blood Pressure & Cholesterol - Frequently checking blood cholesterol (%)
Blood Pressure & Cholesterol - Has high cholesterol level (%)
Consumer Behavior - Money monthly spent on food at supermarket/grocery store
Consumer Behavior - Money monthly spent on food at other stores
Consumer Behavior - Money monthly spent on eating out
Consumer Behavior - Money monthly spent on carryout/delivered foods
Consumer Behavior - Income spent on food at supermarket/grocery store (%)
Consumer Behavior - Income spent on food at other stores (%)
Consumer Behavior - Income spent on eating out (%)
Consumer Behavior - Income spent on carryout/delivered foods (%)
Current Health Status - General health condition (%)
Current Health Status - Blood donors (%)
Current Health Status - Has blood ever tested for HIV virus (%)
Current Health Status - Left-handed people (%)
Dermatology - People using sunscreen (%)
Diabetes - Diabetics (%)
Diabetes - Had a blood test for high blood sugar (%)
Diabetes - People taking insulin (%)
Diet Behavior & Nutrition - Diet health (%)
Diet Behavior & Nutrition - Milk product consumption (# of products/month)
Diet Behavior & Nutrition - Meals not home prepared (#/week)
Diet Behavior & Nutrition - Meals from fast food or pizza place (#/week)
Diet Behavior & Nutrition - Ready-to-eat foods (#/month)
Diet Behavior & Nutrition - Frozen meals/pizza (#/month)
Drug Use - People that ever used marijuana or hashish (%)
Drug Use - Ever used hard drugs (%)
Drug Use - Ever used any form of cocaine (%)
Drug Use - Ever used heroin (%)
Drug Use - Ever used methamphetamine (%)
Health Insurance - People covered by health insurance (%)
Kidney Conditions-Urology - Avg. # of times urinating at night
Medical Conditions - People with asthma (%)
Medical Conditions - People with anemia (%)
Medical Conditions - People with psoriasis (%)
Medical Conditions - People with overweight (%)
Medical Conditions - Elderly people having difficulties in thinking or remembering (%)
Medical Conditions - People who ever received blood transfusion (%)
Medical Conditions - People having trouble seeing even with glass/contacts (%)
Medical Conditions - People with arthritis (%)
Medical Conditions - People with gout (%)
Medical Conditions - People with congestive heart failure (%)
Medical Conditions - People with coronary heart disease (%)
Medical Conditions - People with angina pectoris (%)
Medical Conditions - People who ever had heart attack (%)
Medical Conditions - People who ever had stroke (%)
Medical Conditions - People with emphysema (%)
Medical Conditions - People with thyroid problem (%)
Medical Conditions - People with chronic bronchitis (%)
Medical Conditions - People with any liver condition (%)
Medical Conditions - People who ever had cancer or malignancy (%)
Mental Health - People who have little interest in doing things (%)
Mental Health - People feeling down, depressed, or hopeless (%)
Mental Health - People who have trouble sleeping or sleeping too much (%)
Mental Health - People feeling tired or having little energy (%)
Mental Health - People with poor appetite or overeating (%)
Mental Health - People feeling bad about themself (%)
Mental Health - People who have trouble concentrating on things (%)
Mental Health - People moving or speaking slowly or too fast (%)
Mental Health - People having thoughts they would be better off dead (%)
Oral Health - Average years since last visit a dentist
Oral Health - People embarrassed because of mouth (%)
Oral Health - People with gum disease (%)
Oral Health - General health of teeth and gums (%)
Oral Health - Average days a week using dental floss/device
Oral Health - Average days a week using mouthwash for dental problem
Oral Health - Average number of teeth
Pesticide Use - Households using pesticides to control insects (%)
Pesticide Use - Households using pesticides to kill weeds (%)
Physical Activity - People doing vigorous-intensity work activities (%)
Physical Activity - People doing moderate-intensity work activities (%)
Physical Activity - People walking or bicycling (%)
Physical Activity - People doing vigorous-intensity recreational activities (%)
Physical Activity - People doing moderate-intensity recreational activities (%)
Physical Activity - Average hours a day doing sedentary activities
Physical Activity - Average hours a day watching TV or videos
Physical Activity - Average hours a day using computer
Physical Functioning - People having limitations keeping them from working (%)
Physical Functioning - People limited in amount of work they can do (%)
Physical Functioning - People that need special equipment to walk (%)
Physical Functioning - People experiencing confusion/memory problems (%)
Physical Functioning - People requiring special healthcare equipment (%)
Prescription Medications - Average number of prescription medicines taking
Preventive Aspirin Use - Adults 40+ taking low-dose aspirin (%)
Reproductive Health - Vaginal deliveries (%)
Reproductive Health - Cesarean deliveries (%)
Reproductive Health - Deliveries resulted in a live birth (%)
Reproductive Health - Pregnancies resulted in a delivery (%)
Reproductive Health - Women breastfeeding newborns (%)
Reproductive Health - Women that had a hysterectomy (%)
Reproductive Health - Women that had both ovaries removed (%)
Reproductive Health - Women that have ever taken birth control pills (%)
Reproductive Health - Women taking birth control pills (%)
Reproductive Health - Women that have ever used Depo-Provera or injectables (%)
Reproductive Health - Women that have ever used female hormones (%)
Sexual Behavior - People 18+ that ever had sex (vaginal, anal, or oral) (%)
Sexual Behavior - Males 18+ that ever had vaginal sex with a woman (%)
Sexual Behavior - Males 18+ that ever performed oral sex on a woman (%)
Sexual Behavior - Males 18+ that ever had anal sex with a woman (%)
Sexual Behavior - Males 18+ that ever had any sex with a man (%)
Sexual Behavior - Females 18+ that ever had vaginal sex with a man (%)
Sexual Behavior - Females 18+ that ever performed oral sex on a man (%)
Sexual Behavior - Females 18+ that ever had anal sex with a man (%)
Sexual Behavior - Females 18+ that ever had any kind of sex with a woman (%)
Sexual Behavior - Average age people first had sex
Sexual Behavior - Average number of female sex partners in lifetime (males 18+)
Sexual Behavior - Average number of female vaginal sex partners in lifetime (males 18+)
Sexual Behavior - Average age people first performed oral sex on a woman (18+)
Sexual Behavior - Average number of woman performed oral sex on in lifetime (18+)
Sexual Behavior - Average number of male sex partners in lifetime (males 18+)
Sexual Behavior - Average number of male anal sex partners in lifetime (males 18+)
Sexual Behavior - Average age people first performed oral sex on a man (18+)
Sexual Behavior - Average number of male oral sex partners in lifetime (18+)
Sexual Behavior - People using protection when performing oral sex (%)
Sexual Behavior - Average number of times people have vaginal or anal sex a year
Sexual Behavior - People having sex without condom (%)
Sexual Behavior - Average number of male sex partners in lifetime (females 18+)
Sexual Behavior - Average number of male vaginal sex partners in lifetime (females 18+)
Sexual Behavior - Average number of female sex partners in lifetime (females 18+)
Sexual Behavior - Circumcised males 18+ (%)
Sleep Disorders - Average hours sleeping at night
Sleep Disorders - People that has trouble sleeping (%)
Smoking-Cigarette Use - People smoking cigarettes (%)
Taste & Smell - People 40+ having problems with smell (%)
Taste & Smell - People 40+ having problems with taste (%)
Taste & Smell - People 40+ that ever had wisdom teeth removed (%)
Taste & Smell - People 40+ that ever had tonsils teeth removed (%)
Taste & Smell - People 40+ that ever had a loss of consciousness because of a head injury (%)
Taste & Smell - People 40+ that ever had a broken nose or other serious injury to face or skull (%)
Taste & Smell - People 40+ that ever had two or more sinus infections (%)
Weight - Average height (inches)
Weight - Average weight (pounds)
Weight - Average BMI
Weight - People that are obese (%)
Weight - People that ever were obese (%)
Weight - People trying to lose weight (%)
According to our research of Florida and other state lists, there were 2 registered sex offenders living in Miami Shores, Florida as of April 25, 2024 . The ratio of all residents to sex offenders in Miami Shores is 5,484 to 1.The ratio of registered sex offenders to all residents in this city is much lower than the state average.
Officers per 1,000 residents here:
3.33Florida average:
2.33
Latest news from Miami Shores, FL collected exclusively by city-data.com from local newspapers, TV, and radio stations
Miami Shores, FL City Guides: Ancestries: Haitian (13.0%), American (9.1%), Italian (6.5%), English (4.7%), German (2.3%), Scottish (2.0%).
Current Local Time:
Land area: 2.46 square miles.
Population density: 4,712 people per square mile (average).
3,332 residents are foreign born (22.4% Latin America , 3.0% Europe ).
This village:
28.8%Florida:
21.1%
Median real estate property taxes paid for housing units with mortgages in 2022: $7,675 (0.9%)Median real estate property taxes paid for housing units with no mortgage in 2022: $6,310 (0.8%)
Nearest city with pop. 50,000+: North Miami, FL
Nearest city with pop. 200,000+: Miami, FL
Nearest city with pop. 1,000,000+: Houston, TX
Nearest cities:
Latitude: 25.87 N, Longitude: 80.19 W
Daytime population change due to commuting: -840 (-7.3%)Workers who live and work in this village: 1,809 (32.9%)
Property values in Miami Shores, FL
Single-family new house construction building permits:
2022: 6 buildings , average cost: $256,2002021: 6 buildings , average cost: $717,1002020: 3 buildings , average cost: $440,2002019: 4 buildings , average cost: $505,9002018: 3 buildings , average cost: $932,7002017: 1 building , cost: $277,6002016: 2 buildings , average cost: $590,6002015: 1 building , cost: $1,007,3002014: 2 buildings , average cost: $588,6002013: 1 building , cost: $795,0002012: 2 buildings , average cost: $312,5002010: 1 building , cost: $183,3002009: 3 buildings , average cost: $183,3002008: 1 building , cost: $304,5002004: 1 building , cost: $289,0002003: 27 buildings , average cost: $98,9002002: 1 building , cost: $147,000Unemployment in December 2023:
Population change in the 1990s: +270 (+2.7%).
Most common occupations in Miami Shores, FL (%)
Both Males Females
Other management occupations, except farmers and farm managers (6.7%)
Other sales and related occupations, including supervisors (3.7%)
Sales representatives, services, wholesale and manufacturing (3.5%)
Secretaries and administrative assistants (3.4%)
Lawyers (3.3%)
Top executives (3.2%)
Retail sales workers, except cashiers (3.0%)
Other management occupations, except farmers and farm managers (7.6%)
Other sales and related occupations, including supervisors (4.9%)
Sales representatives, services, wholesale and manufacturing (4.4%)
Lawyers (4.1%)
Top executives (4.1%)
Retail sales workers, except cashiers (3.5%)
Building and grounds cleaning and maintenance occupations (2.9%)
Preschool, kindergarten, elementary, and middle school teachers (5.8%)
Other management occupations, except farmers and farm managers (5.7%)
Secretaries and administrative assistants (5.6%)
Registered nurses (5.6%)
Other office and administrative support workers, including supervisors (4.1%)
Nursing, psychiatric, and home health aides (4.1%)
Cashiers (2.7%)
Tornado activity:
Miami Shores-area historical tornado activity is below Florida state average. It is 34% smaller than the overall U.S. average.
On 6/17/1959, a category F3 (max. wind speeds 158-206 mph) tornado 1.5 miles away from the Miami Shores village center injured 77 people and caused between $500,000 and $5,000,000 in damages.
On 4/10/1956, a category F3 tornado 9.7 miles away from the village center injured 20 people and caused between $500,000 and $5,000,000 in damages.
Earthquake activity:
Miami Shores-area historical earthquake activity is significantly below Florida state average. It is 99% smaller than the overall U.S. average. On 9/10/2006 at 14:56:08, a magnitude 5.9 (5.9 MB, 5.5 MS, 5.8 MW, Class: Moderate, Intensity: VI - VII) earthquake occurred 401.1 miles away from the city center On 2/22/1992 at 04:21:34, a magnitude 3.2 (3.2 MB, Depth: 6.2 mi, Class: Light, Intensity: II - III) earthquake occurred 87.6 miles away from the city center On 6/23/2016 at 17:20:29, a magnitude 3.8 (3.8 ML) earthquake occurred 289.2 miles away from Miami Shores center On 7/16/2016 at 20:00:10, a magnitude 3.7 (3.7 MB) earthquake occurred 273.7 miles away from Miami Shores center On 9/21/2016 at 16:30:52, a magnitude 3.8 (3.8 ML) earthquake occurred 294.1 miles away from the city center On 9/4/2016 at 18:29:29, a magnitude 3.8 (3.8 ML) earthquake occurred 295.2 miles away from the city center Magnitude types: body-wave magnitude (MB), local magnitude (ML), surface-wave magnitude (MS), moment magnitude (MW) Natural disasters: The number of natural disasters in Miami-Dade County (10) is smaller than the US average (15).Major Disasters (Presidential) Declared: 5Emergencies Declared: 3Hurricanes: 7, Tropical Storms: 2, Tornado: 1, Other: 1 (Note: some incidents may be assigned to more than one category). Hospitals and medical centers in Miami Shores: FLORIDA DIALYSIS INSTITUTE (9999 NE 2ND AVE)
Other hospitals and medical centers near Miami Shores: SINAI PLAZA NURSING AND REHAB CENTER (Nursing Home, about 1 miles away; MIAMI, FL)
IC QUALITY HEALTH CORP (Home Health Center, about 2 miles away; MIAMI, FL)
MIAMI SHORES NURSING AND REHAB CENTER (Nursing Home, about 2 miles away; MIAMI, FL)
FRANCO NURSING AND REHABILITATION CENTER (Nursing Home, about 2 miles away; MIAMI, FL)
KATHERINE E AND MICHAEL J FRANCO NSG (Nursing Home, about 2 miles away; MIAMI, FL)
NORTH SHORE MEDICAL CENTER (about 2 miles away; MIAMI, FL)
CENTER FOR KIDNEY DISEASE (Dialysis Facility, about 2 miles away; MIAMI, FL)
Amtrak stations near Miami Shores: 5 miles: MIAMI (8303 N.W. 37TH AVE.) Services: ticket office, fully wheelchair accessible, enclosed waiting area, public restrooms, public payphones, vending machines, free short-term parking, call for car rental service, taxi stand, public transit connection.
9 miles: MIAMI INT'L AIRPORT (MIAMI, TRANSIT BUS LOADING AREA) - Bus Station 11 miles: HOLLYWOOD (3001 HOLLYWOOD BLVD.) Services: ticket office, partially wheelchair accessible, enclosed waiting area, public restrooms, public payphones, vending machines, free short-term parking, free long-term parking, taxi stand, public transit connection.
Colleges/universities with over 2000 students nearest to Miami Shores:
Barry University (about 2 miles; Miami, FL ; Full-time enrollment: 7,181)
Johnson & Wales University-North Miami (about 3 miles; North Miami, FL ; FT enrollment: 2,051)
AI Miami International University of Art and Design (about 6 miles; Miami, FL ; FT enrollment: 3,578)
St Thomas University (about 6 miles; Miami Gardens, FL ; FT enrollment: 2,096)
Miami Dade College (about 7 miles; Miami, FL ; FT enrollment: 53,787)
Florida National University-Main Campus (about 9 miles; Hialeah, FL ; FT enrollment: 4,106)
University of Miami (about 12 miles; Coral Gables, FL ; FT enrollment: 13,674)
Public high school in Miami Shores:
Private high school in Miami Shores: ACHIEVERS ACADEMY HIGH SCHOOL Students: 8, Location: 9717 NE 2ND AVE, Grades: 10-12)
Public elementary/middle school in Miami Shores:
Private elementary/middle schools in Miami Shores: ST ROSE OF LIMA SCHOOL Students: 532, Location: 425 NE 105TH ST, Grades: PK-8)
MIAMI SHORES PRESBYTERIAN CHURCH SCHOOL Students: 147, Location: 9405 PARK DR, Grades: PK-5)
MIAMI SHORES COMMUNITY CHURCH SCHOOL Students: 131, Location: 9823 NE 4TH AVE, Grades: PK-5)
MIAMI SHORES MONTESSORI SCHOOL Students: 44, Location: 577 NE 107TH ST, Grades: PK-3)
See full list of schools located in Miami Shores Library in Miami Shores: BROCKWAY MEMORIAL LIBRARY Operating income: $441,695; Location: 10021 NORTHEAST SECOND AVENUE; 57,117 books ; 16,000 e-books ; 1,829 audio materials ; 3,131 video materials ; 62 state licensed databases ; 169 print serial subscriptions )
User-submitted facts and corrections:
Second Zip code for Miami Shores in addition to 33138 is 33150 added by Mike
Notable locations in Miami Shores: (A) , Mainlands Golf Course (B) , Miami Shores Country Club (C) , Brockway Memorial Library (D) , Miami Shores City Hall (E) , Miami Shores Community Church Day Care Center (F) , Miami Shores Fire Station (G) , Miami Shores Police Station (H) , Miami Shores Presbyterian Church Day Care Center (I) , Monsignor William Barry Memorial Library (J) , Kids on the Move and More Day Care Center (K) , Advent Lutheran Church Child Care Center (L) , Miami - Dade County Fire Rescue Station 30 (M) , Miami Shores Mobile Crime Watch (N) . Display/hide their locations on the map
Churches in Miami Shores include: (A) , Bethany Church of Miami (B) , Saint James Catholic Church (C) , Mother of Christ Catholic Church (D) , Miami Shores Baptist Church (E) . Display/hide their locations on the map
Lake: (A) . Display/hide its location on the map
Park in Miami Shores: (1) . Display/hide its location on the map
Miami-Dade County has a predicted average indoor radon screening level between 2 and 4 pCi/L (pico curies per liter) - Moderate Potential Drinking water stations with addresses in Miami Shores and their reported violations in the past:
OUR LADY OF MERCY MAUSOLEUM (Population served: 50, Groundwater):
Past health violations:
MCL, Monthly (TCR) - In JAN-2014, Contaminant: Coliform. Follow-up actions: St Compliance achieved (2 times from JAN-17-2014 to FEB-05-2014)
Past monitoring violations:
Failure to Conduct Assessment Monitoring - Between OCT-2013 and DEC-2013, Contaminant: E. COLI. Follow-up actions: St Compliance achieved (JAN-17-2014)
One routine major monitoring violation
Serves NC, Population served: 25, Groundwater):
Past health violations:
MCL, Monthly (TCR) - In MAR-2014, Contaminant: Coliform. Follow-up actions: St Public Notif requested (MAR-13-2014), St Formal NOV issued (MAR-13-2014), St AO (w/o penalty) issued (MAR-13-2014), St Public Notif received (APR-16-2014), St Compliance achieved (APR-30-2014)
MCL, Monthly (TCR) - In FEB-2014, Contaminant: Coliform. Follow-up actions: St Public Notif requested (FEB-26-2014), St Formal NOV issued (FEB-26-2014), St AO (w/o penalty) issued (FEB-26-2014), St Public Notif received (APR-16-2014), St Compliance achieved (APR-30-2014)
MCL, Monthly (TCR) - Between JAN-2014 and MAR-2014, Contaminant: Coliform. Follow-up actions: St Public Notif requested (FEB-03-2014), St Formal NOV issued (FEB-03-2014), St AO (w/o penalty) issued (FEB-03-2014), St Public Notif received (APR-16-2014), St Compliance achieved (APR-30-2014)
MCL, Monthly (TCR) - Between OCT-2011 and DEC-2011, Contaminant: Coliform. Follow-up actions: St Public Notif requested (OCT-12-2011), St Formal NOV issued (OCT-12-2011), St AO (w/o penalty) issued (OCT-12-2011), St Public Notif received (NOV-01-2011), St Compliance achieved (MAR-31-2012)
Drinking water stations with addresses in Miami Shores that have no violations reported:
OUR LADY OF MERCY CHAPEL (Population served: 100, Primary Water Source Type: Groundwater)
Average household size: This village:
2.6 peopleFlorida:
2.5 people
Percentage of family households: This village:
65.3%Whole state:
65.2%
Percentage of households with unmarried partners: This village:
8.6%Whole state:
7.3%
Likely homosexual households (counted as self-reported same-sex unmarried-partner households)
Lesbian couples: 0.7% of all households Gay men: 3.6% of all households
884 people in college/university student housing in 2010people in workers' group living quarters and job corps centers in 2010people in college dormitories (includes college quarters off campus) in 2000people in religious group quarters in 2000
Banks with branches in Miami Shores (2011 data):
Bank of America, National Association: Miami Shores Branch at 9190 Biscayne Boulevard, branch established on 1982/07/12; Shores Village Branch at 9499 N.E. Second Avenue, branch established on 1950/02/07. Info updated 2009/11/18: Bank assets: $1,451,969.3 mil, Deposits: $1,077,176.8 mil, headquarters in Charlotte, NC, positive income , 5782 total offices , Holding Company: Bank Of America Corporation
Wells Fargo Bank, National Association: Miami Shores Branch at 9899 Northeast 2nd Avenue, branch established on 1986/06/30. Info updated 2011/04/05: Bank assets: $1,161,490.0 mil, Deposits: $905,653.0 mil, headquarters in Sioux Falls, SD, positive income , 6395 total offices , Holding Company: Wells Fargo & Company
JPMorgan Chase Bank, National Association: 9640 N E 2nd Avenue Branch at 9640 N.E. 2nd Avenue, branch established on 1933/12/01. Info updated 2011/11/10: Bank assets: $1,811,678.0 mil, Deposits: $1,190,738.0 mil, headquarters in Columbus, OH, positive income , International Specialization, 5577 total offices , Holding Company: Jpmorgan Chase & Co.
For population 15 years and over in Miami Shores:
Never married: 44.2%Now married: 46.0%Separated: 1.1%Widowed: 2.0%Divorced: 6.7% For population 25 years and over in Miami Shores:
High school or higher: 94.4%Bachelor's degree or higher: 61.4%Graduate or professional degree: 27.1%Unemployed: 12.9%Mean travel time to work (commute): 21.2 minutes
Education Gini index (Inequality in education) Here:
11.3Florida average:
12.2
Religion statistics for Miami Shores, FL (based on Miami-Dade County data)
Religion Adherents Congregations Catholic 544,449 65 Evangelical Protestant 271,814 922 Other 71,458 200 Black Protestant 60,074 94 Mainline Protestant 40,287 146 Orthodox 4,440 10 None 1,503,913 -
Source: Clifford Grammich, Kirk Hadaway, Richard Houseal, Dale E.Jones, Alexei Krindatch, Richie Stanley and Richard H.Taylor. 2012. 2010 U.S.Religion Census: Religious Congregations & Membership Study. Association of Statisticians of American Religious Bodies. Jones, Dale E., et al. 2002. Congregations and Membership in the United States 2000. Nashville, TN: Glenmary Research Center. Graphs represent county-level data
Food Environment Statistics: Number of grocery stores : 597Miami-Dade County :
2.51 / 10,000 pop.Florida :
2.04 / 10,000 pop.
Number of supercenters and club stores : 15Here :
0.06 / 10,000 pop.Florida :
0.11 / 10,000 pop.
Number of convenience stores (no gas) : 285This county :
1.20 / 10,000 pop.Florida :
1.28 / 10,000 pop.
Number of convenience stores (with gas) : 473Miami-Dade County :
1.98 / 10,000 pop.State :
3.04 / 10,000 pop.
Number of full-service restaurants : 1,610Miami-Dade County :
6.76 / 10,000 pop.Florida :
7.45 / 10,000 pop.
Adult diabetes rate : Miami-Dade County :
7.9%State :
9.2%
Low-income preschool obesity rate : This county :
15.8%Florida :
14.0%
Health and Nutrition: Healthy diet rate : This city:
53.5%State:
51.4%
Average overall health of teeth and gums : Miami Shores:
54.3%Florida:
49.4%
Average BMI : Miami Shores:
28.3Florida:
28.6
People feeling badly about themselves : Miami Shores:
17.8%Florida:
19.5%
People not drinking alcohol at all : This city:
9.1%Florida:
10.7%
Average hours sleeping at night : Overweight people : Miami Shores:
34.8%Florida:
34.7%
General health condition : This city:
60.2%State:
57.0%
Average condition of hearing : More about Health and Nutrition of Miami Shores, FL Residents
Local government employment and payroll (March 2022)
Function
Full-time employees
Monthly full-time payroll
Average yearly full-time wage
Part-time employees
Monthly part-time payroll
Police Protection - Officers
38 $348,812 $110,151 0 $0 Solid Waste Management
35 $143,393 $49,163 0 $0 Parks and Recreation
7 $38,458 $65,928 13 $14,034 Other Government Administration
5 $61,965 $148,716 3 $3,021 Police - Other
5 $20,606 $49,454 0 $0 Financial Administration
3 $24,362 $97,448 0 $0
Totals for Government
93 $637,595 $82,270 16 $17,055
Miami Shores government finances - Expenditure in 2017 (per resident):
Construction - Regular Highways: $206,000 ($17.81)
Current Operations - Police Protection: $6,310,000 ($545.42)
Natural Resources - Other: $2,980,000 ($257.58)Solid Waste Management: $2,529,000 ($218.60)Parks and Recreation: $2,297,000 ($198.55)General - Other: $1,607,000 ($138.91)Central Staff Services: $591,000 ($51.08)Protective Inspection and Regulation - Other: $585,000 ($50.57)Financial Administration: $573,000 ($49.53)Libraries: $428,000 ($37.00)Judicial and Legal Services: $338,000 ($29.22)Regular Highways: $156,000 ($13.48)Transit Utilities: $98,000 ($8.47)General - Interest on Debt: $169,000 ($14.61)
Other Capital Outlay - General - Other: $1,207,000 ($104.33)
Natural Resources - Other: $244,000 ($21.09)Police Protection: $235,000 ($20.31)Parks and Recreation: $35,000 ($3.03)Libraries: $10,000 ($0.86)Elementary and Secondary Education: $1,000 ($0.09)
Miami Shores government finances - Revenue in 2017 (per resident):
Charges - Solid Waste Management: $2,606,000 ($225.26)
Parks and Recreation: $1,359,000 ($117.47)Other: $395,000 ($34.14)Natural Resources - Other: $314,000 ($27.14)Regular Highways: $19,000 ($1.64)Sewerage: $8,000 ($0.69)Parking Facilities: $1,000 ($0.09)Local Intergovernmental - Other: $3,805,000 ($328.90)
General Local Government Support: $76,000 ($6.57)Highways: $7,000 ($0.61)Miscellaneous - Fines and Forfeits: $520,000 ($44.95)
Rents: $265,000 ($22.91)General Revenue - Other: $137,000 ($11.84)Interest Earnings: $83,000 ($7.17)Special Assessments: $52,000 ($4.49)Sale of Property: $37,000 ($3.20)Donations From Private Sources: $34,000 ($2.94)State Intergovernmental - General Local Government Support: $1,594,000 ($137.78)
Highways: $14,000 ($1.21)Tax - Property: $7,326,000 ($633.24)
Public Utilities Sales: $1,455,000 ($125.77)Other License: $1,201,000 ($103.81)Occupation and Business License - Other: $768,000 ($66.38)Motor Fuels Sales: $268,000 ($23.17)
Miami Shores government finances - Debt in 2017 (per resident):
Long Term Debt - Outstanding Unspecified Public Purpose: $10,194,000 ($881.15)
Beginning Outstanding - Unspecified Public Purpose: $6,187,000 ($534.79)Issue, Unspecified Public Purpose: $5,000,000 ($432.19)Retired Unspecified Public Purpose: $889,000 ($76.84)
Miami Shores government finances - Cash and Securities in 2017 (per resident):
Bond Funds - Cash and Securities: $589,000 ($50.91)
Other Funds - Cash and Securities: $19,147,000 ($1655.03)
Sinking Funds - Cash and Securities: $1,124,000 ($97.16)
4.04% of this county's 2021 resident taxpayers lived in other counties in 2020 ($229,296 average adjusted gross income )
Here:
4.04%Florida average:
8.80%
0.03% of residents moved from foreign countries ($357 average AGI )Miami-Dade County:
0.03%Florida average:
0.05%
Top counties from which taxpayers relocated into this county between 2020 and 2021:
5.24% of this county's 2020 resident taxpayers moved to other counties in 2021 ($66,399 average adjusted gross income )
Here:
5.24%Florida average:
7.45%
0.03% of residents moved to foreign countries ($505 average AGI )Miami-Dade County:
0.03%Florida average:
0.04%
Top counties to which taxpayers relocated from this county between 2020 and 2021:
Businesses in Miami Shores, FL
Name Count Name Count
AT&T 1 Pizza Hut 1 Blockbuster 1 Publix Super Markets 1 Burger King 1 Starbucks 1 CVS 1 Subway 1 FedEx 1 UPS 1 H&R Block 1
Strongest AM radio stations in Miami Shores:
WIOD (610 AM; 5 kW; MIAMI, FL; Owner: CLEAR CHANNEL BROADCASTING LICENSES, INC.)
WRFX (940 AM; 50 kW; MIAMI, FL; Owner: CLEAR CHANNEL BROADCASTING LICENSES, INC.)
WAQI (710 AM; 50 kW; MIAMI, FL; Owner: LICENSE CORPORATION #1)
WNMA (1210 AM; 49 kW; MIAMI SPRINGS, FL; Owner: RADIO UNICA OF MIAMI LICENSE CORP.)
WOCN (1450 AM; 1 kW; MIAMI, FL; Owner: MINORITY BROADCASTERS, INC)
WWFE (670 AM; 50 kW; MIAMI, FL; Owner: FENIX BROADCASTING CORP.)
WSUA (1260 AM; 50 kW; MIAMI, FL; Owner: WSUA BROADCASTING CORPORATION)
WQBA (1140 AM; 50 kW; MIAMI, FL; Owner: WQBA-AM LICENSE CORP.)
WQAM (560 AM; 5 kW; MIAMI, FL; Owner: WQAM LICENSE LIMITED PARTNERSHIP)
WRHC (1550 AM; 45 kW; CORAL GABLES, FL; Owner: WRHC BROADCASTING CORP.)
WVCG (1080 AM; 50 kW; CORAL GABLES, FL; Owner: RADIO ONE LICENSES, LLC)
WWNN (1470 AM; 50 kW; POMPANO BEACH, FL; Owner: WWNN LICENSE, LLC)
WKAT (1360 AM; 5 kW; NORTH MIAMI, FL; Owner: SPANISH MEDIA BROADCASTING, L.L.C.)
Strongest FM radio stations in Miami Shores:
WXDJ (95.7 FM; NORTH MIAMI BEACH, FL; Owner: WXDJ LICENSING, INC.)
WAMR-FM (107.5 FM; MIAMI, FL; Owner: WQBA-FM LICENSE CORP.)
WHQT (105.1 FM; CORAL GABLES, FL; Owner: COX RADIO, INC.)
WLVE (93.9 FM; MIAMI BEACH, FL; Owner: CLEAR CHANNEL BROADCASTING LICENSES, INC.)
WMIB (103.5 FM; FORT LAUDERDALE, FL; Owner: CLEAR CHANNEL BROADCASTING LICENSES, INC.)
WMXJ (102.7 FM; POMPANO BEACH, FL; Owner: JEFFERSON-PILOT COMMUNICATIONS CO. OF FLORIDA)
WPOW (96.5 FM; MIAMI, FL; Owner: WPOW LICENSE LIMITED PARTNERSHIP)
WZTA (94.9 FM; MIAMI BEACH, FL; Owner: CLEAR CHANNEL BROADCASTING LICENSES, INC.)
WFLC (97.3 FM; MIAMI, FL; Owner: COX RADIO, INC.)
WPYM (93.1 FM; MIAMI, FL; Owner: COX RADIO-MIAMI, LLC)
WLRN-FM (91.3 FM; MIAMI, FL; Owner: THE SCHOOL BOARD OF MIAMI - DADE COUNTY, FL)
WLYF (101.5 FM; MIAMI, FL; Owner: JEFFERSON-PILOT COMMUNICATIONS CO. OF FLORIDA)
WBGG-FM (105.9 FM; FORT LAUDERDALE, FL; Owner: CLEAR CHANNEL BROADCASTING LICENSES, INC.)
WHYI-FM (100.7 FM; FORT LAUDERDALE, FL; Owner: CLEAR CHANNEL BROADCASTING LICENSES, INC.)
WKIS (99.9 FM; BOCA RATON, FL; Owner: WKIS LICENSE LIMITED PARTNERSHIP)
WRMA (106.7 FM; FORT LAUDERDALE, FL; Owner: WRMA LICENSING, INC.)
WCMQ-FM (92.3 FM; HIALEAH, FL; Owner: WCMQ LICENSING, INC.)
WDNA (88.9 FM; MIAMI, FL; Owner: BASCOMB MEMORIAL BROADCASTING FOUNDATION)
WRTO (98.3 FM; GOULDS, FL; Owner: LICENSE CORPORATION #2)
WMCU (89.7 FM; MIAMI, FL; Owner: TRINITY INTERNATIONAL FOUNDATION, INC.)
TV broadcast stations around Miami Shores:
WPBT (Channel 2; MIAMI, FL; Owner: COMMUNITY TV FOUNDATION OF S. FLORIDA, INC.)
WSVN (Channel 7; MIAMI, FL; Owner: SUNBEAM TELEVISION CORP.)
WPLG (Channel 10; MIAMI, FL; Owner: POST-NEWSWEEK STATIONS, FLORIDA, INC.)
WPXM (Channel 35; MIAMI, FL; Owner: PAXSON COMMUNICATIONS LICENSE COMPANY, LLC)
WBFS-TV (Channel 33; MIAMI, FL; Owner: VIACOM STATIONS GROUP OF MIAMI INC.)
WLTV (Channel 23; MIAMI, FL; Owner: WLTV LICENSE PARTNERSHIP, G.P.)
WLRN-TV (Channel 17; MIAMI, FL; Owner: THE SCHOOL BOARD OF MIAMI - DADE COUNTY, FL)
WBZL (Channel 39; MIAMI, FL; Owner: CHANNEL 39, INC.)
WLMF-LP (Channel 53; MIAMI, FL; Owner: PAGING SYSTEMS, INC.)
WAMI-TV (Channel 69; HOLLYWOOD, FL; Owner: TELEFUTURA MIAMI LLC)
WSCV (Channel 51; FORT LAUDERDALE, FL; Owner: TELEMUNDO OF FLORIDA LICENSE CORP.)
WPPB-TV (Channel 63; BOCA RATON, FL; Owner: THE SCHOOL BOARD OF BROWARD COUNTY, FLORIDA)
W58BU (Channel 58; HALLANDALE, FL; Owner: NBC STATIONS MANAGEMENT,INC.)
WHFT-TV (Channel 45; MIAMI, FL; Owner: TRINITY BROADCASTING OF FLORIDA, INC.)
W24CA (Channel 24; MARATHON, FL; Owner: KEY COMMUNICATIONS OF TEXAS)
WFUN-CA (Channel 48; MIAMI, ETC., FL; Owner: LOCALONE TEXAS, LTD.)
WIMP-CA (Channel 25; MIAMI, FL; Owner: SUNSHINE BROADCASTING COMPANY, INC.)
WTVJ (Channel 6; MIAMI, FL; Owner: NBC STATIONS MANAGEMENT, INC.)
WGEN-LP (Channel 55; MIAMI, FL; Owner: WDLP BROADCASTING COMPANY, LLC)
WJAN-CA (Channel 41; MIAMI, FL; Owner: SHERJAN BROADCASTING COMPANY, INC.)
WVEB-CA (Channel 21; MIAMI, ETC., FL; Owner: HISPANIC KEYS BROADCASTING CORPORATION)
WHDT-LP (Channel 44; MIAMI, FL; Owner: GUENTER MARKSTEINER)
WPMF-LP (Channel 31; MIAMI, FL; Owner: JAMES J. CHLADEK)
WPTV (Channel 5; WEST PALM BEACH, FL; Owner: SCRIPPS HOWARD BROADCASTING COMPANY)
WFLX (Channel 29; WEST PALM BEACH, FL; Owner: RAYCOM NATIONAL, INC.)
National Bridge Inventory (NBI) Statistics 1 Number of bridges13ft / 3.8m Total length41,500 Total average daily traffic1,660 Total average daily truck traffic72,002 Total future (year 2042) average daily traffic
FCC Registered Antenna Towers: 14 (
See the full list of FCC Registered Antenna Towers in Miami Shores )
FCC Registered Broadcast Land Mobile Towers: 6
10050 Ne 2nd Ave (Lat: 25.833972 Lon: -80.193944), Type: Building, Structure height: 12 m, Overall height: 17 m, Call Sign: WPMV396, Assigned Frequencies: 866.012 MHz, 867.012 MHz, 867.512 MHz, 868.012 MHz, 868.512 MHz, Grant Date: 01/25/1999, Expiration Date: 01/25/2004, Cancellation Date: 09/26/2004, Certifier: Richard Masten, Registrant: Miami Shores Police Department, 9990 Ne 2nd Avenue, Miami Shores, FL 33138, Phone: (305) 759-2468, Fax: (305) 795-2212 Lat: 25.918417 Lon: -80.020583, Call Sign: WPWE419, Assigned Frequencies: 456.637 MHz, 457.512 MHz, 457.712 MHz, 457.812 MHz, Grant Date: 10/28/2002, Expiration Date: 10/28/2012, Cancellation Date: 12/29/2012, Certifier: Jim Torga, Registrant: Cara Enterprises Inc, Salt Lake City, UT 84117-0503, Phone: (801) 278-9728, Fax: (801) 278-723910050 Ne 2nd Ave (Lat: 25.833972 Lon: -80.193944), Type: Building, Structure height: 12 m, Overall height: 17 m, Call Sign: WQEY822, Assigned Frequencies: 808.512 MHz, 806.012 MHz, 807.012 MHz, 807.512 MHz, 808.012 MHz, Grant Date: 04/01/2016, Expiration Date: 05/22/2026, Certifier: David K Mcleod, Registrant: Miami Shores Police Department, 9990 N.E. 2nd Avenue, Miami Shores, FL 33139, Phone: (305) 759-2468, Fax: (386) 322-2502, Email:
602 Ne 96th Street (Lat: 25.863333 Lon: -80.184667), Type: Building, Structure height: 9 m, Call Sign: WQUD987, Assigned Frequencies: 465.000 MHz, 462.750 MHz, Grant Date: 06/12/2014, Expiration Date: 06/12/2024, Certifier: David Kinchen, Registrant: Visiplex, Inc., 1287 North Barclay Boulevard, Buffalo Grove, IL 60089, Phone: (847) 229-0250, Fax: (847) 229-0259, Email:
Lat: 25.862389 Lon: -80.193389, Call Sign: WQXN659, Assigned Frequencies: 457.087 MHz, 456.762 MHz, 457.687 MHz, 457.137 MHz, 456.662 MHz, 456.462 MHz, 457.487 MHz, 456.362 MHz, 456.512 MHz, 456.412 MHz, Grant Date: 04/25/2016, Expiration Date: 04/25/2026, Certifier: Andres Del Toro, Registrant: Sei Wireless Solutions LLC, 5397 Orange Dr Ste 101, Fort Lauderdale, FL 33314, Phone: (954) 615-1500, Fax: (954) 318-0488Lat: 25.878972 Lon: -80.205667, Call Sign: WREZ326, Assigned Frequencies: 451.437 MHz, 451.712 MHz, 452.512 MHz, 452.662 MHz, 456.437 MHz, Grant Date: 01/08/2020, Expiration Date: 01/08/2030, Certifier: Kelly Andrews, Registrant: Business Radio Licensing, 30251 Golden Lantern, Suite E, Laguna Niguel, CA 92677, Phone: (949) 348-8510, Fax: (949) 348-8514, Email:
FCC Registered Microwave Towers: 1
FL-MIA3038A, 320 Nw 115th St (Lat: 25.880556 Lon: -80.205833), Type: Tower, Structure height: 42.6 m, Overall height: 45.7 m, Call Sign: WQMQ467, Assigned Frequencies: 11465.0 MHz, 11545.0 MHz, Grant Date: 11/10/2020, Expiration Date: 10/21/2030, Cancellation Date: 09/14/2021, Certifier: Nadja S Sodos-Wallace, Registrant: T-Mobile Usa, Inc., 12920 Se 38th Street, Bellevue, WA 98006, Phone: (425) 383-8401, Fax: (425) 383-4840, Email:
FCC Registered Amateur Radio Licenses: 13 (
See the full list of FCC Registered Amateur Radio Licenses in Miami Shores )
FAA Registered Aircraft: 4
Aircraft: CESSNA 182S (Category: Land, Seats: 6, Weight: Up to 12,499 Pounds), Engine: LYCOMING IO-540 SER (300 HP) (Reciprocating)N-Number: 418WR, N418WR, N-418WR, Serial Number: 18280034, Year manufactured: 1997, Airworthiness Date: 10/10/1997, Certificate Issue Date: 12/05/2015Registrant (Individual): Herman Frank Rubio, 1107 Ne 104th St, Miami Shores, FL 33138Aircraft: HUGHES 269B (Category: Land, Seats: 3, Weight: Up to 12,499 Pounds, Speed: 64 mph), Engine: LYCOMING I0360 SER (180 HP) (Reciprocating)N-Number: 9407F, N9407F, N-9407F, Serial Number: 94-0135, Year manufactured: 1965, Certificate Issue Date: 07/09/1975Registrant (Co-Owned): Charles Wagenheim, 344 N E 102nd Street, Miami Shores, FL 33153, Other Owners: Jose H Cascudo, Narciso J RamirezDeregistered: Cancel Date: 03/23/2018Aircraft: ORTON LEON PULSAR I (Category: Land, Seats: 2, Weight: Up to 12,499 Pounds), Engine: ReciprocatingN-Number: 19147, N19147, N-19147, Serial Number: 147, Certificate Issue Date: 05/03/2000Registrant (Individual): Leon W Orton, 1060 Ne 104th St, Miami Shores, FL 33138Deregistered: Cancel Date: 04/13/2017Aircraft: BEECH D18S (Category: Land, Engines: 2, Seats: 10, Weight: Up to 12,499 Pounds, Speed: 165 mph), Engine: P&W R-985 SERIES (450 HP) (Reciprocating)N-Number: 800WM, N800WM, N-800WM, Serial Number: A-90, Year manufactured: 1946, Certificate Issue Date: 04/04/1978Registrant (Corporation): Southern Aero Traders Inc, Po Box 522, Miami Shores, FL 33153Deregistered: Cancel Date: 02/04/2017
Home Mortgage Disclosure Act Aggregated Statistics For Year 2009(Based on 5 partial tracts) A) FHA, FSA/RHS & VA B) Conventional C) Refinancings D) Home Improvement Loans E) Loans on Dwellings For 5+ Families F) Non-occupant Loans on Number Average Value Number Average Value Number Average Value Number Average Value Number Average Value Number Average Value
LOANS ORIGINATED 41 $230,274 77 $240,426 134 $246,327 9 $74,492 0 $0 10 $190,705 APPLICATIONS APPROVED, NOT ACCEPTED 5 $283,598 19 $244,259 22 $270,122 2 $121,105 1 $350,640 3 $220,740 APPLICATIONS DENIED 20 $220,695 39 $261,478 125 $236,013 9 $120,657 1 $154,870 18 $181,668 APPLICATIONS WITHDRAWN 11 $248,640 17 $218,418 45 $242,228 1 $327,970 1 $251,290 4 $244,708 FILES CLOSED FOR INCOMPLETENESS 5 $257,196 7 $284,449 15 $225,395 0 $0 0 $0 3 $202,820
Aggregated Statistics For Year 2008(Based on 5 partial tracts) A) FHA, FSA/RHS & VA B) Conventional C) Refinancings D) Home Improvement Loans E) Loans on Dwellings For 5+ Families F) Non-occupant Loans on Number Average Value Number Average Value Number Average Value Number Average Value Number Average Value Number Average Value
LOANS ORIGINATED 17 $291,228 103 $301,671 129 $266,385 14 $120,449 1 $674,810 30 $259,725 APPLICATIONS APPROVED, NOT ACCEPTED 1 $338,850 22 $274,325 51 $260,078 8 $121,065 1 $613,620 12 $197,182 APPLICATIONS DENIED 9 $267,752 53 $339,298 141 $319,738 23 $144,748 2 $1,134,515 34 $298,908 APPLICATIONS WITHDRAWN 5 $302,946 30 $359,241 48 $266,862 2 $87,955 1 $774,330 7 $223,851 FILES CLOSED FOR INCOMPLETENESS 0 $0 13 $404,949 21 $318,020 3 $56,740 0 $0 3 $205,823
Aggregated Statistics For Year 2007(Based on 5 partial tracts) A) FHA, FSA/RHS & VA B) Conventional C) Refinancings D) Home Improvement Loans E) Loans on Dwellings For 5+ Families F) Non-occupant Loans on Number Average Value Number Average Value Number Average Value Number Average Value Number Average Value Number Average Value
LOANS ORIGINATED 2 $295,980 251 $375,031 367 $286,904 50 $211,901 6 $539,917 88 $381,020 APPLICATIONS APPROVED, NOT ACCEPTED 0 $0 81 $354,634 97 $280,011 14 $147,116 1 $895,590 24 $270,135 APPLICATIONS DENIED 0 $0 293 $384,801 302 $338,114 40 $193,194 2 $1,932,655 86 $272,140 APPLICATIONS WITHDRAWN 1 $246,150 67 $377,173 122 $329,550 12 $246,553 1 $1,505,410 25 $353,449 FILES CLOSED FOR INCOMPLETENESS 0 $0 29 $316,373 42 $289,266 6 $251,202 0 $0 7 $263,760
Aggregated Statistics For Year 2006(Based on 5 partial tracts) B) Conventional C) Refinancings D) Home Improvement Loans E) Loans on Dwellings For 5+ Families F) Non-occupant Loans on Number Average Value Number Average Value Number Average Value Number Average Value Number Average Value
LOANS ORIGINATED 523 $283,871 479 $292,412 65 $184,078 3 $1,152,520 130 $260,854 APPLICATIONS APPROVED, NOT ACCEPTED 109 $301,002 111 $264,114 17 $114,951 1 $1,217,010 21 $273,993 APPLICATIONS DENIED 333 $310,450 293 $305,352 44 $175,323 0 $0 78 $256,753 APPLICATIONS WITHDRAWN 123 $309,807 183 $282,732 12 $225,325 1 $216,230 37 $274,454 FILES CLOSED FOR INCOMPLETENESS 44 $276,929 65 $247,798 4 $128,197 0 $0 11 $306,524
Aggregated Statistics For Year 2005(Based on 5 partial tracts) A) FHA, FSA/RHS & VA B) Conventional C) Refinancings D) Home Improvement Loans E) Loans on Dwellings For 5+ Families F) Non-occupant Loans on G) Loans On Manufactured Number Average Value Number Average Value Number Average Value Number Average Value Number Average Value Number Average Value Number Average Value
LOANS ORIGINATED 1 $164,990 549 $289,644 511 $239,093 51 $183,443 7 $1,138,226 155 $244,936 0 $0 APPLICATIONS APPROVED, NOT ACCEPTED 0 $0 98 $262,581 92 $207,419 10 $110,894 1 $932,120 29 $187,593 0 $0 APPLICATIONS DENIED 1 $228,190 267 $283,489 251 $219,662 53 $136,831 2 $465,430 65 $246,473 1 $15,650 APPLICATIONS WITHDRAWN 1 $58,400 142 $433,025 197 $236,629 21 $209,689 1 $40,530 28 $228,128 0 $0 FILES CLOSED FOR INCOMPLETENESS 0 $0 28 $248,918 114 $220,634 2 $59,390 0 $0 5 $225,432 0 $0
Aggregated Statistics For Year 2004(Based on 5 partial tracts) A) FHA, FSA/RHS & VA B) Conventional C) Refinancings D) Home Improvement Loans E) Loans on Dwellings For 5+ Families F) Non-occupant Loans on G) Loans On Manufactured Number Average Value Number Average Value Number Average Value Number Average Value Number Average Value Number Average Value Number Average Value
LOANS ORIGINATED 2 $122,995 485 $255,967 533 $188,760 63 $123,844 12 $600,120 128 $217,111 1 $49,090 APPLICATIONS APPROVED, NOT ACCEPTED 0 $0 70 $250,767 133 $171,052 17 $78,752 3 $951,023 24 $155,854 0 $0 APPLICATIONS DENIED 0 $0 136 $254,172 277 $177,525 70 $99,328 1 $1,873,000 39 $186,025 0 $0 APPLICATIONS WITHDRAWN 0 $0 82 $259,216 164 $190,182 19 $92,046 2 $388,965 26 $241,026 1 $13,720 FILES CLOSED FOR INCOMPLETENESS 0 $0 21 $206,607 104 $176,412 3 $109,507 0 $0 8 $165,431 0 $0
Aggregated Statistics For Year 2003(Based on 5 partial tracts) A) FHA, FSA/RHS & VA B) Conventional C) Refinancings D) Home Improvement Loans E) Loans on Dwellings For 5+ Families F) Non-occupant Loans on Number Average Value Number Average Value Number Average Value Number Average Value Number Average Value Number Average Value
LOANS ORIGINATED 10 $128,704 448 $202,576 961 $166,666 34 $58,981 7 $585,907 118 $171,154 APPLICATIONS APPROVED, NOT ACCEPTED 2 $94,220 62 $201,650 165 $139,738 12 $42,017 0 $0 23 $133,770 APPLICATIONS DENIED 2 $156,470 94 $189,893 379 $155,077 37 $31,311 1 $838,810 45 $168,776 APPLICATIONS WITHDRAWN 0 $0 70 $195,866 217 $164,189 7 $90,396 2 $422,340 25 $153,245 FILES CLOSED FOR INCOMPLETENESS 0 $0 20 $254,259 52 $165,626 4 $32,038 0 $0 5 $199,234
Aggregated Statistics For Year 2002(Based on 5 partial tracts) A) FHA, FSA/RHS & VA B) Conventional C) Refinancings D) Home Improvement Loans E) Loans on Dwellings For 5+ Families F) Non-occupant Loans on Number Average Value Number Average Value Number Average Value Number Average Value Number Average Value Number Average Value
LOANS ORIGINATED 8 $103,939 405 $175,712 611 $156,747 47 $61,773 8 $451,366 101 $144,871 APPLICATIONS APPROVED, NOT ACCEPTED 1 $135,890 66 $162,003 139 $140,300 17 $40,944 1 $387,900 13 $128,865 APPLICATIONS DENIED 4 $89,112 100 $157,758 276 $125,363 47 $61,304 1 $179,700 28 $137,069 APPLICATIONS WITHDRAWN 3 $115,743 59 $179,536 167 $129,142 9 $39,410 0 $0 10 $158,503 FILES CLOSED FOR INCOMPLETENESS 0 $0 13 $158,754 50 $142,223 2 $52,170 0 $0 4 $161,470
Aggregated Statistics For Year 2001(Based on 5 partial tracts) A) FHA, FSA/RHS & VA B) Conventional C) Refinancings D) Home Improvement Loans E) Loans on Dwellings For 5+ Families F) Non-occupant Loans on Number Average Value Number Average Value Number Average Value Number Average Value Number Average Value Number Average Value
LOANS ORIGINATED 20 $103,329 389 $150,155 478 $141,649 49 $35,064 4 $418,722 72 $124,664 APPLICATIONS APPROVED, NOT ACCEPTED 0 $0 55 $149,952 83 $119,370 24 $42,781 0 $0 8 $92,548 APPLICATIONS DENIED 3 $132,233 80 $150,100 257 $115,375 72 $33,049 3 $225,657 27 $117,458 APPLICATIONS WITHDRAWN 2 $164,250 42 $156,065 137 $104,295 17 $24,225 1 $277,590 12 $120,073 FILES CLOSED FOR INCOMPLETENESS 1 $115,350 9 $130,900 56 $134,607 5 $40,916 1 $273,210 2 $130,815
Aggregated Statistics For Year 2000(Based on 5 partial tracts) A) FHA, FSA/RHS & VA B) Conventional C) Refinancings D) Home Improvement Loans E) Loans on Dwellings For 5+ Families F) Non-occupant Loans on Number Average Value Number Average Value Number Average Value Number Average Value Number Average Value Number Average Value
LOANS ORIGINATED 42 $91,707 382 $134,342 150 $105,428 47 $34,114 5 $525,328 43 $120,903 APPLICATIONS APPROVED, NOT ACCEPTED 2 $87,550 57 $121,234 45 $89,225 27 $22,855 0 $0 9 $104,623 APPLICATIONS DENIED 6 $93,153 112 $112,788 181 $89,384 48 $22,463 0 $0 19 $92,835 APPLICATIONS WITHDRAWN 7 $99,453 55 $123,999 103 $80,027 5 $30,216 1 $386,870 7 $89,926 FILES CLOSED FOR INCOMPLETENESS 0 $0 15 $118,997 40 $111,876 3 $91,963 0 $0 2 $74,640
Detailed HMDA statistics for the following Tracts:
0011.02
, 0011.03 , 0011.04 , 0012.02 , 0039.01
Private Mortgage Insurance Companies Aggregated Statistics For Year 2009(Based on 5 partial tracts) A) Conventional B) Refinancings Number Average Value Number Average Value
LOANS ORIGINATED 7 $305,069 1 $158,750 APPLICATIONS APPROVED, NOT ACCEPTED 2 $287,570 0 $0 APPLICATIONS DENIED 4 $233,828 0 $0 APPLICATIONS WITHDRAWN 0 $0 0 $0 FILES CLOSED FOR INCOMPLETENESS 1 $200,360 0 $0
Aggregated Statistics For Year 2008(Based on 5 partial tracts) A) Conventional B) Refinancings C) Non-occupant Loans on Number Average Value Number Average Value Number Average Value
LOANS ORIGINATED 34 $309,100 6 $285,980 1 $86,780 APPLICATIONS APPROVED, NOT ACCEPTED 34 $306,379 4 $343,030 3 $213,597 APPLICATIONS DENIED 10 $276,270 1 $414,390 2 $187,480 APPLICATIONS WITHDRAWN 1 $542,840 1 $480,720 0 $0 FILES CLOSED FOR INCOMPLETENESS 2 $327,290 0 $0 0 $0
Aggregated Statistics For Year 2007(Based on 5 partial tracts) A) Conventional B) Refinancings C) Non-occupant Loans on Number Average Value Number Average Value Number Average Value
LOANS ORIGINATED 47 $329,764 7 $298,534 10 $278,353 APPLICATIONS APPROVED, NOT ACCEPTED 11 $302,473 4 $333,480 3 $272,743 APPLICATIONS DENIED 4 $355,732 0 $0 0 $0 APPLICATIONS WITHDRAWN 2 $452,430 0 $0 1 $158,640 FILES CLOSED FOR INCOMPLETENESS 2 $265,690 1 $673,380 0 $0
Aggregated Statistics For Year 2006(Based on 5 partial tracts) A) Conventional B) Refinancings C) Non-occupant Loans on Number Average Value Number Average Value Number Average Value
LOANS ORIGINATED 32 $270,070 6 $328,103 9 $237,006 APPLICATIONS APPROVED, NOT ACCEPTED 10 $283,601 2 $239,375 0 $0 APPLICATIONS DENIED 1 $273,790 2 $599,355 1 $765,380 APPLICATIONS WITHDRAWN 3 $319,647 1 $170,970 0 $0 FILES CLOSED FOR INCOMPLETENESS 0 $0 0 $0 0 $0
Aggregated Statistics For Year 2005(Based on 5 partial tracts) A) Conventional B) Refinancings C) Non-occupant Loans on Number Average Value Number Average Value Number Average Value
LOANS ORIGINATED 64 $262,667 4 $195,885 9 $220,217 APPLICATIONS APPROVED, NOT ACCEPTED 13 $219,536 2 $333,990 1 $178,190 APPLICATIONS DENIED 2 $293,215 0 $0 0 $0 APPLICATIONS WITHDRAWN 7 $266,231 1 $230,990 0 $0 FILES CLOSED FOR INCOMPLETENESS 0 $0 0 $0 0 $0
Aggregated Statistics For Year 2004(Based on 5 partial tracts) A) Conventional B) Refinancings C) Non-occupant Loans on Number Average Value Number Average Value Number Average Value
LOANS ORIGINATED 93 $232,275 13 $221,418 10 $186,348 APPLICATIONS APPROVED, NOT ACCEPTED 17 $224,668 9 $173,911 2 $165,165 APPLICATIONS DENIED 4 $268,738 0 $0 2 $159,545 APPLICATIONS WITHDRAWN 6 $173,603 0 $0 0 $0 FILES CLOSED FOR INCOMPLETENESS 1 $149,670 0 $0 0 $0
Aggregated Statistics For Year 2003(Based on 5 partial tracts) A) Conventional B) Refinancings C) Non-occupant Loans on Number Average Value Number Average Value Number Average Value
LOANS ORIGINATED 116 $196,965 26 $186,107 6 $172,932 APPLICATIONS APPROVED, NOT ACCEPTED 28 $173,687 13 $178,004 3 $103,803 APPLICATIONS DENIED 6 $285,477 1 $145,420 2 $85,805 APPLICATIONS WITHDRAWN 11 $216,671 6 $172,080 4 $172,385 FILES CLOSED FOR INCOMPLETENESS 0 $0 0 $0 0 $0
Aggregated Statistics For Year 2002(Based on 5 partial tracts) A) Conventional B) Refinancings C) Non-occupant Loans on Number Average Value Number Average Value Number Average Value
LOANS ORIGINATED 137 $161,415 36 $141,208 14 $152,300 APPLICATIONS APPROVED, NOT ACCEPTED 31 $162,322 18 $167,467 4 $153,712 APPLICATIONS DENIED 11 $117,095 1 $214,160 3 $134,647 APPLICATIONS WITHDRAWN 11 $129,261 7 $191,747 2 $103,195 FILES CLOSED FOR INCOMPLETENESS 1 $170,670 0 $0 1 $94,990
Aggregated Statistics For Year 2001(Based on 5 partial tracts) A) Conventional B) Refinancings C) Non-occupant Loans on Number Average Value Number Average Value Number Average Value
LOANS ORIGINATED 136 $148,606 24 $145,390 11 $127,344 APPLICATIONS APPROVED, NOT ACCEPTED 24 $127,062 6 $151,907 3 $170,423 APPLICATIONS DENIED 10 $147,981 3 $153,773 4 $167,698 APPLICATIONS WITHDRAWN 8 $166,114 2 $135,905 0 $0 FILES CLOSED FOR INCOMPLETENESS 2 $111,135 1 $101,360 0 $0
Aggregated Statistics For Year 2000(Based on 5 partial tracts) A) Conventional B) Refinancings C) Non-occupant Loans on Number Average Value Number Average Value Number Average Value
LOANS ORIGINATED 136 $130,949 12 $116,420 7 $95,983 APPLICATIONS APPROVED, NOT ACCEPTED 18 $129,783 3 $150,050 0 $0 APPLICATIONS DENIED 10 $115,068 2 $106,340 1 $158,000 APPLICATIONS WITHDRAWN 6 $103,570 0 $0 1 $109,730 FILES CLOSED FOR INCOMPLETENESS 2 $72,945 0 $0 0 $0
Detailed PMIC statistics for the following Tracts:
0011.02
, 0011.03 , 0011.04 , 0012.02 , 0039.01 Miami Shores compared to Florida state average:
Median household income above state average. Median house value significantly above state average. Foreign-born population percentage above state average. Renting percentage significantly below state average. Length of stay since moving in significantly above state average. House age significantly above state average. Number of college students above state average. Percentage of population with a bachelor's degree or higher significantly above state average. Miami Shores on our top lists :
#7 on the list of "Top 101 cities with the largest percentage of likely homosexual households (counted as self-reported same-sex unmarried-partner households) (population 5,000+)"
#8 on the list of "Top 101 cities with the largest percentage of likely gay men couples (counted as self-reported male-male unmarried-partner households) (population 5,000+)"
#21 on the list of "Top 101 cities with largest percentage of females in occupations: legal occupations (population 5,000+)"
#47 on the list of "Top 101 cities with the most local government spending on current operations of parks and recreation per resident (population 10,000+)"
#49 on the list of "Top 101 cities with the largest percentage of high school students in private schools (500+ students)"
#68 on the list of "Top 101 cities with the largest percentage of elementary and middle school students in private schools (1,000+ students)"
#82 on the list of "Top 101 cities with the most residents born in Jamaica (population 500+)"
#95 on the list of "Top 101 cities with the most residents born in Nicaragua (population 500+)"
#95 on the list of "Top 101 cities with the most residents born in Venezuela (population 500+)"
#64 (33138) on the list of "Top 101 zip codes with the largest percentage of West Indian first ancestries"
#2 on the list of "Top 101 counties with the highest ground withdrawal of fresh water for public supply"
#8 on the list of "Top 101 counties with the most Evangelical Protestant congregations"
#9 on the list of "Top 101 counties with the most Black Protestant adherents"
#11 on the list of "Top 101 counties with the highest total withdrawal of fresh water for public supply (pop. 50,000+)"
#12 on the list of "Top 101 counties with the most Evangelical Protestant adherents (pop. 50,000+)"
Top Patent Applicants
Jean-Marie Parel (7)
Jean-Marie Arthur Parel (5)
Alvin Velasco (3)
Paolo Serafini (3)
Marc W. Litzenberg (3)
Stuart D. Cooper (2)
Mary Ellen Ahearn (1)
Jean Bonamy (1)
Simone Mayer (1)
Onier Llopiz (1)
Total of 32 patent applications in 2008-2024.
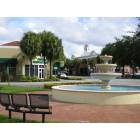
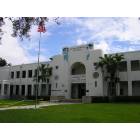
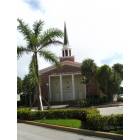
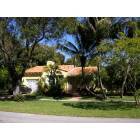
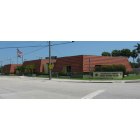
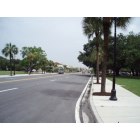
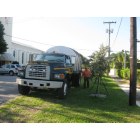

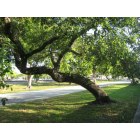


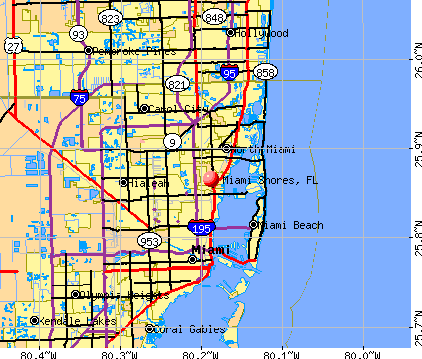


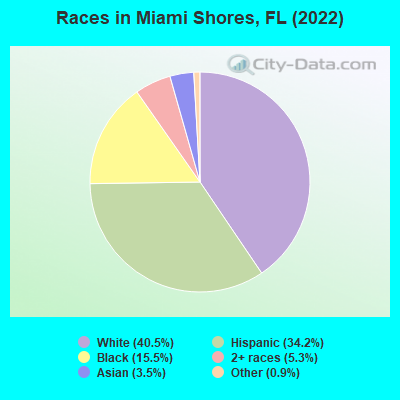
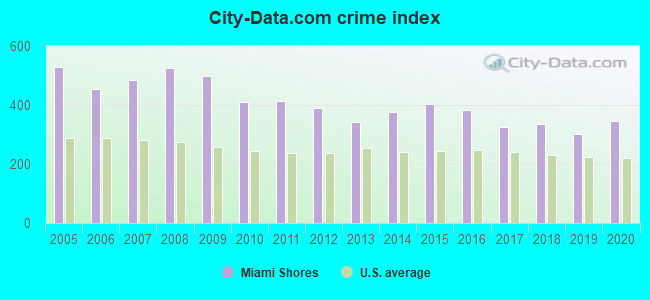
 Recent articles from our blog. Our writers, many of them Ph.D. graduates or candidates, create easy-to-read articles on a wide variety of topics.


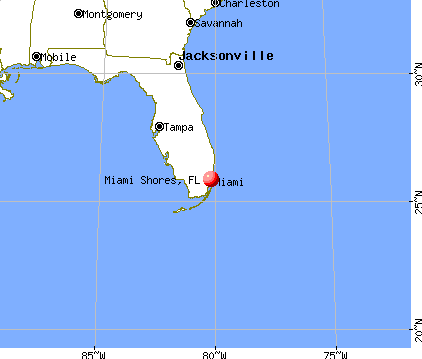
 (2.1 miles
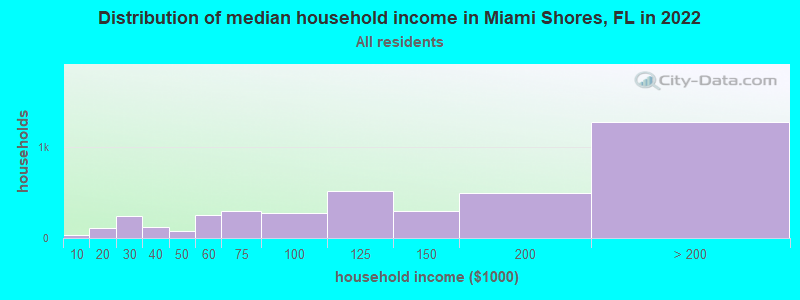
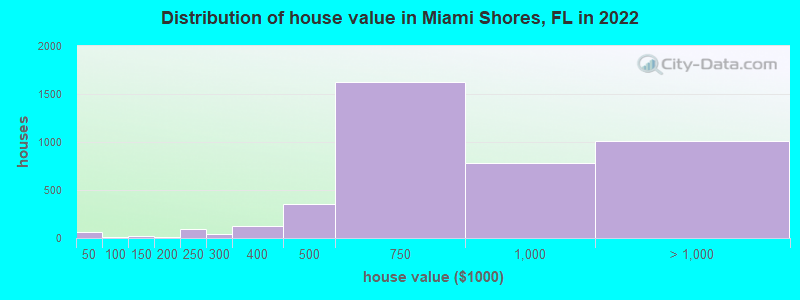
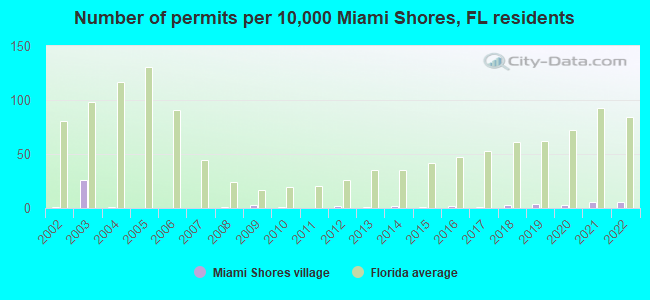
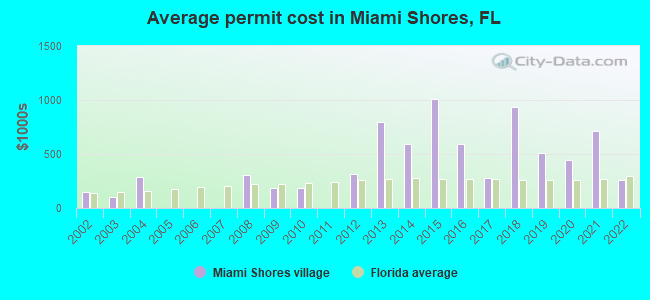
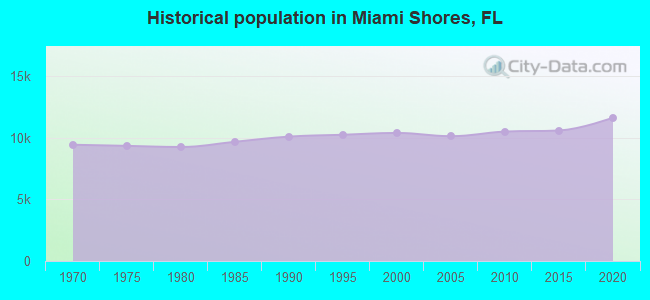
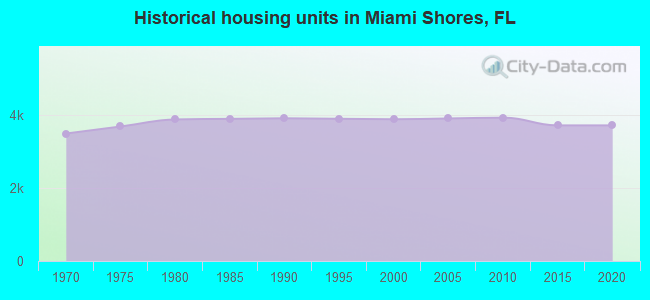
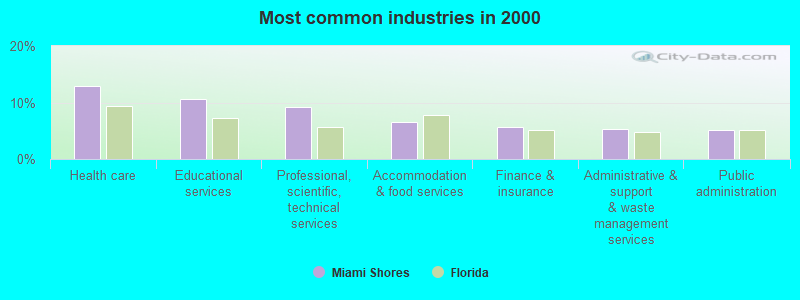
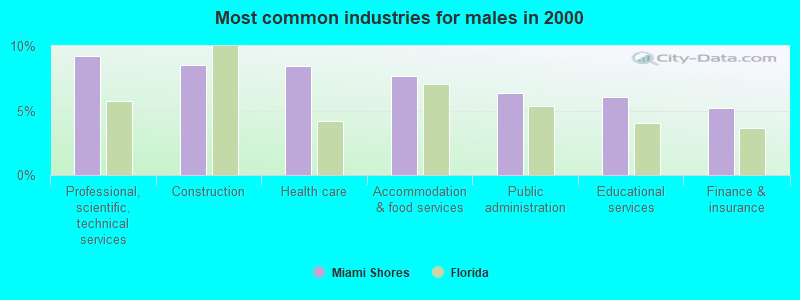
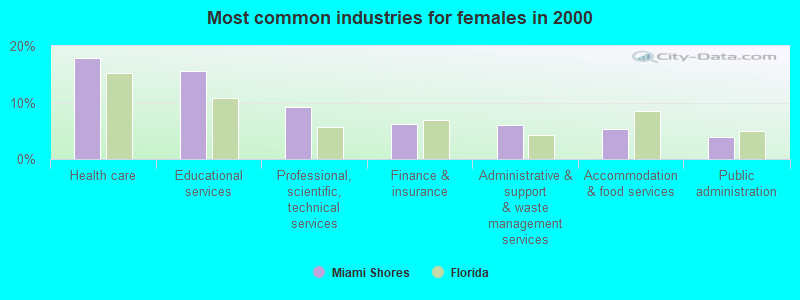
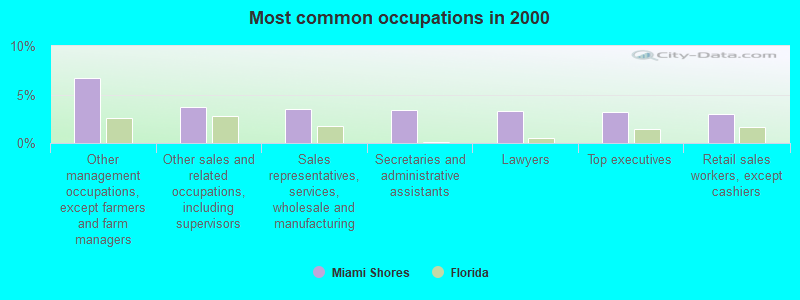
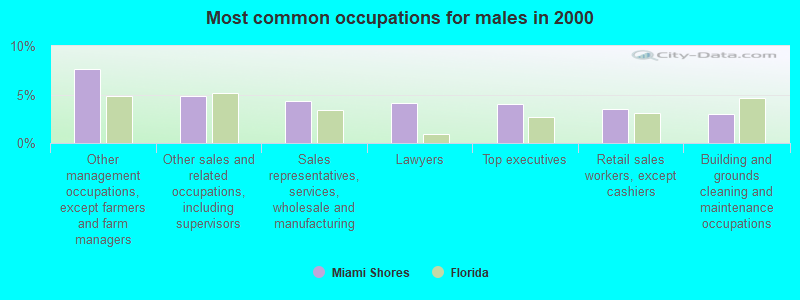
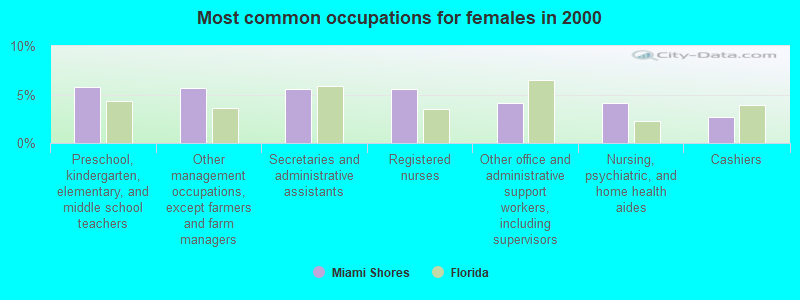
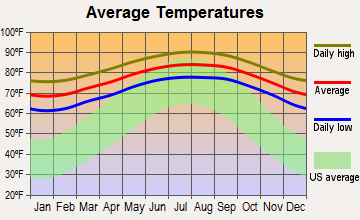
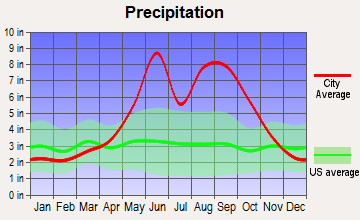
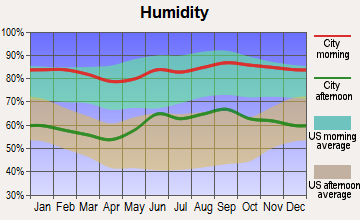
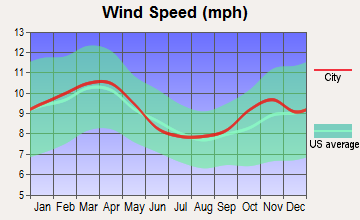
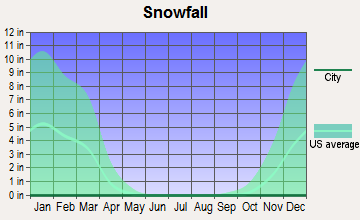
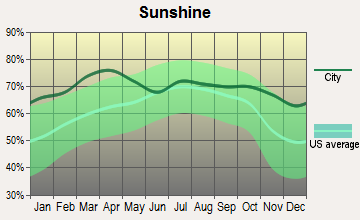
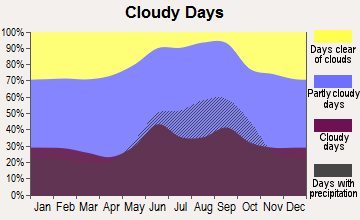
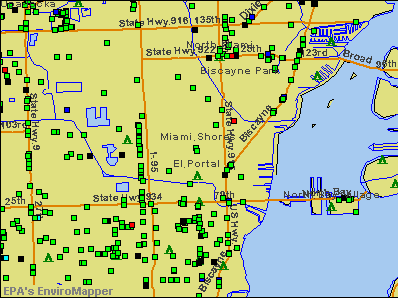

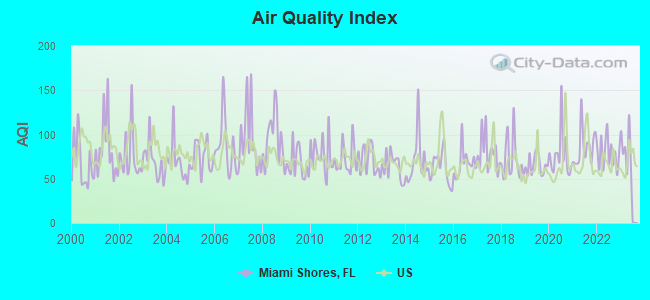
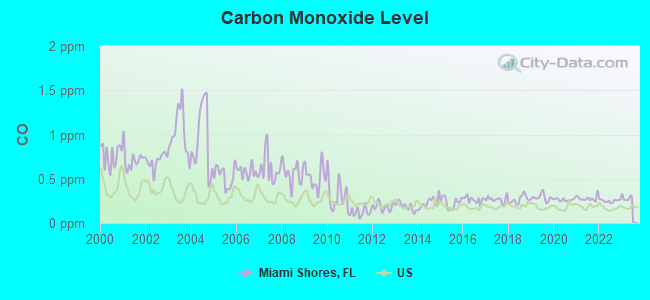
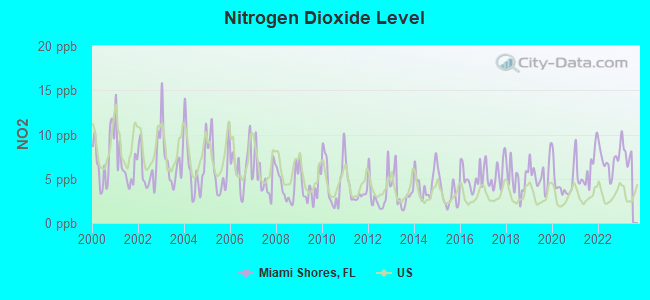
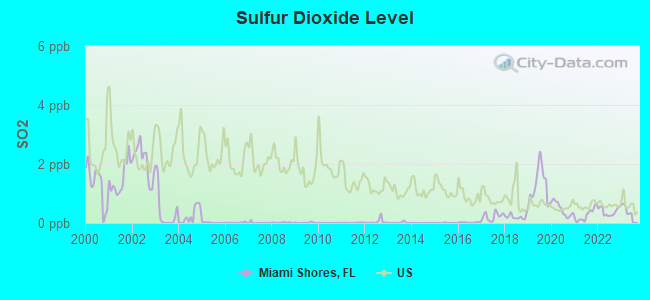
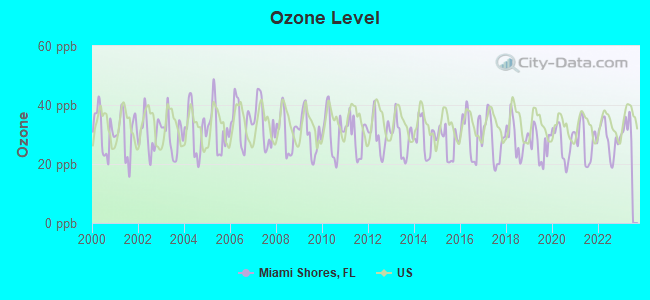
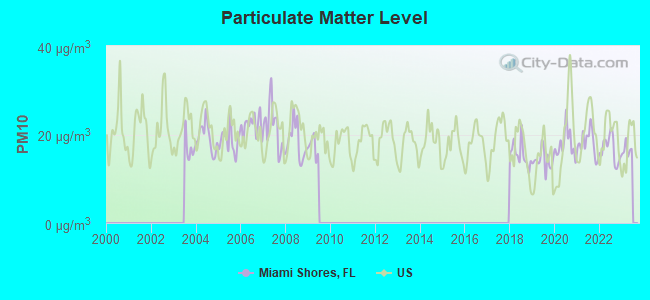
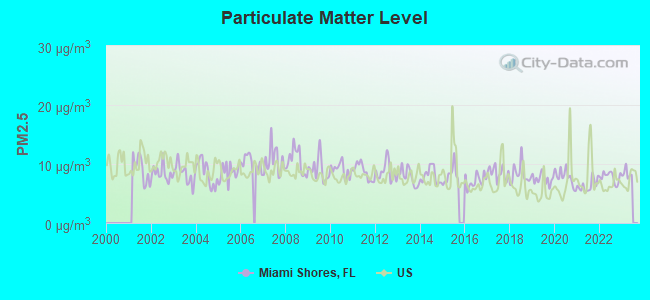

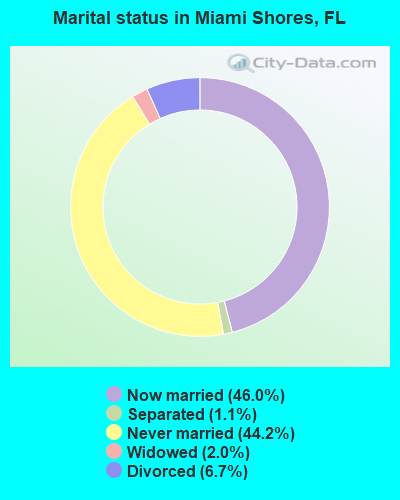
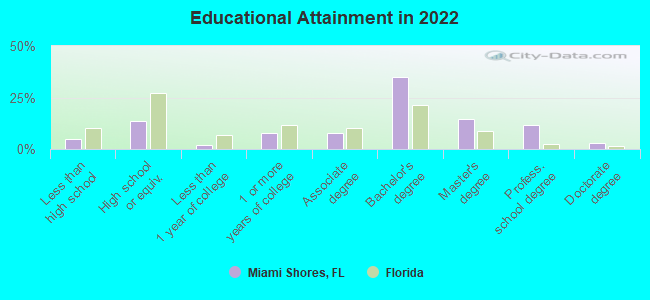
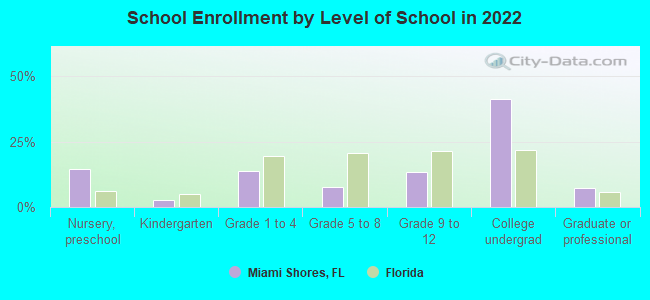
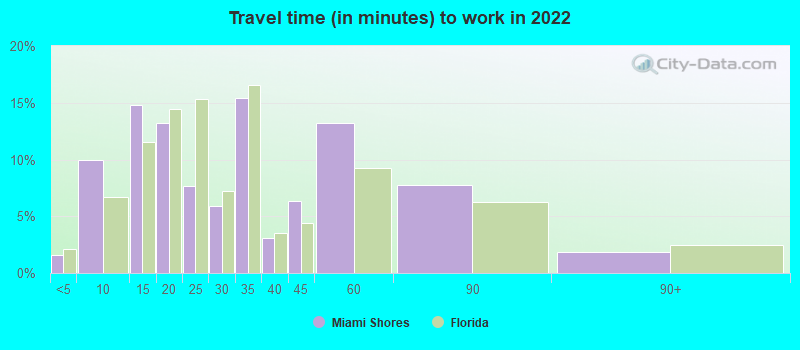
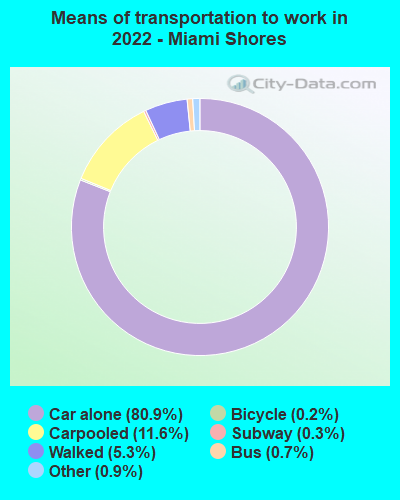
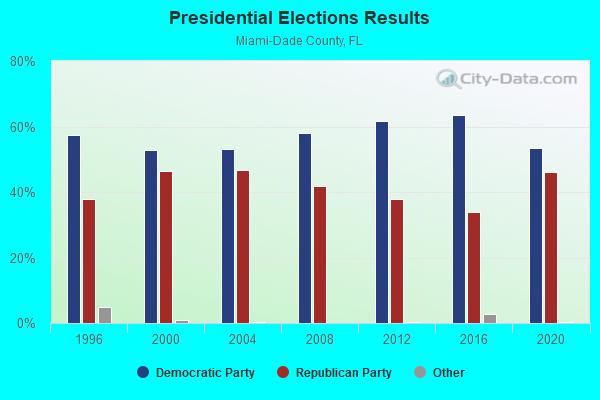
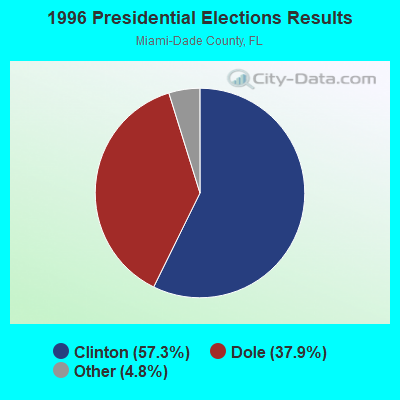
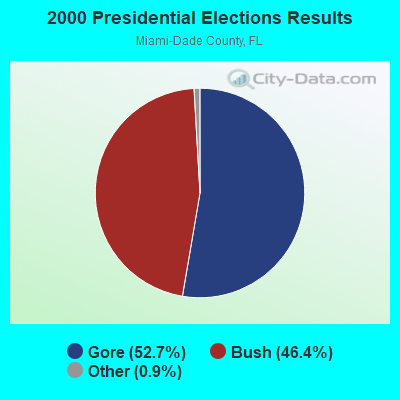
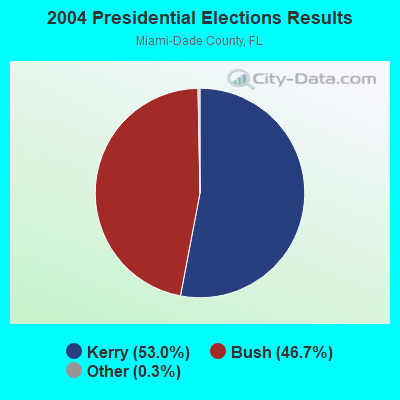
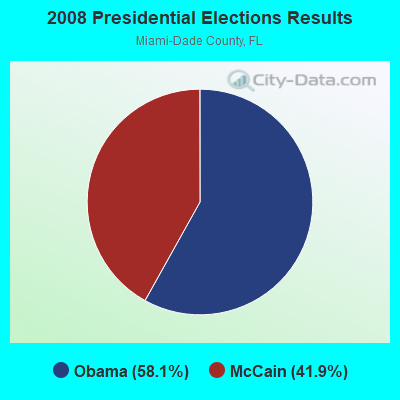
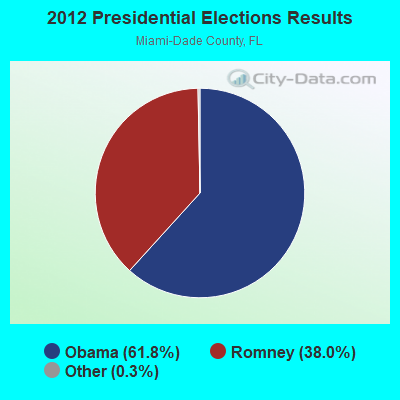
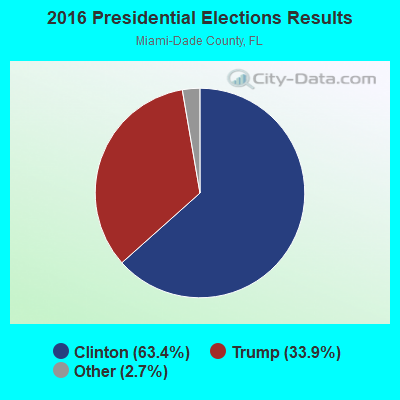
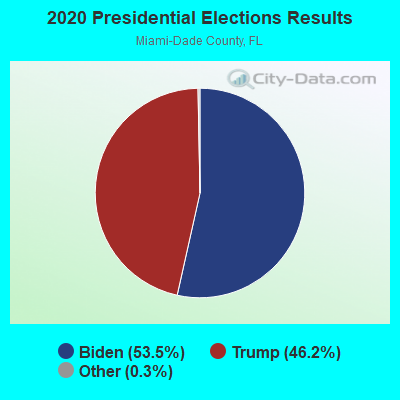
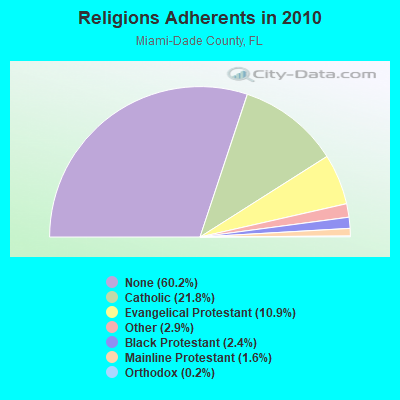
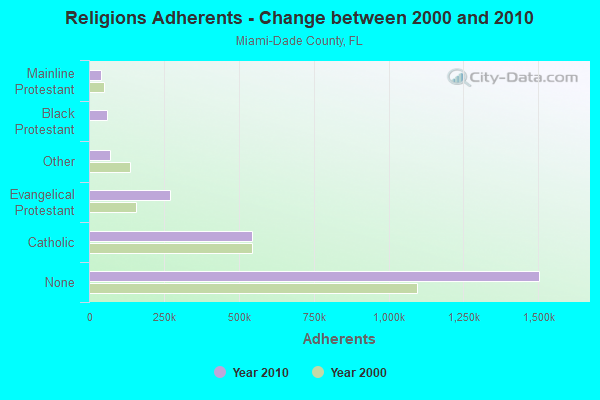

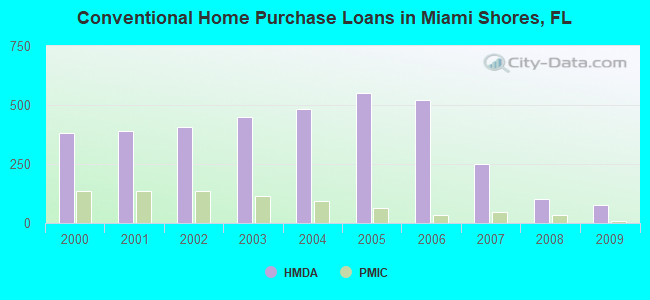
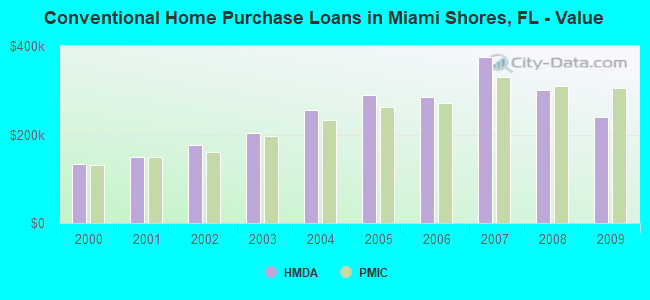
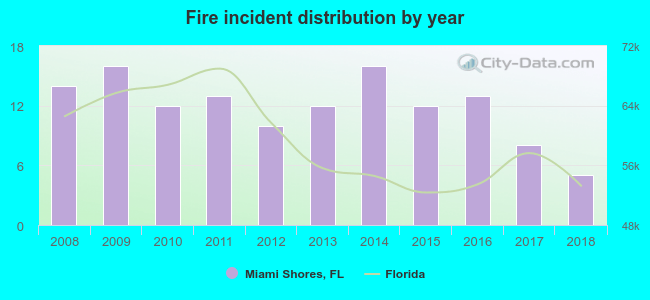 According to the data from the years 2008 - 2018 the average number of fires per year is 12. The highest number of fires - 16 took place in 2009, and the least - 5 in 2018. The data has a declining trend.
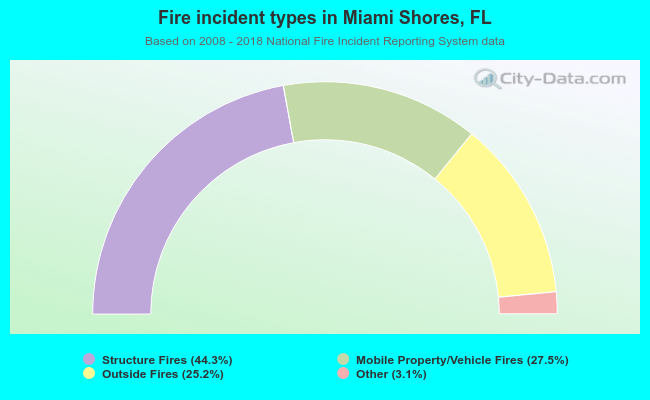 When looking into fire subcategories, the most reports belonged to: Structure Fires (44.3%), and Mobile Property/Vehicle Fires (27.5%).