Nashville, Wisconsin
Submit your own pictures of this town and show them to the world
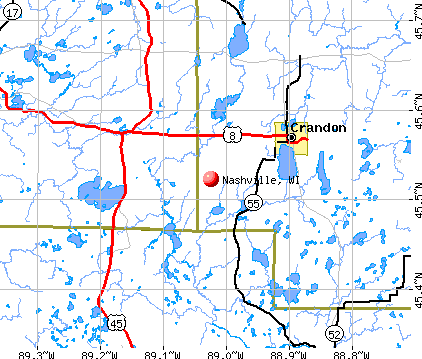
- OSM Map
- General Map
- Google Map
- MSN Map
Population change since 2000: -8.0%
 |
| Males: 555 | |
| Females: 509 |
| Median resident age: | 44.9 years |
| Wisconsin median age: | 42.6 years |
Zip codes: 54520.
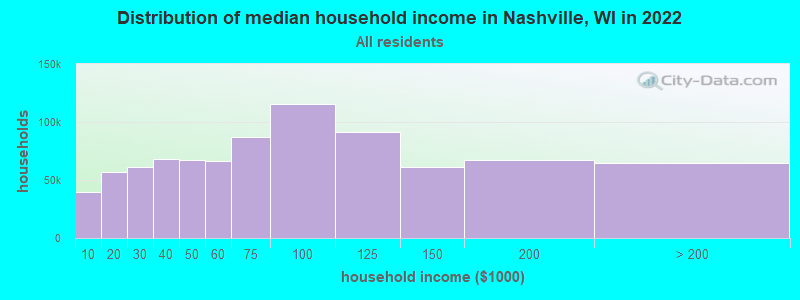
| Nashville: | $50,568 |
| WI: | $70,996 |
Estimated per capita income in 2022: $29,546 (it was $16,013 in 2000)
Nashville town income, earnings, and wages data
Estimated median house or condo value in 2022: $220,982 (it was $96,400 in 2000)
| Nashville: | $220,982 |
| WI: | $252,800 |
Detailed information about poverty and poor residents in Nashville, WI
Compare current foreclosures near Nashville, WI:
| Photo | Address | Area | Beds / Baths | Price | Details |
|---|---|---|---|---|---|

|
#1
County Road G
Pelican Lake, WI 54463
|
1,008 sq. feet
|
1 baths 2 beds |
show details | |

|
#2
Sabinois Point Rd
Pelican Lake, WI 54463
|
- sq. feet
|
- baths - beds |
show details | |

|
#3
Bass Lake Rd
Deerbrook, WI 54424
|
- sq. feet
|
- baths - beds |
show details | |

|
#4
S Wisconsin Ave
Crandon, WI 54520
|
- sq. feet
|
- baths - beds |
show details | |

|
#5
W Madison St
Crandon, WI 54520
|
- sq. feet
|
- baths - beds |
show details | |

|
#6
W Washington St
Crandon, WI 54520
|
- sq. feet
|
- baths - beds |
show details | |

|
#7
W Grant St
Crandon, WI 54520
|
- sq. feet
|
- baths - beds |
show details | |

|
#8
Mockingbird Ln
Townsend, WI 54175
|
- sq. feet
|
- baths - beds |
show details | |

|
Check over 1 million property listings on Foreclosure.com!
|
browse all offers | |||

- 66262.2%White alone
- 37435.2%American Indian alone
- 141.3%Two or more races
- 90.8%Hispanic
- 20.2%Asian alone
- 20.2%Other race alone
- 10.09%Black alone
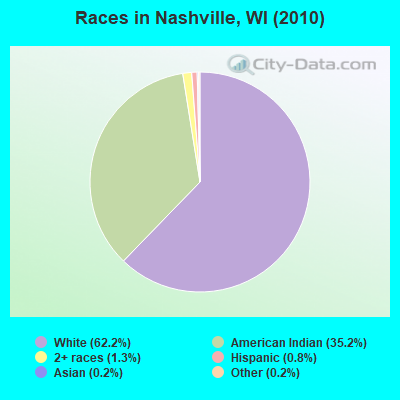
Races in Nashville detailed stats: ancestries, foreign born residents, place of birth
 Recent articles from our blog. Our writers, many of them Ph.D. graduates or candidates, create easy-to-read articles on a wide variety of topics.


 | Tell me about (surrounding) Milwaukee area - potential relocation (32 replies) |
| Green Bay or Janesville (53 replies) |
| Why Don't Most Wisconsinites I Know Seem to Notice the Gray Skies? (146 replies) |
| Was it a mistake moving to Wisconsin? (63 replies) |
| Summer Time Humidity (10 replies) |
| Work in La Crosse (4 replies) |
Latest news from Nashville, WI collected exclusively by city-data.com from local newspapers, TV, and radio stations
Ancestries: German (30.5%), Polish (9.2%), Irish (8.6%), English (5.0%), Dutch (3.4%), United States (3.3%).
Current Local Time: CST time zone
Elevation: 1700 feet
Land area: 67.2 square miles.
Population density: 16 people per square mile (very low).
22 residents are foreign born
| This town: | 1.9% |
| Wisconsin: | 3.6% |
| Nashville town: | 1.2% ($1,175) |
| Wisconsin: | 2.0% ($2,245) |
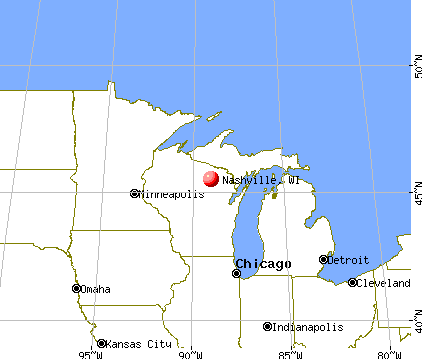
Nearest city with pop. 50,000+: Green Bay, WI  (78.4 miles , pop. 102,313).
Nearest city with pop. 200,000+: Madison, WI (166.4 miles , pop. 208,054).
Nearest city with pop. 1,000,000+: Chicago, IL (257.4 miles , pop. 2,896,016).
Nearest cities:
), ), ), ), ), ), ), Latitude: 45.45 N, Longitude: 88.91 W
Area code commonly used in this area: 715

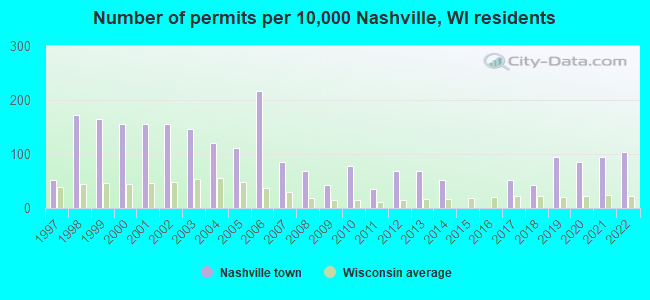
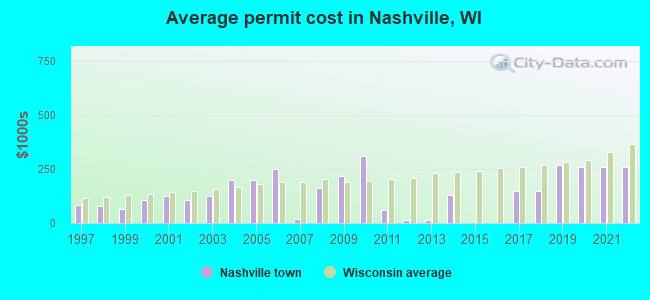
Single-family new house construction building permits:
- 2022: 12 buildings, average cost: $260,500
- 2021: 11 buildings, average cost: $260,900
- 2020: 10 buildings, average cost: $258,700
- 2019: 11 buildings, average cost: $270,700
- 2018: 5 buildings, average cost: $150,000
- 2017: 6 buildings, average cost: $150,000
- 2014: 6 buildings, average cost: $129,800
- 2013: 8 buildings, average cost: $14,500
- 2012: 8 buildings, average cost: $14,500
- 2011: 4 buildings, average cost: $60,000
- 2010: 9 buildings, average cost: $311,100
- 2009: 5 buildings, average cost: $216,000
- 2008: 8 buildings, average cost: $161,100
- 2007: 10 buildings, average cost: $20,000
- 2006: 25 buildings, average cost: $250,000
- 2005: 13 buildings, average cost: $200,000
- 2004: 14 buildings, average cost: $200,000
- 2003: 17 buildings, average cost: $125,000
- 2002: 18 buildings, average cost: $108,900
- 2001: 18 buildings, average cost: $125,000
- 2000: 18 buildings, average cost: $108,600
- 1999: 19 buildings, average cost: $63,800
- 1998: 20 buildings, average cost: $81,000
- 1997: 6 buildings, average cost: $81,500
| Here: | 4.2% |
| Wisconsin: | 2.7% |
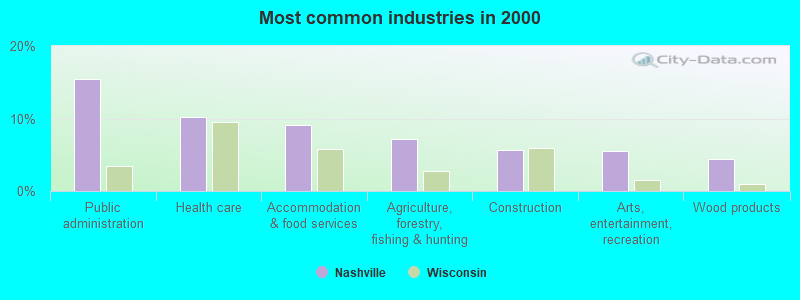
- Public administration (15.5%)
- Health care (10.3%)
- Accommodation & food services (9.2%)
- Agriculture, forestry, fishing & hunting (7.2%)
- Construction (5.7%)
- Arts, entertainment, recreation (5.5%)
- Wood products (4.4%)
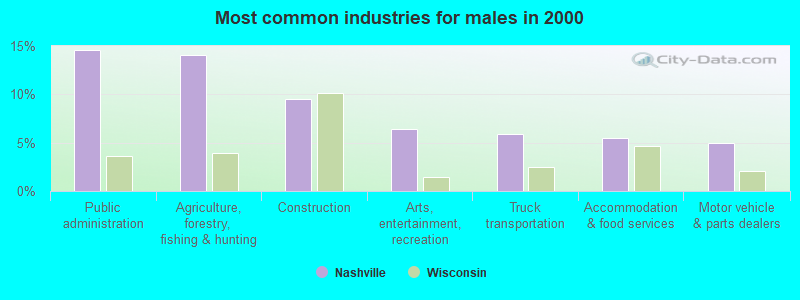
- Public administration (14.5%)
- Agriculture, forestry, fishing & hunting (14.1%)
- Construction (9.5%)
- Arts, entertainment, recreation (6.4%)
- Truck transportation (5.9%)
- Accommodation & food services (5.5%)
- Motor vehicle & parts dealers (5.0%)
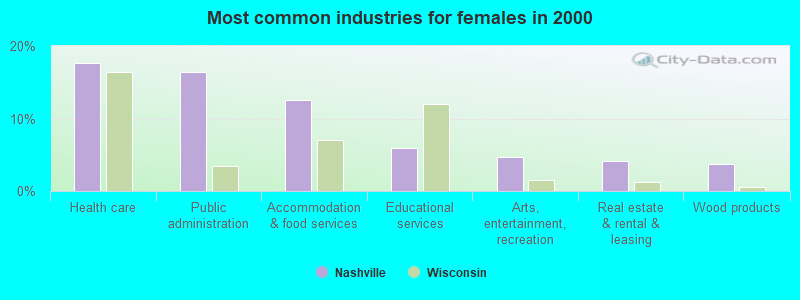
- Health care (17.6%)
- Public administration (16.4%)
- Accommodation & food services (12.6%)
- Educational services (5.9%)
- Arts, entertainment, recreation (4.6%)
- Real estate & rental & leasing (4.2%)
- Wood products (3.8%)
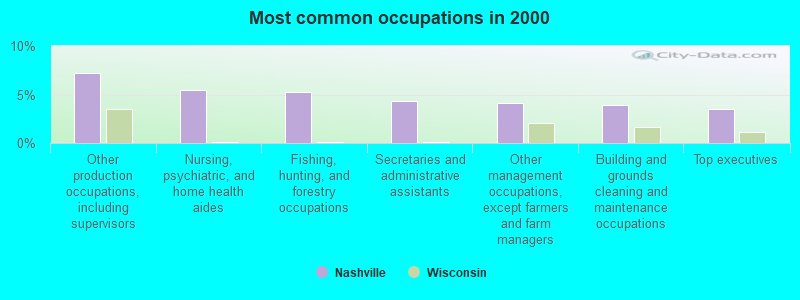
- Other production occupations, including supervisors (7.2%)
- Nursing, psychiatric, and home health aides (5.5%)
- Fishing, hunting, and forestry occupations (5.2%)
- Secretaries and administrative assistants (4.4%)
- Other management occupations, except farmers and farm managers (4.1%)
- Building and grounds cleaning and maintenance occupations (3.9%)
- Top executives (3.5%)
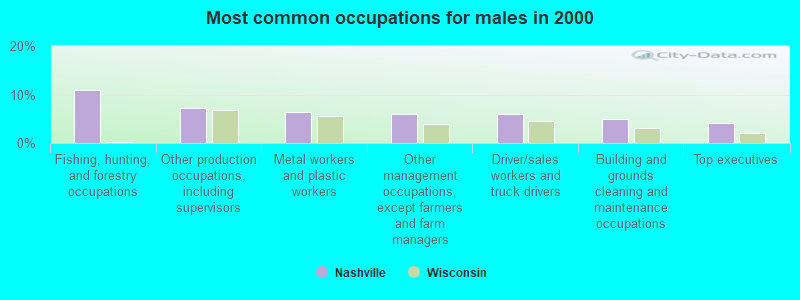
- Fishing, hunting, and forestry occupations (10.9%)
- Other production occupations, including supervisors (7.3%)
- Metal workers and plastic workers (6.4%)
- Other management occupations, except farmers and farm managers (5.9%)
- Driver/sales workers and truck drivers (5.9%)
- Building and grounds cleaning and maintenance occupations (5.0%)
- Top executives (4.1%)
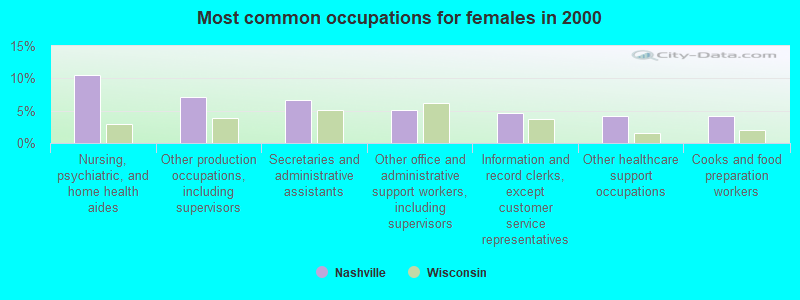
- Nursing, psychiatric, and home health aides (10.5%)
- Other production occupations, including supervisors (7.1%)
- Secretaries and administrative assistants (6.7%)
- Other office and administrative support workers, including supervisors (5.0%)
- Information and record clerks, except customer service representatives (4.6%)
- Other healthcare support occupations (4.2%)
- Cooks and food preparation workers (4.2%)
Average climate in Nashville, Wisconsin
Based on data reported by over 4,000 weather stations


(lower is better)
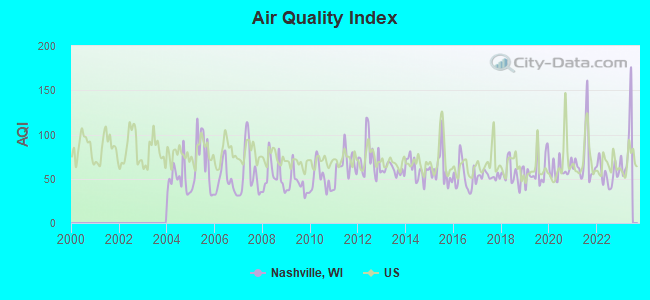
Air Quality Index (AQI) level in 2022 was 55.7. This is better than average.
| City: | 55.7 |
| U.S.: | 72.6 |
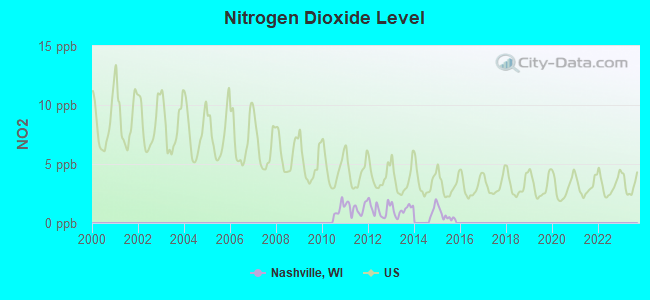
Nitrogen Dioxide (NO2) [ppb] level in 2015 was 0.642. This is significantly better than average. Closest monitor was 9.1 miles away from the city center.
| City: | 0.642 |
| U.S.: | 5.109 |
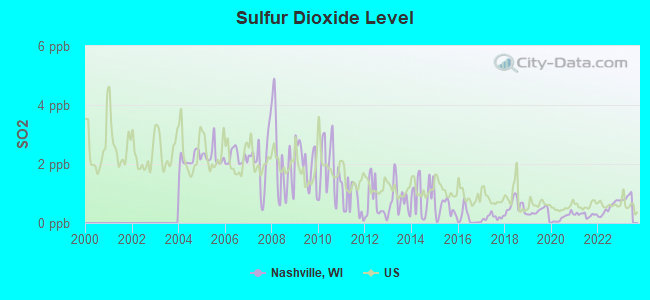
Sulfur Dioxide (SO2) [ppb] level in 2022 was 0.502. This is significantly better than average. Closest monitor was 3.2 miles away from the city center.
| City: | 0.502 |
| U.S.: | 1.515 |
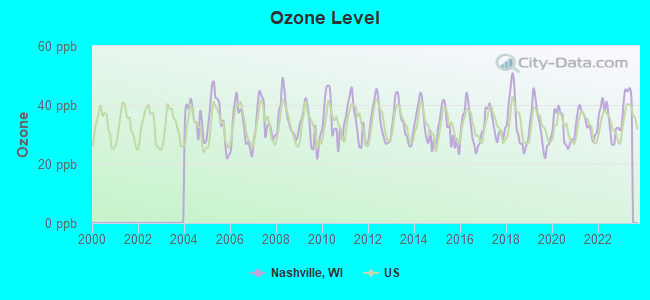
Ozone [ppb] level in 2022 was 34.5. This is about average. Closest monitor was 9.1 miles away from the city center.
| City: | 34.5 |
| U.S.: | 33.3 |
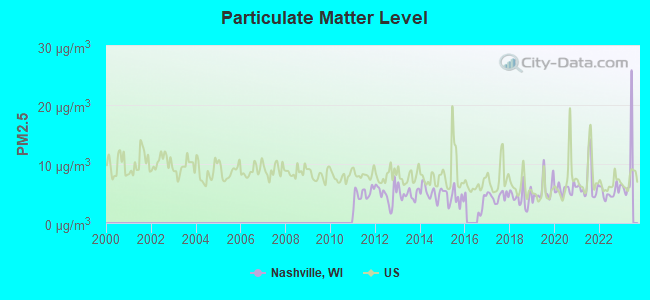
Particulate Matter (PM2.5) [µg/m3] level in 2022 was 5.26. This is significantly better than average. Closest monitor was 9.1 miles away from the city center.
| City: | 5.26 |
| U.S.: | 8.11 |
Tornado activity:
Nashville-area historical tornado activity is below Wisconsin state average. It is 37% smaller than the overall U.S. average.
On 6/25/1950, a category F4 (max. wind speeds 207-260 mph) tornado 25.2 miles away from the Nashville town center killed 2 people and injured 12 people and caused between $50,000 and $500,000 in damages.
On 6/8/1985, a category F3 (max. wind speeds 158-206 mph) tornado 12.2 miles away from the town center killed 2 people and injured 42 people and caused between $5,000,000 and $50,000,000 in damages.
Earthquake activity:
Nashville-area historical earthquake activity is significantly above Wisconsin state average. It is 80% smaller than the overall U.S. average.On 6/28/2004 at 06:10:52, a magnitude 4.2 (4.2 MW, Depth: 6.2 mi, Class: Light, Intensity: IV - V) earthquake occurred 276.3 miles away from the city center
On 7/9/1975 at 14:54:15, a magnitude 4.6 (4.6 MB) earthquake occurred 345.5 miles away from the city center
On 5/2/2015 at 16:23:07, a magnitude 4.2 (4.2 MW, Depth: 2.8 mi) earthquake occurred 282.3 miles away from the city center
On 2/10/2010 at 09:59:35, a magnitude 3.8 (3.8 MW, Depth: 6.2 mi, Class: Light, Intensity: II - III) earthquake occurred 242.0 miles away from Nashville center
On 1/31/1986 at 16:46:43, a magnitude 5.0 (5.0 MB, Class: Moderate, Intensity: VI - VII) earthquake occurred 470.9 miles away from Nashville center
On 9/25/1998 at 19:52:52, a magnitude 5.2 (4.8 MB, 4.3 MS, 5.2 LG, 4.5 MW, Depth: 3.1 mi) earthquake occurred 507.3 miles away from Nashville center
Magnitude types: regional Lg-wave magnitude (LG), body-wave magnitude (MB), surface-wave magnitude (MS), moment magnitude (MW)
Natural disasters:
The number of natural disasters in Forest County (6) is a lot smaller than the US average (15).Major Disasters (Presidential) Declared: 2
Emergencies Declared: 3
Causes of natural disasters: Floods: 2, Storms: 2, Tornadoes: 2, Winds: 2, Drought: 1, Hurricane: 1, Other: 1 (Note: some incidents may be assigned to more than one category).

Colleges/universities with over 2000 students nearest to Nashville:
- Northcentral Technical College (about 49 miles; Wausau, WI; Full-time enrollment: 3,356)
- University of Wisconsin-Stevens Point (about 72 miles; Stevens Point, WI; FT enrollment: 9,089)
- Northeast Wisconsin Technical College (about 76 miles; Green Bay, WI; FT enrollment: 6,069)
- University of Wisconsin-Green Bay (about 81 miles; Green Bay, WI; FT enrollment: 5,415)
- Saint Norbert College (about 82 miles; De Pere, WI; FT enrollment: 2,324)
- Fox Valley Technical College (about 84 miles; Appleton, WI; FT enrollment: 5,682)
- Mid-State Technical College (about 86 miles; Wisconsin Rapids, WI; FT enrollment: 2,128)
Points of interest:
Notable locations in Nashville: Sherman Corners (A), Pickerel Volunteer Fire and Rescue Station 1 (B). Display/hide their locations on the map
Cemetery: Nashville Cemetery (1). Display/hide its location on the map
Lakes and reservoirs: Oak Lake (A), Pickerel Lake (B), Saint Johns Lake (C), Rice Lake (D), Walsh Lake (E), Bishop Lake (F), Crane Lake (G), Crystal Lake (H). Display/hide their locations on the map
Streams, rivers, and creeks: Gliske Creek (A), Squaw Creek (B), Bog Brook (C), Logan Creek (D). Display/hide their locations on the map
Park in Nashville: Bog Brook State Wildlife Area (1). Display/hide its location on the map
| This town: | 2.4 people |
| Wisconsin: | 2.4 people |
| This town: | 66.3% |
| Whole state: | 64.4% |
| This town: | 11.6% |
| Whole state: | 7.3% |
Likely homosexual households (counted as self-reported same-sex unmarried-partner households)
- Lesbian couples: 0.7% of all households
- Gay men: 1.1% of all households
| This town: | 16.8% |
| Whole state: | 8.7% |
| This town: | 6.2% |
| Whole state: | 3.7% |
For population 15 years and over in Nashville:
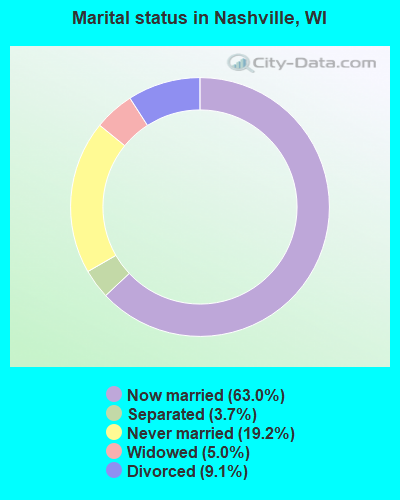
- Never married: 19.2%
- Now married: 63.0%
- Separated: 3.7%
- Widowed: 5.0%
- Divorced: 9.1%
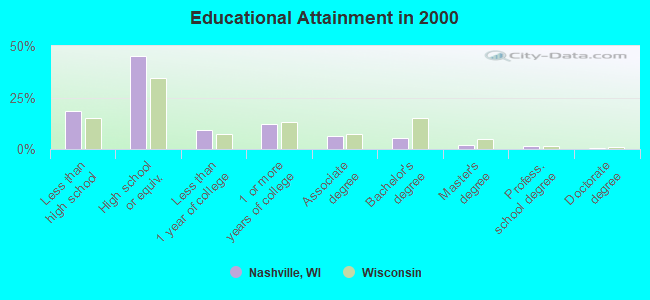
For population 25 years and over in Nashville:
- High school or higher: 81.3%
- Bachelor's degree or higher: 8.5%
- Graduate or professional degree: 3.4%
- Unemployed: 13.4%
- Mean travel time to work (commute): 21.7 minutes
| Here: | 8.6 |
| Wisconsin average: | 11.0 |
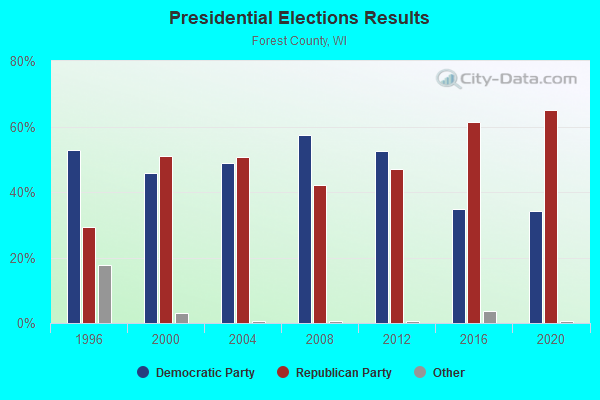
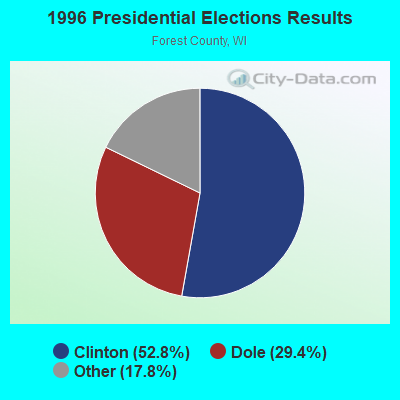
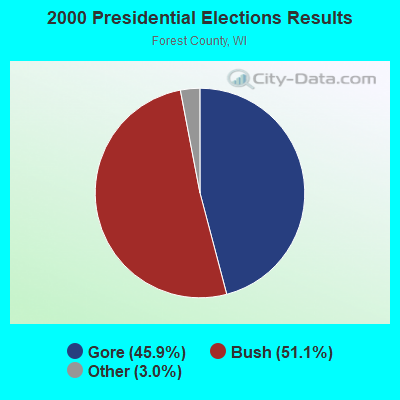
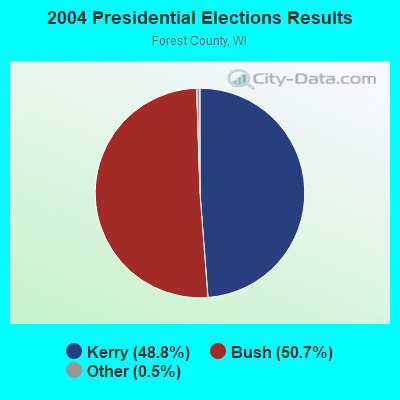
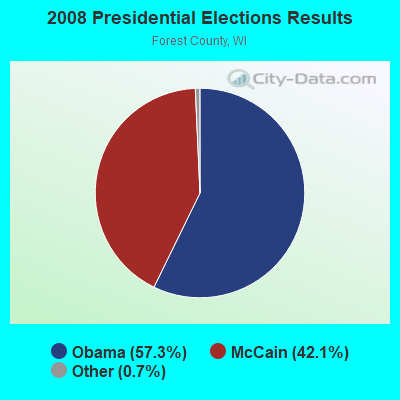
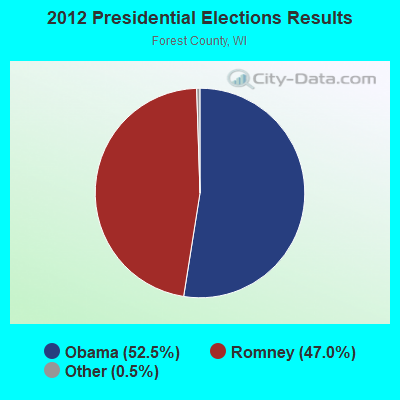
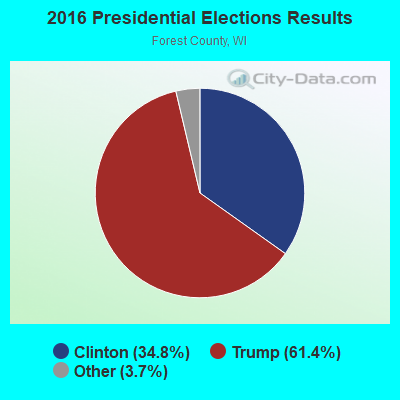
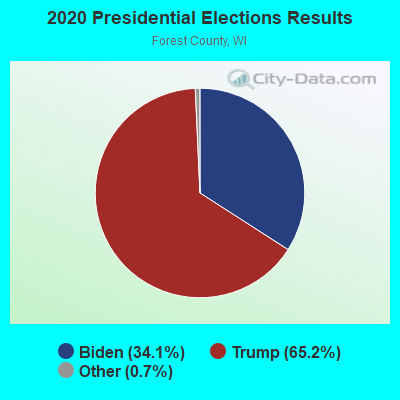
Graphs represent county-level data. Detailed 2008 Election Results
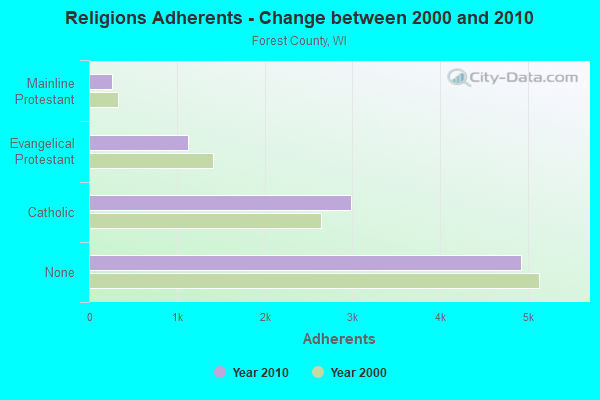
Religion statistics for Nashville, WI (based on Forest County data)
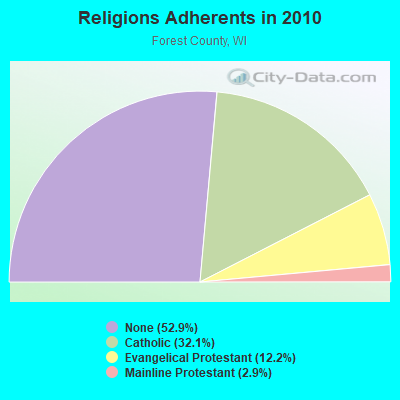
| Religion | Adherents | Congregations |
|---|---|---|
| Catholic | 2,984 | 5 |
| Evangelical Protestant | 1,132 | 11 |
| Mainline Protestant | 266 | 4 |
| Other | 2 | 3 |
| None | 4,920 | - |
Food Environment Statistics:
| Here: | 2.04 / 10,000 pop. |
| Wisconsin: | 1.86 / 10,000 pop. |
| Forest County: | 6.13 / 10,000 pop. |
| Wisconsin: | 4.12 / 10,000 pop. |
| This county: | 14.30 / 10,000 pop. |
| Wisconsin: | 8.64 / 10,000 pop. |
| Here: | 9.9% |
| State: | 7.6% |
| Here: | 28.5% |
| Wisconsin: | 27.5% |
| This county: | 19.3% |
| Wisconsin: | 13.0% |
Strongest AM radio stations in Nashville:
- WSAU (550 AM; 20 kW; WAUSAU, WI; Owner: WRIG, INC.)
- WSPT (1010 AM; 50 kW; STEVENS POINT, WI)
- WNAM (1280 AM; 50 kW; NEENAH-MENASHA, WI; Owner: CUMULUS LICENSING CORP.)
- WEBC (560 AM; 50 kW; DULUTH, MN)
- WRIG (1390 AM; 10 kW; SCHOFIELD, WI; Owner: WRIG, INC.)
- WHBY (1150 AM; 25 kW; KIMBERLY, WI; Owner: WOODWARD COMMUNICATIONS, INC.)
- WTCM (580 AM; 35 kW; TRAVERSE CITY, MI; Owner: WTCM RADIO, INC.)
- WTMJ (620 AM; 50 kW; MILWAUKEE, WI; Owner: JOURNAL BROADCAST CORPORATION)
- WDBC (680 AM; 10 kW; ESCANABA, MI; Owner: KMB BROADCASTING, INC.)
- WLKD (1570 AM; 5 kW; MINOCQUA, WI; Owner: RAVEN BROADCASTING CORPORATION)
- WLDR (1210 AM; daytime; 50 kW; KINGSLEY, MI; Owner: FORT BEND BROADCASTING COMPANY)
- WCCO (830 AM; 50 kW; MINNEAPOLIS, MN; Owner: INFINITY MEDIA CORPORATION)
- WCTS (1030 AM; 50 kW; MAPLEWOOD, MN; Owner: CNTL. BAPT. THEO/AL SEMI MINNEAPOLIS)
Strongest FM radio stations in Nashville:
- WRLO-FM (105.3 FM; ANTIGO, WI; Owner: NEWRADIO GROUP, LLC)
- WHDG (97.5 FM; RHINELANDER, WI; Owner: RAVEN BROADCASTING CORPORATION)
- WYCO (107.9 FM; WAUSAU, WI; Owner: SEEHAFER BROADCASTING CORPORATION)
- WRVM (102.7 FM; SURING, WI; Owner: WRVM, INC.)
- WXPR (91.7 FM; RHINELANDER, WI; Owner: WHITE PINE COMMUNITY B/CASTING, INC.)
- WACD (106.1 FM; ANTIGO, WI; Owner: NEWRADIO GROUP, LLC)
TV broadcast stations around Nashville:
- WBIJ (Channel 4; CRANDON, WI; Owner: SELENKA COMMUNICATIONS, LLC)
- WYOW (Channel 34; EAGLE RIVER, WI; Owner: WAOW-WYOW TELEVISION, INC.)
- WJFW-TV (Channel 12; RHINELANDER, WI; Owner: NORTHLAND TELEVISION, INC.)
- WTPX (Channel 46; ANTIGO, WI; Owner: PAXSON WAUSAU LICENSE, INC.)
- WFXS (Channel 55; WITTENBERG, WI; Owner: DAVIS TELEVISION WAUSAU, LLC)
- W54AR (Channel 54; FENCE, WI; Owner: STATE OF WISCONSIN - EDUCATIONAL COMMUNICATIONS BOARD)
- National Bridge Inventory (NBI) Statistics
- 3Number of bridges
- 20ft / 6.1mTotal length
- 5,082Total average daily traffic
- 458Total average daily truck traffic
- 7,430Total future (year 2039) average daily traffic
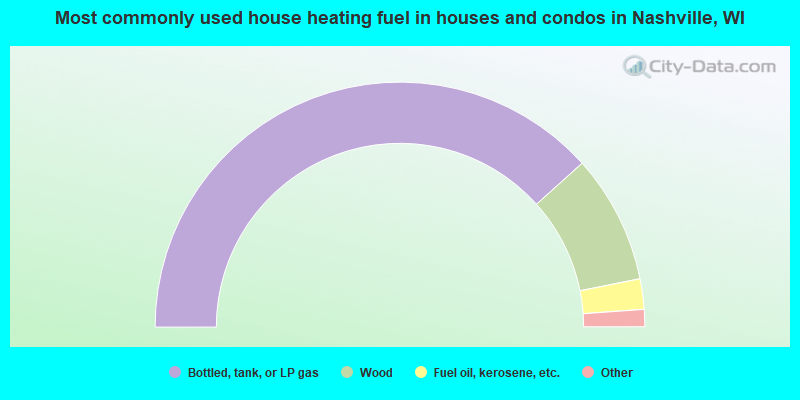
- 76.7%Bottled, tank, or LP gas
- 17.0%Wood
- 4.0%Fuel oil, kerosene, etc.
- 1.7%Electricity
- 0.6%Utility gas
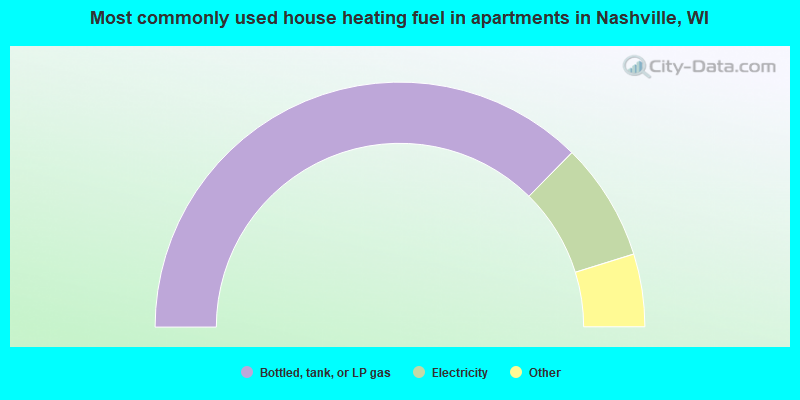
- 74.8%Bottled, tank, or LP gas
- 15.6%Electricity
- 3.0%Fuel oil, kerosene, etc.
- 3.0%Wood
- 2.2%Utility gas
- 1.5%Other fuel
Nashville compared to Wisconsin state average:
- Black race population percentage significantly below state average.
- Hispanic race population percentage significantly below state average.
- Foreign-born population percentage significantly below state average.
- Length of stay since moving in significantly above state average.
- Number of rooms per house significantly below state average.
- House age significantly below state average.
- Percentage of population with a bachelor's degree or higher significantly below state average.