Newburgh, Indiana Submit your own pictures of this town and show them to the world
OSM Map
General Map
Google Map
MSN Map
OSM Map
General Map
Google Map
MSN Map
OSM Map
General Map
Google Map
MSN Map
OSM Map
General Map
Google Map
MSN Map
Please wait while loading the map...
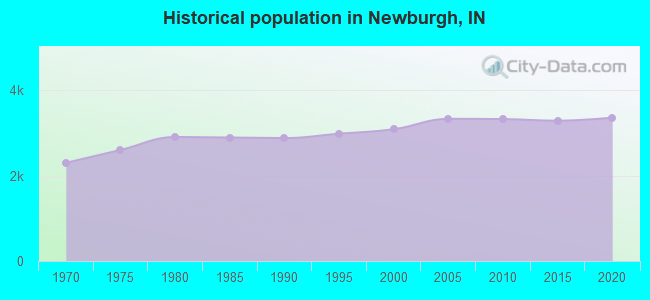
Population in 2022: 3,402 (100% urban, 0% rural). Population change since 2000: +10.2%Males: 1,763 Females: 1,639
March 2022 cost of living index in Newburgh: 82.2 (low, U.S. average is 100) Percentage of residents living in poverty in 2022: 7.8%
Profiles of local businesses
Business Search - 14 Million verified businesses
Data:
Median household income ($)
Median household income (% change since 2000)
Household income diversity
Ratio of average income to average house value (%)
Ratio of average income to average rent
Median household income ($) - White
Median household income ($) - Black or African American
Median household income ($) - Asian
Median household income ($) - Hispanic or Latino
Median household income ($) - American Indian and Alaska Native
Median household income ($) - Multirace
Median household income ($) - Other Race
Median household income for houses/condos with a mortgage ($)
Median household income for apartments without a mortgage ($)
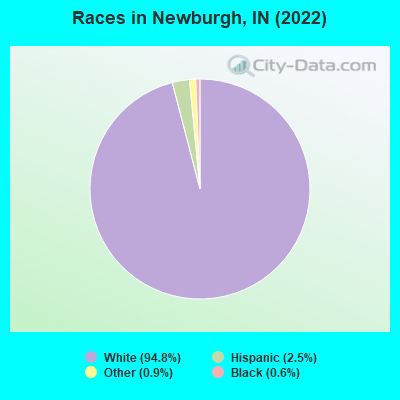
Races - White alone (%)
Races - White alone (% change since 2000)
Races - Black alone (%)
Races - Black alone (% change since 2000)
Races - American Indian alone (%)
Races - American Indian alone (% change since 2000)
Races - Asian alone (%)
Races - Asian alone (% change since 2000)
Races - Hispanic (%)
Races - Hispanic (% change since 2000)
Races - Native Hawaiian and Other Pacific Islander alone (%)
Races - Native Hawaiian and Other Pacific Islander alone (% change since 2000)
Races - Two or more races (%)
Races - Two or more races (% change since 2000)
Races - Other race alone (%)
Races - Other race alone (% change since 2000)
Racial diversity
Unemployment (%)
Unemployment (% change since 2000)
Unemployment (%) - White
Unemployment (%) - Black or African American
Unemployment (%) - Asian
Unemployment (%) - Hispanic or Latino
Unemployment (%) - American Indian and Alaska Native
Unemployment (%) - Multirace
Unemployment (%) - Other Race
Population density (people per square mile)
Population - Males (%)
Population - Females (%)
Population - Males (%) - White
Population - Males (%) - Black or African American
Population - Males (%) - Asian
Population - Males (%) - Hispanic or Latino
Population - Males (%) - American Indian and Alaska Native
Population - Males (%) - Multirace
Population - Males (%) - Other Race
Population - Females (%) - White
Population - Females (%) - Black or African American
Population - Females (%) - Asian
Population - Females (%) - Hispanic or Latino
Population - Females (%) - American Indian and Alaska Native
Population - Females (%) - Multirace
Population - Females (%) - Other Race
Coronavirus confirmed cases (Apr 23, 2024)
Deaths caused by coronavirus (Apr 23, 2024)
Coronavirus confirmed cases (per 100k population) (Apr 23, 2024)
Deaths caused by coronavirus (per 100k population) (Apr 23, 2024)
Daily increase in number of cases (Apr 23, 2024)
Weekly increase in number of cases (Apr 23, 2024)
Cases doubled (in days) (Apr 23, 2024)
Hospitalized patients (Apr 18, 2022)
Negative test results (Apr 18, 2022)
Total test results (Apr 18, 2022)
COVID Vaccine doses distributed (per 100k population) (Sep 19, 2023)
COVID Vaccine doses administered (per 100k population) (Sep 19, 2023)
COVID Vaccine doses distributed (Sep 19, 2023)
COVID Vaccine doses administered (Sep 19, 2023)
Likely homosexual households (%)
Likely homosexual households (% change since 2000)
Likely homosexual households - Lesbian couples (%)
Likely homosexual households - Lesbian couples (% change since 2000)
Likely homosexual households - Gay men (%)
Likely homosexual households - Gay men (% change since 2000)
Cost of living index
Median gross rent ($)
Median contract rent ($)
Median monthly housing costs ($)
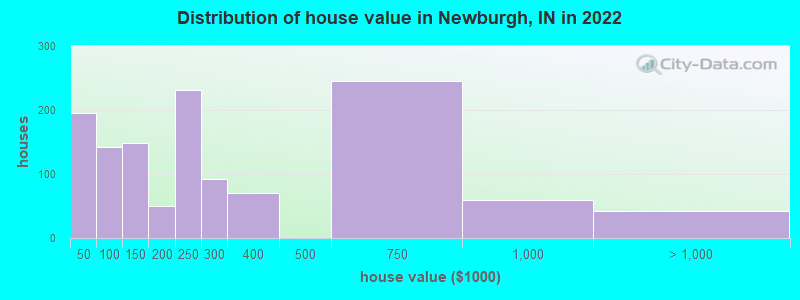
Median house or condo value ($)
Median house or condo value ($ change since 2000)
Mean house or condo value by units in structure - 1, detached ($)
Mean house or condo value by units in structure - 1, attached ($)
Mean house or condo value by units in structure - 2 ($)
Mean house or condo value by units in structure by units in structure - 3 or 4 ($)
Mean house or condo value by units in structure - 5 or more ($)
Mean house or condo value by units in structure - Boat, RV, van, etc. ($)
Mean house or condo value by units in structure - Mobile home ($)
Median house or condo value ($) - White
Median house or condo value ($) - Black or African American
Median house or condo value ($) - Asian
Median house or condo value ($) - Hispanic or Latino
Median house or condo value ($) - American Indian and Alaska Native
Median house or condo value ($) - Multirace
Median house or condo value ($) - Other Race
Median resident age
Resident age diversity
Median resident age - Males
Median resident age - Females
Median resident age - White
Median resident age - Black or African American
Median resident age - Asian
Median resident age - Hispanic or Latino
Median resident age - American Indian and Alaska Native
Median resident age - Multirace
Median resident age - Other Race
Median resident age - Males - White
Median resident age - Males - Black or African American
Median resident age - Males - Asian
Median resident age - Males - Hispanic or Latino
Median resident age - Males - American Indian and Alaska Native
Median resident age - Males - Multirace
Median resident age - Males - Other Race
Median resident age - Females - White
Median resident age - Females - Black or African American
Median resident age - Females - Asian
Median resident age - Females - Hispanic or Latino
Median resident age - Females - American Indian and Alaska Native
Median resident age - Females - Multirace
Median resident age - Females - Other Race
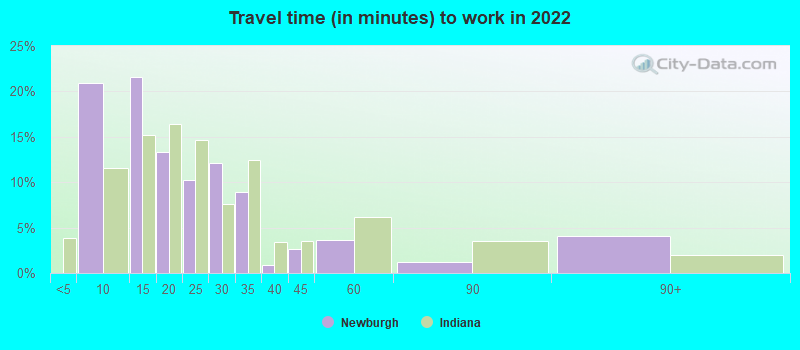
Commute - mean travel time to work (minutes)
Travel time to work - Less than 5 minutes (%)
Travel time to work - Less than 5 minutes (% change since 2000)
Travel time to work - 5 to 9 minutes (%)
Travel time to work - 5 to 9 minutes (% change since 2000)
Travel time to work - 10 to 19 minutes (%)
Travel time to work - 10 to 19 minutes (% change since 2000)
Travel time to work - 20 to 29 minutes (%)
Travel time to work - 20 to 29 minutes (% change since 2000)
Travel time to work - 30 to 39 minutes (%)
Travel time to work - 30 to 39 minutes (% change since 2000)
Travel time to work - 40 to 59 minutes (%)
Travel time to work - 40 to 59 minutes (% change since 2000)
Travel time to work - 60 to 89 minutes (%)
Travel time to work - 60 to 89 minutes (% change since 2000)
Travel time to work - 90 or more minutes (%)
Travel time to work - 90 or more minutes (% change since 2000)
Marital status - Never married (%)
Marital status - Now married (%)
Marital status - Separated (%)
Marital status - Widowed (%)
Marital status - Divorced (%)
Median family income ($)
Median family income (% change since 2000)
Median non-family income ($)
Median non-family income (% change since 2000)
Median per capita income ($)
Median per capita income (% change since 2000)
Median family income ($) - White
Median family income ($) - Black or African American
Median family income ($) - Asian
Median family income ($) - Hispanic or Latino
Median family income ($) - American Indian and Alaska Native
Median family income ($) - Multirace
Median family income ($) - Other Race
Median year house/condo built
Median year apartment built
Year house built - Built 2005 or later (%)
Year house built - Built 2000 to 2004 (%)
Year house built - Built 1990 to 1999 (%)
Year house built - Built 1980 to 1989 (%)
Year house built - Built 1970 to 1979 (%)
Year house built - Built 1960 to 1969 (%)
Year house built - Built 1950 to 1959 (%)
Year house built - Built 1940 to 1949 (%)
Year house built - Built 1939 or earlier (%)
Average household size
Household density (households per square mile)
Average household size - White
Average household size - Black or African American
Average household size - Asian
Average household size - Hispanic or Latino
Average household size - American Indian and Alaska Native
Average household size - Multirace
Average household size - Other Race
Occupied housing units (%)
Vacant housing units (%)
Owner occupied housing units (%)
Renter occupied housing units (%)
Vacancy status - For rent (%)
Vacancy status - For sale only (%)
Vacancy status - Rented or sold, not occupied (%)
Vacancy status - For seasonal, recreational, or occasional use (%)
Vacancy status - For migrant workers (%)
Vacancy status - Other vacant (%)
Residents with income below the poverty level (%)
Residents with income below 50% of the poverty level (%)
Children below poverty level (%)
Poor families by family type - Married-couple family (%)
Poor families by family type - Male, no wife present (%)
Poor families by family type - Female, no husband present (%)
Poverty status for native-born residents (%)
Poverty status for foreign-born residents (%)
Poverty among high school graduates not in families (%)
Poverty among people who did not graduate high school not in families (%)
Residents with income below the poverty level (%) - White
Residents with income below the poverty level (%) - Black or African American
Residents with income below the poverty level (%) - Asian
Residents with income below the poverty level (%) - Hispanic or Latino
Residents with income below the poverty level (%) - American Indian and Alaska Native
Residents with income below the poverty level (%) - Multirace
Residents with income below the poverty level (%) - Other Race
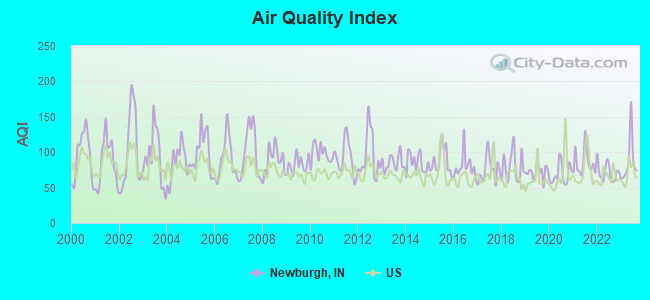
Air pollution - Air Quality Index (AQI)
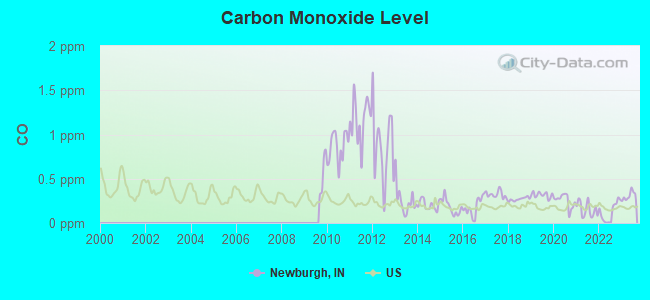
Air pollution - CO
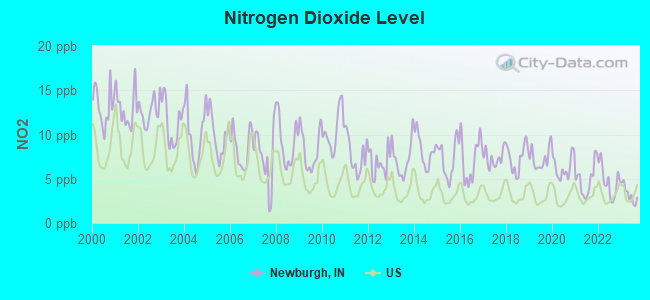
Air pollution - NO2
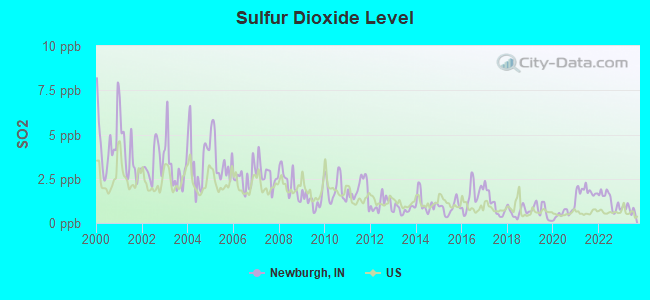
Air pollution - SO2
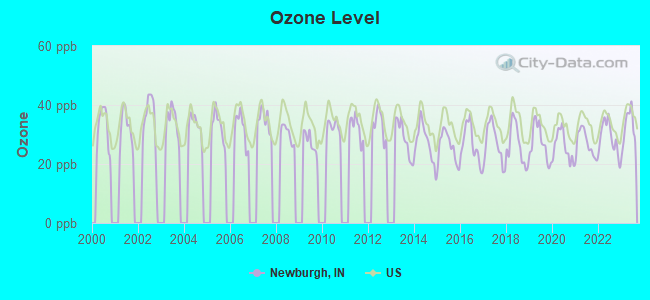
Air pollution - Ozone
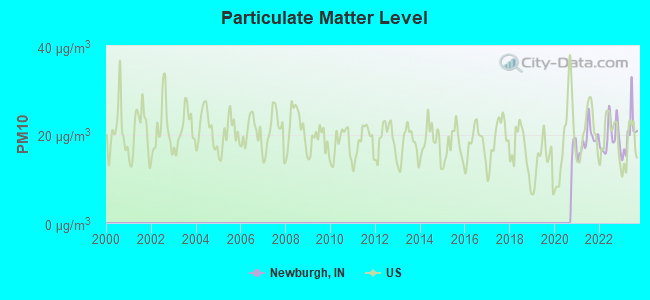
Air pollution - PM10
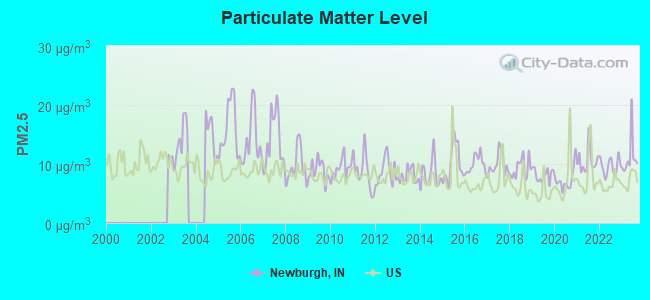
Air pollution - PM25
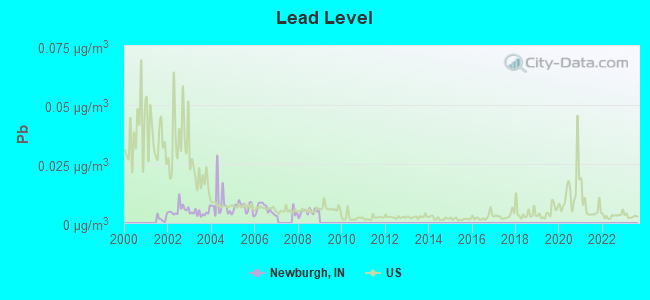
Air pollution - Pb
Crime - Murders per 100,000 population
Crime - Rapes per 100,000 population
Crime - Robberies per 100,000 population
Crime - Assaults per 100,000 population
Crime - Burglaries per 100,000 population
Crime - Thefts per 100,000 population
Crime - Auto thefts per 100,000 population
Crime - Arson per 100,000 population
Crime - City-data.com crime index
Crime - Violent crime index
Crime - Property crime index
Crime - Murders per 100,000 population (5 year average)
Crime - Rapes per 100,000 population (5 year average)
Crime - Robberies per 100,000 population (5 year average)
Crime - Assaults per 100,000 population (5 year average)
Crime - Burglaries per 100,000 population (5 year average)
Crime - Thefts per 100,000 population (5 year average)
Crime - Auto thefts per 100,000 population (5 year average)
Crime - Arson per 100,000 population (5 year average)
Crime - City-data.com crime index (5 year average)
Crime - Violent crime index (5 year average)
Crime - Property crime index (5 year average)
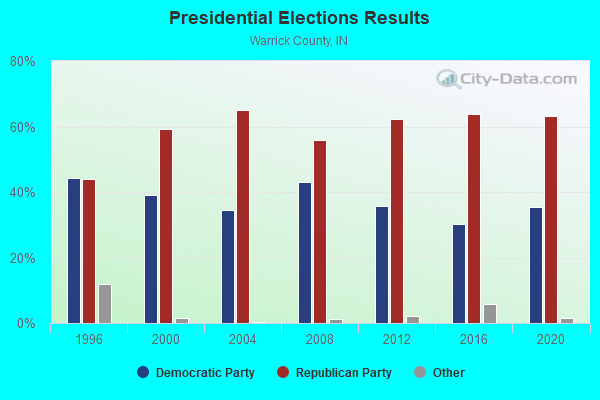
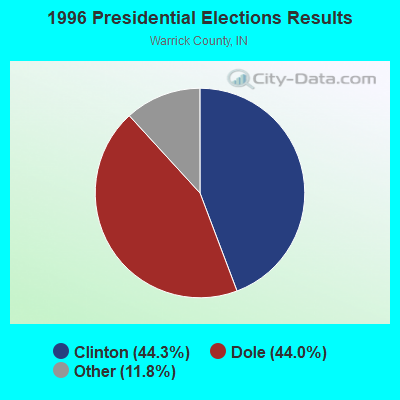
1996 Presidential Elections Results (%) - Democratic Party (Clinton)
1996 Presidential Elections Results (%) - Republican Party (Dole)
1996 Presidential Elections Results (%) - Other
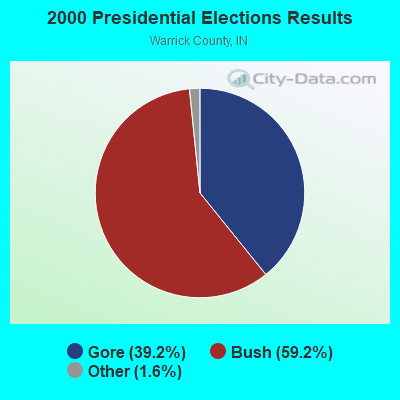
2000 Presidential Elections Results (%) - Democratic Party (Gore)
2000 Presidential Elections Results (%) - Republican Party (Bush)
2000 Presidential Elections Results (%) - Other
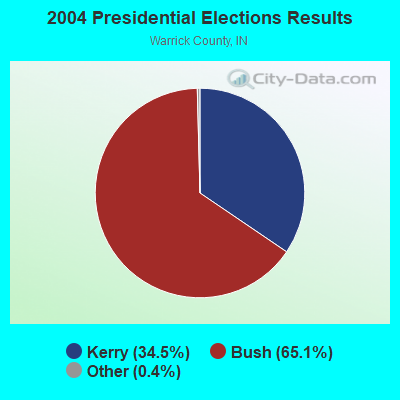
2004 Presidential Elections Results (%) - Democratic Party (Kerry)
2004 Presidential Elections Results (%) - Republican Party (Bush)
2004 Presidential Elections Results (%) - Other
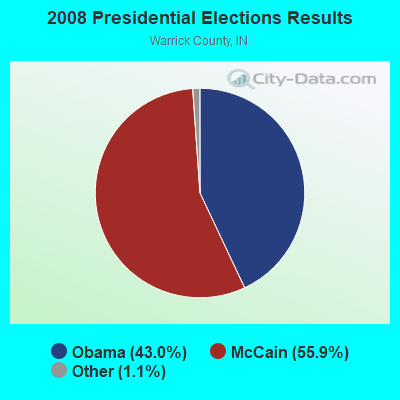
2008 Presidential Elections Results (%) - Democratic Party (Obama)
2008 Presidential Elections Results (%) - Republican Party (McCain)
2008 Presidential Elections Results (%) - Other
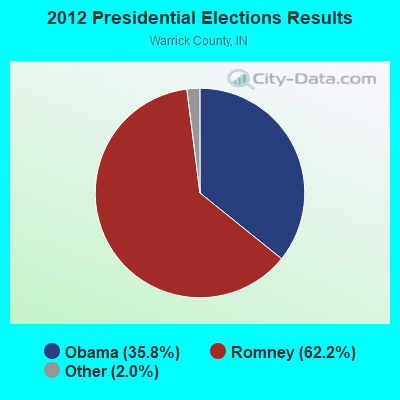
2012 Presidential Elections Results (%) - Democratic Party (Obama)
2012 Presidential Elections Results (%) - Republican Party (Romney)
2012 Presidential Elections Results (%) - Other
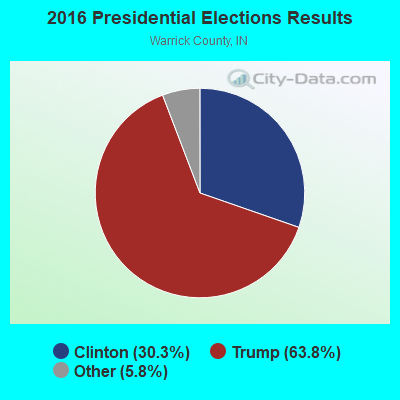
2016 Presidential Elections Results (%) - Democratic Party (Clinton)
2016 Presidential Elections Results (%) - Republican Party (Trump)
2016 Presidential Elections Results (%) - Other
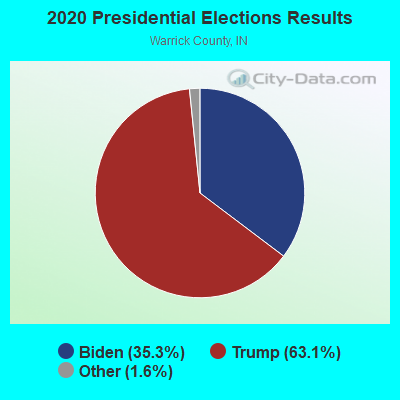
2020 Presidential Elections Results (%) - Democratic Party (Biden)
2020 Presidential Elections Results (%) - Republican Party (Trump)
2020 Presidential Elections Results (%) - Other
Ancestries Reported - Arab (%)
Ancestries Reported - Czech (%)
Ancestries Reported - Danish (%)
Ancestries Reported - Dutch (%)
Ancestries Reported - English (%)
Ancestries Reported - French (%)
Ancestries Reported - French Canadian (%)
Ancestries Reported - German (%)
Ancestries Reported - Greek (%)
Ancestries Reported - Hungarian (%)
Ancestries Reported - Irish (%)
Ancestries Reported - Italian (%)
Ancestries Reported - Lithuanian (%)
Ancestries Reported - Norwegian (%)
Ancestries Reported - Polish (%)
Ancestries Reported - Portuguese (%)
Ancestries Reported - Russian (%)
Ancestries Reported - Scotch-Irish (%)
Ancestries Reported - Scottish (%)
Ancestries Reported - Slovak (%)
Ancestries Reported - Subsaharan African (%)
Ancestries Reported - Swedish (%)
Ancestries Reported - Swiss (%)
Ancestries Reported - Ukrainian (%)
Ancestries Reported - United States (%)
Ancestries Reported - Welsh (%)
Ancestries Reported - West Indian (%)
Ancestries Reported - Other (%)
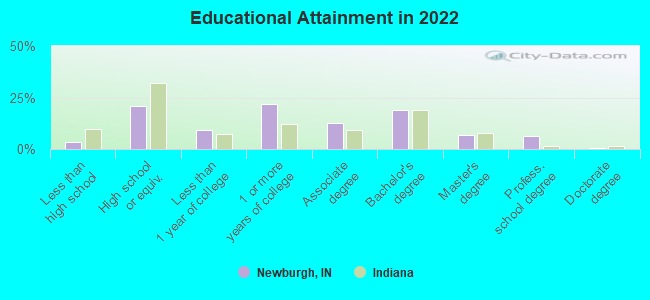
Educational Attainment - No schooling completed (%)
Educational Attainment - Less than high school (%)
Educational Attainment - High school or equivalent (%)
Educational Attainment - Less than 1 year of college (%)
Educational Attainment - 1 or more years of college (%)
Educational Attainment - Associate degree (%)
Educational Attainment - Bachelor's degree (%)
Educational Attainment - Master's degree (%)
Educational Attainment - Professional school degree (%)
Educational Attainment - Doctorate degree (%)
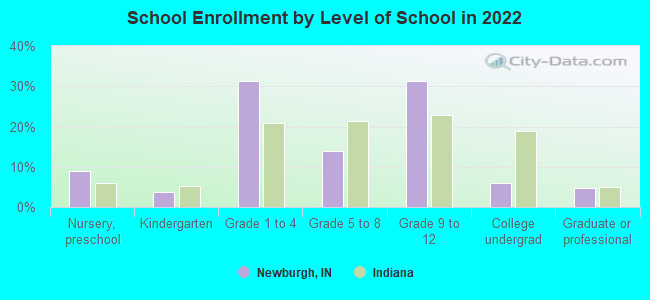
School Enrollment - Nursery, preschool (%)
School Enrollment - Kindergarten (%)
School Enrollment - Grade 1 to 4 (%)
School Enrollment - Grade 5 to 8 (%)
School Enrollment - Grade 9 to 12 (%)
School Enrollment - College undergrad (%)
School Enrollment - Graduate or professional (%)
School Enrollment - Not enrolled in school (%)
School enrollment - Public schools (%)
School enrollment - Private schools (%)
School enrollment - Not enrolled (%)
Median number of rooms in houses and condos
Median number of rooms in apartments
Housing units lacking complete plumbing facilities (%)
Housing units lacking complete kitchen facilities (%)
Density of houses
Urban houses (%)
Rural houses (%)
Households with people 60 years and over (%)
Households with people 65 years and over (%)
Households with people 75 years and over (%)
Households with one or more nonrelatives (%)
Households with no nonrelatives (%)
Population in households (%)
Family households (%)
Nonfamily households (%)
Population in families (%)
Family households with own children (%)
Median number of bedrooms in owner occupied houses
Mean number of bedrooms in owner occupied houses
Median number of bedrooms in renter occupied houses
Mean number of bedrooms in renter occupied houses
Median number of vehichles in owner occupied houses
Mean number of vehichles in owner occupied houses
Median number of vehichles in renter occupied houses
Mean number of vehichles in renter occupied houses
Mortgage status - with mortgage (%)
Mortgage status - with second mortgage (%)
Mortgage status - with home equity loan (%)
Mortgage status - with both second mortgage and home equity loan (%)
Mortgage status - without a mortgage (%)
Average family size
Average family size - White
Average family size - Black or African American
Average family size - Asian
Average family size - Hispanic or Latino
Average family size - American Indian and Alaska Native
Average family size - Multirace
Average family size - Other Race
Geographical mobility - Same house 1 year ago (%)
Geographical mobility - Moved within same county (%)
Geographical mobility - Moved from different county within same state (%)
Geographical mobility - Moved from different state (%)
Geographical mobility - Moved from abroad (%)
Place of birth - Born in state of residence (%)
Place of birth - Born in other state (%)
Place of birth - Native, outside of US (%)
Place of birth - Foreign born (%)
Housing units in structures - 1, detached (%)
Housing units in structures - 1, attached (%)
Housing units in structures - 2 (%)
Housing units in structures - 3 or 4 (%)
Housing units in structures - 5 to 9 (%)
Housing units in structures - 10 to 19 (%)
Housing units in structures - 20 to 49 (%)
Housing units in structures - 50 or more (%)
Housing units in structures - Mobile home (%)
Housing units in structures - Boat, RV, van, etc. (%)
House/condo owner moved in on average (years ago)
Renter moved in on average (years ago)
Year householder moved into unit - Moved in 1999 to March 2000 (%)
Year householder moved into unit - Moved in 1995 to 1998 (%)
Year householder moved into unit - Moved in 1990 to 1994 (%)
Year householder moved into unit - Moved in 1980 to 1989 (%)
Year householder moved into unit - Moved in 1970 to 1979 (%)
Year householder moved into unit - Moved in 1969 or earlier (%)
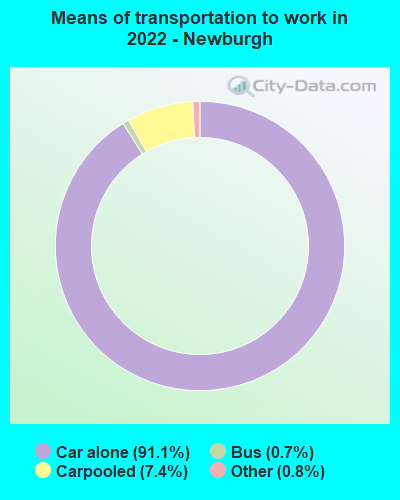
Means of transportation to work - Drove car alone (%)
Means of transportation to work - Carpooled (%)
Means of transportation to work - Public transportation (%)
Means of transportation to work - Bus or trolley bus (%)
Means of transportation to work - Streetcar or trolley car (%)
Means of transportation to work - Subway or elevated (%)
Means of transportation to work - Railroad (%)
Means of transportation to work - Ferryboat (%)
Means of transportation to work - Taxicab (%)
Means of transportation to work - Motorcycle (%)
Means of transportation to work - Bicycle (%)
Means of transportation to work - Walked (%)
Means of transportation to work - Other means (%)
Working at home (%)
Industry diversity
Most Common Industries - Agriculture, forestry, fishing and hunting, and mining (%)
Most Common Industries - Agriculture, forestry, fishing and hunting (%)
Most Common Industries - Mining, quarrying, and oil and gas extraction (%)
Most Common Industries - Construction (%)
Most Common Industries - Manufacturing (%)
Most Common Industries - Wholesale trade (%)
Most Common Industries - Retail trade (%)
Most Common Industries - Transportation and warehousing, and utilities (%)
Most Common Industries - Transportation and warehousing (%)
Most Common Industries - Utilities (%)
Most Common Industries - Information (%)
Most Common Industries - Finance and insurance, and real estate and rental and leasing (%)
Most Common Industries - Finance and insurance (%)
Most Common Industries - Real estate and rental and leasing (%)
Most Common Industries - Professional, scientific, and management, and administrative and waste management services (%)
Most Common Industries - Professional, scientific, and technical services (%)
Most Common Industries - Management of companies and enterprises (%)
Most Common Industries - Administrative and support and waste management services (%)
Most Common Industries - Educational services, and health care and social assistance (%)
Most Common Industries - Educational services (%)
Most Common Industries - Health care and social assistance (%)
Most Common Industries - Arts, entertainment, and recreation, and accommodation and food services (%)
Most Common Industries - Arts, entertainment, and recreation (%)
Most Common Industries - Accommodation and food services (%)
Most Common Industries - Other services, except public administration (%)
Most Common Industries - Public administration (%)
Occupation diversity
Most Common Occupations - Management, business, science, and arts occupations (%)
Most Common Occupations - Management, business, and financial occupations (%)
Most Common Occupations - Management occupations (%)
Most Common Occupations - Business and financial operations occupations (%)
Most Common Occupations - Computer, engineering, and science occupations (%)
Most Common Occupations - Computer and mathematical occupations (%)
Most Common Occupations - Architecture and engineering occupations (%)
Most Common Occupations - Life, physical, and social science occupations (%)
Most Common Occupations - Education, legal, community service, arts, and media occupations (%)
Most Common Occupations - Community and social service occupations (%)
Most Common Occupations - Legal occupations (%)
Most Common Occupations - Education, training, and library occupations (%)
Most Common Occupations - Arts, design, entertainment, sports, and media occupations (%)
Most Common Occupations - Healthcare practitioners and technical occupations (%)
Most Common Occupations - Health diagnosing and treating practitioners and other technical occupations (%)
Most Common Occupations - Health technologists and technicians (%)
Most Common Occupations - Service occupations (%)
Most Common Occupations - Healthcare support occupations (%)
Most Common Occupations - Protective service occupations (%)
Most Common Occupations - Fire fighting and prevention, and other protective service workers including supervisors (%)
Most Common Occupations - Law enforcement workers including supervisors (%)
Most Common Occupations - Food preparation and serving related occupations (%)
Most Common Occupations - Building and grounds cleaning and maintenance occupations (%)
Most Common Occupations - Personal care and service occupations (%)
Most Common Occupations - Sales and office occupations (%)
Most Common Occupations - Sales and related occupations (%)
Most Common Occupations - Office and administrative support occupations (%)
Most Common Occupations - Natural resources, construction, and maintenance occupations (%)
Most Common Occupations - Farming, fishing, and forestry occupations (%)
Most Common Occupations - Construction and extraction occupations (%)
Most Common Occupations - Installation, maintenance, and repair occupations (%)
Most Common Occupations - Production, transportation, and material moving occupations (%)
Most Common Occupations - Production occupations (%)
Most Common Occupations - Transportation occupations (%)
Most Common Occupations - Material moving occupations (%)
People in Group quarters - Institutionalized population (%)
People in Group quarters - Correctional institutions (%)
People in Group quarters - Federal prisons and detention centers (%)
People in Group quarters - Halfway houses (%)
People in Group quarters - Local jails and other confinement facilities (including police lockups) (%)
People in Group quarters - Military disciplinary barracks (%)
People in Group quarters - State prisons (%)
People in Group quarters - Other types of correctional institutions (%)
People in Group quarters - Nursing homes (%)
People in Group quarters - Hospitals/wards, hospices, and schools for the handicapped (%)
People in Group quarters - Hospitals/wards and hospices for chronically ill (%)
People in Group quarters - Hospices or homes for chronically ill (%)
People in Group quarters - Military hospitals or wards for chronically ill (%)
People in Group quarters - Other hospitals or wards for chronically ill (%)
People in Group quarters - Hospitals or wards for drug/alcohol abuse (%)
People in Group quarters - Mental (Psychiatric) hospitals or wards (%)
People in Group quarters - Schools, hospitals, or wards for the mentally retarded (%)
People in Group quarters - Schools, hospitals, or wards for the physically handicapped (%)
People in Group quarters - Institutions for the deaf (%)
People in Group quarters - Institutions for the blind (%)
People in Group quarters - Orthopedic wards and institutions for the physically handicapped (%)
People in Group quarters - Wards in general hospitals for patients who have no usual home elsewhere (%)
People in Group quarters - Wards in military hospitals for patients who have no usual home elsewhere (%)
People in Group quarters - Juvenile institutions (%)
People in Group quarters - Long-term care (%)
People in Group quarters - Homes for abused, dependent, and neglected children (%)
People in Group quarters - Residential treatment centers for emotionally disturbed children (%)
People in Group quarters - Training schools for juvenile delinquents (%)
People in Group quarters - Short-term care, detention or diagnostic centers for delinquent children (%)
People in Group quarters - Type of juvenile institution unknown (%)
People in Group quarters - Noninstitutionalized population (%)
People in Group quarters - College dormitories (includes college quarters off campus) (%)
People in Group quarters - Military quarters (%)
People in Group quarters - On base (%)
People in Group quarters - Barracks, unaccompanied personnel housing (UPH), (Enlisted/Officer), ;and similar group living quarters for military personnel (%)
People in Group quarters - Transient quarters for temporary residents (%)
People in Group quarters - Military ships (%)
People in Group quarters - Group homes (%)
People in Group quarters - Homes or halfway houses for drug/alcohol abuse (%)
People in Group quarters - Homes for the mentally ill (%)
People in Group quarters - Homes for the mentally retarded (%)
People in Group quarters - Homes for the physically handicapped (%)
People in Group quarters - Other group homes (%)
People in Group quarters - Religious group quarters (%)
People in Group quarters - Dormitories (%)
People in Group quarters - Agriculture workers' dormitories on farms (%)
People in Group quarters - Job Corps and vocational training facilities (%)
People in Group quarters - Other workers' dormitories (%)
People in Group quarters - Crews of maritime vessels (%)
People in Group quarters - Other nonhousehold living situations (%)
People in Group quarters - Other noninstitutional group quarters (%)
Residents speaking English at home (%)
Residents speaking English at home - Born in the United States (%)
Residents speaking English at home - Native, born elsewhere (%)
Residents speaking English at home - Foreign born (%)
Residents speaking Spanish at home (%)
Residents speaking Spanish at home - Born in the United States (%)
Residents speaking Spanish at home - Native, born elsewhere (%)
Residents speaking Spanish at home - Foreign born (%)
Residents speaking other language at home (%)
Residents speaking other language at home - Born in the United States (%)
Residents speaking other language at home - Native, born elsewhere (%)
Residents speaking other language at home - Foreign born (%)
Class of Workers - Employee of private company (%)
Class of Workers - Self-employed in own incorporated business (%)
Class of Workers - Private not-for-profit wage and salary workers (%)
Class of Workers - Local government workers (%)
Class of Workers - State government workers (%)
Class of Workers - Federal government workers (%)
Class of Workers - Self-employed workers in own not incorporated business and Unpaid family workers (%)
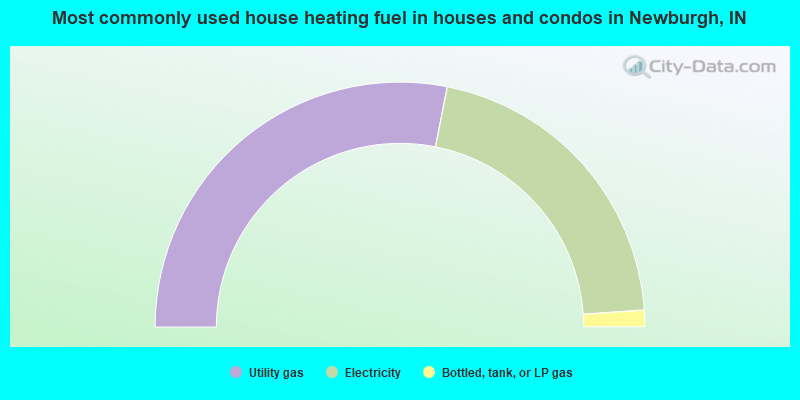
House heating fuel used in houses and condos - Utility gas (%)
House heating fuel used in houses and condos - Bottled, tank, or LP gas (%)
House heating fuel used in houses and condos - Electricity (%)
House heating fuel used in houses and condos - Fuel oil, kerosene, etc. (%)
House heating fuel used in houses and condos - Coal or coke (%)
House heating fuel used in houses and condos - Wood (%)
House heating fuel used in houses and condos - Solar energy (%)
House heating fuel used in houses and condos - Other fuel (%)
House heating fuel used in houses and condos - No fuel used (%)
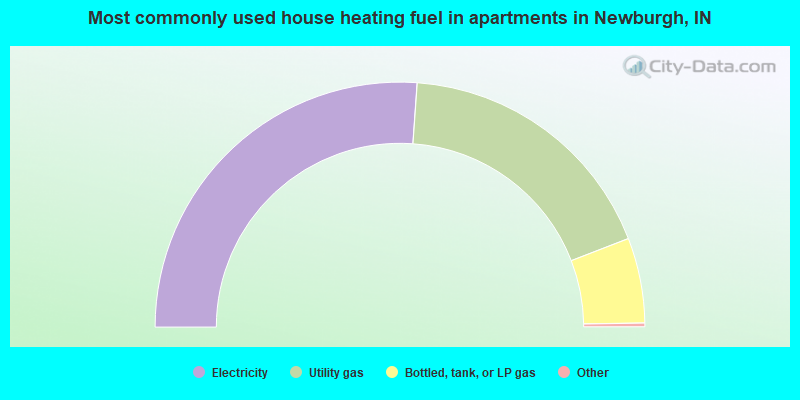
House heating fuel used in apartments - Utility gas (%)
House heating fuel used in apartments - Bottled, tank, or LP gas (%)
House heating fuel used in apartments - Electricity (%)
House heating fuel used in apartments - Fuel oil, kerosene, etc. (%)
House heating fuel used in apartments - Coal or coke (%)
House heating fuel used in apartments - Wood (%)
House heating fuel used in apartments - Solar energy (%)
House heating fuel used in apartments - Other fuel (%)
House heating fuel used in apartments - No fuel used (%)
Armed forces status - In Armed Forces (%)
Armed forces status - Civilian (%)
Armed forces status - Civilian - Veteran (%)
Armed forces status - Civilian - Nonveteran (%)
Fatal accidents locations in years 2005-2021
Fatal accidents locations in 2005
Fatal accidents locations in 2006
Fatal accidents locations in 2007
Fatal accidents locations in 2008
Fatal accidents locations in 2009
Fatal accidents locations in 2010
Fatal accidents locations in 2011
Fatal accidents locations in 2012
Fatal accidents locations in 2013
Fatal accidents locations in 2014
Fatal accidents locations in 2015
Fatal accidents locations in 2016
Fatal accidents locations in 2017
Fatal accidents locations in 2018
Fatal accidents locations in 2019
Fatal accidents locations in 2020
Fatal accidents locations in 2021
Alcohol use - People drinking some alcohol every month (%)
Alcohol use - People not drinking at all (%)
Alcohol use - Average days/month drinking alcohol
Alcohol use - Average drinks/week
Alcohol use - Average days/year people drink much
Audiometry - Average condition of hearing (%)
Audiometry - People that can hear a whisper from across a quiet room (%)
Audiometry - People that can hear normal voice from across a quiet room (%)
Audiometry - Ears ringing, roaring, buzzing (%)
Audiometry - Had a job exposure to loud noise (%)
Audiometry - Had off-work exposure to loud noise (%)
Blood Pressure & Cholesterol - Has high blood pressure (%)
Blood Pressure & Cholesterol - Checking blood pressure at home (%)
Blood Pressure & Cholesterol - Frequently checking blood cholesterol (%)
Blood Pressure & Cholesterol - Has high cholesterol level (%)
Consumer Behavior - Money monthly spent on food at supermarket/grocery store
Consumer Behavior - Money monthly spent on food at other stores
Consumer Behavior - Money monthly spent on eating out
Consumer Behavior - Money monthly spent on carryout/delivered foods
Consumer Behavior - Income spent on food at supermarket/grocery store (%)
Consumer Behavior - Income spent on food at other stores (%)
Consumer Behavior - Income spent on eating out (%)
Consumer Behavior - Income spent on carryout/delivered foods (%)
Current Health Status - General health condition (%)
Current Health Status - Blood donors (%)
Current Health Status - Has blood ever tested for HIV virus (%)
Current Health Status - Left-handed people (%)
Dermatology - People using sunscreen (%)
Diabetes - Diabetics (%)
Diabetes - Had a blood test for high blood sugar (%)
Diabetes - People taking insulin (%)
Diet Behavior & Nutrition - Diet health (%)
Diet Behavior & Nutrition - Milk product consumption (# of products/month)
Diet Behavior & Nutrition - Meals not home prepared (#/week)
Diet Behavior & Nutrition - Meals from fast food or pizza place (#/week)
Diet Behavior & Nutrition - Ready-to-eat foods (#/month)
Diet Behavior & Nutrition - Frozen meals/pizza (#/month)
Drug Use - People that ever used marijuana or hashish (%)
Drug Use - Ever used hard drugs (%)
Drug Use - Ever used any form of cocaine (%)
Drug Use - Ever used heroin (%)
Drug Use - Ever used methamphetamine (%)
Health Insurance - People covered by health insurance (%)
Kidney Conditions-Urology - Avg. # of times urinating at night
Medical Conditions - People with asthma (%)
Medical Conditions - People with anemia (%)
Medical Conditions - People with psoriasis (%)
Medical Conditions - People with overweight (%)
Medical Conditions - Elderly people having difficulties in thinking or remembering (%)
Medical Conditions - People who ever received blood transfusion (%)
Medical Conditions - People having trouble seeing even with glass/contacts (%)
Medical Conditions - People with arthritis (%)
Medical Conditions - People with gout (%)
Medical Conditions - People with congestive heart failure (%)
Medical Conditions - People with coronary heart disease (%)
Medical Conditions - People with angina pectoris (%)
Medical Conditions - People who ever had heart attack (%)
Medical Conditions - People who ever had stroke (%)
Medical Conditions - People with emphysema (%)
Medical Conditions - People with thyroid problem (%)
Medical Conditions - People with chronic bronchitis (%)
Medical Conditions - People with any liver condition (%)
Medical Conditions - People who ever had cancer or malignancy (%)
Mental Health - People who have little interest in doing things (%)
Mental Health - People feeling down, depressed, or hopeless (%)
Mental Health - People who have trouble sleeping or sleeping too much (%)
Mental Health - People feeling tired or having little energy (%)
Mental Health - People with poor appetite or overeating (%)
Mental Health - People feeling bad about themself (%)
Mental Health - People who have trouble concentrating on things (%)
Mental Health - People moving or speaking slowly or too fast (%)
Mental Health - People having thoughts they would be better off dead (%)
Oral Health - Average years since last visit a dentist
Oral Health - People embarrassed because of mouth (%)
Oral Health - People with gum disease (%)
Oral Health - General health of teeth and gums (%)
Oral Health - Average days a week using dental floss/device
Oral Health - Average days a week using mouthwash for dental problem
Oral Health - Average number of teeth
Pesticide Use - Households using pesticides to control insects (%)
Pesticide Use - Households using pesticides to kill weeds (%)
Physical Activity - People doing vigorous-intensity work activities (%)
Physical Activity - People doing moderate-intensity work activities (%)
Physical Activity - People walking or bicycling (%)
Physical Activity - People doing vigorous-intensity recreational activities (%)
Physical Activity - People doing moderate-intensity recreational activities (%)
Physical Activity - Average hours a day doing sedentary activities
Physical Activity - Average hours a day watching TV or videos
Physical Activity - Average hours a day using computer
Physical Functioning - People having limitations keeping them from working (%)
Physical Functioning - People limited in amount of work they can do (%)
Physical Functioning - People that need special equipment to walk (%)
Physical Functioning - People experiencing confusion/memory problems (%)
Physical Functioning - People requiring special healthcare equipment (%)
Prescription Medications - Average number of prescription medicines taking
Preventive Aspirin Use - Adults 40+ taking low-dose aspirin (%)
Reproductive Health - Vaginal deliveries (%)
Reproductive Health - Cesarean deliveries (%)
Reproductive Health - Deliveries resulted in a live birth (%)
Reproductive Health - Pregnancies resulted in a delivery (%)
Reproductive Health - Women breastfeeding newborns (%)
Reproductive Health - Women that had a hysterectomy (%)
Reproductive Health - Women that had both ovaries removed (%)
Reproductive Health - Women that have ever taken birth control pills (%)
Reproductive Health - Women taking birth control pills (%)
Reproductive Health - Women that have ever used Depo-Provera or injectables (%)
Reproductive Health - Women that have ever used female hormones (%)
Sexual Behavior - People 18+ that ever had sex (vaginal, anal, or oral) (%)
Sexual Behavior - Males 18+ that ever had vaginal sex with a woman (%)
Sexual Behavior - Males 18+ that ever performed oral sex on a woman (%)
Sexual Behavior - Males 18+ that ever had anal sex with a woman (%)
Sexual Behavior - Males 18+ that ever had any sex with a man (%)
Sexual Behavior - Females 18+ that ever had vaginal sex with a man (%)
Sexual Behavior - Females 18+ that ever performed oral sex on a man (%)
Sexual Behavior - Females 18+ that ever had anal sex with a man (%)
Sexual Behavior - Females 18+ that ever had any kind of sex with a woman (%)
Sexual Behavior - Average age people first had sex
Sexual Behavior - Average number of female sex partners in lifetime (males 18+)
Sexual Behavior - Average number of female vaginal sex partners in lifetime (males 18+)
Sexual Behavior - Average age people first performed oral sex on a woman (18+)
Sexual Behavior - Average number of woman performed oral sex on in lifetime (18+)
Sexual Behavior - Average number of male sex partners in lifetime (males 18+)
Sexual Behavior - Average number of male anal sex partners in lifetime (males 18+)
Sexual Behavior - Average age people first performed oral sex on a man (18+)
Sexual Behavior - Average number of male oral sex partners in lifetime (18+)
Sexual Behavior - People using protection when performing oral sex (%)
Sexual Behavior - Average number of times people have vaginal or anal sex a year
Sexual Behavior - People having sex without condom (%)
Sexual Behavior - Average number of male sex partners in lifetime (females 18+)
Sexual Behavior - Average number of male vaginal sex partners in lifetime (females 18+)
Sexual Behavior - Average number of female sex partners in lifetime (females 18+)
Sexual Behavior - Circumcised males 18+ (%)
Sleep Disorders - Average hours sleeping at night
Sleep Disorders - People that has trouble sleeping (%)
Smoking-Cigarette Use - People smoking cigarettes (%)
Taste & Smell - People 40+ having problems with smell (%)
Taste & Smell - People 40+ having problems with taste (%)
Taste & Smell - People 40+ that ever had wisdom teeth removed (%)
Taste & Smell - People 40+ that ever had tonsils teeth removed (%)
Taste & Smell - People 40+ that ever had a loss of consciousness because of a head injury (%)
Taste & Smell - People 40+ that ever had a broken nose or other serious injury to face or skull (%)
Taste & Smell - People 40+ that ever had two or more sinus infections (%)
Weight - Average height (inches)
Weight - Average weight (pounds)
Weight - Average BMI
Weight - People that are obese (%)
Weight - People that ever were obese (%)
Weight - People trying to lose weight (%)
According to our research of Indiana and other state lists, there were 4 registered sex offenders living in Newburgh, Indiana as of April 22, 2024 . The ratio of all residents to sex offenders in Newburgh is 830 to 1.The ratio of registered sex offenders to all residents in this city is lower than the state average.
Latest news from Newburgh, IN collected exclusively by city-data.com from local newspapers, TV, and radio stations
Ancestries: German (44.8%), English (19.6%), American (10.0%), Irish (7.9%), Dutch (2.0%), European (1.8%).
Current Local Time:
Land area: 1.36 square miles.
Population density: 2,506 people per square mile (average).
41 residents are foreign born
This town:
1.3%Indiana:
3.1%
Median real estate property taxes paid for housing units with mortgages in 2022: $1,676 (0.7%)Median real estate property taxes paid for housing units with no mortgage in 2022: $913 (0.8%)
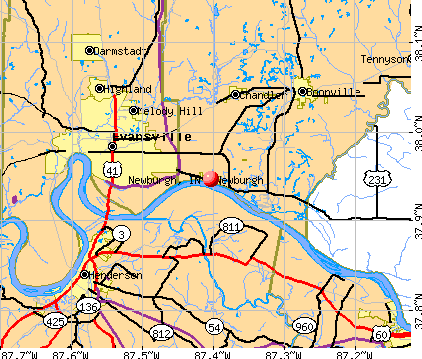
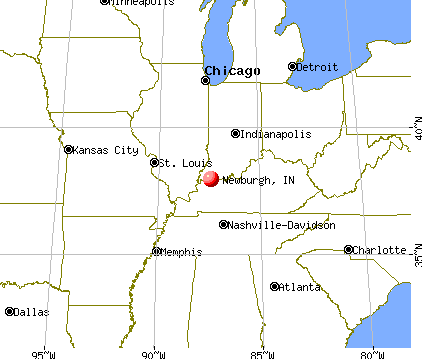
Nearest city with pop. 50,000+: Evansville, IN
Nearest city with pop. 200,000+: Louisville, KY
Nearest city with pop. 1,000,000+: Chicago, IL
Nearest cities:
Latitude: 37.95 N, Longitude: 87.40 W
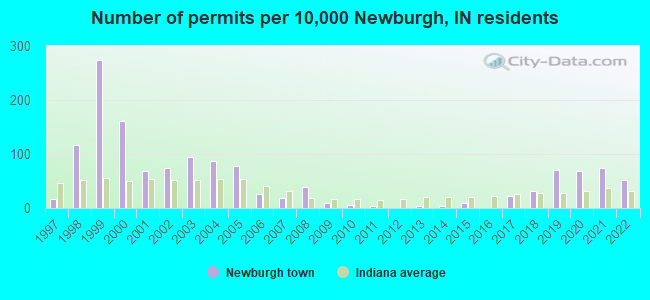
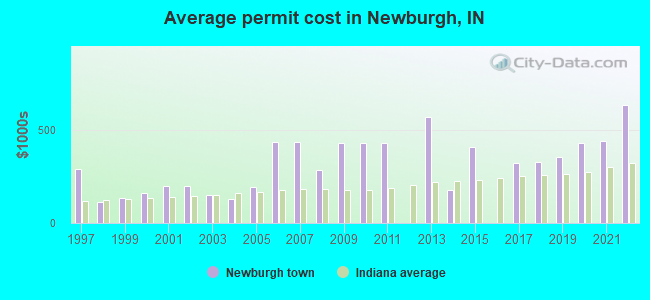
Single-family new house construction building permits:
2022: 16 buildings , average cost: $635,0002021: 23 buildings , average cost: $438,7002020: 21 buildings , average cost: $429,0002019: 22 buildings , average cost: $355,2002018: 10 buildings , average cost: $329,5002017: 7 buildings , average cost: $323,1002015: 3 buildings , average cost: $406,7002014: 1 building , cost: $175,0002013: 1 building , cost: $570,0002011: 1 building , cost: $433,3002010: 2 buildings , average cost: $433,3002009: 3 buildings , average cost: $433,3002008: 12 buildings , average cost: $283,6002007: 6 buildings , average cost: $435,8002006: 8 buildings , average cost: $435,8002005: 24 buildings , average cost: $193,8002004: 27 buildings , average cost: $128,5002003: 29 buildings , average cost: $150,0002002: 23 buildings , average cost: $201,0002001: 21 buildings , average cost: $201,0002000: 50 buildings , average cost: $161,0001999: 85 buildings , average cost: $131,5001998: 36 buildings , average cost: $113,9001997: 5 buildings , average cost: $290,000Unemployment in December 2023:
Population change in the 1990s: +67 (+2.2%).
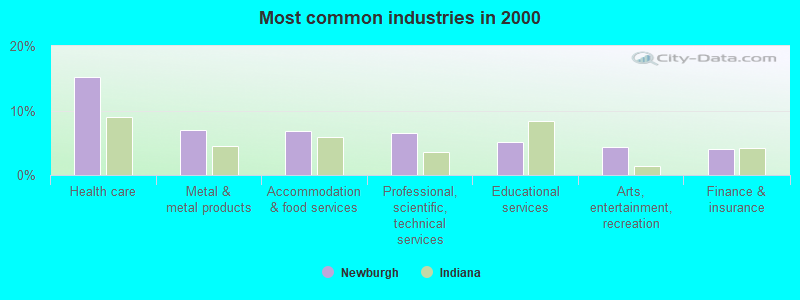
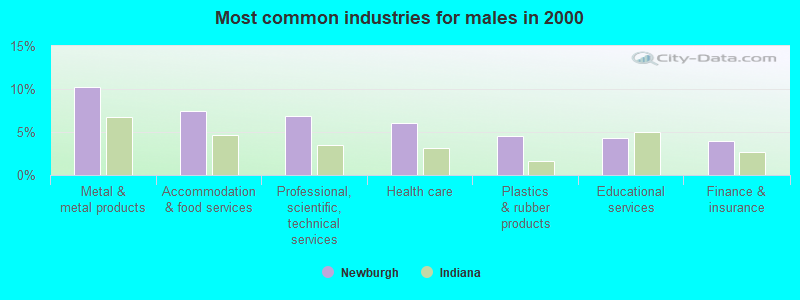
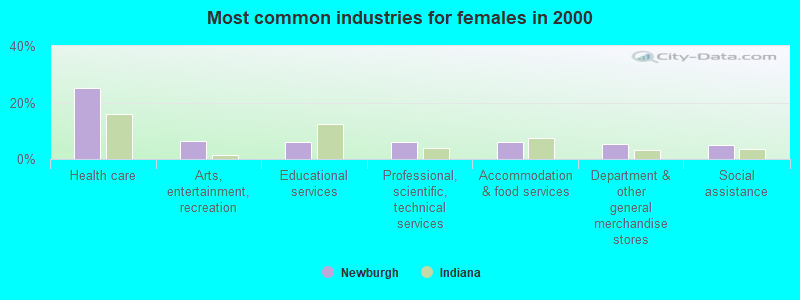
Most common industries in Newburgh, IN (%)
Both Males Females
Health care (15.1%)
Metal & metal products (6.9%)
Accommodation & food services (6.7%)
Professional, scientific, technical services (6.5%)
Educational services (5.1%)
Arts, entertainment, recreation (4.4%)
Finance & insurance (4.0%)
Metal & metal products (10.3%)
Accommodation & food services (7.4%)
Professional, scientific, technical services (6.9%)
Health care (6.1%)
Plastics & rubber products (4.5%)
Educational services (4.3%)
Finance & insurance (4.0%)
Health care (25.3%)
Arts, entertainment, recreation (6.3%)
Educational services (6.0%)
Professional, scientific, technical services (6.0%)
Accommodation & food services (6.0%)
Department & other general merchandise stores (5.4%)
Social assistance (4.8%)
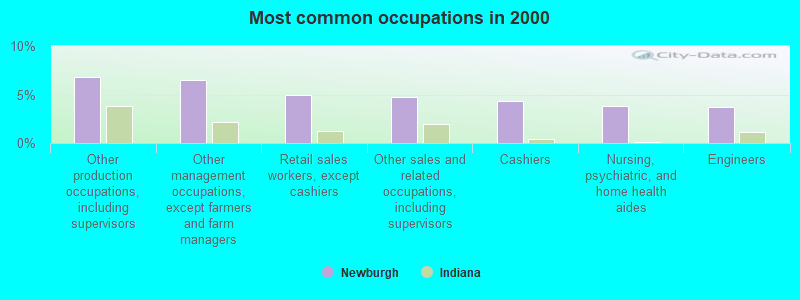
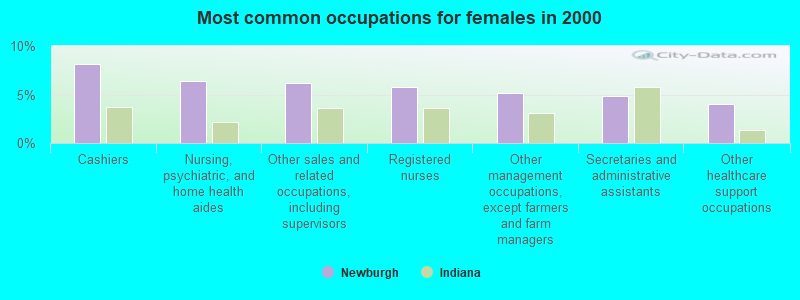
Most common occupations in Newburgh, IN (%)
Both Males Females
Other production occupations, including supervisors (6.8%)
Other management occupations, except farmers and farm managers (6.5%)
Retail sales workers, except cashiers (4.9%)
Other sales and related occupations, including supervisors (4.8%)
Cashiers (4.4%)
Nursing, psychiatric, and home health aides (3.9%)
Engineers (3.7%)
Other production occupations, including supervisors (9.7%)
Retail sales workers, except cashiers (7.8%)
Other management occupations, except farmers and farm managers (7.7%)
Engineers (7.1%)
Operations specialties managers, except financial managers (6.1%)
Sales representatives, services, wholesale and manufacturing (4.4%)
Other sales and related occupations, including supervisors (3.5%)
Cashiers (8.2%)
Nursing, psychiatric, and home health aides (6.4%)
Other sales and related occupations, including supervisors (6.1%)
Registered nurses (5.8%)
Other management occupations, except farmers and farm managers (5.2%)
Secretaries and administrative assistants (4.8%)
Other healthcare support occupations (4.0%)
Tornado activity:
Newburgh-area historical tornado activity is slightly below Indiana state average. It is 55% greater than the overall U.S. average.
On 4/3/1974, a category F5 (max. wind speeds 261-318 mph) tornado 36.6 miles away from the Newburgh town center killed 6 people and injured 86 people and caused between $50,000,000 and $500,000,000 in damages.
On 11/15/1955, a category F3 (max. wind speeds 158-206 mph) tornado 7.1 miles away from the town center injured 9 people and caused between $50,000 and $500,000 in damages.
Earthquake activity:
Newburgh-area historical earthquake activity is significantly above Indiana state average. It is 200% greater than the overall U.S. average. On 4/18/2008 at 09:36:59, a magnitude 5.4 (5.1 MB, 4.8 MS, 5.4 MW, 5.2 MW, Class: Moderate, Intensity: VI - VII) earthquake occurred 43.7 miles away from Newburgh center On 4/18/2008 at 09:36:59, a magnitude 5.2 (5.2 MW, Depth: 8.9 mi) earthquake occurred 43.7 miles away from Newburgh center On 6/18/2002 at 17:37:15, a magnitude 5.0 (4.3 MB, 4.6 MW, 5.0 LG) earthquake occurred 20.7 miles away from Newburgh center On 6/10/1987 at 23:48:54, a magnitude 5.1 (4.9 MB, 4.4 MS, 4.6 MS, 5.1 LG) earthquake occurred 65.9 miles away from the city center On 4/18/2008 at 15:14:16, a magnitude 4.8 (4.5 MB, 4.8 MW, 4.6 MW, Class: Light, Intensity: IV - V) earthquake occurred 43.8 miles away from the city center On 6/18/2002 at 17:37:17, a magnitude 4.6 (4.6 MW, Depth: 10.0 mi) earthquake occurred 19.6 miles away from the city center Magnitude types: regional Lg-wave magnitude (LG), body-wave magnitude (MB), surface-wave magnitude (MS), moment magnitude (MW) Natural disasters: The number of natural disasters in Warrick County (17) is near the US average (15).Major Disasters (Presidential) Declared: 13Emergencies Declared: 2Floods: 10, Storms: 10, Tornadoes: 5, Winds: 2, Winter Storms: 2, Blizzard: 1, Hurricane: 1, Snow: 1, Other: 1 (Note: some incidents may be assigned to more than one category). Hospitals in Newburgh: ASERACARE HOSPICE (3775 HALEY DRIVE, SUITE B) COMMUNITY ALTERNATIVES SW IN (4122 TRIPLE CROWN) EVANSVILLE SURGERY CENTER ASSOCIATES, LLC (4133 GATEWAY BLVD) NORMAL LIFE OF INDIANA (4477 FOXMOOR DR) REHABILITATION CENTER DEV SERV (428 CYPRESS) THE HEART HOSPITAL AT DEACONESS GATEWAY LLC (Proprietary, 4007 GATEWAY BLVD) WOMEN'S HOSPITAL THE (Proprietary, 4199 GATEWAY BLVD) Nursing Homes in Newburgh: CYPRESS GROVE REHABILITATION CENTER (4255 MEDWELL DR) GOLDEN LIVING CENTER-WOODLANDS (4088 FRAME RD) KINDRED TRANSITIONAL CARE AND REHAB-ANGEL RIVER (5233 ROSEBUD LN) NEWBURGH HEALTH CARE (10466 POLLACK AVE) Dialysis Facilities in Newburgh: DAVITA - NEWBURGH DIALYSIS (4311 HWY 261, SUITE A) Home Health Centers in Newburgh: ACESO, LLC (7899 BELL OAKS DR STE #3)
College/University in Newburgh: ITT Technical Institute-Newburgh Full-time enrollment: 355; Location: 10999 Stahl Rd; Private, for-profit; Website: www.itt-tech.edu)
Colleges/universities with over 2000 students nearest to Newburgh:
University of Evansville (about 8 miles; Evansville, IN ; Full-time enrollment: 2,688)
University of Southern Indiana (about 15 miles; Evansville, IN ; FT enrollment: 9,532)
Owensboro Community and Technical College (about 24 miles; Owensboro, KY ; FT enrollment: 2,754)
Wabash Valley College (about 40 miles; Mount Carmel, IL ; FT enrollment: 2,142)
Madisonville Community College (about 41 miles; Madisonville, KY ; FT enrollment: 2,082)
Vincennes University (about 52 miles; Vincennes, IN ; FT enrollment: 9,876)
Hopkinsville Community College (about 74 miles; Hopkinsville, KY ; FT enrollment: 2,269)
Public high school in Newburgh:
Private high school in Newburgh:
Public elementary/middle schools in Newburgh: JOHN H CASTLE ELEMENTARY SCH Students: 935, Location: 3077 HWY 261, Grades: KG-5)CASTLE NORTH MIDDLE SCHOOL Students: 907, Location: 2800 HWY 261, Grades: 6-8)SHARON ELEMENTARY SCHOOL Students: 768, Location: 7300 SHARON RD, Grades: KG-5)NEWBURGH ELEMENTARY SCHOOL Students: 608, Location: 306 STATE ST, Grades: KG-5)YANKEETOWN ELEMENTARY SCHOOL Students: 390, Location: 7422 YANKEETOWN RD, Grades: KG-5)CASTLE SOUTH MIDDLE SCHOOL Location: 3711 CASEY RD, Grades: 6-8)
Private elementary/middle school in Newburgh:
See full list of schools located in Newburgh Library in Newburgh: OHIO TOWNSHIP PUBLIC LIBRARY SYSTEM Operating income: $1,443,775; Location: 4111 LAKESHORE DRIVE; 112,396 books ; 81 e-books ; 11,222 audio materials ; 11,037 video materials ; 3 local licensed databases ; 37 state licensed databases ; 358 print serial subscriptions ; 1 electronic serial subscriptions )
Notable location: (A) . Display/hide its location on the map
Tourist attraction:
Hotel:
Birthplace of: Dedrick Finn - College basketball player (Xavier Musketeers).
Warrick County has a predicted average indoor radon screening level between 2 and 4 pCi/L (pico curies per liter) - Moderate Potential Average household size: This town:
2.3 peopleIndiana:
2.5 people
Percentage of family households: This town:
64.3%Whole state:
66.9%
Percentage of households with unmarried partners: This town:
6.0%Whole state:
6.9%
Likely homosexual households (counted as self-reported same-sex unmarried-partner households)
Lesbian couples: 0.4% of all households Gay men: 0.5% of all households
8 people in group homes intended for adults in 2010people in homes for the mentally ill in 2000
Banks with most branches in Newburgh (2011 data):
Banterra Bank: Newburgh In Messenger Service at 3811 Haley Drive, branch established on 2007/01/16; Newburg Branch at 3811 Haley Drive, branch established on 2007/01/16. Info updated 2011/09/01: Bank assets: $1,103.3 mil, Deposits: $959.2 mil, headquarters in Marion, IL, positive income , Commercial Lending Specialization, 31 total offices , Holding Company: Banterra Corp
Peoples Trust and Savings Bank: Newburgh Branch at 705 State Street, branch established on 2004/06/01; Paradise Branch at 7199 Parker Drive, branch established on 2000/11/13. Info updated 2006/11/03: Bank assets: $134.8 mil, Deposits: $99.1 mil, headquarters in Boonville, IN, positive income , 3 total offices , Holding Company: Peoples Bancshares Corp
The Lynnville National Bank: Newburgh Branch at 1204 State Road662 West, branch established on 2004/08/02. Info updated 2006/11/03: Bank assets: $98.5 mil, Deposits: $82.1 mil, headquarters in Lynnville, IN, positive income , Consumer Lending Specialization, 4 total offices , Holding Company: Lnb Community Bancorp
Woodforest National Bank: In Newburgh Walmart Branch at 8599 High Pointe Drive, branch established on 2009/08/19. Info updated 2011/05/10: Bank assets: $3,488.9 mil, Deposits: $3,097.6 mil, headquarters in Houston, TX, positive income , Commercial Lending Specialization, 766 total offices , Holding Company: Woodforest Financial Group Employee Stock Ownership Plan (With 401(K) Provisions)
Old National Bank: Bell Oaks Branch at 8577 Ruffian Lane, branch established on 1975/12/05. Info updated 2011/08/01: Bank assets: $8,467.9 mil, Deposits: $6,653.1 mil, headquarters in Evansville, IN, positive income , 195 total offices , Holding Company: Old National Bancorp
German American Bancorp: Epworth Road Branch at 3933 Venetian Dr, branch established on 2005/10/04. Info updated 2011/02/01: Bank assets: $1,866.8 mil, Deposits: $1,578.2 mil, headquarters in Jasper, IN, positive income , Commercial Lending Specialization, 36 total offices , Holding Company: German American Bancorp, Inc.
Fifth Third Bank: Bell Oaks Branch at 8422 Bell Oaks Road, branch established on 1987/07/20. Info updated 2009/10/05: Bank assets: $114,540.4 mil, Deposits: $89,689.1 mil, headquarters in Cincinnati, OH, positive income , Commercial Lending Specialization, 1378 total offices , Holding Company: Fifth Third Bancorp
First Federal Savings Bank: Bell Oaks Drive Branch at 8388 Bell Oaks Drive, branch established on 2000/11/13. Info updated 2011/11/29: Bank assets: $376.9 mil, Deposits: $267.9 mil, headquarters in Evansville, IN, positive income , 9 total offices , Holding Company: First Bancorp Of Indiana, Inc.
United Fidelity Bank, fsb: Newburgh Branch at 8533 Bell Oaks Drive, branch established on 2001/03/19. Info updated 2011/07/21: Bank assets: $180.8 mil, Deposits: $125.0 mil, headquarters in Evansville, IN, positive income , Mortgage Lending Specialization, 6 total offices
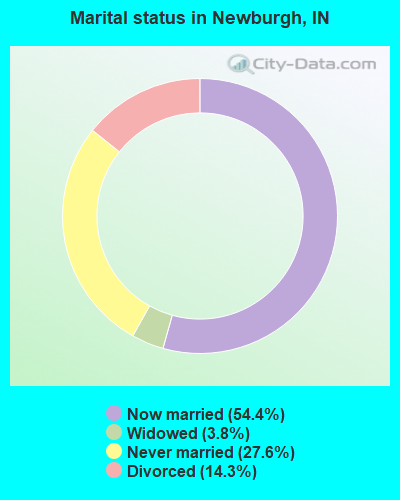
For population 15 years and over in Newburgh:
Never married: 27.6%Now married: 54.4%Separated: 0.0%Widowed: 3.8%Divorced: 14.3% For population 25 years and over in Newburgh:
High school or higher: 97.2%Bachelor's degree or higher: 30.7%Graduate or professional degree: 11.5%Unemployed: 1.9%Mean travel time to work (commute): 21.2 minutes
Education Gini index (Inequality in education) Here:
8.9Indiana average:
11.3
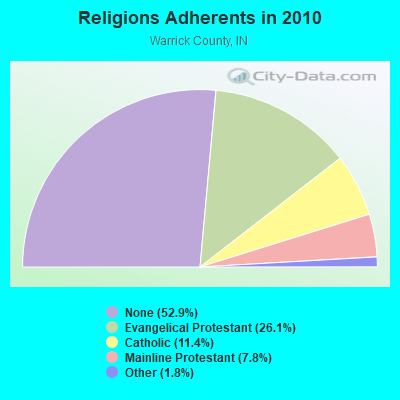
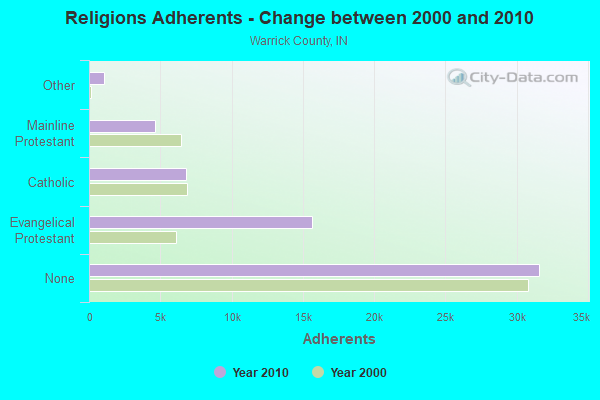
Religion statistics for Newburgh, IN (based on Warrick County data)
Religion Adherents Congregations Evangelical Protestant 15,608 42 Catholic 6,775 3 Mainline Protestant 4,655 20 Other 1,057 3 None 31,594 -
Source: Clifford Grammich, Kirk Hadaway, Richard Houseal, Dale E.Jones, Alexei Krindatch, Richie Stanley and Richard H.Taylor. 2012. 2010 U.S.Religion Census: Religious Congregations & Membership Study. Association of Statisticians of American Religious Bodies. Jones, Dale E., et al. 2002. Congregations and Membership in the United States 2000. Nashville, TN: Glenmary Research Center. Graphs represent county-level data
Food Environment Statistics: Number of grocery stores : 10Here :
1.75 / 10,000 pop.State :
1.73 / 10,000 pop.
Number of convenience stores (with gas) : 14This county :
2.46 / 10,000 pop.State :
3.57 / 10,000 pop.
Number of full-service restaurants : 29Warrick County :
5.09 / 10,000 pop.Indiana :
6.78 / 10,000 pop.
Adult obesity rate : This county :
28.9%Indiana :
29.0%
Low-income preschool obesity rate : This county :
17.7%Indiana :
14.3%
Health and Nutrition: Healthy diet rate : Newburgh:
51.1%Indiana:
49.3%
Average overall health of teeth and gums : This city:
47.9%State:
46.2%
Average BMI : Newburgh:
27.8Indiana:
28.7
People feeling badly about themselves : People not drinking alcohol at all : This city:
14.3%State:
10.6%
Average hours sleeping at night : Overweight people : Newburgh:
27.2%Indiana:
33.9%
General health condition : This city:
57.9%Indiana:
56.1%
Average condition of hearing : Newburgh:
85.2%Indiana:
78.7%
More about Health and Nutrition of Newburgh, IN Residents
Local government employment and payroll (March 2022)
Function
Full-time employees
Monthly full-time payroll
Average yearly full-time wage
Part-time employees
Monthly part-time payroll
Sewerage
29 $136,706 $56,568 0 $0 Police Protection - Officers
9 $47,019 $62,692 0 $0 Other Government Administration
4 $18,737 $56,211 6 $5,061 Financial Administration
4 $18,666 $55,998 3 $5,399 Streets and Highways
4 $17,170 $51,510 0 $0 Other and Unallocable
3 $10,926 $43,704 0 $0 Police - Other
0 $0 1 $449
Totals for Government
53 $249,224 $56,428 10 $10,910
Newburgh government finances - Expenditure in 2018 (per resident):
Construction - Sewerage: $1,000 ($0.29)
Current Operations - Sewerage: $6,360,000 ($1869.49)
Central Staff Services: $1,013,000 ($297.77)Police Protection: $689,000 ($202.53)Parks and Recreation: $233,000 ($68.49)General - Other: $197,000 ($57.91)Local Fire Protection: $118,000 ($34.69)Housing and Community Development: $75,000 ($22.05)Protective Inspection and Regulation - Other: $54,000 ($15.87)Regular Highways: $16,000 ($4.70)General - Interest on Debt: $1,292,000 ($379.78)
Other Capital Outlay - Sewerage: $154,000 ($45.27)
Parks and Recreation: $45,000 ($13.23)Central Staff Services: $16,000 ($4.70)General - Other: $6,000 ($1.76)Total Salaries and Wages: $3,228,000 ($948.85)
Newburgh government finances - Revenue in 2018 (per resident):
Charges - Sewerage: $10,828,000 ($3182.83)
Other: $246,000 ($72.31)Solid Waste Management: $155,000 ($45.56)Parks and Recreation: $43,000 ($12.64)Federal Intergovernmental - Other: $250,000 ($73.49)
Local Intergovernmental - General Local Government Support: $760,000 ($223.40)
Highways: $41,000 ($12.05)Other: $31,000 ($9.11)Miscellaneous - Fines and Forfeits: $227,000 ($66.73)
Rents: $100,000 ($29.39)General Revenue - Other: $38,000 ($11.17)Donations From Private Sources: $5,000 ($1.47)State Intergovernmental - General Local Government Support: $257,000 ($75.54)
Public Welfare: $250,000 ($73.49)Highways: $154,000 ($45.27)Other: $70,000 ($20.58)Tax - Property: $1,076,000 ($316.28)
Individual Income: $204,000 ($59.96)Motor Vehicle License: $102,000 ($29.98)Public Utilities Sales: $43,000 ($12.64)Other License: $32,000 ($9.41)Occupation and Business License - Other: $1,000 ($0.29)
Newburgh government finances - Debt in 2018 (per resident):
Long Term Debt - Outstanding Unspecified Public Purpose: $49,767,000 ($14628.75)
Beginning Outstanding - Unspecified Public Purpose: $49,402,000 ($14521.46)Issue, Unspecified Public Purpose: $2,747,000 ($807.47)Retired Unspecified Public Purpose: $2,381,000 ($699.88)
Newburgh government finances - Cash and Securities in 2018 (per resident):
Bond Funds - Cash and Securities: $12,586,000 ($3699.59)
Other Funds - Cash and Securities: $6,891,000 ($2025.57)
Sinking Funds - Cash and Securities: $6,361,000 ($1869.78)
Businesses in Newburgh, IN
Name Count Name Count
Ace Hardware 1 McDonald's 1 Arby's 1 Papa John's Pizza 1 AutoZone 1 Pizza Hut 1 Burger King 1 Quiznos 1 CVS 1 SONIC Drive-In 1 Curves 1 Starbucks 1 Dairy Queen 1 Subway 2 Domino's Pizza 1 Taco Bell 1 FedEx 4 U-Haul 2 GameStop 1 UPS 4 H&R Block 1 Walgreens 1 Hardee's 1 Walmart 1 MasterBrand Cabinets 2 Wendy's 1
Strongest AM radio stations in Newburgh:
WGAB (1180 AM; 1 kW; NEWBURGH, IN; Owner: NEWBURGH BROADCASTING CORPORATION)
WGBF (1280 AM; 5 kW; EVANSVILLE, IN; Owner: CLEAR CHANNEL BROADCASTING LICENSES, INC.)
WVHI (1330 AM; 5 kW; EVANSVILLE, IN)
WEOA (1400 AM; 1 kW; EVANSVILLE, IN; Owner: SOUTH CENTRAL B/C CORPORATION)
WVJS (1420 AM; 5 kW; OWENSBORO, KY; Owner: TSB III, LLC)
WSON (860 AM; 0 kW; HENDERSON, KY; Owner: HENRY G. LACKEY)
WHAS (840 AM; 50 kW; LOUISVILLE, KY; Owner: CLEAR CHANNEL BROADCASTING LICENSES, INC.)
WSM (650 AM; 50 kW; NASHVILLE, TN; Owner: GAYLORD ENTERTAINMENT COMPANY)
WKDA (1200 AM; 50 kW; NASHVILLE, TN; Owner: RADIO NASHVILLE, INC.)
WAMB (1160 AM; 50 kW; DONELSON, TN; Owner: GREAT SOUTHERN BROADCASTING COMPANY, INC.)
WNQM (1300 AM; 50 kW; NASHVILLE, TN; Owner: WNQM. INC.)
WLAC (1510 AM; 50 kW; NASHVILLE, TN; Owner: CAPSTAR TX LIMITED PARTNERSHIP)
WIBC (1070 AM; 50 kW; INDIANAPOLIS, IN; Owner: EMMIS RADIO LICENSE CORPORATION)
Strongest FM radio stations in Newburgh:
WNIN-FM (88.3 FM; EVANSVILLE, IN; Owner: TRI-STATE PUBLIC TELEPLEX, INC.)
WKDQ (99.5 FM; HENDERSON, KY; Owner: REGENT BROADCASTING OF EVANSVILLE/OWENSBORO, INC.)
WJPS-FM (93.5 FM; CHANDLER, IN; Owner: SOUTH CENTRAL COMMUNICATIONS CORP.)
WYXY (107.1 FM; BOONVILLE, IN; Owner: BOONVILLE BROADCASTING CO., INC.)
WSTO (96.1 FM; OWENSBORO, KY; Owner: TSB III, LLC)
WKPB (89.5 FM; HENDERSON, KY; Owner: WESTERN KENTUCKY UNIVERSITY)
WIKY-FM (104.1 FM; EVANSVILLE, IN; Owner: SOUTH CENTRAL B/C CORPORATION)
WABX (107.5 FM; EVANSVILLE, IN; Owner: SOUTH CENTRAL COMMUNICATIONS CORP.)
WDKS (106.1 FM; NEWBURGH, IN; Owner: CLEAR CHANNEL BROADCASTING LICENSES, INC.)
WJLT (105.3 FM; EVANSVILLE, IN; Owner: CLEAR CHANNEL BROADCASTING LICENSES, INC.)
WBGW (101.5 FM; FORT BRANCH, IN; Owner: MUSIC MINISTRIES, INC.)
WBKR (92.5 FM; OWENSBORO, KY; Owner: REGENT BROADCASTING OF EVANSVILLE/OWENSBORO, INC.)
WUEV (91.5 FM; EVANSVILLE, IN; Owner: UNIVERSITY OF EVANSVILLE)
WGBF-FM (103.1 FM; HENDERSON, KY; Owner: CLEAR CHANNEL BROADCASTING LICENSES, INC.)
WXCM (97.1 FM; HAWESVILLE, KY; Owner: WLME, INC.)
WAXL (103.3 FM; SANTA CLAUS, IN; Owner: DUBOIS COUNTY BROADCASTING, INC.)
WGZB-FM (96.5 FM; CORYDON, IN; Owner: BLUE CHIP BROADCASTING LICENSES II, LTD.)
W246AF (97.1 FM; OWENSBORO, KY; Owner: FM 90.1, INC.)
TV broadcast stations around Newburgh:
WTVW (Channel 7; EVANSVILLE, IN; Owner: QUORUM OF INDIANA LICENSE, LLC)
WNIN (Channel 9; EVANSVILLE, IN; Owner: TRI-STATE PUBLIC TELEPLEX, INC.)
K55HL (Channel 55; CAPE GIRARDEAU, MO; Owner: MS COMMUNICATIONS, LLC)
WFIE (Channel 14; EVANSVILLE, IN; Owner: LIBCO, INC.)
W38BK (Channel 38; EVANSVILLE, IN; Owner: TRINITY BROADCASTING NETWORK)
WEVV (Channel 44; EVANSVILLE, IN; Owner: COMCORP OF INDIANA LICENSE CORP.)
WEHT (Channel 25; EVANSVILLE, IN; Owner: GILMORE BROADCASTING CORPORATION)
WKOH (Channel 31; OWENSBORO, KY; Owner: KENTUCKY AUTHORITY FOR EDUCATIONAL TV)
W56DN (Channel 56; EVANSVILLE, IN; Owner: EVANSVILLE LOW POWER PARTNERSHIP)
WTSN-LP (Channel 63; EVANSVILLE, IN; Owner: EVANSVILLE LOW POWER PARTNERSHIP)
WIKY-LP (Channel 5; EVANSVILLE, ETC., IN; Owner: SOUTH CENTRAL COMMUNICATIONS CORP.)
WAZE-LP (Channel 17; EVANSVILLE, IN; Owner: SOUTH CENTRAL COMMUNICATIONS CORP.)
WEOA-LP (Channel 50; EVANSVILLE, IN; Owner: SOUTH CENTRAL COMMUNICATIONS CORP.)
WJPS-LP (Channel 4; EVANSVILLE, ETC., IN; Owner: SOUTH CENTRAL COMMUNICATIONS CORP.)
W23BV (Channel 23; EVANSVILLE, IN; Owner: BETHEL SANITARIUM)
W66CT (Channel 66; MOUNT VERNON, IN; Owner: SOUTH CENTRAL COMMUNICATIONS CORP.)
W12BJ (Channel 12; OWENSBORO, KY; Owner: UNIVERSITY OF KENTUCKY)
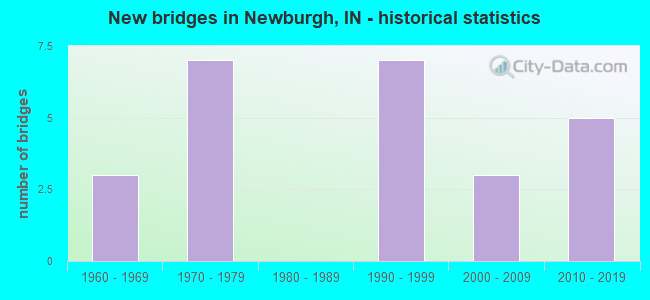
National Bridge Inventory (NBI) Statistics 25 Number of bridges236ft / 72.0m Total length91,242 Total average daily traffic8,840 Total average daily truck traffic
New bridges - historical statistics
3 1960-1969 7 1970-1979 7 1990-1999 3 2000-2009 5 2010-2019
See full National Bridge Inventory statistics for Newburgh, IN
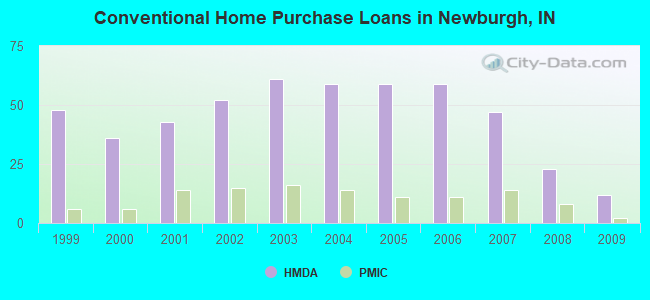
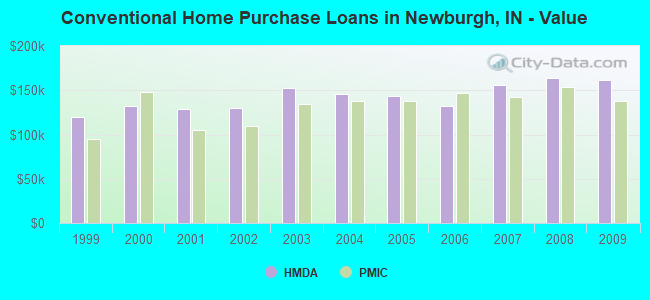
Home Mortgage Disclosure Act Aggregated Statistics For Year 2009(Based on 3 partial tracts) A) FHA, FSA/RHS & VA B) Conventional C) Refinancings D) Home Improvement Loans F) Non-occupant Loans on G) Loans On Manufactured Number Average Value Number Average Value Number Average Value Number Average Value Number Average Value Number Average Value
LOANS ORIGINATED 15 $124,299 12 $161,263 70 $147,280 6 $17,993 3 $120,003 1 $32,160 APPLICATIONS APPROVED, NOT ACCEPTED 0 $0 1 $32,130 3 $190,187 0 $0 0 $0 0 $0 APPLICATIONS DENIED 2 $115,995 5 $136,512 16 $200,528 2 $7,685 2 $88,220 0 $0 APPLICATIONS WITHDRAWN 1 $144,790 3 $177,050 16 $164,220 1 $101,050 1 $38,440 0 $0 FILES CLOSED FOR INCOMPLETENESS 0 $0 0 $0 3 $152,133 0 $0 0 $0 0 $0
Aggregated Statistics For Year 2008(Based on 3 partial tracts) A) FHA, FSA/RHS & VA B) Conventional C) Refinancings D) Home Improvement Loans F) Non-occupant Loans on Number Average Value Number Average Value Number Average Value Number Average Value Number Average Value
LOANS ORIGINATED 8 $108,581 23 $163,293 34 $156,204 6 $43,665 3 $108,783 APPLICATIONS APPROVED, NOT ACCEPTED 0 $0 2 $149,765 4 $165,828 1 $40,630 0 $0 APPLICATIONS DENIED 1 $190,400 3 $207,067 15 $111,788 2 $49,835 0 $0 APPLICATIONS WITHDRAWN 1 $108,110 3 $202,570 9 $131,430 0 $0 1 $159,090 FILES CLOSED FOR INCOMPLETENESS 0 $0 0 $0 1 $100,270 0 $0 0 $0
Aggregated Statistics For Year 2007(Based on 3 partial tracts) A) FHA, FSA/RHS & VA B) Conventional C) Refinancings D) Home Improvement Loans F) Non-occupant Loans on Number Average Value Number Average Value Number Average Value Number Average Value Number Average Value
LOANS ORIGINATED 5 $126,034 47 $156,000 35 $137,534 5 $37,368 7 $172,696 APPLICATIONS APPROVED, NOT ACCEPTED 0 $0 2 $151,700 3 $143,317 0 $0 0 $0 APPLICATIONS DENIED 1 $149,220 4 $108,212 19 $163,194 2 $36,695 2 $104,740 APPLICATIONS WITHDRAWN 1 $151,330 5 $104,822 12 $150,987 1 $52,500 2 $132,225 FILES CLOSED FOR INCOMPLETENESS 0 $0 0 $0 4 $189,845 0 $0 0 $0
Aggregated Statistics For Year 2006(Based on 3 partial tracts) A) FHA, FSA/RHS & VA B) Conventional C) Refinancings D) Home Improvement Loans E) Loans on Dwellings For 5+ Families F) Non-occupant Loans on G) Loans On Manufactured Number Average Value Number Average Value Number Average Value Number Average Value Number Average Value Number Average Value Number Average Value
LOANS ORIGINATED 5 $119,092 59 $132,102 39 $139,495 6 $68,128 1 $1,031,870 11 $128,769 1 $26,670 APPLICATIONS APPROVED, NOT ACCEPTED 0 $0 7 $131,696 4 $130,887 1 $30,640 0 $0 1 $141,980 0 $0 APPLICATIONS DENIED 0 $0 5 $124,092 16 $132,057 3 $44,077 0 $0 1 $234,530 0 $0 APPLICATIONS WITHDRAWN 1 $72,790 5 $105,368 15 $152,743 1 $50,360 0 $0 0 $0 0 $0 FILES CLOSED FOR INCOMPLETENESS 0 $0 1 $168,090 4 $140,825 0 $0 0 $0 0 $0 0 $0
Aggregated Statistics For Year 2005(Based on 3 partial tracts) A) FHA, FSA/RHS & VA B) Conventional C) Refinancings D) Home Improvement Loans F) Non-occupant Loans on G) Loans On Manufactured Number Average Value Number Average Value Number Average Value Number Average Value Number Average Value Number Average Value
LOANS ORIGINATED 6 $117,665 59 $143,909 43 $121,969 5 $47,830 9 $102,817 1 $21,440 APPLICATIONS APPROVED, NOT ACCEPTED 0 $0 3 $98,107 5 $103,566 1 $17,870 0 $0 1 $42,530 APPLICATIONS DENIED 0 $0 4 $105,748 21 $126,957 5 $36,554 1 $102,990 0 $0 APPLICATIONS WITHDRAWN 1 $142,600 7 $187,486 16 $149,204 2 $140,440 1 $217,580 0 $0 FILES CLOSED FOR INCOMPLETENESS 0 $0 1 $146,110 2 $116,965 0 $0 0 $0 0 $0
Aggregated Statistics For Year 2004(Based on 3 partial tracts) A) FHA, FSA/RHS & VA B) Conventional C) Refinancings D) Home Improvement Loans F) Non-occupant Loans on G) Loans On Manufactured Number Average Value Number Average Value Number Average Value Number Average Value Number Average Value Number Average Value
LOANS ORIGINATED 8 $119,019 59 $145,520 57 $145,233 9 $79,743 6 $89,085 2 $30,160 APPLICATIONS APPROVED, NOT ACCEPTED 0 $0 5 $132,448 9 $104,216 0 $0 0 $0 0 $0 APPLICATIONS DENIED 1 $115,170 6 $99,732 21 $110,835 4 $35,235 1 $138,670 0 $0 APPLICATIONS WITHDRAWN 0 $0 5 $117,496 19 $135,144 2 $83,580 0 $0 0 $0 FILES CLOSED FOR INCOMPLETENESS 1 $196,070 1 $266,520 3 $163,667 1 $92,590 0 $0 0 $0
Aggregated Statistics For Year 2003(Based on 3 partial tracts) A) FHA, FSA/RHS & VA B) Conventional C) Refinancings D) Home Improvement Loans E) Loans on Dwellings For 5+ Families F) Non-occupant Loans on Number Average Value Number Average Value Number Average Value Number Average Value Number Average Value Number Average Value
LOANS ORIGINATED 13 $105,048 61 $152,875 137 $123,101 13 $35,551 1 $1,071,980 15 $102,199 APPLICATIONS APPROVED, NOT ACCEPTED 1 $87,490 5 $145,866 8 $123,329 1 $22,210 0 $0 1 $28,730 APPLICATIONS DENIED 1 $130,980 5 $122,960 26 $108,552 2 $12,850 0 $0 1 $99,760 APPLICATIONS WITHDRAWN 1 $65,170 6 $170,878 22 $140,922 0 $0 0 $0 1 $114,680 FILES CLOSED FOR INCOMPLETENESS 0 $0 1 $106,690 3 $85,457 0 $0 0 $0 0 $0
Aggregated Statistics For Year 2002(Based on 3 partial tracts) A) FHA, FSA/RHS & VA B) Conventional C) Refinancings D) Home Improvement Loans F) Non-occupant Loans on Number Average Value Number Average Value Number Average Value Number Average Value Number Average Value
LOANS ORIGINATED 8 $104,454 52 $130,096 97 $126,326 10 $38,016 3 $70,480 APPLICATIONS APPROVED, NOT ACCEPTED 1 $133,960 5 $98,846 10 $121,586 2 $43,835 0 $0 APPLICATIONS DENIED 1 $74,380 6 $63,210 17 $109,158 6 $14,575 1 $49,870 APPLICATIONS WITHDRAWN 0 $0 5 $98,168 16 $113,987 0 $0 1 $52,950 FILES CLOSED FOR INCOMPLETENESS 0 $0 2 $87,970 3 $75,337 0 $0 0 $0
Aggregated Statistics For Year 2001(Based on 3 partial tracts) A) FHA, FSA/RHS & VA B) Conventional C) Refinancings D) Home Improvement Loans F) Non-occupant Loans on Number Average Value Number Average Value Number Average Value Number Average Value Number Average Value
LOANS ORIGINATED 5 $84,698 43 $128,735 72 $109,088 8 $28,631 2 $139,440 APPLICATIONS APPROVED, NOT ACCEPTED 1 $55,460 4 $113,728 7 $74,640 2 $18,605 0 $0 APPLICATIONS DENIED 1 $60,370 5 $73,044 21 $91,632 5 $19,084 1 $90,970 APPLICATIONS WITHDRAWN 0 $0 4 $98,998 14 $88,901 1 $5,250 1 $29,560 FILES CLOSED FOR INCOMPLETENESS 0 $0 1 $97,900 3 $104,747 0 $0 0 $0
Aggregated Statistics For Year 2000(Based on 3 partial tracts) A) FHA, FSA/RHS & VA B) Conventional C) Refinancings D) Home Improvement Loans F) Non-occupant Loans on Number Average Value Number Average Value Number Average Value Number Average Value Number Average Value
LOANS ORIGINATED 3 $84,483 36 $132,028 22 $89,345 7 $16,771 1 $81,180 APPLICATIONS APPROVED, NOT ACCEPTED 0 $0 3 $83,117 5 $67,952 5 $22,998 0 $0 APPLICATIONS DENIED 0 $0 7 $54,364 16 $61,839 3 $8,183 1 $34,800 APPLICATIONS WITHDRAWN 0 $0 4 $104,938 8 $71,511 1 $42,590 0 $0 FILES CLOSED FOR INCOMPLETENESS 0 $0 1 $40,820 2 $118,820 0 $0 0 $0
Aggregated Statistics For Year 1999(Based on 3 partial tracts) A) FHA, FSA/RHS & VA B) Conventional C) Refinancings D) Home Improvement Loans E) Loans on Dwellings For 5+ Families F) Non-occupant Loans on Number Average Value Number Average Value Number Average Value Number Average Value Number Average Value Number Average Value
LOANS ORIGINATED 5 $96,436 48 $120,065 32 $81,898 11 $14,096 1 $1,996,980 5 $56,200 APPLICATIONS APPROVED, NOT ACCEPTED 0 $0 2 $152,670 4 $101,400 0 $0 0 $0 0 $0 APPLICATIONS DENIED 0 $0 7 $65,169 16 $111,211 3 $15,187 0 $0 1 $13,030 APPLICATIONS WITHDRAWN 0 $0 5 $92,126 13 $88,248 0 $0 0 $0 0 $0 FILES CLOSED FOR INCOMPLETENESS 0 $0 1 $194,140 1 $137,270 0 $0 0 $0 0 $0
Detailed HMDA statistics for the following Tracts:
0307.01
, 0308.00
Private Mortgage Insurance Companies Aggregated Statistics For Year 2009(Based on 3 partial tracts) A) Conventional B) Refinancings Number Average Value Number Average Value
LOANS ORIGINATED 2 $137,565 2 $178,780 APPLICATIONS APPROVED, NOT ACCEPTED 1 $164,670 1 $167,490 APPLICATIONS DENIED 0 $0 0 $0 APPLICATIONS WITHDRAWN 0 $0 0 $0 FILES CLOSED FOR INCOMPLETENESS 0 $0 0 $0
Aggregated Statistics For Year 2008(Based on 3 partial tracts) A) Conventional B) Refinancings Number Average Value Number Average Value
LOANS ORIGINATED 8 $153,234 3 $183,403 APPLICATIONS APPROVED, NOT ACCEPTED 1 $323,400 1 $68,840 APPLICATIONS DENIED 1 $201,180 0 $0 APPLICATIONS WITHDRAWN 0 $0 0 $0 FILES CLOSED FOR INCOMPLETENESS 0 $0 0 $0
Aggregated Statistics For Year 2007(Based on 3 partial tracts) A) Conventional B) Refinancings Number Average Value Number Average Value
LOANS ORIGINATED 14 $142,463 5 $144,984 APPLICATIONS APPROVED, NOT ACCEPTED 1 $245,610 2 $211,940 APPLICATIONS DENIED 0 $0 0 $0 APPLICATIONS WITHDRAWN 0 $0 0 $0 FILES CLOSED FOR INCOMPLETENESS 0 $0 0 $0
Aggregated Statistics For Year 2006(Based on 3 partial tracts) A) Conventional B) Refinancings Number Average Value Number Average Value
LOANS ORIGINATED 11 $146,860 2 $183,485 APPLICATIONS APPROVED, NOT ACCEPTED 1 $342,380 1 $155,040 APPLICATIONS DENIED 0 $0 0 $0 APPLICATIONS WITHDRAWN 1 $112,580 0 $0 FILES CLOSED FOR INCOMPLETENESS 0 $0 0 $0
Aggregated Statistics For Year 2005(Based on 3 partial tracts) A) Conventional B) Refinancings C) Non-occupant Loans on Number Average Value Number Average Value Number Average Value
LOANS ORIGINATED 11 $138,273 5 $156,106 1 $80,920 APPLICATIONS APPROVED, NOT ACCEPTED 2 $162,040 2 $150,145 0 $0 APPLICATIONS DENIED 0 $0 0 $0 0 $0 APPLICATIONS WITHDRAWN 0 $0 0 $0 0 $0 FILES CLOSED FOR INCOMPLETENESS 0 $0 0 $0 0 $0
Aggregated Statistics For Year 2004(Based on 3 partial tracts) A) Conventional B) Refinancings C) Non-occupant Loans on Number Average Value Number Average Value Number Average Value
LOANS ORIGINATED 14 $137,406 4 $150,460 2 $73,475 APPLICATIONS APPROVED, NOT ACCEPTED 3 $213,053 2 $74,380 0 $0 APPLICATIONS DENIED 0 $0 0 $0 0 $0 APPLICATIONS WITHDRAWN 1 $202,270 0 $0 0 $0 FILES CLOSED FOR INCOMPLETENESS 0 $0 0 $0 0 $0
Aggregated Statistics For Year 2003(Based on 3 partial tracts) A) Conventional B) Refinancings C) Non-occupant Loans on Number Average Value Number Average Value Number Average Value
LOANS ORIGINATED 16 $134,557 15 $111,687 1 $76,830 APPLICATIONS APPROVED, NOT ACCEPTED 4 $115,255 3 $108,827 0 $0 APPLICATIONS DENIED 0 $0 0 $0 0 $0 APPLICATIONS WITHDRAWN 1 $48,300 0 $0 1 $48,070 FILES CLOSED FOR INCOMPLETENESS 0 $0 0 $0 0 $0
Aggregated Statistics For Year 2002(Based on 3 partial tracts) A) Conventional B) Refinancings Number Average Value Number Average Value
LOANS ORIGINATED 15 $109,307 8 $118,682 APPLICATIONS APPROVED, NOT ACCEPTED 3 $119,563 3 $107,103 APPLICATIONS DENIED 0 $0 0 $0 APPLICATIONS WITHDRAWN 0 $0 1 $45,850 FILES CLOSED FOR INCOMPLETENESS 0 $0 0 $0
Aggregated Statistics For Year 2001(Based on 3 partial tracts) A) Conventional B) Refinancings C) Non-occupant Loans on Number Average Value Number Average Value Number Average Value
LOANS ORIGINATED 14 $105,625 9 $122,013 1 $38,730 APPLICATIONS APPROVED, NOT ACCEPTED 3 $114,650 1 $72,110 0 $0 APPLICATIONS DENIED 0 $0 0 $0 0 $0 APPLICATIONS WITHDRAWN 0 $0 0 $0 0 $0 FILES CLOSED FOR INCOMPLETENESS 0 $0 0 $0 0 $0
Aggregated Statistics For Year 2000(Based on 3 partial tracts) A) Conventional B) Refinancings Number Average Value Number Average Value
LOANS ORIGINATED 6 $147,935 2 $81,460 APPLICATIONS APPROVED, NOT ACCEPTED 0 $0 0 $0 APPLICATIONS DENIED 0 $0 0 $0 APPLICATIONS WITHDRAWN 0 $0 0 $0 FILES CLOSED FOR INCOMPLETENESS 0 $0 0 $0
Aggregated Statistics For Year 1999(Based on 3 partial tracts) A) Conventional B) Refinancings Number Average Value Number Average Value
LOANS ORIGINATED 6 $94,507 1 $88,340 APPLICATIONS APPROVED, NOT ACCEPTED 1 $137,830 1 $84,760 APPLICATIONS DENIED 0 $0 0 $0 APPLICATIONS WITHDRAWN 0 $0 0 $0 FILES CLOSED FOR INCOMPLETENESS 0 $0 0 $0
Detailed PMIC statistics for the following Tracts:
0307.01
, 0308.00
Most common first names in Newburgh, IN among deceased individuals Name Count Lived (average)
Mary 121 81.0 years William 110 75.3 years Robert 90 71.9 years Charles 89 77.1 years James 85 73.6 years John 81 72.4 years Margaret 59 81.0 years George 51 73.9 years Helen 46 81.0 years Dorothy 46 77.4 years
Most common last names in Newburgh, IN among deceased individuals Last name Count Lived (average)
Smith 47 75.7 years Brown 31 75.6 years Barnett 25 81.6 years Wilson 22 73.2 years Williams 21 75.3 years Miller 21 78.1 years Martin 21 80.1 years Taylor 21 71.7 years Johnson 18 75.6 years Moore 17 75.5 years
Newburgh compared to Indiana state average:
Unemployed percentage significantly below state average. Black race population percentage significantly below state average. Hispanic race population percentage below state average. Foreign-born population percentage significantly below state average. Length of stay since moving in significantly above state average. Number of college students below state average. Percentage of population with a bachelor's degree or higher above state average.
#46 on the list of "Top 101 cities with the most residents born in Peru (population 500+)"
#31 on the list of "Top 101 counties with the lowest total withdrawal of fresh water for public supply (pop. 50,000+)"
Top Patent Applicants
Philip A. Driskill (18)
Jason J. Paladino (17)
Robert L. Wetekamp (17)
Milan C. Maravich (15)
Dattatreya Banavara (14)
Tianhua Ding (13)
Christopher A. Kruckenberg (12)
Chenzhong Kuang (10)
W. Michael Russell (10)
Eduard Poels (8)
Total of 338 patent applications in 2008-2024.


 Recent articles from our blog. Our writers, many of them Ph.D. graduates or candidates, create easy-to-read articles on a wide variety of topics.


 (8.3 miles
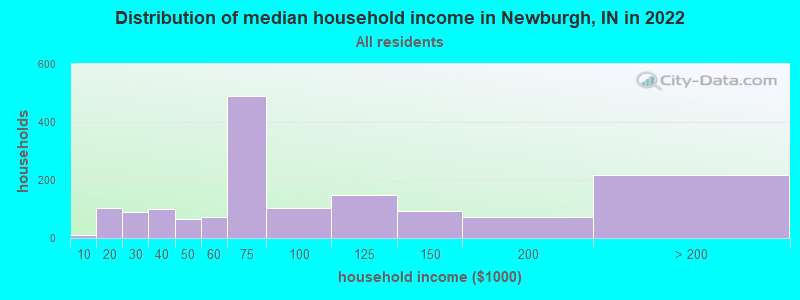


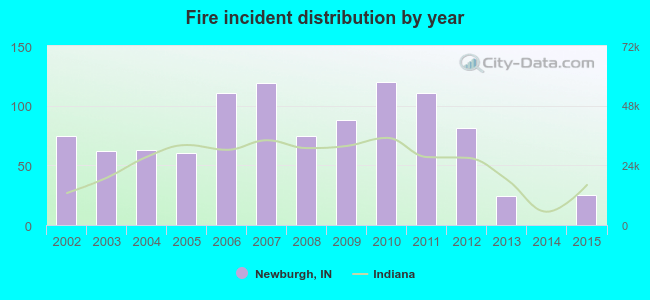 According to the data from the years 2002 - 2015 the average number of fires per year is 72. The highest number of reported fires - 120 took place in 2010, and the least - 0 in 2014. The data has a decreasing trend.
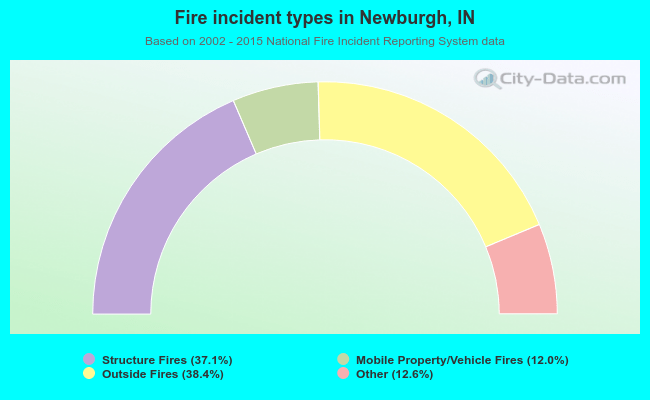 When looking into fire subcategories, the most reports belonged to: Outside Fires (38.4%), and Structure Fires (37.1%).