Newburyport, Massachusetts Submit your own pictures of this city and show them to the world
OSM Map
General Map
Google Map
MSN Map
OSM Map
General Map
Google Map
MSN Map
OSM Map
General Map
Google Map
MSN Map
OSM Map
General Map
Google Map
MSN Map
Please wait while loading the map...
Population in 2022: 18,662 (100% urban, 0% rural). Population change since 2000: +8.6%Males: 8,354 Females: 10,308
March 2022 cost of living index in Newburyport: 137.1 (high, U.S. average is 100) Percentage of residents living in poverty in 2022: 5.8%for White Non-Hispanic residents , 5.3% for Black residents , 24.8% for Hispanic or Latino residents , 11.6% for two or more races residents )
Profiles of local businesses
Business Search - 14 Million verified businesses
Data:
Median household income ($)
Median household income (% change since 2000)
Household income diversity
Ratio of average income to average house value (%)
Ratio of average income to average rent
Median household income ($) - White
Median household income ($) - Black or African American
Median household income ($) - Asian
Median household income ($) - Hispanic or Latino
Median household income ($) - American Indian and Alaska Native
Median household income ($) - Multirace
Median household income ($) - Other Race
Median household income for houses/condos with a mortgage ($)
Median household income for apartments without a mortgage ($)
Races - White alone (%)
Races - White alone (% change since 2000)
Races - Black alone (%)
Races - Black alone (% change since 2000)
Races - American Indian alone (%)
Races - American Indian alone (% change since 2000)
Races - Asian alone (%)
Races - Asian alone (% change since 2000)
Races - Hispanic (%)
Races - Hispanic (% change since 2000)
Races - Native Hawaiian and Other Pacific Islander alone (%)
Races - Native Hawaiian and Other Pacific Islander alone (% change since 2000)
Races - Two or more races (%)
Races - Two or more races (% change since 2000)
Races - Other race alone (%)
Races - Other race alone (% change since 2000)
Racial diversity
Unemployment (%)
Unemployment (% change since 2000)
Unemployment (%) - White
Unemployment (%) - Black or African American
Unemployment (%) - Asian
Unemployment (%) - Hispanic or Latino
Unemployment (%) - American Indian and Alaska Native
Unemployment (%) - Multirace
Unemployment (%) - Other Race
Population density (people per square mile)
Population - Males (%)
Population - Females (%)
Population - Males (%) - White
Population - Males (%) - Black or African American
Population - Males (%) - Asian
Population - Males (%) - Hispanic or Latino
Population - Males (%) - American Indian and Alaska Native
Population - Males (%) - Multirace
Population - Males (%) - Other Race
Population - Females (%) - White
Population - Females (%) - Black or African American
Population - Females (%) - Asian
Population - Females (%) - Hispanic or Latino
Population - Females (%) - American Indian and Alaska Native
Population - Females (%) - Multirace
Population - Females (%) - Other Race
Coronavirus confirmed cases (Apr 19, 2024)
Deaths caused by coronavirus (Apr 19, 2024)
Coronavirus confirmed cases (per 100k population) (Apr 19, 2024)
Deaths caused by coronavirus (per 100k population) (Apr 19, 2024)
Daily increase in number of cases (Apr 19, 2024)
Weekly increase in number of cases (Apr 19, 2024)
Cases doubled (in days) (Apr 19, 2024)
Hospitalized patients (Apr 18, 2022)
Negative test results (Apr 18, 2022)
Total test results (Apr 18, 2022)
COVID Vaccine doses distributed (per 100k population) (Sep 19, 2023)
COVID Vaccine doses administered (per 100k population) (Sep 19, 2023)
COVID Vaccine doses distributed (Sep 19, 2023)
COVID Vaccine doses administered (Sep 19, 2023)
Likely homosexual households (%)
Likely homosexual households (% change since 2000)
Likely homosexual households - Lesbian couples (%)
Likely homosexual households - Lesbian couples (% change since 2000)
Likely homosexual households - Gay men (%)
Likely homosexual households - Gay men (% change since 2000)
Cost of living index
Median gross rent ($)
Median contract rent ($)
Median monthly housing costs ($)
Median house or condo value ($)
Median house or condo value ($ change since 2000)
Mean house or condo value by units in structure - 1, detached ($)
Mean house or condo value by units in structure - 1, attached ($)
Mean house or condo value by units in structure - 2 ($)
Mean house or condo value by units in structure by units in structure - 3 or 4 ($)
Mean house or condo value by units in structure - 5 or more ($)
Mean house or condo value by units in structure - Boat, RV, van, etc. ($)
Mean house or condo value by units in structure - Mobile home ($)
Median house or condo value ($) - White
Median house or condo value ($) - Black or African American
Median house or condo value ($) - Asian
Median house or condo value ($) - Hispanic or Latino
Median house or condo value ($) - American Indian and Alaska Native
Median house or condo value ($) - Multirace
Median house or condo value ($) - Other Race
Median resident age
Resident age diversity
Median resident age - Males
Median resident age - Females
Median resident age - White
Median resident age - Black or African American
Median resident age - Asian
Median resident age - Hispanic or Latino
Median resident age - American Indian and Alaska Native
Median resident age - Multirace
Median resident age - Other Race
Median resident age - Males - White
Median resident age - Males - Black or African American
Median resident age - Males - Asian
Median resident age - Males - Hispanic or Latino
Median resident age - Males - American Indian and Alaska Native
Median resident age - Males - Multirace
Median resident age - Males - Other Race
Median resident age - Females - White
Median resident age - Females - Black or African American
Median resident age - Females - Asian
Median resident age - Females - Hispanic or Latino
Median resident age - Females - American Indian and Alaska Native
Median resident age - Females - Multirace
Median resident age - Females - Other Race
Commute - mean travel time to work (minutes)
Travel time to work - Less than 5 minutes (%)
Travel time to work - Less than 5 minutes (% change since 2000)
Travel time to work - 5 to 9 minutes (%)
Travel time to work - 5 to 9 minutes (% change since 2000)
Travel time to work - 10 to 19 minutes (%)
Travel time to work - 10 to 19 minutes (% change since 2000)
Travel time to work - 20 to 29 minutes (%)
Travel time to work - 20 to 29 minutes (% change since 2000)
Travel time to work - 30 to 39 minutes (%)
Travel time to work - 30 to 39 minutes (% change since 2000)
Travel time to work - 40 to 59 minutes (%)
Travel time to work - 40 to 59 minutes (% change since 2000)
Travel time to work - 60 to 89 minutes (%)
Travel time to work - 60 to 89 minutes (% change since 2000)
Travel time to work - 90 or more minutes (%)
Travel time to work - 90 or more minutes (% change since 2000)
Marital status - Never married (%)
Marital status - Now married (%)
Marital status - Separated (%)
Marital status - Widowed (%)
Marital status - Divorced (%)
Median family income ($)
Median family income (% change since 2000)
Median non-family income ($)
Median non-family income (% change since 2000)
Median per capita income ($)
Median per capita income (% change since 2000)
Median family income ($) - White
Median family income ($) - Black or African American
Median family income ($) - Asian
Median family income ($) - Hispanic or Latino
Median family income ($) - American Indian and Alaska Native
Median family income ($) - Multirace
Median family income ($) - Other Race
Median year house/condo built
Median year apartment built
Year house built - Built 2005 or later (%)
Year house built - Built 2000 to 2004 (%)
Year house built - Built 1990 to 1999 (%)
Year house built - Built 1980 to 1989 (%)
Year house built - Built 1970 to 1979 (%)
Year house built - Built 1960 to 1969 (%)
Year house built - Built 1950 to 1959 (%)
Year house built - Built 1940 to 1949 (%)
Year house built - Built 1939 or earlier (%)
Average household size
Household density (households per square mile)
Average household size - White
Average household size - Black or African American
Average household size - Asian
Average household size - Hispanic or Latino
Average household size - American Indian and Alaska Native
Average household size - Multirace
Average household size - Other Race
Occupied housing units (%)
Vacant housing units (%)
Owner occupied housing units (%)
Renter occupied housing units (%)
Vacancy status - For rent (%)
Vacancy status - For sale only (%)
Vacancy status - Rented or sold, not occupied (%)
Vacancy status - For seasonal, recreational, or occasional use (%)
Vacancy status - For migrant workers (%)
Vacancy status - Other vacant (%)
Residents with income below the poverty level (%)
Residents with income below 50% of the poverty level (%)
Children below poverty level (%)
Poor families by family type - Married-couple family (%)
Poor families by family type - Male, no wife present (%)
Poor families by family type - Female, no husband present (%)
Poverty status for native-born residents (%)
Poverty status for foreign-born residents (%)
Poverty among high school graduates not in families (%)
Poverty among people who did not graduate high school not in families (%)
Residents with income below the poverty level (%) - White
Residents with income below the poverty level (%) - Black or African American
Residents with income below the poverty level (%) - Asian
Residents with income below the poverty level (%) - Hispanic or Latino
Residents with income below the poverty level (%) - American Indian and Alaska Native
Residents with income below the poverty level (%) - Multirace
Residents with income below the poverty level (%) - Other Race
Air pollution - Air Quality Index (AQI)
Air pollution - CO
Air pollution - NO2
Air pollution - SO2
Air pollution - Ozone
Air pollution - PM10
Air pollution - PM25
Air pollution - Pb
Crime - Murders per 100,000 population
Crime - Rapes per 100,000 population
Crime - Robberies per 100,000 population
Crime - Assaults per 100,000 population
Crime - Burglaries per 100,000 population
Crime - Thefts per 100,000 population
Crime - Auto thefts per 100,000 population
Crime - Arson per 100,000 population
Crime - City-data.com crime index
Crime - Violent crime index
Crime - Property crime index
Crime - Murders per 100,000 population (5 year average)
Crime - Rapes per 100,000 population (5 year average)
Crime - Robberies per 100,000 population (5 year average)
Crime - Assaults per 100,000 population (5 year average)
Crime - Burglaries per 100,000 population (5 year average)
Crime - Thefts per 100,000 population (5 year average)
Crime - Auto thefts per 100,000 population (5 year average)
Crime - Arson per 100,000 population (5 year average)
Crime - City-data.com crime index (5 year average)
Crime - Violent crime index (5 year average)
Crime - Property crime index (5 year average)
1996 Presidential Elections Results (%) - Democratic Party (Clinton)
1996 Presidential Elections Results (%) - Republican Party (Dole)
1996 Presidential Elections Results (%) - Other
2000 Presidential Elections Results (%) - Democratic Party (Gore)
2000 Presidential Elections Results (%) - Republican Party (Bush)
2000 Presidential Elections Results (%) - Other
2004 Presidential Elections Results (%) - Democratic Party (Kerry)
2004 Presidential Elections Results (%) - Republican Party (Bush)
2004 Presidential Elections Results (%) - Other
2008 Presidential Elections Results (%) - Democratic Party (Obama)
2008 Presidential Elections Results (%) - Republican Party (McCain)
2008 Presidential Elections Results (%) - Other
2012 Presidential Elections Results (%) - Democratic Party (Obama)
2012 Presidential Elections Results (%) - Republican Party (Romney)
2012 Presidential Elections Results (%) - Other
2016 Presidential Elections Results (%) - Democratic Party (Clinton)
2016 Presidential Elections Results (%) - Republican Party (Trump)
2016 Presidential Elections Results (%) - Other
2020 Presidential Elections Results (%) - Democratic Party (Biden)
2020 Presidential Elections Results (%) - Republican Party (Trump)
2020 Presidential Elections Results (%) - Other
Ancestries Reported - Arab (%)
Ancestries Reported - Czech (%)
Ancestries Reported - Danish (%)
Ancestries Reported - Dutch (%)
Ancestries Reported - English (%)
Ancestries Reported - French (%)
Ancestries Reported - French Canadian (%)
Ancestries Reported - German (%)
Ancestries Reported - Greek (%)
Ancestries Reported - Hungarian (%)
Ancestries Reported - Irish (%)
Ancestries Reported - Italian (%)
Ancestries Reported - Lithuanian (%)
Ancestries Reported - Norwegian (%)
Ancestries Reported - Polish (%)
Ancestries Reported - Portuguese (%)
Ancestries Reported - Russian (%)
Ancestries Reported - Scotch-Irish (%)
Ancestries Reported - Scottish (%)
Ancestries Reported - Slovak (%)
Ancestries Reported - Subsaharan African (%)
Ancestries Reported - Swedish (%)
Ancestries Reported - Swiss (%)
Ancestries Reported - Ukrainian (%)
Ancestries Reported - United States (%)
Ancestries Reported - Welsh (%)
Ancestries Reported - West Indian (%)
Ancestries Reported - Other (%)
Educational Attainment - No schooling completed (%)
Educational Attainment - Less than high school (%)
Educational Attainment - High school or equivalent (%)
Educational Attainment - Less than 1 year of college (%)
Educational Attainment - 1 or more years of college (%)
Educational Attainment - Associate degree (%)
Educational Attainment - Bachelor's degree (%)
Educational Attainment - Master's degree (%)
Educational Attainment - Professional school degree (%)
Educational Attainment - Doctorate degree (%)
School Enrollment - Nursery, preschool (%)
School Enrollment - Kindergarten (%)
School Enrollment - Grade 1 to 4 (%)
School Enrollment - Grade 5 to 8 (%)
School Enrollment - Grade 9 to 12 (%)
School Enrollment - College undergrad (%)
School Enrollment - Graduate or professional (%)
School Enrollment - Not enrolled in school (%)
School enrollment - Public schools (%)
School enrollment - Private schools (%)
School enrollment - Not enrolled (%)
Median number of rooms in houses and condos
Median number of rooms in apartments
Housing units lacking complete plumbing facilities (%)
Housing units lacking complete kitchen facilities (%)
Density of houses
Urban houses (%)
Rural houses (%)
Households with people 60 years and over (%)
Households with people 65 years and over (%)
Households with people 75 years and over (%)
Households with one or more nonrelatives (%)
Households with no nonrelatives (%)
Population in households (%)
Family households (%)
Nonfamily households (%)
Population in families (%)
Family households with own children (%)
Median number of bedrooms in owner occupied houses
Mean number of bedrooms in owner occupied houses
Median number of bedrooms in renter occupied houses
Mean number of bedrooms in renter occupied houses
Median number of vehichles in owner occupied houses
Mean number of vehichles in owner occupied houses
Median number of vehichles in renter occupied houses
Mean number of vehichles in renter occupied houses
Mortgage status - with mortgage (%)
Mortgage status - with second mortgage (%)
Mortgage status - with home equity loan (%)
Mortgage status - with both second mortgage and home equity loan (%)
Mortgage status - without a mortgage (%)
Average family size
Average family size - White
Average family size - Black or African American
Average family size - Asian
Average family size - Hispanic or Latino
Average family size - American Indian and Alaska Native
Average family size - Multirace
Average family size - Other Race
Geographical mobility - Same house 1 year ago (%)
Geographical mobility - Moved within same county (%)
Geographical mobility - Moved from different county within same state (%)
Geographical mobility - Moved from different state (%)
Geographical mobility - Moved from abroad (%)
Place of birth - Born in state of residence (%)
Place of birth - Born in other state (%)
Place of birth - Native, outside of US (%)
Place of birth - Foreign born (%)
Housing units in structures - 1, detached (%)
Housing units in structures - 1, attached (%)
Housing units in structures - 2 (%)
Housing units in structures - 3 or 4 (%)
Housing units in structures - 5 to 9 (%)
Housing units in structures - 10 to 19 (%)
Housing units in structures - 20 to 49 (%)
Housing units in structures - 50 or more (%)
Housing units in structures - Mobile home (%)
Housing units in structures - Boat, RV, van, etc. (%)
House/condo owner moved in on average (years ago)
Renter moved in on average (years ago)
Year householder moved into unit - Moved in 1999 to March 2000 (%)
Year householder moved into unit - Moved in 1995 to 1998 (%)
Year householder moved into unit - Moved in 1990 to 1994 (%)
Year householder moved into unit - Moved in 1980 to 1989 (%)
Year householder moved into unit - Moved in 1970 to 1979 (%)
Year householder moved into unit - Moved in 1969 or earlier (%)
Means of transportation to work - Drove car alone (%)
Means of transportation to work - Carpooled (%)
Means of transportation to work - Public transportation (%)
Means of transportation to work - Bus or trolley bus (%)
Means of transportation to work - Streetcar or trolley car (%)
Means of transportation to work - Subway or elevated (%)
Means of transportation to work - Railroad (%)
Means of transportation to work - Ferryboat (%)
Means of transportation to work - Taxicab (%)
Means of transportation to work - Motorcycle (%)
Means of transportation to work - Bicycle (%)
Means of transportation to work - Walked (%)
Means of transportation to work - Other means (%)
Working at home (%)
Industry diversity
Most Common Industries - Agriculture, forestry, fishing and hunting, and mining (%)
Most Common Industries - Agriculture, forestry, fishing and hunting (%)
Most Common Industries - Mining, quarrying, and oil and gas extraction (%)
Most Common Industries - Construction (%)
Most Common Industries - Manufacturing (%)
Most Common Industries - Wholesale trade (%)
Most Common Industries - Retail trade (%)
Most Common Industries - Transportation and warehousing, and utilities (%)
Most Common Industries - Transportation and warehousing (%)
Most Common Industries - Utilities (%)
Most Common Industries - Information (%)
Most Common Industries - Finance and insurance, and real estate and rental and leasing (%)
Most Common Industries - Finance and insurance (%)
Most Common Industries - Real estate and rental and leasing (%)
Most Common Industries - Professional, scientific, and management, and administrative and waste management services (%)
Most Common Industries - Professional, scientific, and technical services (%)
Most Common Industries - Management of companies and enterprises (%)
Most Common Industries - Administrative and support and waste management services (%)
Most Common Industries - Educational services, and health care and social assistance (%)
Most Common Industries - Educational services (%)
Most Common Industries - Health care and social assistance (%)
Most Common Industries - Arts, entertainment, and recreation, and accommodation and food services (%)
Most Common Industries - Arts, entertainment, and recreation (%)
Most Common Industries - Accommodation and food services (%)
Most Common Industries - Other services, except public administration (%)
Most Common Industries - Public administration (%)
Occupation diversity
Most Common Occupations - Management, business, science, and arts occupations (%)
Most Common Occupations - Management, business, and financial occupations (%)
Most Common Occupations - Management occupations (%)
Most Common Occupations - Business and financial operations occupations (%)
Most Common Occupations - Computer, engineering, and science occupations (%)
Most Common Occupations - Computer and mathematical occupations (%)
Most Common Occupations - Architecture and engineering occupations (%)
Most Common Occupations - Life, physical, and social science occupations (%)
Most Common Occupations - Education, legal, community service, arts, and media occupations (%)
Most Common Occupations - Community and social service occupations (%)
Most Common Occupations - Legal occupations (%)
Most Common Occupations - Education, training, and library occupations (%)
Most Common Occupations - Arts, design, entertainment, sports, and media occupations (%)
Most Common Occupations - Healthcare practitioners and technical occupations (%)
Most Common Occupations - Health diagnosing and treating practitioners and other technical occupations (%)
Most Common Occupations - Health technologists and technicians (%)
Most Common Occupations - Service occupations (%)
Most Common Occupations - Healthcare support occupations (%)
Most Common Occupations - Protective service occupations (%)
Most Common Occupations - Fire fighting and prevention, and other protective service workers including supervisors (%)
Most Common Occupations - Law enforcement workers including supervisors (%)
Most Common Occupations - Food preparation and serving related occupations (%)
Most Common Occupations - Building and grounds cleaning and maintenance occupations (%)
Most Common Occupations - Personal care and service occupations (%)
Most Common Occupations - Sales and office occupations (%)
Most Common Occupations - Sales and related occupations (%)
Most Common Occupations - Office and administrative support occupations (%)
Most Common Occupations - Natural resources, construction, and maintenance occupations (%)
Most Common Occupations - Farming, fishing, and forestry occupations (%)
Most Common Occupations - Construction and extraction occupations (%)
Most Common Occupations - Installation, maintenance, and repair occupations (%)
Most Common Occupations - Production, transportation, and material moving occupations (%)
Most Common Occupations - Production occupations (%)
Most Common Occupations - Transportation occupations (%)
Most Common Occupations - Material moving occupations (%)
People in Group quarters - Institutionalized population (%)
People in Group quarters - Correctional institutions (%)
People in Group quarters - Federal prisons and detention centers (%)
People in Group quarters - Halfway houses (%)
People in Group quarters - Local jails and other confinement facilities (including police lockups) (%)
People in Group quarters - Military disciplinary barracks (%)
People in Group quarters - State prisons (%)
People in Group quarters - Other types of correctional institutions (%)
People in Group quarters - Nursing homes (%)
People in Group quarters - Hospitals/wards, hospices, and schools for the handicapped (%)
People in Group quarters - Hospitals/wards and hospices for chronically ill (%)
People in Group quarters - Hospices or homes for chronically ill (%)
People in Group quarters - Military hospitals or wards for chronically ill (%)
People in Group quarters - Other hospitals or wards for chronically ill (%)
People in Group quarters - Hospitals or wards for drug/alcohol abuse (%)
People in Group quarters - Mental (Psychiatric) hospitals or wards (%)
People in Group quarters - Schools, hospitals, or wards for the mentally retarded (%)
People in Group quarters - Schools, hospitals, or wards for the physically handicapped (%)
People in Group quarters - Institutions for the deaf (%)
People in Group quarters - Institutions for the blind (%)
People in Group quarters - Orthopedic wards and institutions for the physically handicapped (%)
People in Group quarters - Wards in general hospitals for patients who have no usual home elsewhere (%)
People in Group quarters - Wards in military hospitals for patients who have no usual home elsewhere (%)
People in Group quarters - Juvenile institutions (%)
People in Group quarters - Long-term care (%)
People in Group quarters - Homes for abused, dependent, and neglected children (%)
People in Group quarters - Residential treatment centers for emotionally disturbed children (%)
People in Group quarters - Training schools for juvenile delinquents (%)
People in Group quarters - Short-term care, detention or diagnostic centers for delinquent children (%)
People in Group quarters - Type of juvenile institution unknown (%)
People in Group quarters - Noninstitutionalized population (%)
People in Group quarters - College dormitories (includes college quarters off campus) (%)
People in Group quarters - Military quarters (%)
People in Group quarters - On base (%)
People in Group quarters - Barracks, unaccompanied personnel housing (UPH), (Enlisted/Officer), ;and similar group living quarters for military personnel (%)
People in Group quarters - Transient quarters for temporary residents (%)
People in Group quarters - Military ships (%)
People in Group quarters - Group homes (%)
People in Group quarters - Homes or halfway houses for drug/alcohol abuse (%)
People in Group quarters - Homes for the mentally ill (%)
People in Group quarters - Homes for the mentally retarded (%)
People in Group quarters - Homes for the physically handicapped (%)
People in Group quarters - Other group homes (%)
People in Group quarters - Religious group quarters (%)
People in Group quarters - Dormitories (%)
People in Group quarters - Agriculture workers' dormitories on farms (%)
People in Group quarters - Job Corps and vocational training facilities (%)
People in Group quarters - Other workers' dormitories (%)
People in Group quarters - Crews of maritime vessels (%)
People in Group quarters - Other nonhousehold living situations (%)
People in Group quarters - Other noninstitutional group quarters (%)
Residents speaking English at home (%)
Residents speaking English at home - Born in the United States (%)
Residents speaking English at home - Native, born elsewhere (%)
Residents speaking English at home - Foreign born (%)
Residents speaking Spanish at home (%)
Residents speaking Spanish at home - Born in the United States (%)
Residents speaking Spanish at home - Native, born elsewhere (%)
Residents speaking Spanish at home - Foreign born (%)
Residents speaking other language at home (%)
Residents speaking other language at home - Born in the United States (%)
Residents speaking other language at home - Native, born elsewhere (%)
Residents speaking other language at home - Foreign born (%)
Class of Workers - Employee of private company (%)
Class of Workers - Self-employed in own incorporated business (%)
Class of Workers - Private not-for-profit wage and salary workers (%)
Class of Workers - Local government workers (%)
Class of Workers - State government workers (%)
Class of Workers - Federal government workers (%)
Class of Workers - Self-employed workers in own not incorporated business and Unpaid family workers (%)
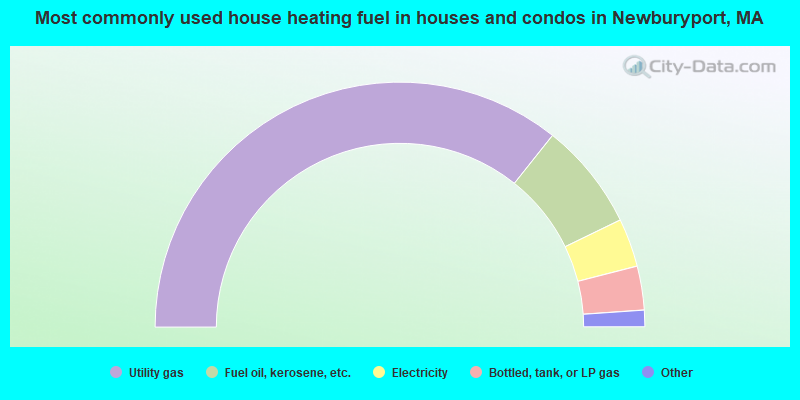
House heating fuel used in houses and condos - Utility gas (%)
House heating fuel used in houses and condos - Bottled, tank, or LP gas (%)
House heating fuel used in houses and condos - Electricity (%)
House heating fuel used in houses and condos - Fuel oil, kerosene, etc. (%)
House heating fuel used in houses and condos - Coal or coke (%)
House heating fuel used in houses and condos - Wood (%)
House heating fuel used in houses and condos - Solar energy (%)
House heating fuel used in houses and condos - Other fuel (%)
House heating fuel used in houses and condos - No fuel used (%)
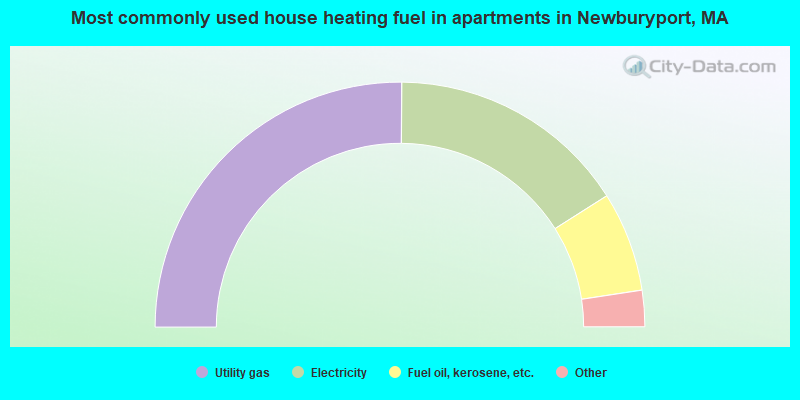
House heating fuel used in apartments - Utility gas (%)
House heating fuel used in apartments - Bottled, tank, or LP gas (%)
House heating fuel used in apartments - Electricity (%)
House heating fuel used in apartments - Fuel oil, kerosene, etc. (%)
House heating fuel used in apartments - Coal or coke (%)
House heating fuel used in apartments - Wood (%)
House heating fuel used in apartments - Solar energy (%)
House heating fuel used in apartments - Other fuel (%)
House heating fuel used in apartments - No fuel used (%)
Armed forces status - In Armed Forces (%)
Armed forces status - Civilian (%)
Armed forces status - Civilian - Veteran (%)
Armed forces status - Civilian - Nonveteran (%)
Fatal accidents locations in years 2005-2021
Fatal accidents locations in 2005
Fatal accidents locations in 2006
Fatal accidents locations in 2007
Fatal accidents locations in 2008
Fatal accidents locations in 2009
Fatal accidents locations in 2010
Fatal accidents locations in 2011
Fatal accidents locations in 2012
Fatal accidents locations in 2013
Fatal accidents locations in 2014
Fatal accidents locations in 2015
Fatal accidents locations in 2016
Fatal accidents locations in 2017
Fatal accidents locations in 2018
Fatal accidents locations in 2019
Fatal accidents locations in 2020
Fatal accidents locations in 2021
Alcohol use - People drinking some alcohol every month (%)
Alcohol use - People not drinking at all (%)
Alcohol use - Average days/month drinking alcohol
Alcohol use - Average drinks/week
Alcohol use - Average days/year people drink much
Audiometry - Average condition of hearing (%)
Audiometry - People that can hear a whisper from across a quiet room (%)
Audiometry - People that can hear normal voice from across a quiet room (%)
Audiometry - Ears ringing, roaring, buzzing (%)
Audiometry - Had a job exposure to loud noise (%)
Audiometry - Had off-work exposure to loud noise (%)
Blood Pressure & Cholesterol - Has high blood pressure (%)
Blood Pressure & Cholesterol - Checking blood pressure at home (%)
Blood Pressure & Cholesterol - Frequently checking blood cholesterol (%)
Blood Pressure & Cholesterol - Has high cholesterol level (%)
Consumer Behavior - Money monthly spent on food at supermarket/grocery store
Consumer Behavior - Money monthly spent on food at other stores
Consumer Behavior - Money monthly spent on eating out
Consumer Behavior - Money monthly spent on carryout/delivered foods
Consumer Behavior - Income spent on food at supermarket/grocery store (%)
Consumer Behavior - Income spent on food at other stores (%)
Consumer Behavior - Income spent on eating out (%)
Consumer Behavior - Income spent on carryout/delivered foods (%)
Current Health Status - General health condition (%)
Current Health Status - Blood donors (%)
Current Health Status - Has blood ever tested for HIV virus (%)
Current Health Status - Left-handed people (%)
Dermatology - People using sunscreen (%)
Diabetes - Diabetics (%)
Diabetes - Had a blood test for high blood sugar (%)
Diabetes - People taking insulin (%)
Diet Behavior & Nutrition - Diet health (%)
Diet Behavior & Nutrition - Milk product consumption (# of products/month)
Diet Behavior & Nutrition - Meals not home prepared (#/week)
Diet Behavior & Nutrition - Meals from fast food or pizza place (#/week)
Diet Behavior & Nutrition - Ready-to-eat foods (#/month)
Diet Behavior & Nutrition - Frozen meals/pizza (#/month)
Drug Use - People that ever used marijuana or hashish (%)
Drug Use - Ever used hard drugs (%)
Drug Use - Ever used any form of cocaine (%)
Drug Use - Ever used heroin (%)
Drug Use - Ever used methamphetamine (%)
Health Insurance - People covered by health insurance (%)
Kidney Conditions-Urology - Avg. # of times urinating at night
Medical Conditions - People with asthma (%)
Medical Conditions - People with anemia (%)
Medical Conditions - People with psoriasis (%)
Medical Conditions - People with overweight (%)
Medical Conditions - Elderly people having difficulties in thinking or remembering (%)
Medical Conditions - People who ever received blood transfusion (%)
Medical Conditions - People having trouble seeing even with glass/contacts (%)
Medical Conditions - People with arthritis (%)
Medical Conditions - People with gout (%)
Medical Conditions - People with congestive heart failure (%)
Medical Conditions - People with coronary heart disease (%)
Medical Conditions - People with angina pectoris (%)
Medical Conditions - People who ever had heart attack (%)
Medical Conditions - People who ever had stroke (%)
Medical Conditions - People with emphysema (%)
Medical Conditions - People with thyroid problem (%)
Medical Conditions - People with chronic bronchitis (%)
Medical Conditions - People with any liver condition (%)
Medical Conditions - People who ever had cancer or malignancy (%)
Mental Health - People who have little interest in doing things (%)
Mental Health - People feeling down, depressed, or hopeless (%)
Mental Health - People who have trouble sleeping or sleeping too much (%)
Mental Health - People feeling tired or having little energy (%)
Mental Health - People with poor appetite or overeating (%)
Mental Health - People feeling bad about themself (%)
Mental Health - People who have trouble concentrating on things (%)
Mental Health - People moving or speaking slowly or too fast (%)
Mental Health - People having thoughts they would be better off dead (%)
Oral Health - Average years since last visit a dentist
Oral Health - People embarrassed because of mouth (%)
Oral Health - People with gum disease (%)
Oral Health - General health of teeth and gums (%)
Oral Health - Average days a week using dental floss/device
Oral Health - Average days a week using mouthwash for dental problem
Oral Health - Average number of teeth
Pesticide Use - Households using pesticides to control insects (%)
Pesticide Use - Households using pesticides to kill weeds (%)
Physical Activity - People doing vigorous-intensity work activities (%)
Physical Activity - People doing moderate-intensity work activities (%)
Physical Activity - People walking or bicycling (%)
Physical Activity - People doing vigorous-intensity recreational activities (%)
Physical Activity - People doing moderate-intensity recreational activities (%)
Physical Activity - Average hours a day doing sedentary activities
Physical Activity - Average hours a day watching TV or videos
Physical Activity - Average hours a day using computer
Physical Functioning - People having limitations keeping them from working (%)
Physical Functioning - People limited in amount of work they can do (%)
Physical Functioning - People that need special equipment to walk (%)
Physical Functioning - People experiencing confusion/memory problems (%)
Physical Functioning - People requiring special healthcare equipment (%)
Prescription Medications - Average number of prescription medicines taking
Preventive Aspirin Use - Adults 40+ taking low-dose aspirin (%)
Reproductive Health - Vaginal deliveries (%)
Reproductive Health - Cesarean deliveries (%)
Reproductive Health - Deliveries resulted in a live birth (%)
Reproductive Health - Pregnancies resulted in a delivery (%)
Reproductive Health - Women breastfeeding newborns (%)
Reproductive Health - Women that had a hysterectomy (%)
Reproductive Health - Women that had both ovaries removed (%)
Reproductive Health - Women that have ever taken birth control pills (%)
Reproductive Health - Women taking birth control pills (%)
Reproductive Health - Women that have ever used Depo-Provera or injectables (%)
Reproductive Health - Women that have ever used female hormones (%)
Sexual Behavior - People 18+ that ever had sex (vaginal, anal, or oral) (%)
Sexual Behavior - Males 18+ that ever had vaginal sex with a woman (%)
Sexual Behavior - Males 18+ that ever performed oral sex on a woman (%)
Sexual Behavior - Males 18+ that ever had anal sex with a woman (%)
Sexual Behavior - Males 18+ that ever had any sex with a man (%)
Sexual Behavior - Females 18+ that ever had vaginal sex with a man (%)
Sexual Behavior - Females 18+ that ever performed oral sex on a man (%)
Sexual Behavior - Females 18+ that ever had anal sex with a man (%)
Sexual Behavior - Females 18+ that ever had any kind of sex with a woman (%)
Sexual Behavior - Average age people first had sex
Sexual Behavior - Average number of female sex partners in lifetime (males 18+)
Sexual Behavior - Average number of female vaginal sex partners in lifetime (males 18+)
Sexual Behavior - Average age people first performed oral sex on a woman (18+)
Sexual Behavior - Average number of woman performed oral sex on in lifetime (18+)
Sexual Behavior - Average number of male sex partners in lifetime (males 18+)
Sexual Behavior - Average number of male anal sex partners in lifetime (males 18+)
Sexual Behavior - Average age people first performed oral sex on a man (18+)
Sexual Behavior - Average number of male oral sex partners in lifetime (18+)
Sexual Behavior - People using protection when performing oral sex (%)
Sexual Behavior - Average number of times people have vaginal or anal sex a year
Sexual Behavior - People having sex without condom (%)
Sexual Behavior - Average number of male sex partners in lifetime (females 18+)
Sexual Behavior - Average number of male vaginal sex partners in lifetime (females 18+)
Sexual Behavior - Average number of female sex partners in lifetime (females 18+)
Sexual Behavior - Circumcised males 18+ (%)
Sleep Disorders - Average hours sleeping at night
Sleep Disorders - People that has trouble sleeping (%)
Smoking-Cigarette Use - People smoking cigarettes (%)
Taste & Smell - People 40+ having problems with smell (%)
Taste & Smell - People 40+ having problems with taste (%)
Taste & Smell - People 40+ that ever had wisdom teeth removed (%)
Taste & Smell - People 40+ that ever had tonsils teeth removed (%)
Taste & Smell - People 40+ that ever had a loss of consciousness because of a head injury (%)
Taste & Smell - People 40+ that ever had a broken nose or other serious injury to face or skull (%)
Taste & Smell - People 40+ that ever had two or more sinus infections (%)
Weight - Average height (inches)
Weight - Average weight (pounds)
Weight - Average BMI
Weight - People that are obese (%)
Weight - People that ever were obese (%)
Weight - People trying to lose weight (%)
According to our research of Massachusetts and other state lists, there were 4 registered sex offenders living in Newburyport, Massachusetts as of April 19, 2024 . The ratio of all residents to sex offenders in Newburyport is 4,515 to 1.The ratio of registered sex offenders to all residents in this city is much lower than the state average.
Officers per 1,000 residents here:
1.71Massachusetts average:
2.53
Latest news from Newburyport, MA collected exclusively by city-data.com from local newspapers, TV, and radio stations
Newburyport, MA City Guides: Ancestries: Irish (22.7%), Italian (13.2%), English (8.7%), European (5.7%), French (4.5%), German (4.2%).
Current Local Time:
Land area: 8.38 square miles.
Population density: 2,226 people per square mile (low).
1,441 residents are foreign born (3.0% Europe , 2.4% Latin America , 1.4% Asia ).
This city:
7.8%Massachusetts:
17.6%
Median real estate property taxes paid for housing units with mortgages in 2022: $7,774 (1.0%)Median real estate property taxes paid for housing units with no mortgage in 2022: $7,359 (0.9%)
Nearest city with pop. 50,000+: Haverhill, MA
Nearest city with pop. 200,000+: Boston, MA
Nearest city with pop. 1,000,000+: Bronx, NY
Nearest cities:
Latitude: 42.81 N, Longitude: 70.88 W
Nickname or alias (official or unofficial): Clipper City
Daytime population change due to commuting: +4,012 (+21.8%)Workers who live and work in this city: 4,121 (43.6%)
Single-family new house construction building permits:
2022: 6 buildings , average cost: $473,5002021: 24 buildings , average cost: $425,4002020: 32 buildings , average cost: $284,9002019: 27 buildings , average cost: $230,6002018: 67 buildings , average cost: $228,8002017: 21 buildings , average cost: $434,9002016: 17 buildings , average cost: $314,9002015: 24 buildings , average cost: $426,7002014: 12 buildings , average cost: $326,1002013: 18 buildings , average cost: $307,0002012: 27 buildings , average cost: $229,0002011: 14 buildings , average cost: $235,2002010: 12 buildings , average cost: $346,4002009: 7 buildings , average cost: $338,0002008: 18 buildings , average cost: $377,8002007: 11 buildings , average cost: $364,7002006: 17 buildings , average cost: $263,2002005: 41 buildings , average cost: $234,4002004: 19 buildings , average cost: $279,9002003: 30 buildings , average cost: $273,3002002: 23 buildings , average cost: $206,7002001: 90 buildings , average cost: $180,5002000: 43 buildings , average cost: $200,4001999: 121 buildings , average cost: $66,2001998: 58 buildings , average cost: $146,6001997: 34 buildings , average cost: $143,700Unemployment in December 2023: Here:
2.8%Massachusetts:
3.5%
Population change in the 1990s: +851 (+5.2%).
Most common occupations in Newburyport, MA (%)
Both Males Females
Other management occupations, except farmers and farm managers (7.7%)
Sales representatives, services, wholesale and manufacturing (4.8%)
Other sales and related occupations, including supervisors (3.9%)
Top executives (3.8%)
Other production occupations, including supervisors (3.2%)
Preschool, kindergarten, elementary, and middle school teachers (3.1%)
Computer specialists (2.8%)
Other management occupations, except farmers and farm managers (9.2%)
Sales representatives, services, wholesale and manufacturing (6.2%)
Top executives (5.7%)
Other production occupations, including supervisors (5.6%)
Engineers (3.4%)
Other sales and related occupations, including supervisors (3.4%)
Computer specialists (3.3%)
Other management occupations, except farmers and farm managers (6.2%)
Preschool, kindergarten, elementary, and middle school teachers (5.8%)
Registered nurses (4.7%)
Other office and administrative support workers, including supervisors (4.6%)
Other sales and related occupations, including supervisors (4.4%)
Secretaries and administrative assistants (3.8%)
Bookkeeping, accounting, and auditing clerks (3.4%)
Tornado activity:
Newburyport-area historical tornado activity is slightly below Massachusetts state average. It is 51% smaller than the overall U.S. average.
On 6/9/1953, a category F3 (max. wind speeds 158-206 mph) tornado 11.9 miles away from the Newburyport city center injured 5 people and caused between $5000 and $50,000 in damages.
On 9/29/1974, a category F3 tornado 21.1 miles away from the city center injured one person and caused between $50,000 and $500,000 in damages.
Earthquake activity:
Newburyport-area historical earthquake activity is significantly above Massachusetts state average. It is 73% smaller than the overall U.S. average. On 10/16/2012 at 23:12:25, a magnitude 4.7 (4.7 ML, Depth: 10.0 mi, Class: Light, Intensity: IV - V) earthquake occurred 55.4 miles away from Newburyport center On 4/20/2002 at 10:50:47, a magnitude 5.3 (5.3 ML, Depth: 3.0 mi, Class: Moderate, Intensity: VI - VII) earthquake occurred 183.6 miles away from the city center On 1/19/1982 at 00:14:42, a magnitude 4.7 (4.5 MB, 4.7 MD, 4.5 LG) earthquake occurred 59.9 miles away from the city center On 10/7/1983 at 10:18:46, a magnitude 5.3 (5.1 MB, 5.3 LG, 5.1 ML) earthquake occurred 191.2 miles away from Newburyport center On 4/20/2002 at 10:50:47, a magnitude 5.2 (5.2 MB, 4.2 MS, 5.2 MW, 5.0 MW) earthquake occurred 183.4 miles away from the city center On 8/22/1992 at 12:20:32, a magnitude 4.8 (4.8 MB, 3.8 MS, 4.7 LG, Depth: 6.2 mi) earthquake occurred 258.0 miles away from the city center Magnitude types: regional Lg-wave magnitude (LG), body-wave magnitude (MB), duration magnitude (MD), local magnitude (ML), surface-wave magnitude (MS), moment magnitude (MW) Natural disasters: The number of natural disasters in Essex County (33) is a lot greater than the US average (15).Major Disasters (Presidential) Declared: 20Emergencies Declared: 13Floods: 14, Storms: 11, Hurricanes: 6, Snowstorms: 5, Winter Storms: 5, Snows: 3, Blizzards: 2, Fire: 1, Heavy Rain: 1, Snowfall: 1, Water Main Break: 1, Wind: 1 (Note: some incidents may be assigned to more than one category). Hospitals in Newburyport: ANNA JAQUES HOSPITAL (Voluntary non-profit - Private, provides emergency services, 25 HIGHLAND AVENUE) Nursing Homes in Newburyport: ANNA JAQUES HOSPITAL SUBACUTE UNIT (25 HIGHLAND AVENUE) BRIGHAM MANOR CONV HOME (77 HIGH ST) COUNTRY MANOR CONVALESCENT CENTER (180 LOW ST) KINDRED NURSING AND REHABILITATION-BRIGHAM (77 HIGH STREET) KINDRED TRANSITIONAL CARE AND REHAB-NEWBURYPORT (180 LOW STREET) PORT HEALTHCARE CENTER (HALE & LOW STREETS) PORT REHABILITATION AND SKILLED NSG (HALE LOW ST) Dialysis Facilities in Newburyport: FMC OF NEWBURYPORT (260 MERRIMAC STREET) Home Health Centers in Newburyport: ANGELS AT HOME HEALTHCARE (6D WINTER STREET) HOME HEALTH CARE OF GT NEWBURYPORT (15 GREEN STREET) Amtrak stations near Newburyport: 11 miles: HAVERHILL (WASHINGTON ST. @ RAILROAD SQUARE) Services: ticket office.
13 miles: EXETER (60 LINCOLN ST.) Services: ticket office.
Operable nuclear power plant near Newburyport:
6 miles: Seabrook in Seabrook, NH.
Colleges/universities with over 2000 students nearest to Newburyport:
Northern Essex Community College (about 9 miles; Haverhill, MA ; Full-time enrollment: 4,737)
North Shore Community College (about 16 miles; Danvers, MA ; FT enrollment: 5,195)
Merrimack College (about 17 miles; North Andover, MA ; FT enrollment: 2,734)
Endicott College (about 18 miles; Beverly, MA ; FT enrollment: 4,064)
Salem State University (about 22 miles; Salem, MA ; FT enrollment: 8,027)
University of New Hampshire-Main Campus (about 23 miles; Durham, NH ; FT enrollment: 15,243)
University of Massachusetts-Lowell (about 26 miles; Lowell, MA ; FT enrollment: 12,341)
Public high school in Newburyport:
Public elementary/middle schools in Newburyport:
Private elementary/middle schools in Newburyport: IMMACULATE CONCEPTION SCHOOL Students: 263, Location: 1 WASHINGTON ST, Grades: PK-8)
INN STREET MONTESSORI SCHOOL Students: 41, Location: 52 INN ST, Grades: 1-8)
See full list of schools located in Newburyport Library in Newburyport: NEWBURYPORT PUBLIC LIBRARY Operating income: $1,247,475; Location: 94 STATE ST.; 106,384 books ; 6,987 audio materials ; 4,322 video materials ; 10 local licensed databases ; 34 state licensed databases ; 3 other licensed databases ; 176 print serial subscriptions )
Notable locations in Newburyport: (A) , Dexter Industrial Green (B) , Newburyport Station (C) , Arrowhead Farm (D) , Port Plaza (E) , Newburyport Harbor Light (F) , Joppan House (G) , Isley House (H) , Healy House (I) , Newburyport City Hall (J) , Newburyport Fire Department (K) , Greater Newburyport Chamber of Commerce (L) , Rogers Medical Library (M) , Newburyport Public Library (N) , Newburyport High School Library (O) , Dalton House (P) , Cushing House (Q) . Display/hide their locations on the map
Churches in Newburyport include: (A) , First Church of Christ Scientist (B) , Central Congregational Church (C) , Assembly of God Church (D) . Display/hide their locations on the map
Cemeteries: (1) , Saint Marys Cemetery (2) , Belleville Cemetery (3) , Highland Cemetery (4) , Oak Hill Cemetery (5) , First Parish Burying Ground (6) . Display/hide their locations on the map
Lakes and reservoirs: (A) , Upper Artichoke Reservoir (B) , Frog Pond (C) , Lower Artichoke Reservoir (D) , Artichoke River Reservoir (E) . Display/hide their locations on the map
Rivers and creeks: (A) , Black Rock Creek (B) . Display/hide their locations on the map
Parks in Newburyport include: (1) , Brown Square (2) , Bartlett Mall (3) , Cashman Park (4) . Display/hide their locations on the map
Tourist attractions: (1) , Cushing House Museum (98 High Street) (2) , Historical Society of Old Newbury (Cultural Attractions- Events- & Facilities; 98 High Street) (3) . Display/hide their approximate locations on the map
Hotels: (1) , Essex Street Inn (7 Essex Street) (2) . Display/hide their approximate locations on the map
Courts: (1) , Essex County - Courts- Ipswich District Court Located At Newburyport (188 State Street) (2) , Essex County - Courts- Superior Court (145 High Street) (3) . Display/hide their approximate locations on the map
Birthplace of: Robert S. Mulliken, William Lloyd Garrison - Journalist, Adolphus Greely - Polar explorer, George Whitefield - (1714-1770), Church of England minister, Methodist leader, Aaron A. Sargent - Politician, Angelo Dagres - Baseball Player, Judith Hoag - Actress, Kyle Abbott - Former Major League Baseball pitcher, Benjamin Perley Poore - Newspaper editor, Moses Kimball - Politician.
Essex County has a predicted average indoor radon screening level greater than 4 pCi/L (pico curies per liter) - Highest Potential Drinking water stations with addresses in Newburyport and their reported violations in the past:
NEWBURYPORT WATER DEPARTMENT (Population served: 20,335, Surface water):
Past health violations:
MCL, Monthly (TCR) - In OCT-2010, Contaminant: Coliform. Follow-up actions: St AO (w/o penalty) issued (NOV-19-2010)
Past monitoring violations:
39 regular monitoring violations
Average household size: This city:
2.2 peopleMassachusetts:
2.5 people
Percentage of family households: This city:
58.2%Whole state:
63.0%
Percentage of households with unmarried partners: This city:
6.9%Whole state:
7.0%
Likely homosexual households (counted as self-reported same-sex unmarried-partner households)
Lesbian couples: 1.0% of all households Gay men: 0.5% of all households
People in group quarters in Newburyport in 2010:
263 people in nursing facilities/skilled-nursing facilities
56 people in other noninstitutional facilities
34 people in group homes intended for adults
18 people in residential treatment centers for adults
15 people in residential treatment centers for juveniles (non-correctional)
People in group quarters in Newburyport in 2000:
275 people in nursing homes
44 people in other noninstitutional group quarters
29 people in homes for the mentally retarded
16 people in homes or halfway houses for drug/alcohol abuse
8 people in residential treatment centers for emotionally disturbed children
6 people in other nonhousehold living situations
3 people in homes for the physically handicapped
Banks with branches in Newburyport (2011 data):
Institution for Savings in Newburyport and Its Vicinity: Storey Avenue Branch, Institution For Savings In Newburypo, Newburyport High School Branch. Info updated 2007/07/16: Bank assets: $1,303.4 mil, Deposits: $1,053.1 mil, local headquarters , positive income , Mortgage Lending Specialization, 9 total offices
TD Bank, National Association: Low Street Branch, Newburyport Branch, State Street Branch. Info updated 2010/10/04: Bank assets: $188,912.6 mil, Deposits: $153,149.8 mil, headquarters in Wilmington, DE, positive income , 1314 total offices , Holding Company: Toronto-Dominion Bank, The
Newburyport Five Cents Savings Bank: Newburyport Branch, Merrimack Place Branch, at 63 State Street. Info updated 2012/02/07: Bank assets: $634.6 mil, Deposits: $460.4 mil, local headquarters , positive income , Commercial Lending Specialization, 7 total offices , Holding Company: Newburyport Five Cents Bancorp Mhc
The First National Bank of Ipswich: Newburyport Branch at 155 State Street, branch established on 1996/10/03. Info updated 2010/06/01: Bank assets: $282.6 mil, Deposits: $223.7 mil, headquarters in Ipswich, MA, positive income , Commercial Lending Specialization, 6 total offices , Holding Company: Brookline Bancorp, Inc.
Eastern Bank: Storey Avenue Branch at 17 Storey Avenue, branch established on 1978/02/08. Info updated 2011/03/30: Bank assets: $7,812.9 mil, Deposits: $6,295.8 mil, headquarters in Boston, MA, positive income , Commercial Lending Specialization, 94 total offices , Holding Company: Eastern Bank Corporation
Sovereign Bank, National Association: Newburyport Branch at 45 Storey Avenue, branch established on 1968/06/05. Info updated 2012/01/31: Bank assets: $78,146.9 mil, Deposits: $48,042.9 mil, headquarters in Wilmington, DE, positive income , Commercial Lending Specialization, 718 total offices , Holding Company: Banco Santander, S.A.
The Provident Bank: Storey Avenue Branch at 66 Storey Avenue, branch established on 2002/09/25. Info updated 2006/11/03: Bank assets: $530.8 mil, Deposits: $404.6 mil, headquarters in Amesbury, MA, positive income , Commercial Lending Specialization, 7 total offices , Holding Company: Provident Bancorp
Bank of America, National Association: Newburyport Branch at 2 State Street, branch established on 1987/06/22. Info updated 2009/11/18: Bank assets: $1,451,969.3 mil, Deposits: $1,077,176.8 mil, headquarters in Charlotte, NC, positive income , 5782 total offices , Holding Company: Bank Of America Corporation
For population 15 years and over in Newburyport:
Never married: 23.3%Now married: 58.4%Separated: 0.4%Widowed: 5.2%Divorced: 12.8% For population 25 years and over in Newburyport:
High school or higher: 97.2%Bachelor's degree or higher: 64.6%Graduate or professional degree: 27.8%Unemployed: 2.9%Mean travel time to work (commute): 25.8 minutes
Education Gini index (Inequality in education) Here:
9.6Massachusetts average:
13.0
Religion statistics for Newburyport, MA (based on Essex County data)
Religion Adherents Congregations Catholic 341,970 55 Mainline Protestant 33,710 140 Evangelical Protestant 20,925 160 Other 15,882 63 Orthodox 11,590 13 Black Protestant 376 3 None 318,706 -
Source: Clifford Grammich, Kirk Hadaway, Richard Houseal, Dale E.Jones, Alexei Krindatch, Richie Stanley and Richard H.Taylor. 2012. 2010 U.S.Religion Census: Religious Congregations & Membership Study. Association of Statisticians of American Religious Bodies. Jones, Dale E., et al. 2002. Congregations and Membership in the United States 2000. Nashville, TN: Glenmary Research Center. Graphs represent county-level data
Food Environment Statistics: Number of grocery stores : 145Here :
1.98 / 10,000 pop.Massachusetts :
1.98 / 10,000 pop.
Number of supercenters and club stores : 3Essex County :
0.04 / 10,000 pop.State :
0.05 / 10,000 pop.
Number of convenience stores (no gas) : 144Essex County :
1.97 / 10,000 pop.State :
2.22 / 10,000 pop.
Number of convenience stores (with gas) : 95Here :
1.30 / 10,000 pop.State :
1.77 / 10,000 pop.
Number of full-service restaurants : 557Here :
7.60 / 10,000 pop.Massachusetts :
8.76 / 10,000 pop.
Adult diabetes rate : Here :
8.4%Massachusetts :
8.1%
Adult obesity rate : Essex County :
23.7%State :
22.5%
Low-income preschool obesity rate : Here :
20.7%Massachusetts :
16.5%
Health and Nutrition: Healthy diet rate : This city:
57.7%State:
50.5%
Average overall health of teeth and gums : Newburyport:
58.6%State:
48.0%
Average BMI : Newburyport:
28.1Massachusetts:
28.4
People feeling badly about themselves : Newburyport:
18.4%Massachusetts:
20.7%
People not drinking alcohol at all : Newburyport:
7.8%State:
10.4%
Average hours sleeping at night : Here:
7.0Massachusetts:
6.8
Overweight people : Newburyport:
34.9%Massachusetts:
33.4%
General health condition : This city:
63.7%Massachusetts:
57.1%
Average condition of hearing : Newburyport:
81.3%Massachusetts:
79.2%
More about Health and Nutrition of Newburyport, MA Residents
Local government employment and payroll (March 2022)
Function
Full-time employees
Monthly full-time payroll
Average yearly full-time wage
Part-time employees
Monthly part-time payroll
Elementary and Secondary - Instruction
343 $2,175,580 $76,114 30 $46,106 Elementary and Secondary - Other Total
67 $353,540 $63,321 19 $16,638 Firefighters
39 $302,972 $93,222 4 $1,515 Police Protection - Officers
38 $334,326 $105,577 2 $4,296 Streets and Highways
34 $216,889 $76,549 0 $0 Local Libraries
21 $87,444 $49,968 2 $233 Water Supply
18 $122,463 $81,642 0 $0 Sewerage
16 $111,600 $83,700 0 $0 Financial Administration
12 $80,195 $80,195 0 $0 Other and Unallocable
11 $117,999 $128,726 8 $7,194 Other Government Administration
11 $68,067 $74,255 29 $21,328 Housing and Community Development (Local)
9 $59,312 $79,083 5 $4,911 Welfare
7 $38,854 $66,607 2 $1,231 Parks and Recreation
4 $23,139 $69,417 1 $299 Health
3 $13,972 $55,888 2 $2,108 Solid Waste Management
2 $11,645 $69,870 4 $994 Electric Power
1 $7,575 $90,900 0 $0
Totals for Government
636 $4,125,573 $77,841 108 $106,853
Newburyport government finances - Expenditure in 2018 (per resident):
Construction - Sewerage: $6,883,000 ($368.82)
Water Utilities: $2,852,000 ($152.82)Current Operations - Elementary and Secondary Education: $39,586,000 ($2121.21)
General - Other: $11,625,000 ($622.92)Sewerage: $7,526,000 ($403.28)Water Utilities: $5,982,000 ($320.54)Local Fire Protection: $3,724,000 ($199.55)Police Protection: $3,567,000 ($191.14)Regular Highways: $2,913,000 ($156.09)Libraries: $1,342,000 ($71.91)Financial Administration: $1,128,000 ($60.44)Solid Waste Management: $1,075,000 ($57.60)Central Staff Services: $746,000 ($39.97)Health - Other: $351,000 ($18.81)Sea and Inland Port Facilities: $331,000 ($17.74)Protective Inspection and Regulation - Other: $276,000 ($14.79)Public Welfare - Other: $262,000 ($14.04)Parks and Recreation: $218,000 ($11.68)Judicial and Legal Services: $111,000 ($5.95)Housing and Community Development: $42,000 ($2.25)Natural Resources - Other: $2,000 ($0.11)Electric Utilities - Interest on Debt: $3,000 ($0.16)
General - Interest on Debt: $3,149,000 ($168.74)
Intergovernmental to Local - Other - Elementary and Secondary Education: $823,000 ($44.10)
Other - Health - Other: $47,000 ($2.52)Intergovernmental to State - Transit Utilities: $153,000 ($8.20)
General - Other: $41,000 ($2.20)Other Capital Outlay - Sewerage: $7,188,000 ($385.17)
General - Other: $6,619,000 ($354.68)Water Utilities: $3,064,000 ($164.18)Regular Highways: $425,000 ($22.77)Elementary and Secondary Education: $175,000 ($9.38)Police Protection: $89,000 ($4.77)General Public Building: $67,000 ($3.59)Sea and Inland Port Facilities: $48,000 ($2.57)Total Salaries and Wages: $37,072,000 ($1986.50)
Water Utilities - Interest on Debt: $1,068,000 ($57.23)
Newburyport government finances - Revenue in 2018 (per resident):
Charges - Sewerage: $12,973,000 ($695.16)
Elementary and Secondary Education School Tuition and Transportation: $723,000 ($38.74)Sea and Inland Port Facilities: $492,000 ($26.36)Elementary and Secondary Education School Lunch: $362,000 ($19.40)Elementary and Secondary Education - Other: $325,000 ($17.42)Other: $219,000 ($11.74)Federal Intergovernmental - Sewerage: $429,000 ($22.99)
Education: $11,000 ($0.59)Local Intergovernmental - Education: $73,000 ($3.91)
Miscellaneous - General Revenue - Other: $1,975,000 ($105.83)
Donations From Private Sources: $337,000 ($18.06)Interest Earnings: $261,000 ($13.99)Fines and Forfeits: $1,000 ($0.05)Revenue - Water Utilities: $10,502,000 ($562.75)
State Intergovernmental - Education: $6,298,000 ($337.48)
Other: $4,182,000 ($224.09)General Local Government Support: $2,694,000 ($144.36)Highways: $356,000 ($19.08)Sewerage: $135,000 ($7.23)Water Utilities: $116,000 ($6.22)Public Welfare: $102,000 ($5.47)Tax - Property: $57,877,000 ($3101.33)
Other License: $965,000 ($51.71)Other Selective Sales: $851,000 ($45.60)
Newburyport government finances - Debt in 2018 (per resident):
Long Term Debt - Beginning Outstanding - Unspecified Public Purpose: $138,414,000 ($7416.89)
Outstanding Unspecified Public Purpose: $135,957,000 ($7285.23)Retired Unspecified Public Purpose: $8,302,000 ($444.86)Issue, Unspecified Public Purpose: $5,845,000 ($313.20)Short Term Debt Outstanding - End of Fiscal Year: $3,935,000 ($210.86)
Beginning: $3,630,000 ($194.51)
Newburyport government finances - Cash and Securities in 2018 (per resident):
Bond Funds - Cash and Securities: $15,297,000 ($819.69)
Other Funds - Cash and Securities: $23,845,000 ($1277.73)
5.09% of this county's 2021 resident taxpayers lived in other counties in 2020 ($96,821 average adjusted gross income )
Here:
5.09%Massachusetts average:
6.35%
0.01% of residents moved from foreign countries ($21 average AGI )Essex County:
0.01%Massachusetts average:
0.01%
Top counties from which taxpayers relocated into this county between 2020 and 2021:
5.47% of this county's 2020 resident taxpayers moved to other counties in 2021 ($95,440 average adjusted gross income )
Here:
5.47%Massachusetts average:
7.18%
0.01% of residents moved to foreign countries ($53 average AGI )Essex County:
0.01%Massachusetts average:
0.02%
Top counties to which taxpayers relocated from this county between 2020 and 2021:
Businesses in Newburyport, MA
Name Count Name Count
CVS 1 Nike 1 Circle K 1 RadioShack 1 DHL 1 Rite Aid 1 Domino's Pizza 1 Shaw's 1 Dunkin Donuts 4 Starbucks 1 FedEx 7 Subway 1 H&R Block 1 T-Mobile 1 Jones New York 2 Talbots 1 Kmart 1 True Value 1 Marshalls 1 UPS 7 MasterBrand Cabinets 1 Vans 1 McDonald's 1 Walgreens 1 New Balance 3 Wendy's 1
Strongest AM radio stations in Newburyport:
WNBP (1450 AM; 1 kW; NEWBURYPORT, MA; Owner: RADIO NEWBURYPORT, LLC)
WRKO (680 AM; 50 kW; BOSTON, MA; Owner: ENTERCOM BOSTON LICENSE, LLC)
WBZ (1030 AM; 50 kW; BOSTON, MA; Owner: INFINITY BROADCASTING OPERATIONS, INC.)
WEEI (850 AM; 50 kW; BOSTON, MA; Owner: ENTERCOM BOSTON LICENSE, LLC)
WWZN (1510 AM; 50 kW; BOSTON, MA; Owner: ROSE CITY RADIO CORPORATION)
WGIP (1540 AM; 5 kW; EXETER, NH; Owner: CAPSTAR TX LIMITED PARTNERSHIP)
WKOX (1200 AM; 50 kW; FRAMINGHAM, MA; Owner: CAPSTAR TX LIMITED PARTNERSHIP)
WBIX (1060 AM; 40 kW; NATICK, MA; Owner: LANGER BROADCASTING CORPORATION)
WDER (1320 AM; 10 kW; DERRY, NH; Owner: BLOUNT COMMUNICATIONS, INC. OF NH)
WRCA (1330 AM; 25 kW; WALTHAM, MA; Owner: WRCA LICENSE, LLC)
WCRN (830 AM; 50 kW; WORCESTER, MA; Owner: CARTER BROADCASTING CORPORATION)
WAMG (890 AM; 25 kW; DEDHAM, MA; Owner: MEGA COMMUNICATIONS OF DEDHAM LICENSEE, LLC)
WCEC (1110 AM; daytime; 5 kW; SALEM, NH; Owner: COSTA-EAGLE RADIO VENTURES LTD PARTNERSHIP)
Strongest FM radio stations in Newburyport:
WNEF (91.7 FM; NEWBURYPORT, MA; Owner: UNIVERSITY OF MASSACHUSETTS)
WSAK (102.1 FM; HAMPTON, NH; Owner: CITADEL BROADCASTING COMPANY)
WXRV (92.5 FM; HAVERHILL, MA; Owner: BEANPOT BROADCASTING CORP.)
WKLB-FM (99.5 FM; LOWELL, MA; Owner: GREATER BOSTON RADIO, INC.)
WQSX (93.7 FM; LAWRENCE, MA; Owner: ENTERCOM BOSTON LICENSE, LLC)
WXKS-FM (107.9 FM; MEDFORD, MA; Owner: AMFM RADIO LICENSES, L.L.C.)
WMJX (106.7 FM; BOSTON, MA; Owner: GREATER BOSTON RADIO, INC.)
WHEB (100.3 FM; PORTSMOUTH, NH; Owner: CAPSTAR TX LIMITED PARTNERSHIP)
WBOQ (104.9 FM; GLOUCESTER, MA; Owner: MARLIN BROADCASTING, LLC)
W227AM (93.3 FM; ANDOVER, MA; Owner: GREATER BOSTON RADIO, INC.)
WERZ (107.1 FM; EXETER, NH; Owner: CAPSTAR TX LIMITED PARTNERSHIP)
WBMX (98.5 FM; BOSTON, MA; Owner: INFINITY RADIO OPERATIONS INC.)
WJMN (94.5 FM; BOSTON, MA; Owner: AMFM RADIO LICENSES, L.L.C.)
WCRB (102.5 FM; WALTHAM, MA; Owner: CHARLES RIVER BROADCASTING WCRB LICE)
WTKK (96.9 FM; BOSTON, MA; Owner: GREATER BOSTON RADIO, INC.)
WBOS (92.9 FM; BROOKLINE, MA; Owner: GREATER BOSTON RADIO, INC.)
WROR-FM (105.7 FM; FRAMINGHAM, MA; Owner: GREATER BOSTON RADIO, INC.)
WGIR-FM (101.1 FM; MANCHESTER, NH; Owner: CAPSTAR TX LIMITED PARTNERSHIP)
WGBH (89.7 FM; BOSTON, MA; Owner: WGBH EDUCATIONAL FOUNDATION)
WQLL (96.5 FM; BEDFORD, NH; Owner: SAGA COMMUNICATIONS OF NEW ENGLAND, LLC)
TV broadcast stations around Newburyport:
WHDN-LP (Channel 26; BOSTON, MA; Owner: GUENTER MARKSTEINER)
WFXZ-CA (Channel 24; BOSTON, MA; Owner: BOSTON BROADCASTING CORP.)
WCVB-TV (Channel 5; BOSTON, MA; Owner: WCVB HEARST-ARGYLE TV, INC.)
WGBH-TV (Channel 2; BOSTON, MA; Owner: WGBH EDUCATIONAL FOUNDATION)
WMEA-TV (Channel 26; BIDDEFORD, ME; Owner: MAINE PUBLIC BROADCASTING CORP.)
WHDH-TV (Channel 7; BOSTON, MA; Owner: WHDH-TV)
WMFP (Channel 62; LAWRENCE, MA; Owner: WSAH LICENSE, INC.)
WSBK-TV (Channel 38; BOSTON, MA; Owner: VIACOM INC.)
WLVI-TV (Channel 56; CAMBRIDGE, MA; Owner: WLVI, INC.)
WBZ-TV (Channel 4; BOSTON, MA; Owner: VIACOM INC.)
WGBX-TV (Channel 44; BOSTON, MA; Owner: WGBH EDUCATIONAL FOUNDATION)
WBPX (Channel 68; BOSTON, MA; Owner: PAXSON BOSTON-68 LICENSE, INC.)
WFXT (Channel 25; BOSTON, MA; Owner: FOX TELEVISION STATIONS INC.)
WUTF (Channel 66; MARLBOROUGH, MA; Owner: TELEFUTURA BOSTON LLC)
WTMU-LP (Channel 32; BOSTON, MA; Owner: ZGS BOSTON, INC.)
WCEA-LP (Channel 58; BOSTON, MA; Owner: CHANNEL 19 TV CORPORATION)
W40BO (Channel 40; BOSTON, MA; Owner: PAXSON COMMUNICATIONS LPTV, INC.)
WNDS (Channel 50; DERRY, NH; Owner: CTV OF DERRY, INC)
Medal of Honor Recipients
Medal of Honor Recipients born in Newburyport: Adolphus W. Greely, Benjamin H. Jellison.
National Bridge Inventory (NBI) Statistics 14 Number of bridges282ft / 86.4m Total length $131,536,000 Total costs246,793 Total average daily traffic7,731 Total average daily truck traffic
New bridges - historical statistics
2 1900-1909 2 1930-1939 9 1970-1979 1 2010-2019
See full National Bridge Inventory statistics for Newburyport, MA
Home Mortgage Disclosure Act Aggregated Statistics For Year 2009(Based on 4 full tracts) A) FHA, FSA/RHS & VA B) Conventional C) Refinancings D) Home Improvement Loans E) Loans on Dwellings For 5+ Families F) Non-occupant Loans on Number Average Value Number Average Value Number Average Value Number Average Value Number Average Value Number Average Value
LOANS ORIGINATED 48 $338,021 160 $277,481 763 $281,405 55 $202,273 1 $450,000 46 $239,065 APPLICATIONS APPROVED, NOT ACCEPTED 1 $378,000 12 $331,333 53 $313,660 7 $181,143 0 $0 2 $274,000 APPLICATIONS DENIED 4 $356,500 21 $247,190 137 $304,482 11 $137,273 1 $5,000 17 $233,000 APPLICATIONS WITHDRAWN 2 $382,500 13 $345,538 106 $314,925 3 $50,000 1 $950,000 10 $328,900 FILES CLOSED FOR INCOMPLETENESS 0 $0 2 $258,500 29 $287,655 0 $0 0 $0 2 $372,000
Aggregated Statistics For Year 2008(Based on 4 full tracts) A) FHA, FSA/RHS & VA B) Conventional C) Refinancings D) Home Improvement Loans E) Loans on Dwellings For 5+ Families F) Non-occupant Loans on G) Loans On Manufactured Number Average Value Number Average Value Number Average Value Number Average Value Number Average Value Number Average Value Number Average Value
LOANS ORIGINATED 13 $296,000 245 $311,951 418 $287,624 45 $157,756 0 $0 68 $249,162 0 $0 APPLICATIONS APPROVED, NOT ACCEPTED 2 $435,500 36 $303,389 41 $274,341 6 $123,333 2 $344,000 13 $239,692 0 $0 APPLICATIONS DENIED 6 $334,667 24 $288,792 92 $329,598 11 $303,182 0 $0 8 $437,000 0 $0 APPLICATIONS WITHDRAWN 5 $319,000 38 $313,816 52 $260,846 7 $170,857 0 $0 8 $323,000 1 $68,000 FILES CLOSED FOR INCOMPLETENESS 0 $0 10 $361,400 17 $304,294 1 $500,000 0 $0 2 $522,500 0 $0
Aggregated Statistics For Year 2007(Based on 4 full tracts) A) FHA, FSA/RHS & VA B) Conventional C) Refinancings D) Home Improvement Loans E) Loans on Dwellings For 5+ Families F) Non-occupant Loans on G) Loans On Manufactured Number Average Value Number Average Value Number Average Value Number Average Value Number Average Value Number Average Value Number Average Value
LOANS ORIGINATED 2 $181,000 337 $273,258 365 $291,658 106 $142,443 4 $407,500 57 $285,316 2 $66,500 APPLICATIONS APPROVED, NOT ACCEPTED 0 $0 37 $217,514 56 $286,232 11 $149,182 0 $0 6 $388,333 0 $0 APPLICATIONS DENIED 0 $0 49 $280,755 121 $289,628 24 $203,875 0 $0 21 $380,476 0 $0 APPLICATIONS WITHDRAWN 1 $230,000 28 $294,321 64 $298,984 8 $253,750 1 $395,000 5 $337,800 0 $0 FILES CLOSED FOR INCOMPLETENESS 0 $0 8 $263,625 22 $296,364 4 $222,500 0 $0 1 $198,000 0 $0
Aggregated Statistics For Year 2006(Based on 4 full tracts) A) FHA, FSA/RHS & VA B) Conventional C) Refinancings D) Home Improvement Loans E) Loans on Dwellings For 5+ Families F) Non-occupant Loans on G) Loans On Manufactured Number Average Value Number Average Value Number Average Value Number Average Value Number Average Value Number Average Value Number Average Value
LOANS ORIGINATED 1 $228,000 437 $265,625 428 $245,140 92 $125,652 4 $654,000 73 $261,767 1 $90,000 APPLICATIONS APPROVED, NOT ACCEPTED 0 $0 47 $329,170 55 $212,327 18 $96,556 0 $0 7 $292,857 0 $0 APPLICATIONS DENIED 0 $0 39 $321,949 143 $305,573 22 $52,000 0 $0 12 $341,833 0 $0 APPLICATIONS WITHDRAWN 0 $0 36 $315,583 125 $254,336 5 $323,400 0 $0 10 $299,900 0 $0 FILES CLOSED FOR INCOMPLETENESS 0 $0 2 $337,000 24 $280,167 1 $40,000 0 $0 1 $277,000 2 $355,000
Aggregated Statistics For Year 2005(Based on 4 full tracts) B) Conventional C) Refinancings D) Home Improvement Loans E) Loans on Dwellings For 5+ Families F) Non-occupant Loans on G) Loans On Manufactured Number Average Value Number Average Value Number Average Value Number Average Value Number Average Value Number Average Value
LOANS ORIGINATED 543 $266,639 487 $256,390 97 $182,588 2 $429,000 106 $247,377 1 $80,000 APPLICATIONS APPROVED, NOT ACCEPTED 42 $253,929 48 $268,917 13 $142,462 0 $0 10 $293,400 1 $30,000 APPLICATIONS DENIED 47 $266,745 136 $297,434 24 $183,042 0 $0 11 $442,364 0 $0 APPLICATIONS WITHDRAWN 53 $249,981 106 $258,142 11 $202,455 0 $0 9 $225,778 0 $0 FILES CLOSED FOR INCOMPLETENESS 20 $205,650 54 $289,796 3 $240,667 0 $0 3 $331,000 0 $0
Aggregated Statistics For Year 2004(Based on 4 full tracts) A) FHA, FSA/RHS & VA B) Conventional C) Refinancings D) Home Improvement Loans E) Loans on Dwellings For 5+ Families F) Non-occupant Loans on G) Loans On Manufactured Number Average Value Number Average Value Number Average Value Number Average Value Number Average Value Number Average Value Number Average Value
LOANS ORIGINATED 1 $263,000 433 $281,617 673 $253,548 47 $178,255 2 $432,500 84 $242,369 0 $0 APPLICATIONS APPROVED, NOT ACCEPTED 0 $0 47 $259,191 63 $249,095 11 $142,273 0 $0 6 $206,500 0 $0 APPLICATIONS DENIED 0 $0 40 $274,200 118 $297,898 18 $92,833 0 $0 8 $239,125 0 $0 APPLICATIONS WITHDRAWN 0 $0 35 $315,057 110 $243,491 11 $137,000 0 $0 4 $313,000 1 $375,000 FILES CLOSED FOR INCOMPLETENESS 0 $0 3 $261,000 62 $254,097 3 $92,333 0 $0 6 $239,833 0 $0
Aggregated Statistics For Year 2003(Based on 4 full tracts) A) FHA, FSA/RHS & VA B) Conventional C) Refinancings D) Home Improvement Loans E) Loans on Dwellings For 5+ Families F) Non-occupant Loans on Number Average Value Number Average Value Number Average Value Number Average Value Number Average Value Number Average Value
LOANS ORIGINATED 5 $236,400 422 $259,213 1,722 $213,573 35 $85,114 4 $307,500 85 $210,659 APPLICATIONS APPROVED, NOT ACCEPTED 0 $0 36 $296,889 144 $210,715 13 $105,923 0 $0 6 $263,833 APPLICATIONS DENIED 0 $0 34 $259,824 201 $242,075 11 $29,636 0 $0 16 $182,250 APPLICATIONS WITHDRAWN 1 $262,000 32 $270,875 180 $231,289 8 $99,375 2 $350,000 12 $279,167 FILES CLOSED FOR INCOMPLETENESS 0 $0 4 $291,750 31 $224,452 0 $0 0 $0 1 $296,000
Aggregated Statistics For Year 2002(Based on 4 full tracts) A) FHA, FSA/RHS & VA B) Conventional C) Refinancings D) Home Improvement Loans E) Loans on Dwellings For 5+ Families F) Non-occupant Loans on Number Average Value Number Average Value Number Average Value Number Average Value Number Average Value Number Average Value
LOANS ORIGINATED 2 $201,500 252 $234,675 630 $205,411 26 $43,808 4 $638,750 57 $199,333 APPLICATIONS APPROVED, NOT ACCEPTED 0 $0 23 $269,739 43 $243,488 3 $43,333 0 $0 6 $198,333 APPLICATIONS DENIED 0 $0 13 $236,385 80 $189,712 8 $43,625 0 $0 2 $286,000 APPLICATIONS WITHDRAWN 0 $0 25 $255,040 61 $214,230 5 $61,800 1 $640,000 6 $224,500 FILES CLOSED FOR INCOMPLETENESS 0 $0 2 $208,000 16 $233,250 2 $32,500 0 $0 1 $89,000
Aggregated Statistics For Year 2001(Based on 4 full tracts) A) FHA, FSA/RHS & VA B) Conventional C) Refinancings D) Home Improvement Loans E) Loans on Dwellings For 5+ Families F) Non-occupant Loans on Number Average Value Number Average Value Number Average Value Number Average Value Number Average Value Number Average Value
LOANS ORIGINATED 3 $125,000 237 $214,194 450 $191,093 17 $42,235 1 $750,000 34 $205,882 APPLICATIONS APPROVED, NOT ACCEPTED 0 $0 14 $260,500 40 $170,925 7 $53,571 0 $0 3 $247,667 APPLICATIONS DENIED 0 $0 18 $217,667 49 $185,571 7 $46,571 0 $0 6 $201,833 APPLICATIONS WITHDRAWN 0 $0 22 $192,636 46 $195,935 5 $83,600 0 $0 4 $140,000 FILES CLOSED FOR INCOMPLETENESS 0 $0 0 $0 12 $146,833 0 $0 0 $0 0 $0
Aggregated Statistics For Year 2000(Based on 4 full tracts) A) FHA, FSA/RHS & VA B) Conventional C) Refinancings D) Home Improvement Loans E) Loans on Dwellings For 5+ Families F) Non-occupant Loans on Number Average Value Number Average Value Number Average Value Number Average Value Number Average Value Number Average Value
LOANS ORIGINATED 2 $154,000 279 $194,122 156 $148,141 35 $30,543 3 $306,333 23 $163,913 APPLICATIONS APPROVED, NOT ACCEPTED 0 $0 24 $175,083 24 $106,792 9 $30,111 1 $221,000 2 $113,000 APPLICATIONS DENIED 0 $0 26 $182,115 32 $139,438 13 $38,154 0 $0 1 $163,000 APPLICATIONS WITHDRAWN 0 $0 32 $208,594 35 $120,171 7 $50,143 1 $510,000 4 $188,250 FILES CLOSED FOR INCOMPLETENESS 0 $0 1 $225,000 7 $204,714 2 $53,000 0 $0 1 $225,000
Aggregated Statistics For Year 1999(Based on 4 full tracts) A) FHA, FSA/RHS & VA B) Conventional C) Refinancings D) Home Improvement Loans E) Loans on Dwellings For 5+ Families F) Non-occupant Loans on Number Average Value Number Average Value Number Average Value Number Average Value Number Average Value Number Average Value
LOANS ORIGINATED 10 $150,941 213 $169,447 262 $133,081 19 $37,693 3 $459,953 40 $132,623 APPLICATIONS APPROVED, NOT ACCEPTED 0 $0 14 $187,686 22 $156,220 4 $21,248 1 $391,680 4 $90,695 APPLICATIONS DENIED 1 $72,460 19 $178,574 21 $147,660 10 $36,650 0 $0 4 $128,018 APPLICATIONS WITHDRAWN 4 $149,755 18 $171,253 30 $123,615 5 $69,026 0 $0 4 $164,680 FILES CLOSED FOR INCOMPLETENESS 0 $0 5 $190,700 13 $153,735 0 $0 0 $0 0 $0
Detailed HMDA statistics for the following Tracts:
2681.00
, 2682.00 , 2683.00 , 2684.00
Private Mortgage Insurance Companies Aggregated Statistics For Year 2009(Based on 4 full tracts) A) Conventional B) Refinancings C) Non-occupant Loans on Number Average Value Number Average Value Number Average Value
LOANS ORIGINATED 17 $281,235 12 $312,667 1 $398,000 APPLICATIONS APPROVED, NOT ACCEPTED 6 $330,333 4 $263,000 0 $0 APPLICATIONS DENIED 5 $239,400 3 $322,667 1 $243,000 APPLICATIONS WITHDRAWN 2 $225,500 0 $0 0 $0 FILES CLOSED FOR INCOMPLETENESS 1 $417,000 0 $0 0 $0
Aggregated Statistics For Year 2008(Based on 4 full tracts) A) Conventional B) Refinancings C) Non-occupant Loans on Number Average Value Number Average Value Number Average Value
LOANS ORIGINATED 59 $328,441 16 $350,500 2 $330,500 APPLICATIONS APPROVED, NOT ACCEPTED 17 $385,412 9 $375,889 0 $0 APPLICATIONS DENIED 9 $334,778 1 $240,000 2 $255,000 APPLICATIONS WITHDRAWN 3 $356,667 0 $0 1 $255,000 FILES CLOSED FOR INCOMPLETENESS 0 $0 0 $0 0 $0
Aggregated Statistics For Year 2007(Based on 4 full tracts) A) Conventional B) Refinancings C) Non-occupant Loans on Number Average Value Number Average Value Number Average Value
LOANS ORIGINATED 60 $301,467 19 $378,263 7 $313,286 APPLICATIONS APPROVED, NOT ACCEPTED 13 $261,000 1 $284,000 1 $300,000 APPLICATIONS DENIED 0 $0 0 $0 0 $0 APPLICATIONS WITHDRAWN 0 $0 0 $0 0 $0 FILES CLOSED FOR INCOMPLETENESS 0 $0 0 $0 0 $0
Aggregated Statistics For Year 2006(Based on 4 full tracts) A) Conventional B) Refinancings C) Non-occupant Loans on Number Average Value Number Average Value Number Average Value
LOANS ORIGINATED 24 $287,458 10 $319,000 3 $388,333 APPLICATIONS APPROVED, NOT ACCEPTED 2 $269,000 4 $404,500 0 $0 APPLICATIONS DENIED 0 $0 0 $0 0 $0 APPLICATIONS WITHDRAWN 4 $236,750 0 $0 0 $0 FILES CLOSED FOR INCOMPLETENESS 0 $0 1 $238,000 0 $0
Aggregated Statistics For Year 2005(Based on 4 full tracts) A) Conventional B) Refinancings C) Non-occupant Loans on Number Average Value Number Average Value Number Average Value
LOANS ORIGINATED 48 $272,562 5 $420,400 4 $411,750 APPLICATIONS APPROVED, NOT ACCEPTED 7 $263,429 2 $414,000 1 $360,000 APPLICATIONS DENIED 0 $0 1 $110,000 1 $110,000 APPLICATIONS WITHDRAWN 3 $303,333 0 $0 0 $0 FILES CLOSED FOR INCOMPLETENESS 0 $0 0 $0 0 $0
Aggregated Statistics For Year 2004(Based on 4 full tracts) A) Conventional B) Refinancings C) Non-occupant Loans on Number Average Value Number Average Value Number Average Value
LOANS ORIGINATED 45 $307,911 6 $273,500 7 $268,143 APPLICATIONS APPROVED, NOT ACCEPTED 9 $269,667 3 $222,333 0 $0 APPLICATIONS DENIED 1 $694,000 0 $0 0 $0 APPLICATIONS WITHDRAWN 1 $290,000 2 $468,000 0 $0 FILES CLOSED FOR INCOMPLETENESS 3 $461,667 0 $0 0 $0
Aggregated Statistics For Year 2003(Based on 4 full tracts) A) Conventional B) Refinancings C) Non-occupant Loans on Number Average Value Number Average Value Number Average Value
LOANS ORIGINATED 81 $250,852 40 $273,025 7 $191,143 APPLICATIONS APPROVED, NOT ACCEPTED 24 $208,167 13 $303,077 2 $241,500 APPLICATIONS DENIED 0 $0 0 $0 0 $0 APPLICATIONS WITHDRAWN 4 $319,500 2 $293,000 1 $423,000 FILES CLOSED FOR INCOMPLETENESS 1 $243,000 1 $265,000 0 $0
Aggregated Statistics For Year 2002(Based on 4 full tracts) A) Conventional B) Refinancings C) Non-occupant Loans on Number Average Value Number Average Value Number Average Value
LOANS ORIGINATED 100 $258,670 25 $259,080 10 $225,200 APPLICATIONS APPROVED, NOT ACCEPTED 15 $244,267 6 $208,333 1 $233,000 APPLICATIONS DENIED 1 $266,000 0 $0 0 $0 APPLICATIONS WITHDRAWN 5 $311,400 3 $276,000 1 $184,000 FILES CLOSED FOR INCOMPLETENESS 0 $0 0 $0 0 $0
Aggregated Statistics For Year 2001(Based on 4 full tracts) A) Conventional B) Refinancings C) Non-occupant Loans on Number Average Value Number Average Value Number Average Value
LOANS ORIGINATED 96 $234,542 16 $223,250 5 $265,600 APPLICATIONS APPROVED, NOT ACCEPTED 13 $214,846 5 $198,000 4 $232,250 APPLICATIONS DENIED 4 $268,750 0 $0 1 $356,000 APPLICATIONS WITHDRAWN 6 $258,333 1 $303,000 1 $234,000 FILES CLOSED FOR INCOMPLETENESS 2 $258,000 0 $0 0 $0
Aggregated Statistics For Year 2000(Based on 4 full tracts) A) Conventional B) Refinancings C) Non-occupant Loans on Number Average Value Number Average Value Number Average Value
LOANS ORIGINATED 103 $210,631 5 $209,200 0 $0 APPLICATIONS APPROVED, NOT ACCEPTED 17 $186,529 0 $0 1 $194,000 APPLICATIONS DENIED 6 $131,833 0 $0 0 $0 APPLICATIONS WITHDRAWN 1 $179,000 0 $0 0 $0 FILES CLOSED FOR INCOMPLETENESS 1 $170,000 0 $0 0 $0
Aggregated Statistics For Year 1999(Based on 4 full tracts) A) Conventional B) Refinancings C) Non-occupant Loans on Number Average Value Number Average Value Number Average Value
LOANS ORIGINATED 112 $194,575 9 $163,331 3 $137,653 APPLICATIONS APPROVED, NOT ACCEPTED 18 $200,911 7 $150,969 2 $128,325 APPLICATIONS DENIED 3 $285,273 0 $0 0 $0 APPLICATIONS WITHDRAWN 2 $134,435 1 $153,980 0 $0 FILES CLOSED FOR INCOMPLETENESS 1 $333,760 0 $0 0 $0
Detailed PMIC statistics for the following Tracts:
2681.00
, 2682.00 , 2683.00 , 2684.00 Newburyport compared to Massachusetts state average:
Unemployed percentage significantly below state average. Black race population percentage significantly below state average. Hispanic race population percentage significantly below state average. Median age above state average. Foreign-born population percentage below state average. Number of college students below state average. Percentage of population with a bachelor's degree or higher above state average. Newburyport on our top lists :
#15 on the list of "Top 101 cities with the biggest property tax revenues per resident (population 10,000+)"
#68 on the list of "Top 101 cities with the biggest local government total salary and wages expenses per resident (population 10,000+)"
#71 on the list of "Top 101 cities with the largest percentage of likely lesbian couples (counted as self-reported female-female unmarried-partner households) (population 5,000+)"
#82 on the list of "Top 101 cities with the most local government spending on current operations of libraries per resident (population 10,000+)"
#21 on the list of "Top 101 counties with the lowest percentage of residents that keep firearms around their homes"
#21 on the list of "Top 101 counties with the most Orthodox adherents"
#23 on the list of "Top 101 counties with the highest carbon monoxide air pollution readings in 2012 (ppm)"
#30 on the list of "Top 101 counties with the most Catholic adherents"
#36 on the list of "Top 101 counties with the most Orthodox congregations (pop. 50,000+)"
Top Patent Applicants
James M. Brugger (56)
Peter F. Vandermeulen (36)
Peter Van Der Meulen (31)
Christian Breuer (31)
Afshin Moshrefi (24)
William Davis Lee (21)
Benjamin B. Riordon (20)
Graham Smith (17)
Kevin J. Knopp (15)
William D. Lee (15)
Total of 768 patent applications in 2008-2024.
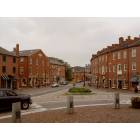
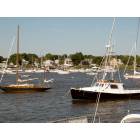
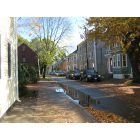
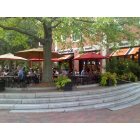

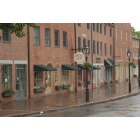


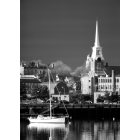
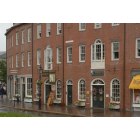
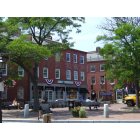


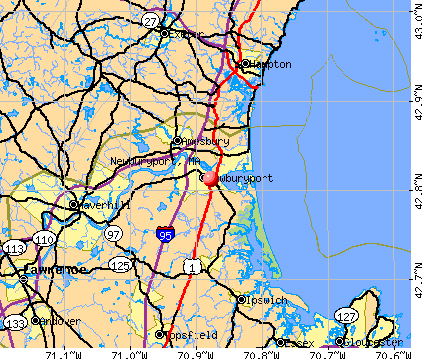


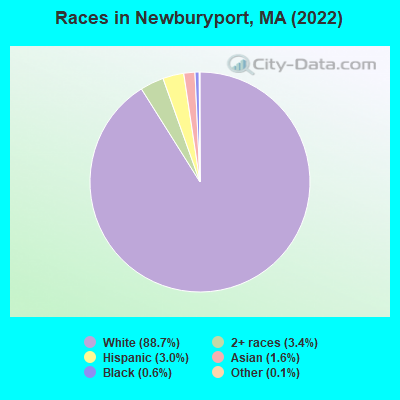
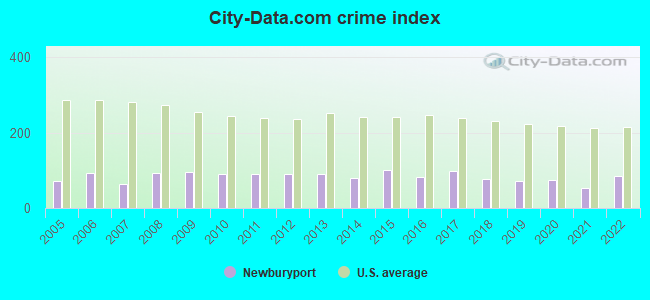
 Recent articles from our blog. Our writers, many of them Ph.D. graduates or candidates, create easy-to-read articles on a wide variety of topics.


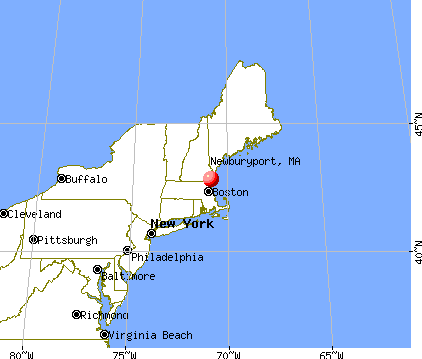
 (10.8 miles
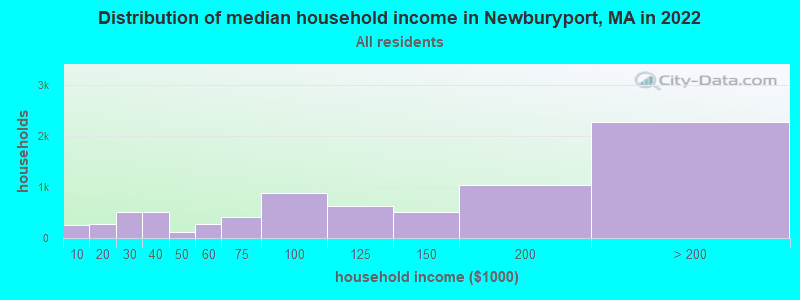
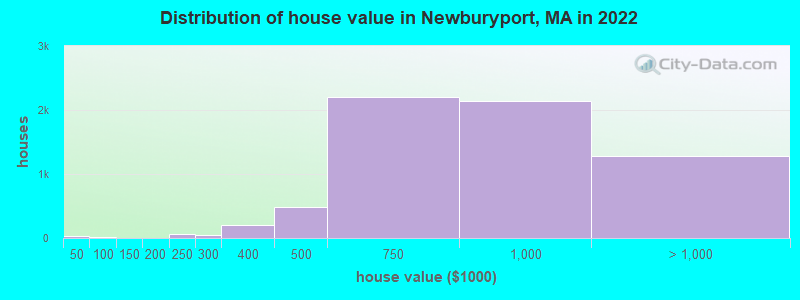
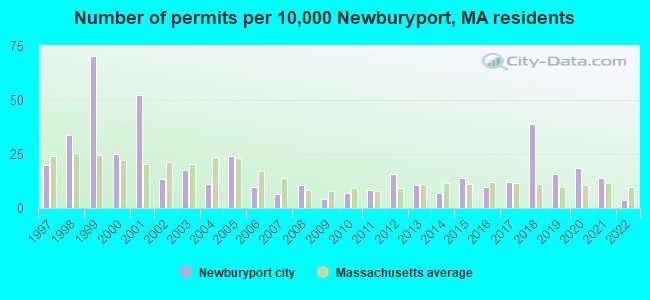
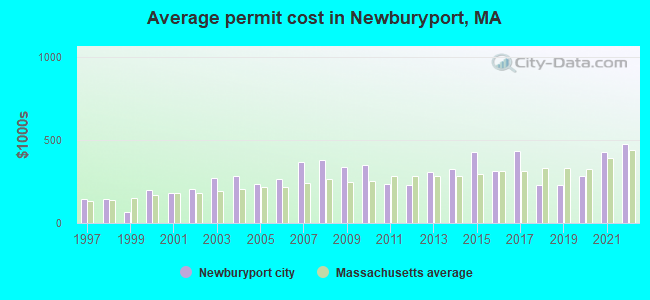
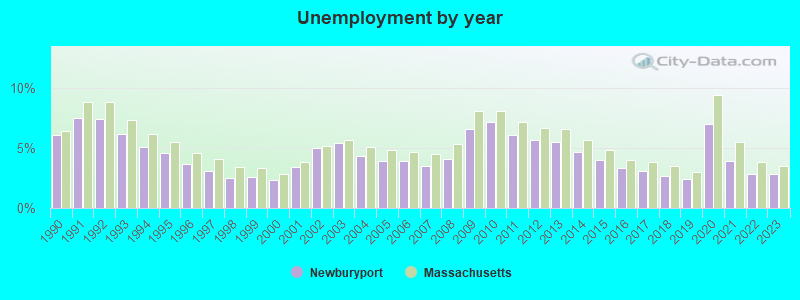
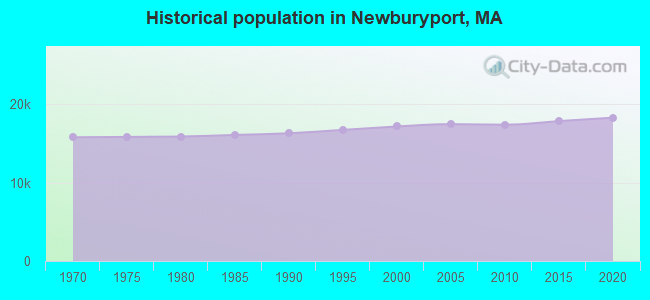
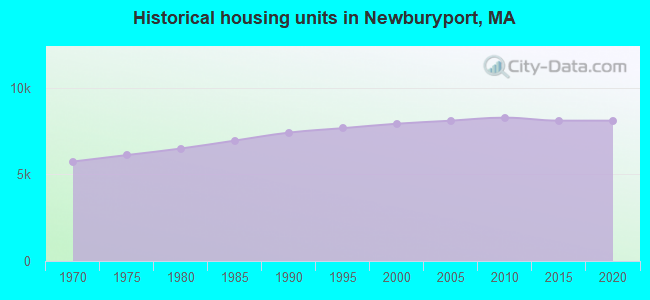
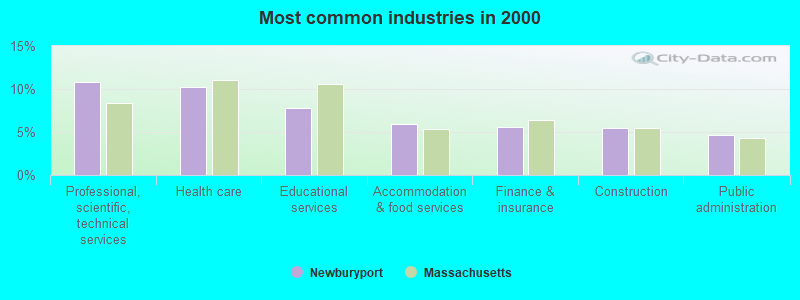
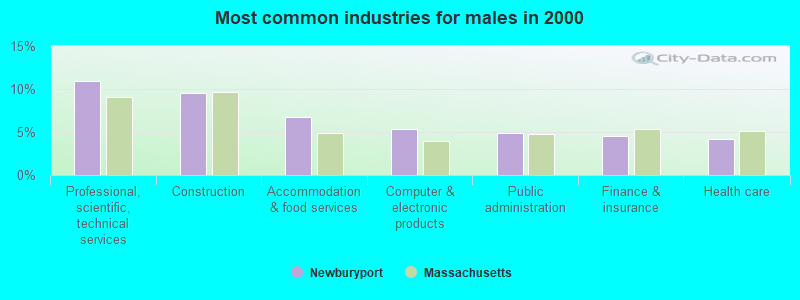
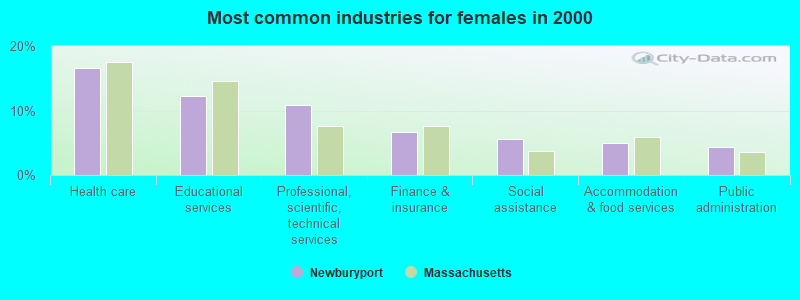
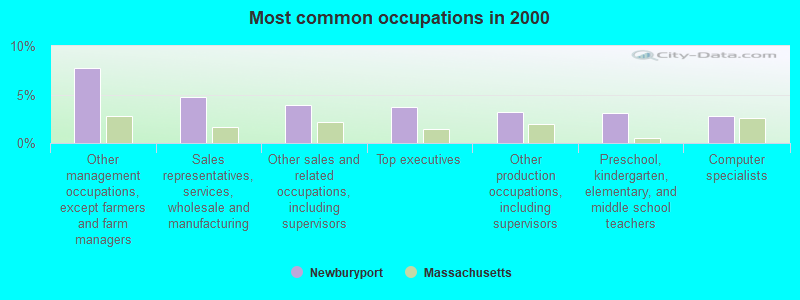
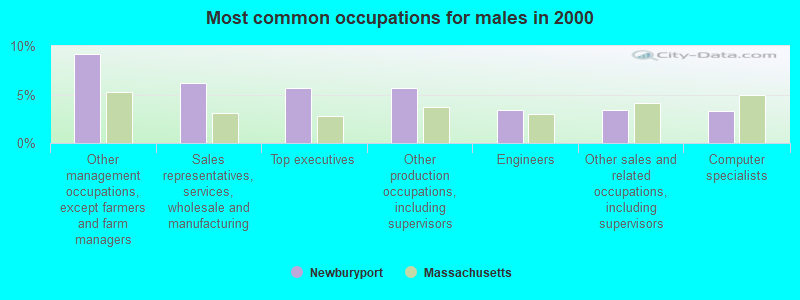
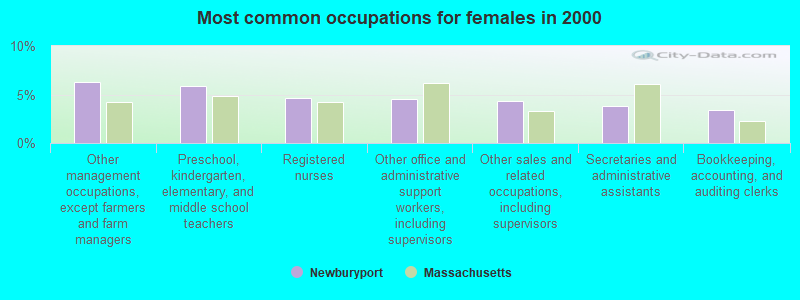
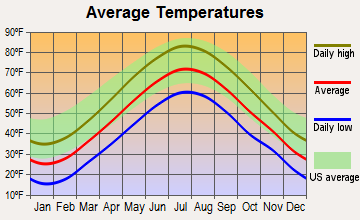
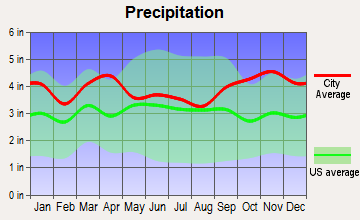
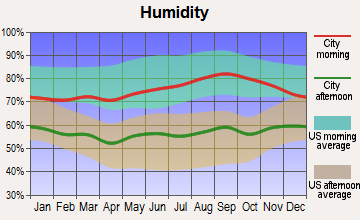
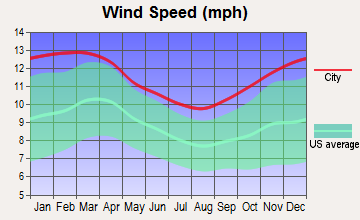
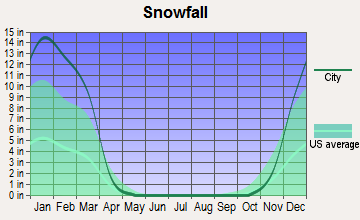
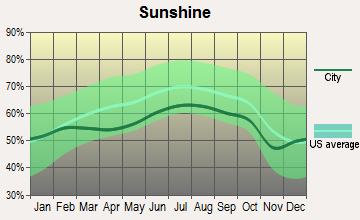
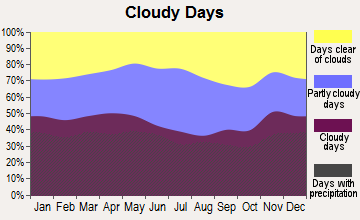
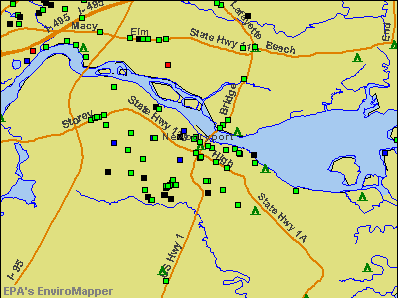

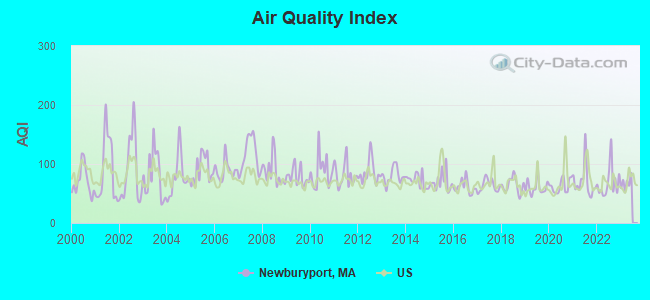
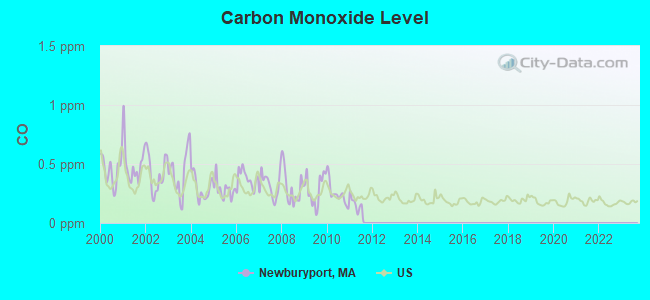
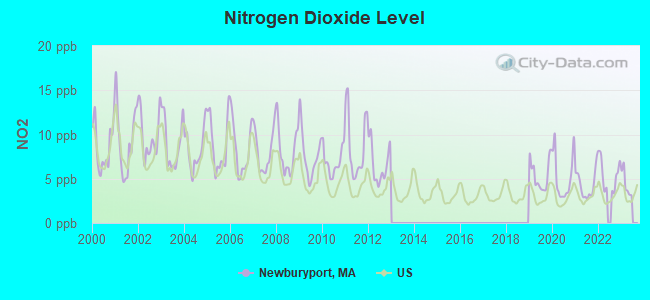
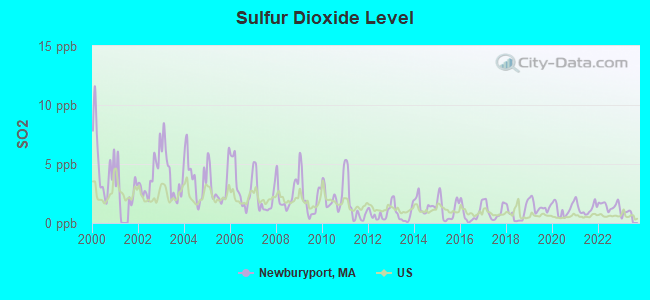
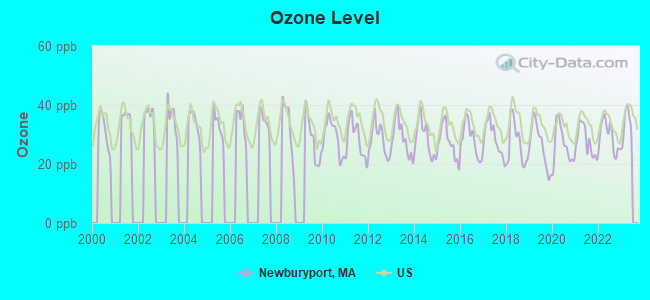
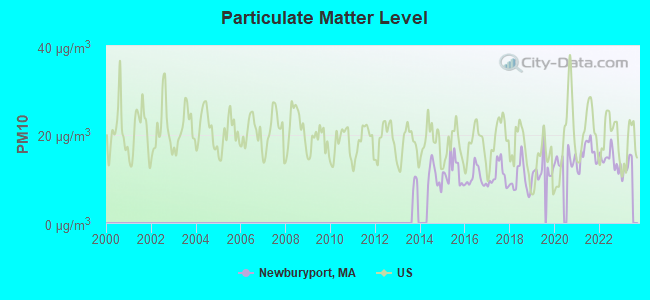
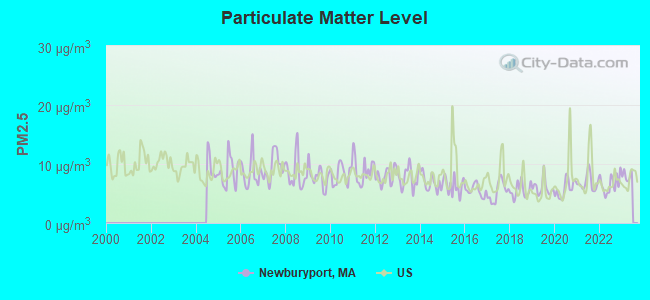
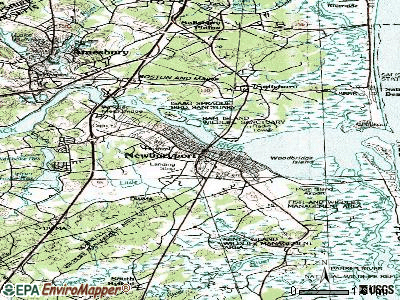
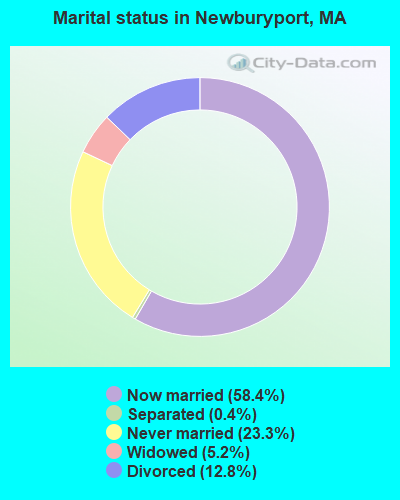
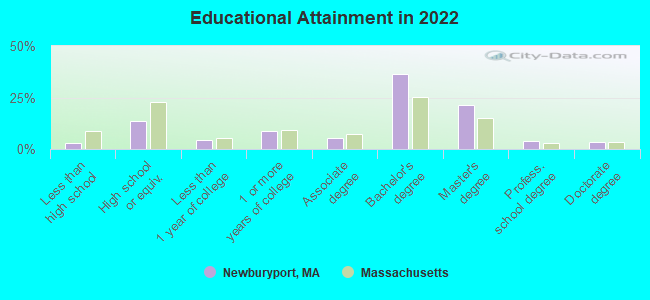
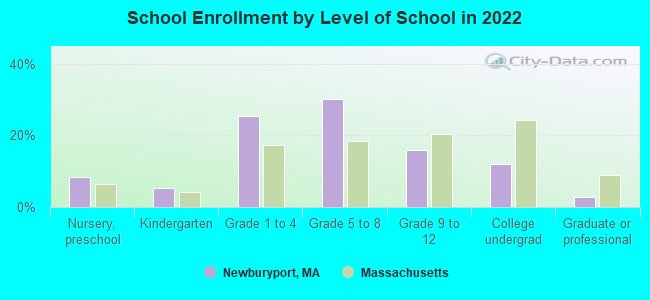
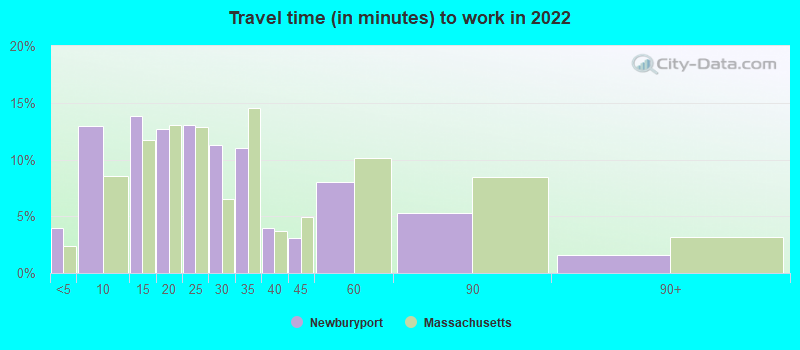
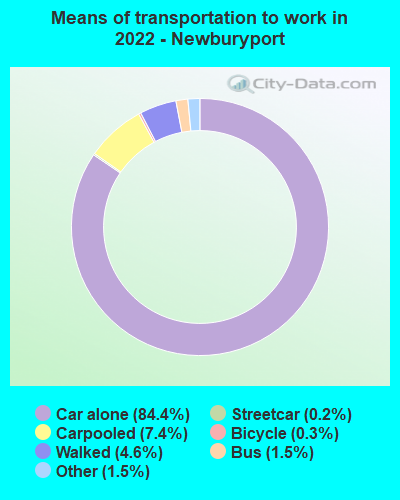
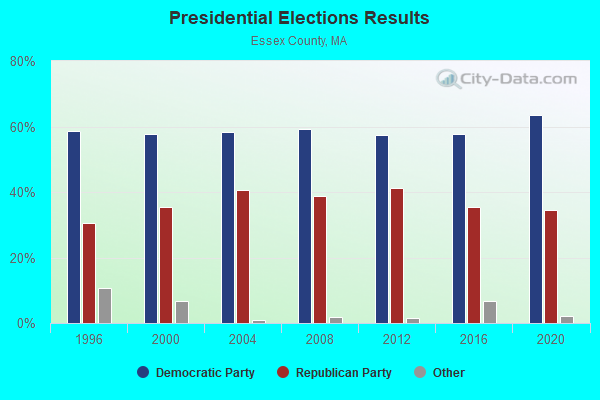
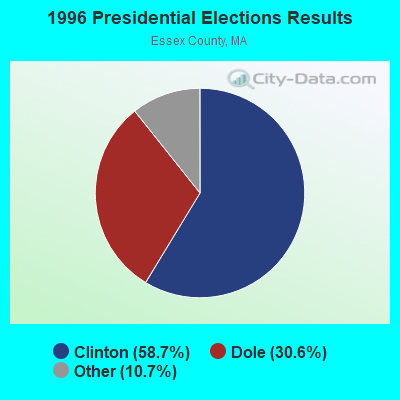
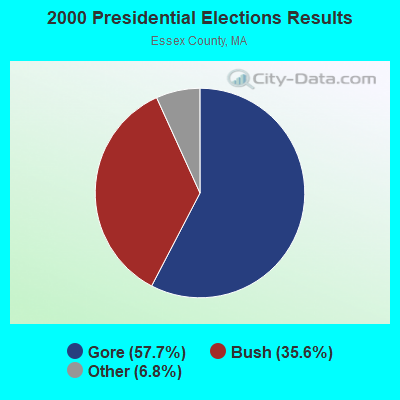
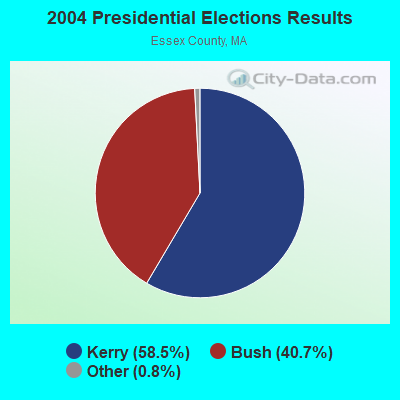
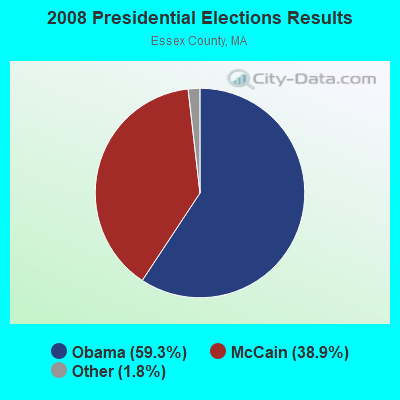
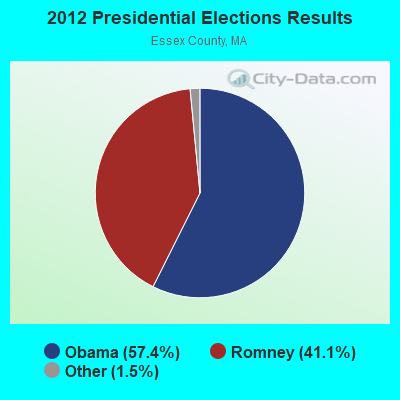
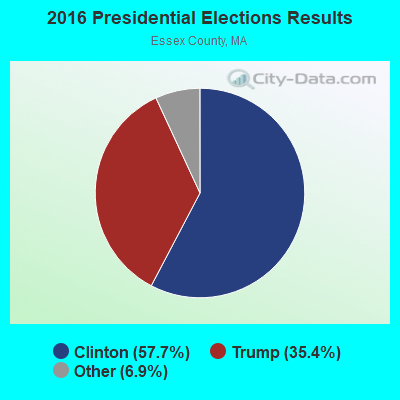
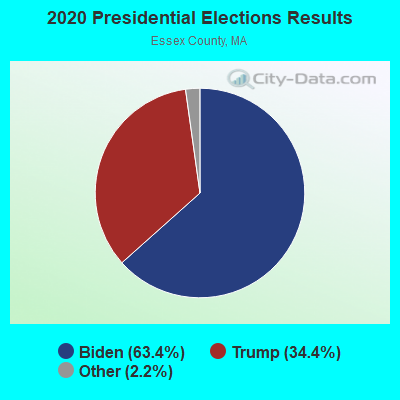
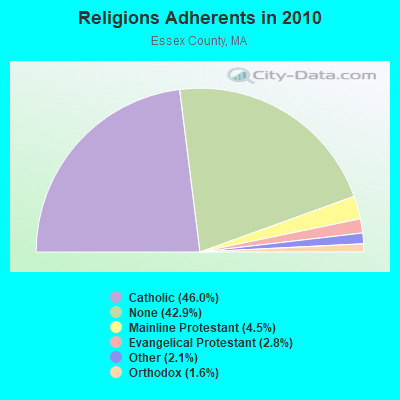
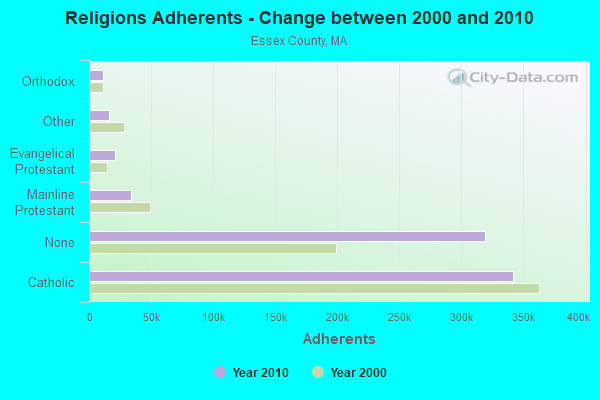
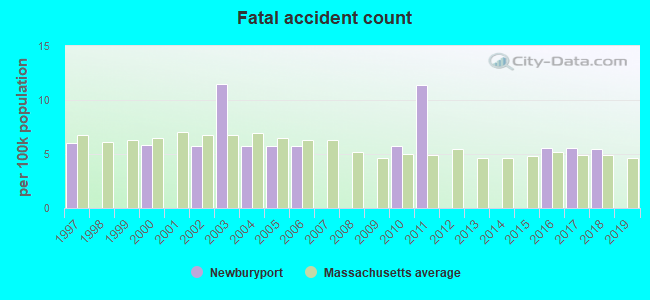
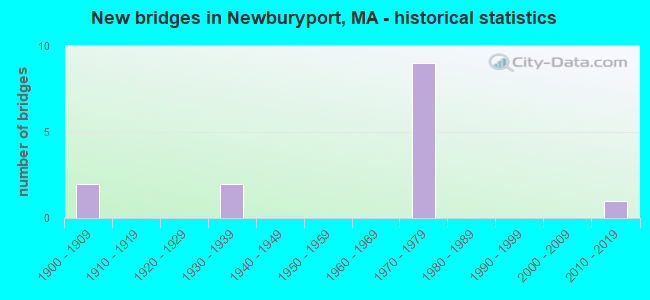
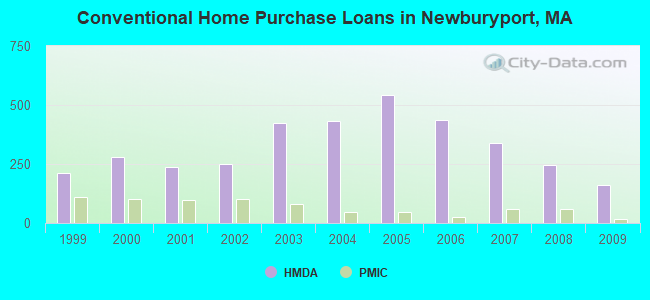
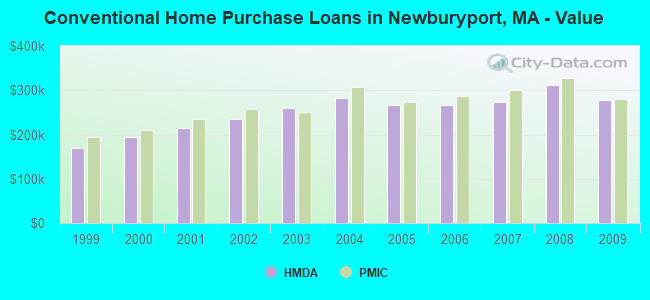
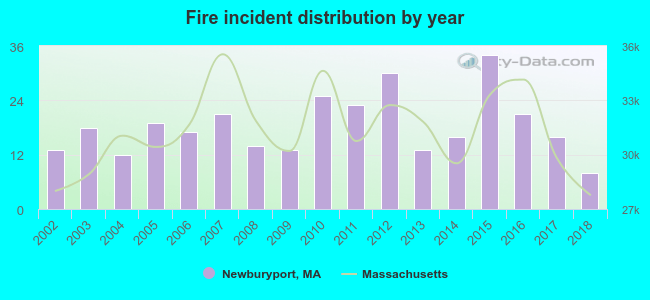 According to the data from the years 2002 - 2018 the average number of fire incidents per year is 18. The highest number of reported fire incidents - 34 took place in 2015, and the least - 8 in 2018. The data has a dropping trend.
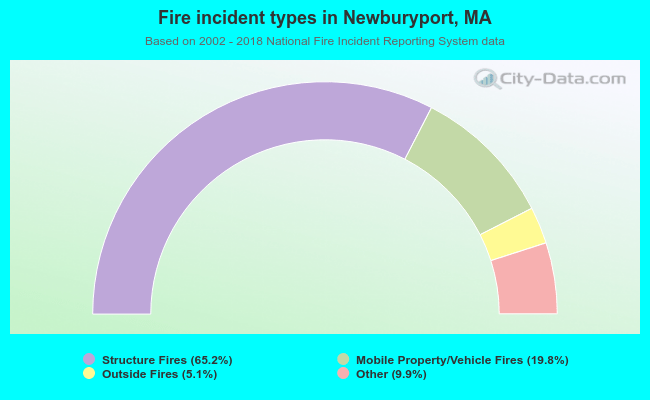 When looking into fire subcategories, the most reports belonged to: Structure Fires (65.2%), and Mobile Property/Vehicle Fires (19.8%).