Palomar-Julian, California
Submit your own pictures of this place and show them to the world
- OSM Map
- Google Map
- MSN Map
| Males: 3,209 | |
| Females: 3,314 |
| Median resident age: | 44.4 years |
| California median age: | 33.3 years |
Zip code: 92070
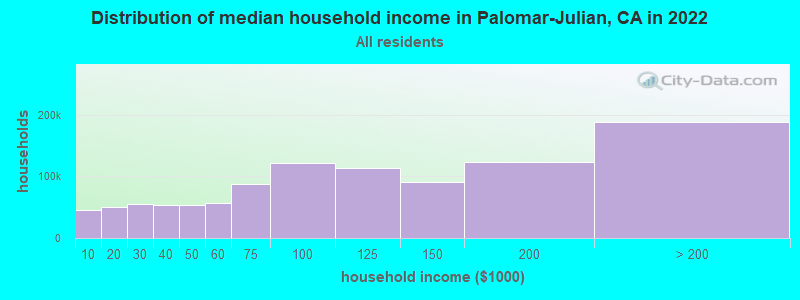
| Palomar-Julian: | $87,786 |
| CA: | $91,551 |
Estimated per capita income in 2022: $49,614 (it was $23,570 in 2000)
Palomar-Julian CCD income, earnings, and wages data
Estimated median house or condo value in 2022: $720,808 (it was $180,500 in 2000)
| Palomar-Julian: | $720,808 |
| CA: | $715,900 |
Mean prices in 2022: all housing units: over $1,000,000; detached houses: over $1,000,000; townhouses or other attached units: $769,037; in 2-unit structures: over $1,000,000; in 3-to-4-unit structures: $948,790; in 5-or-more-unit structures: $697,244; mobile homes: $174,850; occupied boats, rvs, vans, etc.: $27,331
Palomar-Julian, CA residents, houses, and apartments details
Detailed information about poverty and poor residents in Palomar-Julian, CA
Compare current foreclosures near your location:
| Photo | Address | Area | Beds / Baths | Price | Details |
|---|---|---|---|---|---|

|
#1
E 21st Ave
Columbus, OH 43211
|
1,061 sq. feet
|
1 baths 3 beds |
$187,900
|
show details |

|
#2
S High St
Columbus, OH 43207
|
1,678 sq. feet
|
2 baths 4 beds |
$31,900
|
show details |

|
#3
Bayberry Cir
Columbus, OH 43207
|
1,564 sq. feet
|
1 baths 3 beds |
$127,500
|
show details |

|
#4
Kingsglen Dr
Grove City, OH 43123
|
1,635 sq. feet
|
2 baths 4 beds |
show details | |

|
#5
Brookstone Dr
Westerville, OH 43082
|
1,783 sq. feet
|
3 baths 3 beds |
show details | |

|
#6
Falls Peak Ln
Delaware, OH 43015
|
1,352 sq. feet
|
2 baths 2 beds |
show details | |

|
#7
Meadowbrook Dr
Columbus, OH 43207
|
1,752 sq. feet
|
2 baths 4 beds |
show details | |

|
#8
Bunch Flower Ct
Westerville, OH 43082
|
3,173 sq. feet
|
2 baths 4 beds |
show details | |

|
#9
Sleeping Meadow Dr
New Albany, OH 43054
|
3,211 sq. feet
|
2 baths 4 beds |
show details | |

|
#10
Derrer Rd -872
Columbus, OH 43204
|
1,667 sq. feet
|
2 baths 5 beds |
show details |
| Photo | Address | Area | Beds / Baths | Price | Details |
|---|---|---|---|---|---|

|
#11
Elaine Rd
Columbus, OH 43213
|
764 sq. feet
|
1 baths 2 beds |
show details | |

|
#12
Mink St SW
Pataskala, OH 43062
|
1,442 sq. feet
|
1 baths 3 beds |
show details | |

|
#13
Bretton Pl
Columbus, OH 43211
|
1,056 sq. feet
|
1 baths 3 beds |
show details | |

|
#14
Wrexham Ave
Columbus, OH 43223
|
1,235 sq. feet
|
1 baths 3 beds |
show details | |

|
#15
Fergus Rd
Grove City, OH 43123
|
3,312 sq. feet
|
2 baths 4 beds |
show details | |

|
#16
Ferris Rd
Columbus, OH 43224
|
2,218 sq. feet
|
3 baths 3 beds |
show details | |

|
#17
S Hague Ave
Columbus, OH 43204
|
979 sq. feet
|
1 baths 2 beds |
show details | |

|
#18
Fahlander Dr N
Columbus, OH 43229
|
1,338 sq. feet
|
2 baths 3 beds |
show details | |

|
#19
Bernadette Rd
Columbus, OH 43204
|
1,168 sq. feet
|
1 baths 3 beds |
show details | |

|
#20
Midland Ave
Columbus, OH 43223
|
1,518 sq. feet
|
1 baths 2 beds |
show details |
| Photo | Address | Area | Beds / Baths | Price | Details |
|---|---|---|---|---|---|

|
#21
N Roys Ave
Columbus, OH 43204
|
1,248 sq. feet
|
2 baths 3 beds |
show details | |

|
#22
Marshrun Dr
Grove City, OH 43123
|
2,036 sq. feet
|
2 baths 4 beds |
show details | |

|
#23
N Grener Ave
Columbus, OH 43228
|
1,120 sq. feet
|
1 baths 3 beds |
show details | |

|
#24
Belle Oak Dr
Galloway, OH 43119
|
1,296 sq. feet
|
2 baths 3 beds |
show details | |

|
#25
Mayflower Blvd
Columbus, OH 43213
|
1,591 sq. feet
|
2 baths 4 beds |
show details | |

|
#26
Rosewood Ct
Powell, OH 43065
|
2,801 sq. feet
|
3 baths 4 beds |
show details | |

|
#27
High Free Pike
West Jefferson, OH 43162
|
1,216 sq. feet
|
2 baths 4 beds |
show details | |

|
#28
Stoneybrook Blvd # 21a
Hilliard, OH 43026
|
1,231 sq. feet
|
2 baths 3 beds |
show details | |

|
#29
S Richardson Ave
Columbus, OH 43204
|
1,520 sq. feet
|
2 baths 3 beds |
show details | |

|
#30
Edgeview Rd
Columbus, OH 43207
|
1,700 sq. feet
|
1 baths 4 beds |
show details |
| Photo | Address | Area | Beds / Baths | Price | Details |
|---|---|---|---|---|---|

|
#31
Striebel Ct
Columbus, OH 43227
|
925 sq. feet
|
1 baths 3 beds |
show details | |

|
#32
Scottwood Rd
Columbus, OH 43227
|
1,008 sq. feet
|
1 baths 3 beds |
show details | |

|
#33
Vineyard Haven Loop
Dublin, OH 43016
|
4,625 sq. feet
|
4 baths 4 beds |
show details | |

|
#34
S Chillicothe St
Plain City, OH 43064
|
1,736 sq. feet
|
2 baths 4 beds |
show details | |

|
#35
Trotter Dr
Columbus, OH 43207
|
1,478 sq. feet
|
1 baths 3 beds |
show details | |

|
#36
Doral Ave
Columbus, OH 43213
|
2,008 sq. feet
|
2 baths 4 beds |
show details | |

|
#37
Cole Rd
Columbus, OH 43228
|
1,833 sq. feet
|
2 baths 3 beds |
show details | |

|
#38
Bucknell Rd
Columbus, OH 43213
|
1,054 sq. feet
|
1 baths 3 beds |
show details | |

|
#39
Simpson Dr
Columbus, OH 43227
|
1,104 sq. feet
|
1 baths 3 beds |
show details | |

|
#40
Belfast Dr
Columbus, OH 43227
|
1,142 sq. feet
|
2 baths 3 beds |
show details |
| Photo | Address | Area | Beds / Baths | Price | Details |
|---|---|---|---|---|---|

|
#41
Morality Dr
Columbus, OH 43231
|
1,903 sq. feet
|
2 baths 4 beds |
show details | |

|
#42
Torchwood Loop E
Columbus, OH 43229
|
2,421 sq. feet
|
2 baths 5 beds |
show details | |

|
#43
Jason Dr
Columbus, OH 43227
|
1,602 sq. feet
|
2 baths 3 beds |
show details | |

|
#44
Omega Dr
Columbus, OH 43231
|
1,292 sq. feet
|
2 baths 3 beds |
show details | |

|
#45
Oklahoma Ave
Columbus, OH 43230
|
1,824 sq. feet
|
1 baths 4 beds |
show details | |

|
#46
Sapphire Dr
Grove City, OH 43123
|
3,241 sq. feet
|
3 baths 4 beds |
show details | |

|
#47
Colorado Ave
Groveport, OH 43125
|
1,502 sq. feet
|
1 baths 3 beds |
show details | |

|
#48
Allwood Ct
Columbus, OH 43231
|
1,683 sq. feet
|
2 baths 3 beds |
show details | |

|
#49
Jed Ct
Columbus, OH 43227
|
1,086 sq. feet
|
1 baths 3 beds |
show details | |

|
Check over 1 million property listings on Foreclosure.com!
|
browse all offers | |||

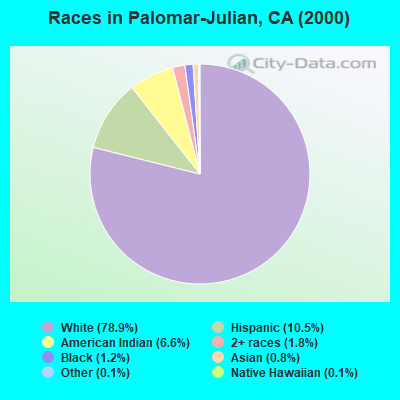
- 4,88578.9%White alone
- 65110.5%Hispanic
- 4076.6%American Indian alone
- 1101.8%Two or more races
- 771.2%Black alone
- 480.8%Asian alone
- 70.1%Native Hawaiian and Other
Pacific Islander alone - 80.1%Other race alone
 Recent articles from our blog. Our writers, many of them Ph.D. graduates or candidates, create easy-to-read articles on a wide variety of topics.

Current Local Time: PST time zone
Land area: 560.9 square miles.
Population density: 12 people per square mile (very low).
| Palomar-Julian CCD: | 0.7% ($1,220) |
| California: | 0.8% ($1,564) |
Nearest city with pop. 50,000+: Escondido, CA  (23.6 miles , pop. 133,559).
Nearest city with pop. 200,000+: San Diego, CA (39.0 miles , pop. 1,223,400).
Nearest cities:
), ), )Latitude: 33.18 N, Longitude: 116.68 W
Area code commonly used in this area: 760
| Here: | 4.3% |
| California: | 5.1% |
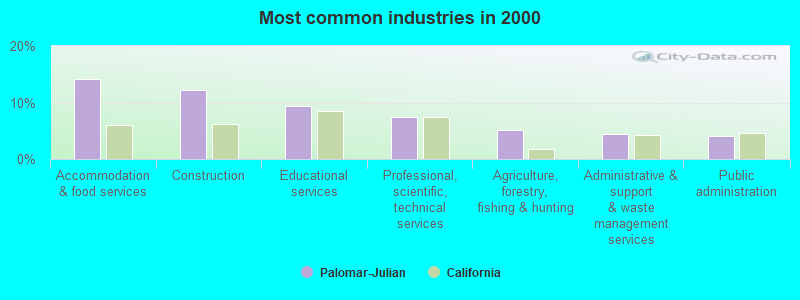
- Accommodation & food services (14.1%)
- Construction (12.3%)
- Educational services (9.3%)
- Professional, scientific, technical services (7.5%)
- Agriculture, forestry, fishing & hunting (5.1%)
- Administrative & support & waste management services (4.5%)
- Public administration (4.0%)
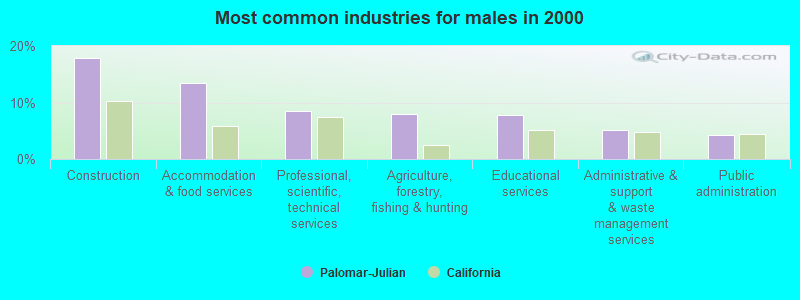
- Construction (17.8%)
- Accommodation & food services (13.4%)
- Professional, scientific, technical services (8.4%)
- Agriculture, forestry, fishing & hunting (8.0%)
- Educational services (7.9%)
- Administrative & support & waste management services (5.2%)
- Public administration (4.2%)
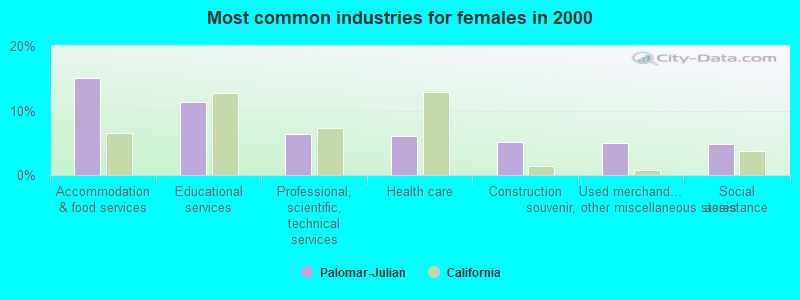
- Accommodation & food services (15.0%)
- Educational services (11.3%)
- Professional, scientific, technical services (6.3%)
- Health care (6.1%)
- Construction (5.2%)
- Used merchandise, gift, novelty, souvenir, other miscellaneous stores (5.0%)
- Social assistance (4.8%)
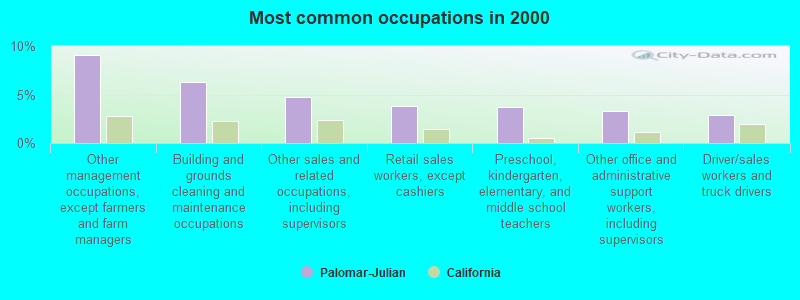
- Other management occupations, except farmers and farm managers (9.1%)
- Building and grounds cleaning and maintenance occupations (6.3%)
- Other sales and related occupations, including supervisors (4.8%)
- Retail sales workers, except cashiers (3.8%)
- Preschool, kindergarten, elementary, and middle school teachers (3.7%)
- Other office and administrative support workers, including supervisors (3.2%)
- Driver/sales workers and truck drivers (2.9%)
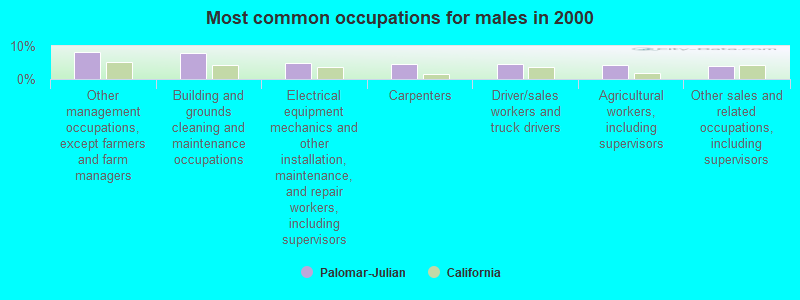
- Other management occupations, except farmers and farm managers (8.2%)
- Building and grounds cleaning and maintenance occupations (8.0%)
- Electrical equipment mechanics and other installation, maintenance, and repair workers, including supervisors (4.9%)
- Carpenters (4.5%)
- Driver/sales workers and truck drivers (4.5%)
- Agricultural workers, including supervisors (4.4%)
- Other sales and related occupations, including supervisors (3.8%)
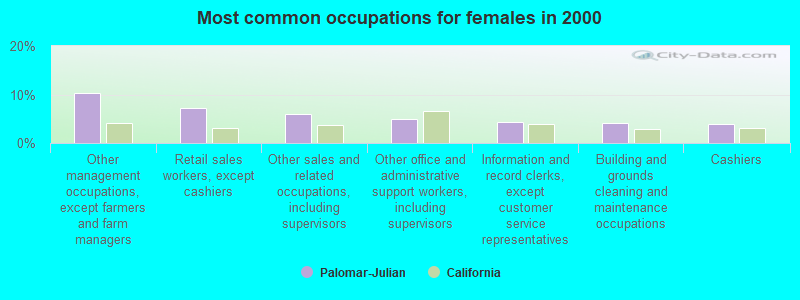
- Other management occupations, except farmers and farm managers (10.3%)
- Retail sales workers, except cashiers (7.2%)
- Other sales and related occupations, including supervisors (6.0%)
- Other office and administrative support workers, including supervisors (4.9%)
- Information and record clerks, except customer service representatives (4.3%)
- Building and grounds cleaning and maintenance occupations (4.2%)
- Cashiers (4.0%)
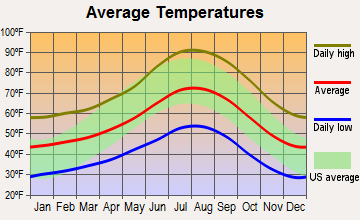
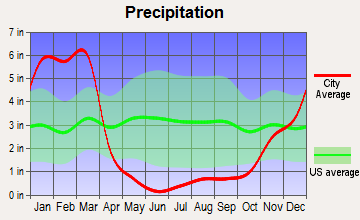
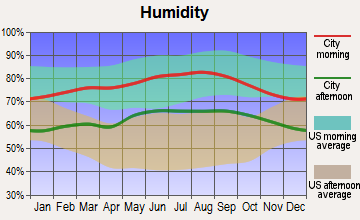
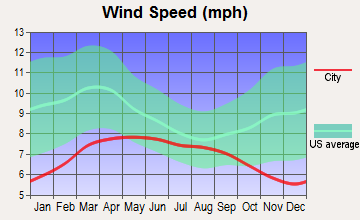
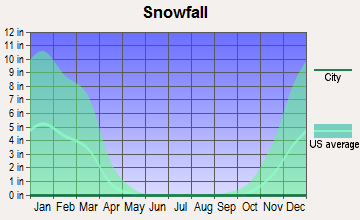
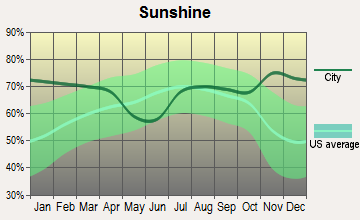
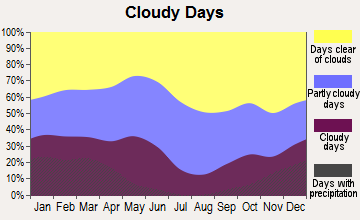
Average climate in Palomar-Julian, California
Based on data reported by over 4,000 weather stations
(lower is better)
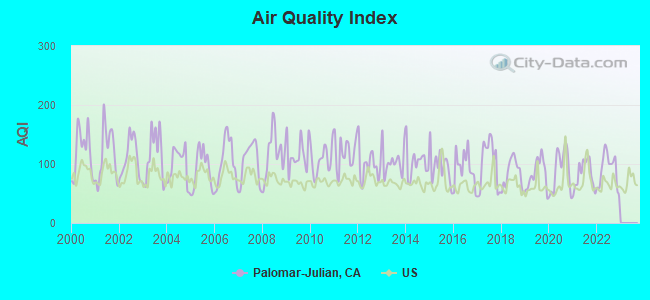
Air Quality Index (AQI) level in 2022 was 90.8. This is worse than average.
| City: | 90.8 |
| U.S.: | 72.6 |
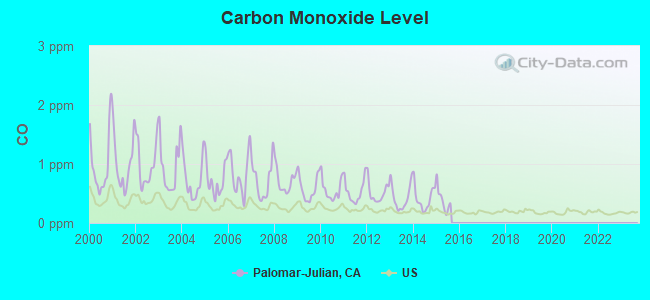
Carbon Monoxide (CO) [ppm] level in 2015 was 0.391. This is significantly worse than average. Closest monitor was 23.2 miles away from the city center.
| City: | 0.391 |
| U.S.: | 0.251 |
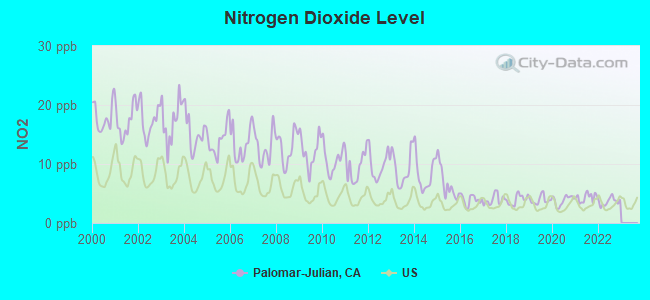
Nitrogen Dioxide (NO2) [ppb] level in 2022 was 3.63. This is significantly better than average. Closest monitor was 23.2 miles away from the city center.
| City: | 3.63 |
| U.S.: | 5.11 |
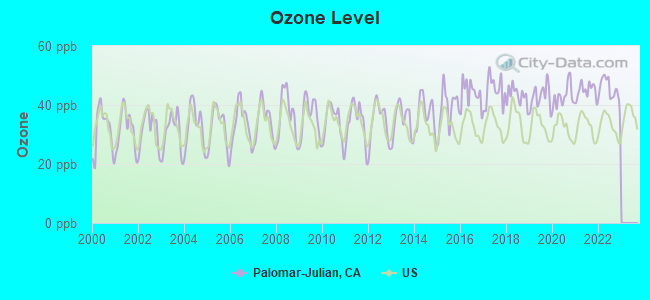
Ozone [ppb] level in 2022 was 45.1. This is worse than average. Closest monitor was 23.2 miles away from the city center.
| City: | 45.1 |
| U.S.: | 33.3 |
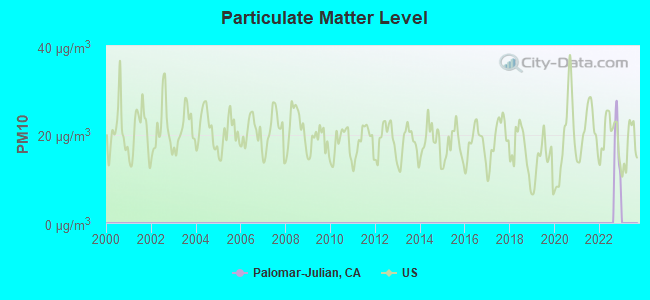
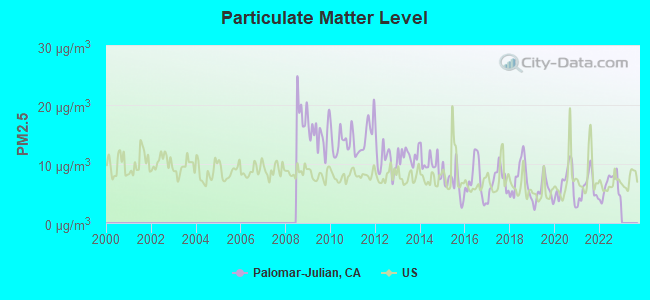
Particulate Matter (PM2.5) [µg/m3] level in 2022 was 6.28. This is better than average. Closest monitor was 23.2 miles away from the city center.
| City: | 6.28 |
| U.S.: | 8.11 |
Earthquake activity:
Palomar-Julian-area historical earthquake activity is significantly above California state average. It is 6372% greater than the overall U.S. average.On 6/28/1992 at 11:57:34, a magnitude 7.6 (6.2 MB, 7.6 MS, 7.3 MW, Depth: 0.7 mi, Class: Major, Intensity: VIII - XII) earthquake occurred 69.6 miles away from Palomar-Julian center, causing 3 deaths (1 shaking deaths, 2 other deaths) and 400 injuries, causing $100,000,000 total damage and $40,000,000 insured losses
On 10/16/1999 at 09:46:44, a magnitude 7.4 (6.3 MB, 7.4 MS, 7.2 MW, 7.3 ML) earthquake occurred 93.1 miles away from the city center
On 7/21/1952 at 11:52:14, a magnitude 7.7 (7.7 UK) earthquake occurred 182.8 miles away from Palomar-Julian center, causing $50,000,000 total damage
On 5/19/1940 at 04:36:40, a magnitude 7.2 (7.2 UK) earthquake occurred 56.9 miles away from the city center, causing $33,000,000 total damage
On 12/31/1934 at 18:45:56, a magnitude 7.1 (7.1 UK) earthquake occurred 63.6 miles away from the city center
On 10/15/1979 at 23:16:54, a magnitude 7.0 (5.7 MB, 6.9 MS, 7.0 ML, 6.4 MW) earthquake occurred 65.6 miles away from Palomar-Julian center
Magnitude types: body-wave magnitude (MB), local magnitude (ML), surface-wave magnitude (MS), moment magnitude (MW)
Natural disasters:
The number of natural disasters in San Diego County (39) is a lot greater than the US average (15).Major Disasters (Presidential) Declared: 21
Emergencies Declared: 2
Causes of natural disasters: Fires: 21, Floods: 17, Storms: 9, Winter Storms: 6, Landslides: 5, Mudslides: 4, Freeze: 1, Heavy Rain: 1, Hurricane: 1, Tornado: 1, Other: 1 (Note: some incidents may be assigned to more than one category).
Colleges/universities with over 2000 students nearest to Palomar-Julian:
- California State University-San Marcos (about 28 miles; San Marcos, CA; Full-time enrollment: 8,070)
- Palomar College (about 30 miles; San Marcos, CA; FT enrollment: 15,037)
- Alliant International University (about 32 miles; San Diego, CA; FT enrollment: 3,155)
- Grossmont College (about 32 miles; El Cajon, CA; FT enrollment: 10,461)
- San Diego Miramar College (about 32 miles; San Diego, CA; FT enrollment: 5,128)
- Cuyamaca College (about 35 miles; El Cajon, CA; FT enrollment: 4,270)
- MiraCosta College (about 37 miles; Oceanside, CA; FT enrollment: 11,189)
Points of interest:
Notable locations in Palomar-Julian: Pine Hills Lodge (A), Treanor Ranch (B), Mesa Chiquita Ranch (C), Matagua Ranch (D), Inspiration Point (E), Peacefield Orchard (F), Henshaw Wildlife Viewing Site (G), Indian Flats Campground (H), Indian Flats Group Campground (I), Oak Grove Campground (J), Observatory Campground (K), Crestline Camp (L), Cedar Glen Camp (M), Camp Marston (N), Bishop Stevens Campground (O), Mitchell Camp (P), Montezuma Honor Camp (Q), Baptist Camp (R), Banner Queen Trading Post (S), Almond Ranch (T). Display/hide their locations on the map
Churches in Palomar-Julian include: Santa Ysabel Chapel (A), Saint Francis Chapel (B), Julian Community Baptist Church (C), Saint Elizabeths Church (D). Display/hide their locations on the map
Cemetery: Julian Cemetery (1). Display/hide its location on the map
Lakes, reservoirs, and swamps: Lost Lake (A), Lake Jean (B), Twin Lakes (C), Big Lake (D), Chimney Lake (E), Swan Lake (F), Lake Henshaw (G), Deer Lake (H). Display/hide their locations on the map
Streams, rivers, and creeks: Coleman Creek (A), Mariette Creek (B), Carrizo Creek (C), Carrista Creek (D), Lion Creek (E), Cañada Verruga (F), Cañada Buena Vista (G), Buena Vista Creek (H), Boring Creek (I). Display/hide their locations on the map
Parks in Palomar-Julian include: Palomar Mountain State Park (1), Lake Henshaw (2), Camp Wright Historical Marker (3), Boden Field (4), Inaja Memorial Park (5), Oak Grove Stage Station Historical Marker (6), Doane Valley Natural Preserve (7), Frank Lane Park (8), Jess Martin Park (9). Display/hide their locations on the map
| This place: | 2.2 people |
| California: | 2.9 people |
| This place: | 63.3% |
| Whole state: | 68.7% |
| This place: | 7.0% |
| Whole state: | 7.2% |
Likely homosexual households (counted as self-reported same-sex unmarried-partner households)
- Lesbian couples: 0.6% of all households
- Gay men: 0.4% of all households
| This place: | 11.1% |
| Whole state: | 14.2% |
| This place: | 4.1% |
| Whole state: | 6.3% |
People in group quarters in Palomar-Julian in 2010:
- 99 people in state prisons
- 41 people in workers' group living quarters and job corps centers
- 30 people in residential treatment centers for adults
- 3 people in group homes intended for adults
- 3 people in other noninstitutional facilities
People in group quarters in Palomar-Julian in 2000:
- 128 people in local jails and other confinement facilities (including police lockups)
- 21 people in training schools for juvenile delinquents
- 19 people in other nonhousehold living situations
For population 15 years and over in Palomar-Julian:
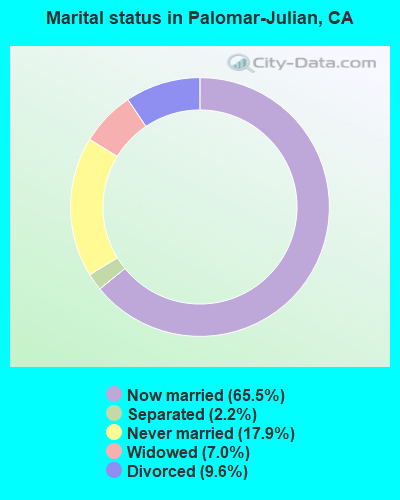
- Never married: 17.9%
- Now married: 65.5%
- Separated: 2.2%
- Widowed: 7.0%
- Divorced: 9.6%
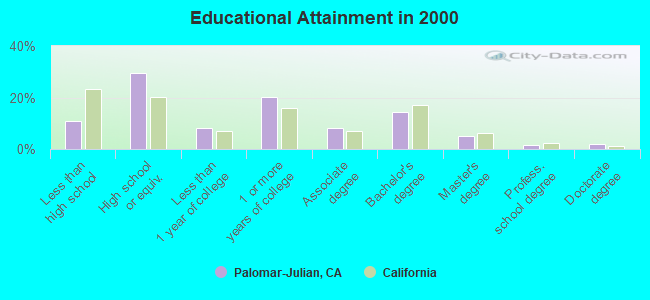
For population 25 years and over in Palomar-Julian:
- High school or higher: 89.1%
- Bachelor's degree or higher: 22.8%
- Graduate or professional degree: 8.5%
- Unemployed: 2.8%
- Mean travel time to work (commute): 34.6 minutes
| Here: | 10.4 |
| California average: | 16.1 |
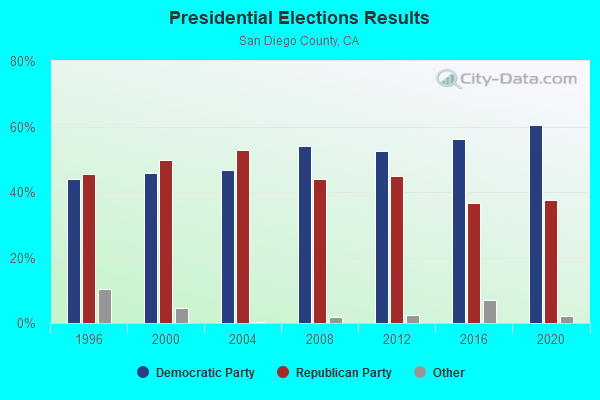
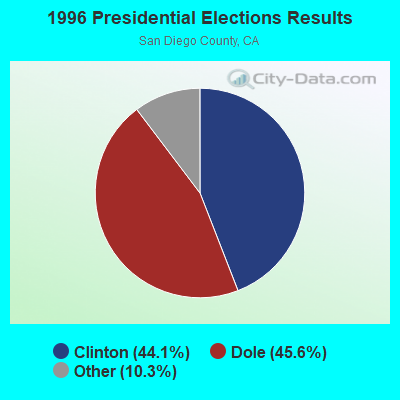
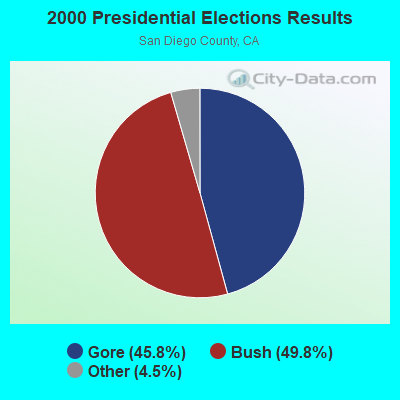
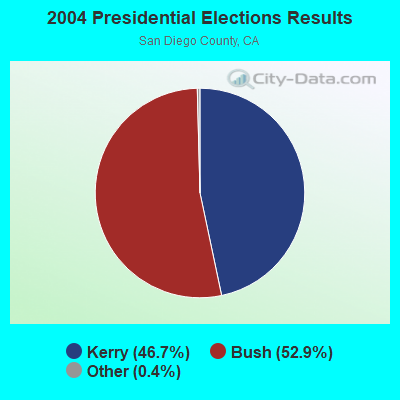
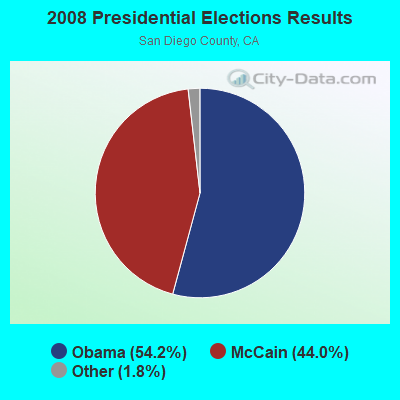
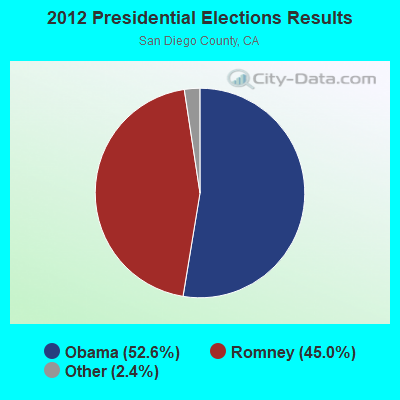
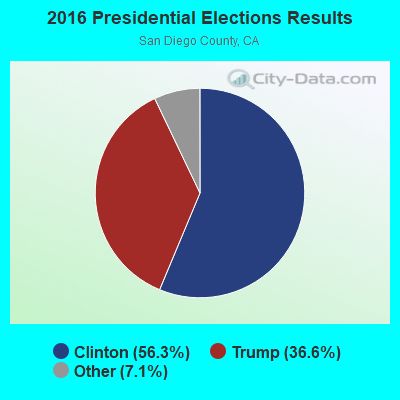
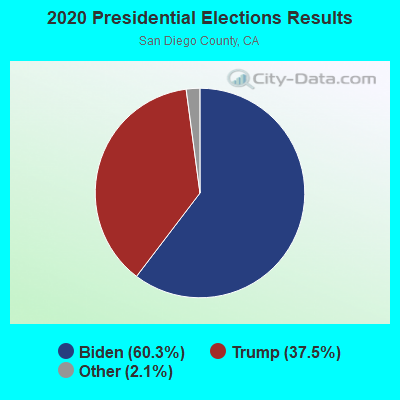
Graphs represent county-level data. Detailed 2008 Election Results
Religion statistics for Palomar-Julian, CA (based on San Diego County data)
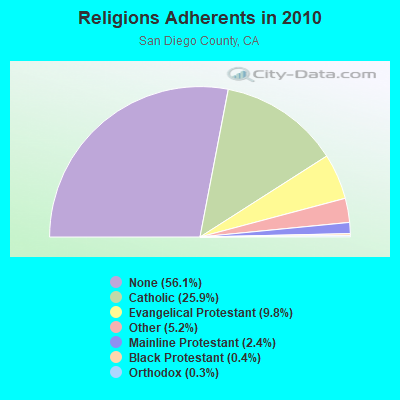
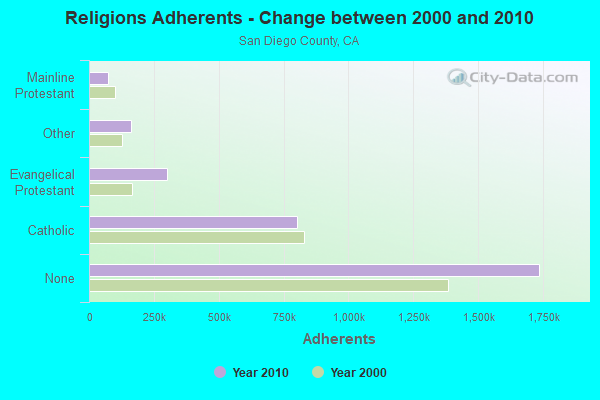
| Religion | Adherents | Congregations |
|---|---|---|
| Catholic | 801,850 | 115 |
| Evangelical Protestant | 302,320 | 974 |
| Other | 161,530 | 349 |
| Mainline Protestant | 74,992 | 211 |
| Black Protestant | 10,857 | 52 |
| Orthodox | 7,828 | 19 |
| None | 1,735,936 | - |
Food Environment Statistics:
| Here: | 1.94 / 10,000 pop. |
| California: | 2.14 / 10,000 pop. |
| San Diego County: | 0.06 / 10,000 pop. |
| California: | 0.04 / 10,000 pop. |
| This county: | 0.77 / 10,000 pop. |
| California: | 0.62 / 10,000 pop. |
| This county: | 1.65 / 10,000 pop. |
| California: | 1.49 / 10,000 pop. |
| Here: | 7.56 / 10,000 pop. |
| California: | 7.42 / 10,000 pop. |
| Here: | 6.5% |
| California: | 7.3% |
| This county: | 22.2% |
| California: | 21.3% |
| San Diego County: | 16.0% |
| California: | 17.9% |
5.18% of this county's 2021 resident taxpayers lived in other counties in 2020 ($90,734 average adjusted gross income)
| Here: | 5.18% |
| California average: | 5.19% |
0.14% of residents moved from foreign countries ($1,493 average AGI)
San Diego County: 0.14% California average: 0.03%
Top counties from which taxpayers relocated into this county between 2020 and 2021:
| from Los Angeles County, CA | |
| from Riverside County, CA | |
| from Orange County, CA |
5.71% of this county's 2020 resident taxpayers moved to other counties in 2021 ($83,556 average adjusted gross income)
| Here: | 5.71% |
| California average: | 6.14% |
0.09% of residents moved to foreign countries ($1,067 average AGI)
San Diego County: 0.09% California average: 0.02%
Top counties to which taxpayers relocated from this county between 2020 and 2021:
| to Riverside County, CA | |
| to Los Angeles County, CA | |
| to Orange County, CA |
Strongest AM radio stations in Palomar-Julian:
- KFMB (760 AM; 50 kW; SAN DIEGO, CA; Owner: MIDWEST TELEVISION, INC.)
- KCBQ (1170 AM; 50 kW; SAN DIEGO, CA; Owner: RADIO 1210, INC.)
- KPRZ (1210 AM; 20 kW; SAN MARCOS, CA; Owner: RADIO 1210, INC.)
- KSDO (1130 AM; 10 kW; SAN DIEGO, CA; Owner: HI-FAVOR BROADCASTING, LLC)
- KPLS (830 AM; 50 kW; ORANGE, CA; Owner: CRN LICENSES, LLC)
- KFI (640 AM; 50 kW; LOS ANGELES, CA; Owner: CAPSTAR TX LIMITED PARTNERSHIP)
- KECR (910 AM; 5 kW; EL CAJON, CA; Owner: FAMILY STATIONS, INC.)
- KLAC (570 AM; 50 kW; LOS ANGELES, CA; Owner: AMFM RADIO LICENSES, L.L.C.)
- KTNQ (1020 AM; 50 kW; LOS ANGELES, CA; Owner: KTNQ-AM LICENSE CORP.)
- KOGO (600 AM; 5 kW; SAN DIEGO, CA; Owner: CITICASTERS LICENSES, L.P.)
- KXTA (1150 AM; 50 kW; LOS ANGELES, CA; Owner: CITICASTERS LICENSES, L.P.)
- KSPN (710 AM; 50 kW; LOS ANGELES, CA; Owner: KABC-AM RADIO, INC.)
- KDIS (1110 AM; 50 kW; PASADENA, CA; Owner: ABC,INC.)
Strongest FM radio stations in Palomar-Julian:
- KLVJ (100.1 FM; JULIAN, CA; Owner: EDUCATIONAL MEDIA FOUNDATION)
- KRTM (88.9 FM; TEMECULA, CA; Owner: PENFOLD COMMUNICATIONS, INC.)
- KPBS-FM (89.5 FM; SAN DIEGO, CA; Owner: THE BD. OF TRUSTEES, CALIFORNIA STATE UNIVERSITY)
- KWVE (107.9 FM; SAN CLEMENTE, CA; Owner: CALVARY CHAPEL OF COSTA MESA)
- KHTS-FM (93.3 FM; EL CAJON, CA; Owner: CITICASTERS LICENSES, L.P.)
- KLRD (90.1 FM; YUCAIPA, CA; Owner: EDUCATIONAL MEDIA FOUNDATION)
- K210CL (89.9 FM; LEMON GROVE, CA; Owner: SANTA MONICA COMMUNITY COLLEGE DISTRICT)
- KATY-FM (101.3 FM; IDYLLWILD, CA; Owner: ALL PRO BROADCASTING, INC.)
- KLQV (102.9 FM; SAN DIEGO, CA; Owner: HBC LICENSE CORPORATION)
- KFSD-FM (92.1 FM; ESCONDIDO, CA; Owner: NORTH COUNTY BROADCASTING CORP.)
- K201AR (88.1 FM; BANNING, CA; Owner: KSGN, INC.)
- K232CX (94.3 FM; DESERT HOT SPRINGS, CA; Owner: MCC RADIO, LLC)
- KGB-FM (101.5 FM; SAN DIEGO, CA; Owner: CITICASTERS LICENSES, L.P.)
- KUOR-FM (89.1 FM; REDLANDS, CA; Owner: UNIVERSITY OF REDLANDS)
- KSON-FM (97.3 FM; SAN DIEGO, CA; Owner: JEFFERSON-PILOT COMMUNICATIONS COMPANY OF CALIFORNIA)
- KWRP (96.1 FM; SAN JACINTO, CA; Owner: MAGIC BROADCASTING, INC.)
- KPLM-FM2 (106.1 FM; SAN JACINTO, CA; Owner: RM BROADCASTING L.L.C.)
- KPRI (102.1 FM; ENCINITAS, CA; Owner: COMPASS RADIO OF SAN DIEGO, INC.)
- KLNV (106.5 FM; SAN DIEGO, CA; Owner: HBC LICENSE CORPORATION)
- KXRS (105.7 FM; HEMET, CA; Owner: LAZER BROADCASTING CORPORATION)
TV broadcast stations around Palomar-Julian:
- KSZZ-LP (Channel 19; SAN DIEGO, CA; Owner: ENTRAVISION HOLDINGS, LLC)
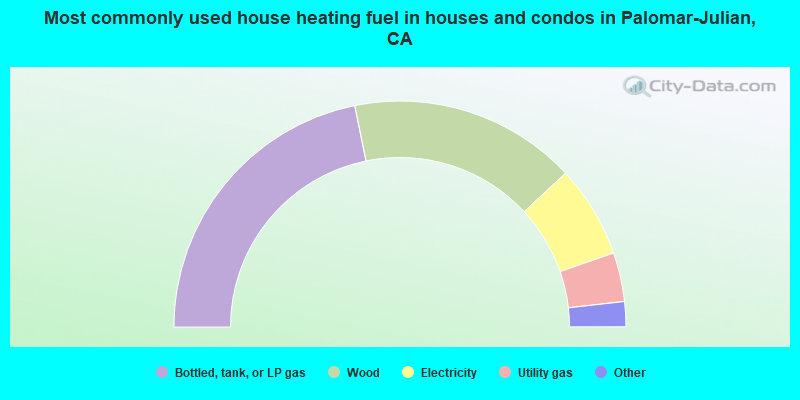
- 43.6%Bottled, tank, or LP gas
- 32.6%Wood
- 13.2%Electricity
- 7.0%Utility gas
- 1.7%Fuel oil, kerosene, etc.
- 1.3%Other fuel
- 0.6%Solar energy
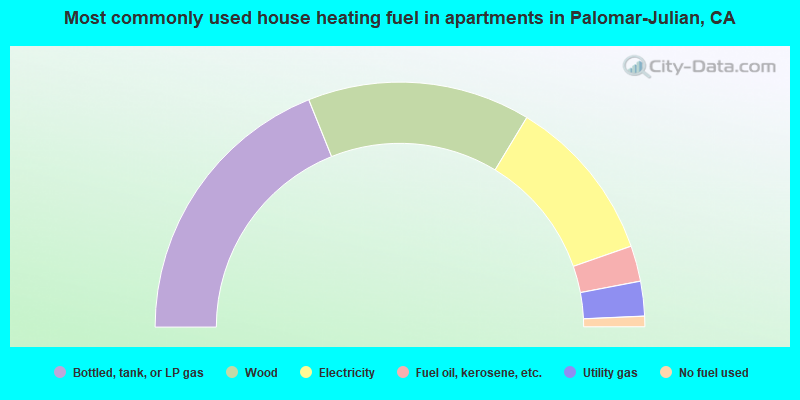
- 37.9%Bottled, tank, or LP gas
- 29.5%Wood
- 22.0%Electricity
- 4.7%Fuel oil, kerosene, etc.
- 4.6%Utility gas
- 1.4%No fuel used
Palomar-Julian compared to California state average:
- Unemployed percentage significantly below state average.
- Black race population percentage significantly below state average.
- Hispanic race population percentage significantly below state average.
- Median age significantly above state average.
- Foreign-born population percentage significantly below state average.
- Renting percentage below state average.
- Length of stay since moving in significantly above state average.
- Number of rooms per house significantly below state average.
- House age significantly below state average.
- Number of college students below state average.
Palomar-Julian on our top lists:
- #3 on the list of "Top 101 cities with largest percentage of females in occupations: other management occupations except farmers and farm managers (population 5,000+)"
- #3 on the list of "Top 101 cities with largest percentage of females in industries: used merchandise, gift, novelty, and souvenir, and other miscellaneous stores (population 5,000+)"
- #7 on the list of "Top 101 cities with largest percentage of females in industries: u. s. postal service (population 5,000+)"
- #9 on the list of "Top 101 cities with largest percentage of females in occupations: painters and paperhangers (population 5,000+)"
- #11 on the list of "Top 101 cities with largest percentage of males in occupations: preschool, kindergarten, elementary and middle school teachers (population 5,000+)"
- #16 on the list of "Top 101 cities with largest percentage of males in occupations: air transportation workers (population 5,000+)"
- #19 on the list of "Top 101 cities with largest percentage of males in industries: fuel dealers (population 5,000+)"
- #20 on the list of "Top 101 cities with largest percentage of females in occupations: retail sales workers except cashiers (population 5,000+)"
- #22 on the list of "Top 101 cities with largest percentage of males in industries: farm supplies merchant wholesalers (population 5,000+)"
- #29 on the list of "Top 101 cities with largest percentage of females in occupations: life, physical, and social science technicians (population 5,000+)"
- #30 on the list of "Top 101 cities with largest percentage of males in industries: clothing and accessories, including shoe, stores (population 5,000+)"
- #36 on the list of "Top 101 cities with largest percentage of females in industries: sewing, needlework, and piece goods stores (population 5,000+)"
- #56 on the list of "Top 101 cities with largest percentage of females in industries: nonmetallic mineral products (population 5,000+)"
- #57 on the list of "Top 101 cities with largest percentage of females in industries: leather and allied products (population 5,000+)"
- #61 on the list of "Top 101 cities with largest percentage of females in industries: farm supplies merchant wholesalers (population 5,000+)"
- #71 on the list of "Top 101 cities with largest percentage of workers with very long commute times (90 or more minutes) (population 5,000+)"
- #71 on the list of "Top 101 cities with largest percentage of females in industries: food (population 5,000+)"
- #86 on the list of "Top 101 cities with the highest percentage of workers working at home, population 5,000+"
- #91 on the list of "Top 100 cities with largest land areas (pop. 5,000+)"
- #99 on the list of "Top 101 cities with largest percentage of females in industries: construction (population 5,000+)"
- #4 on the list of "Top 101 counties with the most Catholic adherents"
- #4 on the list of "Top 101 counties with the highest lead air pollution readings in 2012 (µg/m3)"
- #7 on the list of "Top 101 counties with the most Evangelical Protestant congregations"
- #7 on the list of "Top 101 counties with the most Catholic congregations"
- #7 on the list of "Top 101 counties with the highest surface withdrawal of fresh water for public supply (pop. 50,000+)"