Pawleys Island, South Carolina Submit your own pictures of this town and show them to the world
OSM Map
General Map
Google Map
MSN Map
OSM Map
General Map
Google Map
MSN Map
OSM Map
General Map
Google Map
MSN Map
OSM Map
General Map
Google Map
MSN Map
Please wait while loading the map...
Population in 2022: 133 (0% urban, 100% rural). Population change since 2000: -3.6%Males: 57 Females: 76
March 2022 cost of living index in Pawleys Island: 89.4 (less than average, U.S. average is 100) Percentage of residents living in poverty in 2022: 7.7%Business Search - 14 Million verified businesses
Data:
Median household income ($)
Median household income (% change since 2000)
Household income diversity
Ratio of average income to average house value (%)
Ratio of average income to average rent
Median household income ($) - White
Median household income ($) - Black or African American
Median household income ($) - Asian
Median household income ($) - Hispanic or Latino
Median household income ($) - American Indian and Alaska Native
Median household income ($) - Multirace
Median household income ($) - Other Race
Median household income for houses/condos with a mortgage ($)
Median household income for apartments without a mortgage ($)
Races - White alone (%)
Races - White alone (% change since 2000)
Races - Black alone (%)
Races - Black alone (% change since 2000)
Races - American Indian alone (%)
Races - American Indian alone (% change since 2000)
Races - Asian alone (%)
Races - Asian alone (% change since 2000)
Races - Hispanic (%)
Races - Hispanic (% change since 2000)
Races - Native Hawaiian and Other Pacific Islander alone (%)
Races - Native Hawaiian and Other Pacific Islander alone (% change since 2000)
Races - Two or more races (%)
Races - Two or more races (% change since 2000)
Races - Other race alone (%)
Races - Other race alone (% change since 2000)
Racial diversity
Unemployment (%)
Unemployment (% change since 2000)
Unemployment (%) - White
Unemployment (%) - Black or African American
Unemployment (%) - Asian
Unemployment (%) - Hispanic or Latino
Unemployment (%) - American Indian and Alaska Native
Unemployment (%) - Multirace
Unemployment (%) - Other Race
Population density (people per square mile)
Population - Males (%)
Population - Females (%)
Population - Males (%) - White
Population - Males (%) - Black or African American
Population - Males (%) - Asian
Population - Males (%) - Hispanic or Latino
Population - Males (%) - American Indian and Alaska Native
Population - Males (%) - Multirace
Population - Males (%) - Other Race
Population - Females (%) - White
Population - Females (%) - Black or African American
Population - Females (%) - Asian
Population - Females (%) - Hispanic or Latino
Population - Females (%) - American Indian and Alaska Native
Population - Females (%) - Multirace
Population - Females (%) - Other Race
Coronavirus confirmed cases (Apr 25, 2024)
Deaths caused by coronavirus (Apr 25, 2024)
Coronavirus confirmed cases (per 100k population) (Apr 25, 2024)
Deaths caused by coronavirus (per 100k population) (Apr 25, 2024)
Daily increase in number of cases (Apr 25, 2024)
Weekly increase in number of cases (Apr 25, 2024)
Cases doubled (in days) (Apr 25, 2024)
Hospitalized patients (Apr 18, 2022)
Negative test results (Apr 18, 2022)
Total test results (Apr 18, 2022)
COVID Vaccine doses distributed (per 100k population) (Sep 19, 2023)
COVID Vaccine doses administered (per 100k population) (Sep 19, 2023)
COVID Vaccine doses distributed (Sep 19, 2023)
COVID Vaccine doses administered (Sep 19, 2023)
Likely homosexual households (%)
Likely homosexual households (% change since 2000)
Likely homosexual households - Lesbian couples (%)
Likely homosexual households - Lesbian couples (% change since 2000)
Likely homosexual households - Gay men (%)
Likely homosexual households - Gay men (% change since 2000)
Cost of living index
Median gross rent ($)
Median contract rent ($)
Median monthly housing costs ($)
Median house or condo value ($)
Median house or condo value ($ change since 2000)
Mean house or condo value by units in structure - 1, detached ($)
Mean house or condo value by units in structure - 1, attached ($)
Mean house or condo value by units in structure - 2 ($)
Mean house or condo value by units in structure by units in structure - 3 or 4 ($)
Mean house or condo value by units in structure - 5 or more ($)
Mean house or condo value by units in structure - Boat, RV, van, etc. ($)
Mean house or condo value by units in structure - Mobile home ($)
Median house or condo value ($) - White
Median house or condo value ($) - Black or African American
Median house or condo value ($) - Asian
Median house or condo value ($) - Hispanic or Latino
Median house or condo value ($) - American Indian and Alaska Native
Median house or condo value ($) - Multirace
Median house or condo value ($) - Other Race
Median resident age
Resident age diversity
Median resident age - Males
Median resident age - Females
Median resident age - White
Median resident age - Black or African American
Median resident age - Asian
Median resident age - Hispanic or Latino
Median resident age - American Indian and Alaska Native
Median resident age - Multirace
Median resident age - Other Race
Median resident age - Males - White
Median resident age - Males - Black or African American
Median resident age - Males - Asian
Median resident age - Males - Hispanic or Latino
Median resident age - Males - American Indian and Alaska Native
Median resident age - Males - Multirace
Median resident age - Males - Other Race
Median resident age - Females - White
Median resident age - Females - Black or African American
Median resident age - Females - Asian
Median resident age - Females - Hispanic or Latino
Median resident age - Females - American Indian and Alaska Native
Median resident age - Females - Multirace
Median resident age - Females - Other Race
Commute - mean travel time to work (minutes)
Travel time to work - Less than 5 minutes (%)
Travel time to work - Less than 5 minutes (% change since 2000)
Travel time to work - 5 to 9 minutes (%)
Travel time to work - 5 to 9 minutes (% change since 2000)
Travel time to work - 10 to 19 minutes (%)
Travel time to work - 10 to 19 minutes (% change since 2000)
Travel time to work - 20 to 29 minutes (%)
Travel time to work - 20 to 29 minutes (% change since 2000)
Travel time to work - 30 to 39 minutes (%)
Travel time to work - 30 to 39 minutes (% change since 2000)
Travel time to work - 40 to 59 minutes (%)
Travel time to work - 40 to 59 minutes (% change since 2000)
Travel time to work - 60 to 89 minutes (%)
Travel time to work - 60 to 89 minutes (% change since 2000)
Travel time to work - 90 or more minutes (%)
Travel time to work - 90 or more minutes (% change since 2000)
Marital status - Never married (%)
Marital status - Now married (%)
Marital status - Separated (%)
Marital status - Widowed (%)
Marital status - Divorced (%)
Median family income ($)
Median family income (% change since 2000)
Median non-family income ($)
Median non-family income (% change since 2000)
Median per capita income ($)
Median per capita income (% change since 2000)
Median family income ($) - White
Median family income ($) - Black or African American
Median family income ($) - Asian
Median family income ($) - Hispanic or Latino
Median family income ($) - American Indian and Alaska Native
Median family income ($) - Multirace
Median family income ($) - Other Race
Median year house/condo built
Median year apartment built
Year house built - Built 2005 or later (%)
Year house built - Built 2000 to 2004 (%)
Year house built - Built 1990 to 1999 (%)
Year house built - Built 1980 to 1989 (%)
Year house built - Built 1970 to 1979 (%)
Year house built - Built 1960 to 1969 (%)
Year house built - Built 1950 to 1959 (%)
Year house built - Built 1940 to 1949 (%)
Year house built - Built 1939 or earlier (%)
Average household size
Household density (households per square mile)
Average household size - White
Average household size - Black or African American
Average household size - Asian
Average household size - Hispanic or Latino
Average household size - American Indian and Alaska Native
Average household size - Multirace
Average household size - Other Race
Occupied housing units (%)
Vacant housing units (%)
Owner occupied housing units (%)
Renter occupied housing units (%)
Vacancy status - For rent (%)
Vacancy status - For sale only (%)
Vacancy status - Rented or sold, not occupied (%)
Vacancy status - For seasonal, recreational, or occasional use (%)
Vacancy status - For migrant workers (%)
Vacancy status - Other vacant (%)
Residents with income below the poverty level (%)
Residents with income below 50% of the poverty level (%)
Children below poverty level (%)
Poor families by family type - Married-couple family (%)
Poor families by family type - Male, no wife present (%)
Poor families by family type - Female, no husband present (%)
Poverty status for native-born residents (%)
Poverty status for foreign-born residents (%)
Poverty among high school graduates not in families (%)
Poverty among people who did not graduate high school not in families (%)
Residents with income below the poverty level (%) - White
Residents with income below the poverty level (%) - Black or African American
Residents with income below the poverty level (%) - Asian
Residents with income below the poverty level (%) - Hispanic or Latino
Residents with income below the poverty level (%) - American Indian and Alaska Native
Residents with income below the poverty level (%) - Multirace
Residents with income below the poverty level (%) - Other Race
Air pollution - Air Quality Index (AQI)
Air pollution - CO
Air pollution - NO2
Air pollution - SO2
Air pollution - Ozone
Air pollution - PM10
Air pollution - PM25
Air pollution - Pb
Crime - Murders per 100,000 population
Crime - Rapes per 100,000 population
Crime - Robberies per 100,000 population
Crime - Assaults per 100,000 population
Crime - Burglaries per 100,000 population
Crime - Thefts per 100,000 population
Crime - Auto thefts per 100,000 population
Crime - Arson per 100,000 population
Crime - City-data.com crime index
Crime - Violent crime index
Crime - Property crime index
Crime - Murders per 100,000 population (5 year average)
Crime - Rapes per 100,000 population (5 year average)
Crime - Robberies per 100,000 population (5 year average)
Crime - Assaults per 100,000 population (5 year average)
Crime - Burglaries per 100,000 population (5 year average)
Crime - Thefts per 100,000 population (5 year average)
Crime - Auto thefts per 100,000 population (5 year average)
Crime - Arson per 100,000 population (5 year average)
Crime - City-data.com crime index (5 year average)
Crime - Violent crime index (5 year average)
Crime - Property crime index (5 year average)
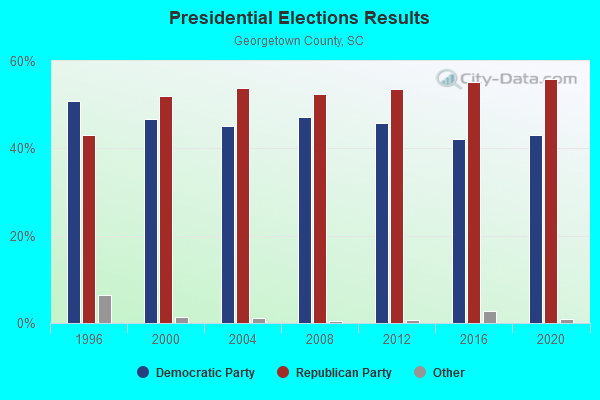
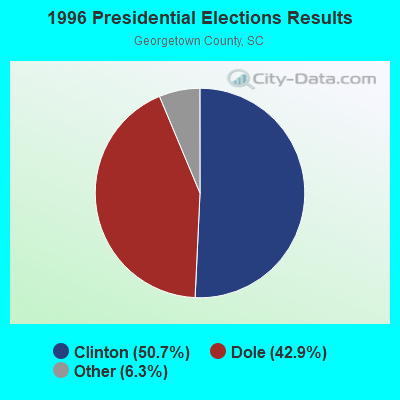
1996 Presidential Elections Results (%) - Democratic Party (Clinton)
1996 Presidential Elections Results (%) - Republican Party (Dole)
1996 Presidential Elections Results (%) - Other
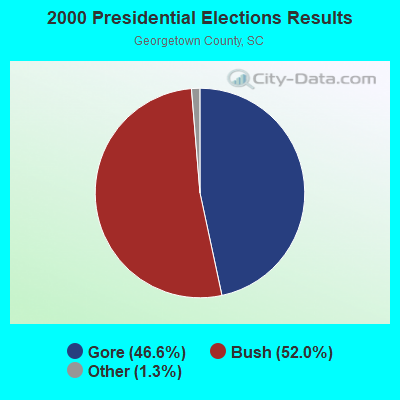
2000 Presidential Elections Results (%) - Democratic Party (Gore)
2000 Presidential Elections Results (%) - Republican Party (Bush)
2000 Presidential Elections Results (%) - Other
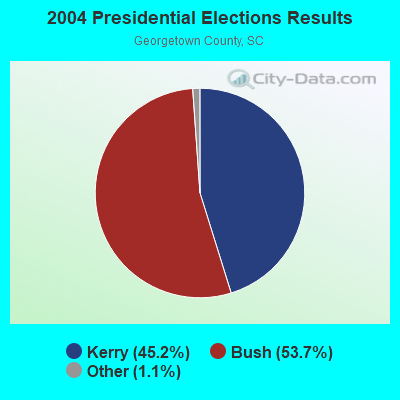
2004 Presidential Elections Results (%) - Democratic Party (Kerry)
2004 Presidential Elections Results (%) - Republican Party (Bush)
2004 Presidential Elections Results (%) - Other
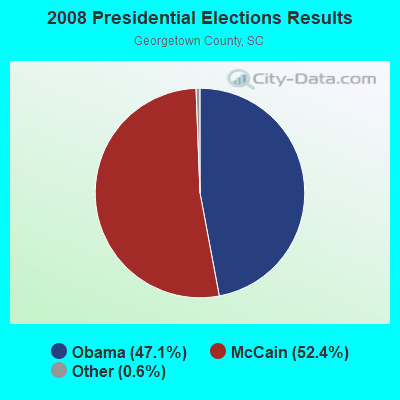
2008 Presidential Elections Results (%) - Democratic Party (Obama)
2008 Presidential Elections Results (%) - Republican Party (McCain)
2008 Presidential Elections Results (%) - Other
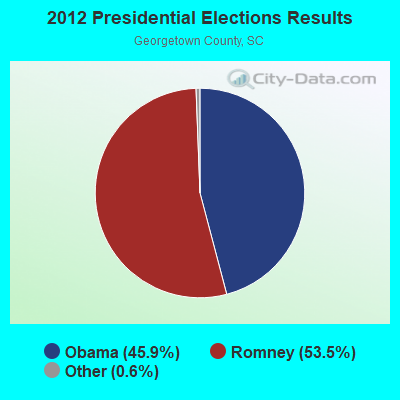
2012 Presidential Elections Results (%) - Democratic Party (Obama)
2012 Presidential Elections Results (%) - Republican Party (Romney)
2012 Presidential Elections Results (%) - Other
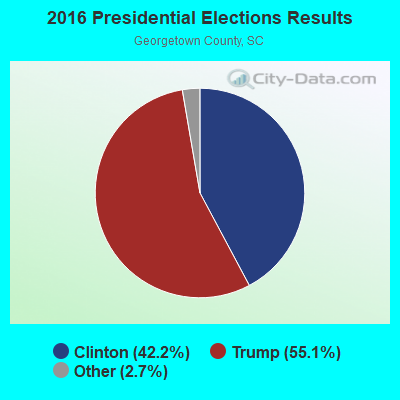
2016 Presidential Elections Results (%) - Democratic Party (Clinton)
2016 Presidential Elections Results (%) - Republican Party (Trump)
2016 Presidential Elections Results (%) - Other
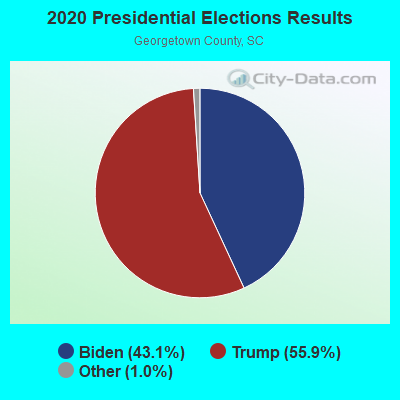
2020 Presidential Elections Results (%) - Democratic Party (Biden)
2020 Presidential Elections Results (%) - Republican Party (Trump)
2020 Presidential Elections Results (%) - Other
Ancestries Reported - Arab (%)
Ancestries Reported - Czech (%)
Ancestries Reported - Danish (%)
Ancestries Reported - Dutch (%)
Ancestries Reported - English (%)
Ancestries Reported - French (%)
Ancestries Reported - French Canadian (%)
Ancestries Reported - German (%)
Ancestries Reported - Greek (%)
Ancestries Reported - Hungarian (%)
Ancestries Reported - Irish (%)
Ancestries Reported - Italian (%)
Ancestries Reported - Lithuanian (%)
Ancestries Reported - Norwegian (%)
Ancestries Reported - Polish (%)
Ancestries Reported - Portuguese (%)
Ancestries Reported - Russian (%)
Ancestries Reported - Scotch-Irish (%)
Ancestries Reported - Scottish (%)
Ancestries Reported - Slovak (%)
Ancestries Reported - Subsaharan African (%)
Ancestries Reported - Swedish (%)
Ancestries Reported - Swiss (%)
Ancestries Reported - Ukrainian (%)
Ancestries Reported - United States (%)
Ancestries Reported - Welsh (%)
Ancestries Reported - West Indian (%)
Ancestries Reported - Other (%)
Educational Attainment - No schooling completed (%)
Educational Attainment - Less than high school (%)
Educational Attainment - High school or equivalent (%)
Educational Attainment - Less than 1 year of college (%)
Educational Attainment - 1 or more years of college (%)
Educational Attainment - Associate degree (%)
Educational Attainment - Bachelor's degree (%)
Educational Attainment - Master's degree (%)
Educational Attainment - Professional school degree (%)
Educational Attainment - Doctorate degree (%)
School Enrollment - Nursery, preschool (%)
School Enrollment - Kindergarten (%)
School Enrollment - Grade 1 to 4 (%)
School Enrollment - Grade 5 to 8 (%)
School Enrollment - Grade 9 to 12 (%)
School Enrollment - College undergrad (%)
School Enrollment - Graduate or professional (%)
School Enrollment - Not enrolled in school (%)
School enrollment - Public schools (%)
School enrollment - Private schools (%)
School enrollment - Not enrolled (%)
Median number of rooms in houses and condos
Median number of rooms in apartments
Housing units lacking complete plumbing facilities (%)
Housing units lacking complete kitchen facilities (%)
Density of houses
Urban houses (%)
Rural houses (%)
Households with people 60 years and over (%)
Households with people 65 years and over (%)
Households with people 75 years and over (%)
Households with one or more nonrelatives (%)
Households with no nonrelatives (%)
Population in households (%)
Family households (%)
Nonfamily households (%)
Population in families (%)
Family households with own children (%)
Median number of bedrooms in owner occupied houses
Mean number of bedrooms in owner occupied houses
Median number of bedrooms in renter occupied houses
Mean number of bedrooms in renter occupied houses
Median number of vehichles in owner occupied houses
Mean number of vehichles in owner occupied houses
Median number of vehichles in renter occupied houses
Mean number of vehichles in renter occupied houses
Mortgage status - with mortgage (%)
Mortgage status - with second mortgage (%)
Mortgage status - with home equity loan (%)
Mortgage status - with both second mortgage and home equity loan (%)
Mortgage status - without a mortgage (%)
Average family size
Average family size - White
Average family size - Black or African American
Average family size - Asian
Average family size - Hispanic or Latino
Average family size - American Indian and Alaska Native
Average family size - Multirace
Average family size - Other Race
Geographical mobility - Same house 1 year ago (%)
Geographical mobility - Moved within same county (%)
Geographical mobility - Moved from different county within same state (%)
Geographical mobility - Moved from different state (%)
Geographical mobility - Moved from abroad (%)
Place of birth - Born in state of residence (%)
Place of birth - Born in other state (%)
Place of birth - Native, outside of US (%)
Place of birth - Foreign born (%)
Housing units in structures - 1, detached (%)
Housing units in structures - 1, attached (%)
Housing units in structures - 2 (%)
Housing units in structures - 3 or 4 (%)
Housing units in structures - 5 to 9 (%)
Housing units in structures - 10 to 19 (%)
Housing units in structures - 20 to 49 (%)
Housing units in structures - 50 or more (%)
Housing units in structures - Mobile home (%)
Housing units in structures - Boat, RV, van, etc. (%)
House/condo owner moved in on average (years ago)
Renter moved in on average (years ago)
Year householder moved into unit - Moved in 1999 to March 2000 (%)
Year householder moved into unit - Moved in 1995 to 1998 (%)
Year householder moved into unit - Moved in 1990 to 1994 (%)
Year householder moved into unit - Moved in 1980 to 1989 (%)
Year householder moved into unit - Moved in 1970 to 1979 (%)
Year householder moved into unit - Moved in 1969 or earlier (%)
Means of transportation to work - Drove car alone (%)
Means of transportation to work - Carpooled (%)
Means of transportation to work - Public transportation (%)
Means of transportation to work - Bus or trolley bus (%)
Means of transportation to work - Streetcar or trolley car (%)
Means of transportation to work - Subway or elevated (%)
Means of transportation to work - Railroad (%)
Means of transportation to work - Ferryboat (%)
Means of transportation to work - Taxicab (%)
Means of transportation to work - Motorcycle (%)
Means of transportation to work - Bicycle (%)
Means of transportation to work - Walked (%)
Means of transportation to work - Other means (%)
Working at home (%)
Industry diversity
Most Common Industries - Agriculture, forestry, fishing and hunting, and mining (%)
Most Common Industries - Agriculture, forestry, fishing and hunting (%)
Most Common Industries - Mining, quarrying, and oil and gas extraction (%)
Most Common Industries - Construction (%)
Most Common Industries - Manufacturing (%)
Most Common Industries - Wholesale trade (%)
Most Common Industries - Retail trade (%)
Most Common Industries - Transportation and warehousing, and utilities (%)
Most Common Industries - Transportation and warehousing (%)
Most Common Industries - Utilities (%)
Most Common Industries - Information (%)
Most Common Industries - Finance and insurance, and real estate and rental and leasing (%)
Most Common Industries - Finance and insurance (%)
Most Common Industries - Real estate and rental and leasing (%)
Most Common Industries - Professional, scientific, and management, and administrative and waste management services (%)
Most Common Industries - Professional, scientific, and technical services (%)
Most Common Industries - Management of companies and enterprises (%)
Most Common Industries - Administrative and support and waste management services (%)
Most Common Industries - Educational services, and health care and social assistance (%)
Most Common Industries - Educational services (%)
Most Common Industries - Health care and social assistance (%)
Most Common Industries - Arts, entertainment, and recreation, and accommodation and food services (%)
Most Common Industries - Arts, entertainment, and recreation (%)
Most Common Industries - Accommodation and food services (%)
Most Common Industries - Other services, except public administration (%)
Most Common Industries - Public administration (%)
Occupation diversity
Most Common Occupations - Management, business, science, and arts occupations (%)
Most Common Occupations - Management, business, and financial occupations (%)
Most Common Occupations - Management occupations (%)
Most Common Occupations - Business and financial operations occupations (%)
Most Common Occupations - Computer, engineering, and science occupations (%)
Most Common Occupations - Computer and mathematical occupations (%)
Most Common Occupations - Architecture and engineering occupations (%)
Most Common Occupations - Life, physical, and social science occupations (%)
Most Common Occupations - Education, legal, community service, arts, and media occupations (%)
Most Common Occupations - Community and social service occupations (%)
Most Common Occupations - Legal occupations (%)
Most Common Occupations - Education, training, and library occupations (%)
Most Common Occupations - Arts, design, entertainment, sports, and media occupations (%)
Most Common Occupations - Healthcare practitioners and technical occupations (%)
Most Common Occupations - Health diagnosing and treating practitioners and other technical occupations (%)
Most Common Occupations - Health technologists and technicians (%)
Most Common Occupations - Service occupations (%)
Most Common Occupations - Healthcare support occupations (%)
Most Common Occupations - Protective service occupations (%)
Most Common Occupations - Fire fighting and prevention, and other protective service workers including supervisors (%)
Most Common Occupations - Law enforcement workers including supervisors (%)
Most Common Occupations - Food preparation and serving related occupations (%)
Most Common Occupations - Building and grounds cleaning and maintenance occupations (%)
Most Common Occupations - Personal care and service occupations (%)
Most Common Occupations - Sales and office occupations (%)
Most Common Occupations - Sales and related occupations (%)
Most Common Occupations - Office and administrative support occupations (%)
Most Common Occupations - Natural resources, construction, and maintenance occupations (%)
Most Common Occupations - Farming, fishing, and forestry occupations (%)
Most Common Occupations - Construction and extraction occupations (%)
Most Common Occupations - Installation, maintenance, and repair occupations (%)
Most Common Occupations - Production, transportation, and material moving occupations (%)
Most Common Occupations - Production occupations (%)
Most Common Occupations - Transportation occupations (%)
Most Common Occupations - Material moving occupations (%)
People in Group quarters - Institutionalized population (%)
People in Group quarters - Correctional institutions (%)
People in Group quarters - Federal prisons and detention centers (%)
People in Group quarters - Halfway houses (%)
People in Group quarters - Local jails and other confinement facilities (including police lockups) (%)
People in Group quarters - Military disciplinary barracks (%)
People in Group quarters - State prisons (%)
People in Group quarters - Other types of correctional institutions (%)
People in Group quarters - Nursing homes (%)
People in Group quarters - Hospitals/wards, hospices, and schools for the handicapped (%)
People in Group quarters - Hospitals/wards and hospices for chronically ill (%)
People in Group quarters - Hospices or homes for chronically ill (%)
People in Group quarters - Military hospitals or wards for chronically ill (%)
People in Group quarters - Other hospitals or wards for chronically ill (%)
People in Group quarters - Hospitals or wards for drug/alcohol abuse (%)
People in Group quarters - Mental (Psychiatric) hospitals or wards (%)
People in Group quarters - Schools, hospitals, or wards for the mentally retarded (%)
People in Group quarters - Schools, hospitals, or wards for the physically handicapped (%)
People in Group quarters - Institutions for the deaf (%)
People in Group quarters - Institutions for the blind (%)
People in Group quarters - Orthopedic wards and institutions for the physically handicapped (%)
People in Group quarters - Wards in general hospitals for patients who have no usual home elsewhere (%)
People in Group quarters - Wards in military hospitals for patients who have no usual home elsewhere (%)
People in Group quarters - Juvenile institutions (%)
People in Group quarters - Long-term care (%)
People in Group quarters - Homes for abused, dependent, and neglected children (%)
People in Group quarters - Residential treatment centers for emotionally disturbed children (%)
People in Group quarters - Training schools for juvenile delinquents (%)
People in Group quarters - Short-term care, detention or diagnostic centers for delinquent children (%)
People in Group quarters - Type of juvenile institution unknown (%)
People in Group quarters - Noninstitutionalized population (%)
People in Group quarters - College dormitories (includes college quarters off campus) (%)
People in Group quarters - Military quarters (%)
People in Group quarters - On base (%)
People in Group quarters - Barracks, unaccompanied personnel housing (UPH), (Enlisted/Officer), ;and similar group living quarters for military personnel (%)
People in Group quarters - Transient quarters for temporary residents (%)
People in Group quarters - Military ships (%)
People in Group quarters - Group homes (%)
People in Group quarters - Homes or halfway houses for drug/alcohol abuse (%)
People in Group quarters - Homes for the mentally ill (%)
People in Group quarters - Homes for the mentally retarded (%)
People in Group quarters - Homes for the physically handicapped (%)
People in Group quarters - Other group homes (%)
People in Group quarters - Religious group quarters (%)
People in Group quarters - Dormitories (%)
People in Group quarters - Agriculture workers' dormitories on farms (%)
People in Group quarters - Job Corps and vocational training facilities (%)
People in Group quarters - Other workers' dormitories (%)
People in Group quarters - Crews of maritime vessels (%)
People in Group quarters - Other nonhousehold living situations (%)
People in Group quarters - Other noninstitutional group quarters (%)
Residents speaking English at home (%)
Residents speaking English at home - Born in the United States (%)
Residents speaking English at home - Native, born elsewhere (%)
Residents speaking English at home - Foreign born (%)
Residents speaking Spanish at home (%)
Residents speaking Spanish at home - Born in the United States (%)
Residents speaking Spanish at home - Native, born elsewhere (%)
Residents speaking Spanish at home - Foreign born (%)
Residents speaking other language at home (%)
Residents speaking other language at home - Born in the United States (%)
Residents speaking other language at home - Native, born elsewhere (%)
Residents speaking other language at home - Foreign born (%)
Class of Workers - Employee of private company (%)
Class of Workers - Self-employed in own incorporated business (%)
Class of Workers - Private not-for-profit wage and salary workers (%)
Class of Workers - Local government workers (%)
Class of Workers - State government workers (%)
Class of Workers - Federal government workers (%)
Class of Workers - Self-employed workers in own not incorporated business and Unpaid family workers (%)
House heating fuel used in houses and condos - Utility gas (%)
House heating fuel used in houses and condos - Bottled, tank, or LP gas (%)
House heating fuel used in houses and condos - Electricity (%)
House heating fuel used in houses and condos - Fuel oil, kerosene, etc. (%)
House heating fuel used in houses and condos - Coal or coke (%)
House heating fuel used in houses and condos - Wood (%)
House heating fuel used in houses and condos - Solar energy (%)
House heating fuel used in houses and condos - Other fuel (%)
House heating fuel used in houses and condos - No fuel used (%)
House heating fuel used in apartments - Utility gas (%)
House heating fuel used in apartments - Bottled, tank, or LP gas (%)
House heating fuel used in apartments - Electricity (%)
House heating fuel used in apartments - Fuel oil, kerosene, etc. (%)
House heating fuel used in apartments - Coal or coke (%)
House heating fuel used in apartments - Wood (%)
House heating fuel used in apartments - Solar energy (%)
House heating fuel used in apartments - Other fuel (%)
House heating fuel used in apartments - No fuel used (%)
Armed forces status - In Armed Forces (%)
Armed forces status - Civilian (%)
Armed forces status - Civilian - Veteran (%)
Armed forces status - Civilian - Nonveteran (%)
Fatal accidents locations in years 2005-2021
Fatal accidents locations in 2005
Fatal accidents locations in 2006
Fatal accidents locations in 2007
Fatal accidents locations in 2008
Fatal accidents locations in 2009
Fatal accidents locations in 2010
Fatal accidents locations in 2011
Fatal accidents locations in 2012
Fatal accidents locations in 2013
Fatal accidents locations in 2014
Fatal accidents locations in 2015
Fatal accidents locations in 2016
Fatal accidents locations in 2017
Fatal accidents locations in 2018
Fatal accidents locations in 2019
Fatal accidents locations in 2020
Fatal accidents locations in 2021
Alcohol use - People drinking some alcohol every month (%)
Alcohol use - People not drinking at all (%)
Alcohol use - Average days/month drinking alcohol
Alcohol use - Average drinks/week
Alcohol use - Average days/year people drink much
Audiometry - Average condition of hearing (%)
Audiometry - People that can hear a whisper from across a quiet room (%)
Audiometry - People that can hear normal voice from across a quiet room (%)
Audiometry - Ears ringing, roaring, buzzing (%)
Audiometry - Had a job exposure to loud noise (%)
Audiometry - Had off-work exposure to loud noise (%)
Blood Pressure & Cholesterol - Has high blood pressure (%)
Blood Pressure & Cholesterol - Checking blood pressure at home (%)
Blood Pressure & Cholesterol - Frequently checking blood cholesterol (%)
Blood Pressure & Cholesterol - Has high cholesterol level (%)
Consumer Behavior - Money monthly spent on food at supermarket/grocery store
Consumer Behavior - Money monthly spent on food at other stores
Consumer Behavior - Money monthly spent on eating out
Consumer Behavior - Money monthly spent on carryout/delivered foods
Consumer Behavior - Income spent on food at supermarket/grocery store (%)
Consumer Behavior - Income spent on food at other stores (%)
Consumer Behavior - Income spent on eating out (%)
Consumer Behavior - Income spent on carryout/delivered foods (%)
Current Health Status - General health condition (%)
Current Health Status - Blood donors (%)
Current Health Status - Has blood ever tested for HIV virus (%)
Current Health Status - Left-handed people (%)
Dermatology - People using sunscreen (%)
Diabetes - Diabetics (%)
Diabetes - Had a blood test for high blood sugar (%)
Diabetes - People taking insulin (%)
Diet Behavior & Nutrition - Diet health (%)
Diet Behavior & Nutrition - Milk product consumption (# of products/month)
Diet Behavior & Nutrition - Meals not home prepared (#/week)
Diet Behavior & Nutrition - Meals from fast food or pizza place (#/week)
Diet Behavior & Nutrition - Ready-to-eat foods (#/month)
Diet Behavior & Nutrition - Frozen meals/pizza (#/month)
Drug Use - People that ever used marijuana or hashish (%)
Drug Use - Ever used hard drugs (%)
Drug Use - Ever used any form of cocaine (%)
Drug Use - Ever used heroin (%)
Drug Use - Ever used methamphetamine (%)
Health Insurance - People covered by health insurance (%)
Kidney Conditions-Urology - Avg. # of times urinating at night
Medical Conditions - People with asthma (%)
Medical Conditions - People with anemia (%)
Medical Conditions - People with psoriasis (%)
Medical Conditions - People with overweight (%)
Medical Conditions - Elderly people having difficulties in thinking or remembering (%)
Medical Conditions - People who ever received blood transfusion (%)
Medical Conditions - People having trouble seeing even with glass/contacts (%)
Medical Conditions - People with arthritis (%)
Medical Conditions - People with gout (%)
Medical Conditions - People with congestive heart failure (%)
Medical Conditions - People with coronary heart disease (%)
Medical Conditions - People with angina pectoris (%)
Medical Conditions - People who ever had heart attack (%)
Medical Conditions - People who ever had stroke (%)
Medical Conditions - People with emphysema (%)
Medical Conditions - People with thyroid problem (%)
Medical Conditions - People with chronic bronchitis (%)
Medical Conditions - People with any liver condition (%)
Medical Conditions - People who ever had cancer or malignancy (%)
Mental Health - People who have little interest in doing things (%)
Mental Health - People feeling down, depressed, or hopeless (%)
Mental Health - People who have trouble sleeping or sleeping too much (%)
Mental Health - People feeling tired or having little energy (%)
Mental Health - People with poor appetite or overeating (%)
Mental Health - People feeling bad about themself (%)
Mental Health - People who have trouble concentrating on things (%)
Mental Health - People moving or speaking slowly or too fast (%)
Mental Health - People having thoughts they would be better off dead (%)
Oral Health - Average years since last visit a dentist
Oral Health - People embarrassed because of mouth (%)
Oral Health - People with gum disease (%)
Oral Health - General health of teeth and gums (%)
Oral Health - Average days a week using dental floss/device
Oral Health - Average days a week using mouthwash for dental problem
Oral Health - Average number of teeth
Pesticide Use - Households using pesticides to control insects (%)
Pesticide Use - Households using pesticides to kill weeds (%)
Physical Activity - People doing vigorous-intensity work activities (%)
Physical Activity - People doing moderate-intensity work activities (%)
Physical Activity - People walking or bicycling (%)
Physical Activity - People doing vigorous-intensity recreational activities (%)
Physical Activity - People doing moderate-intensity recreational activities (%)
Physical Activity - Average hours a day doing sedentary activities
Physical Activity - Average hours a day watching TV or videos
Physical Activity - Average hours a day using computer
Physical Functioning - People having limitations keeping them from working (%)
Physical Functioning - People limited in amount of work they can do (%)
Physical Functioning - People that need special equipment to walk (%)
Physical Functioning - People experiencing confusion/memory problems (%)
Physical Functioning - People requiring special healthcare equipment (%)
Prescription Medications - Average number of prescription medicines taking
Preventive Aspirin Use - Adults 40+ taking low-dose aspirin (%)
Reproductive Health - Vaginal deliveries (%)
Reproductive Health - Cesarean deliveries (%)
Reproductive Health - Deliveries resulted in a live birth (%)
Reproductive Health - Pregnancies resulted in a delivery (%)
Reproductive Health - Women breastfeeding newborns (%)
Reproductive Health - Women that had a hysterectomy (%)
Reproductive Health - Women that had both ovaries removed (%)
Reproductive Health - Women that have ever taken birth control pills (%)
Reproductive Health - Women taking birth control pills (%)
Reproductive Health - Women that have ever used Depo-Provera or injectables (%)
Reproductive Health - Women that have ever used female hormones (%)
Sexual Behavior - People 18+ that ever had sex (vaginal, anal, or oral) (%)
Sexual Behavior - Males 18+ that ever had vaginal sex with a woman (%)
Sexual Behavior - Males 18+ that ever performed oral sex on a woman (%)
Sexual Behavior - Males 18+ that ever had anal sex with a woman (%)
Sexual Behavior - Males 18+ that ever had any sex with a man (%)
Sexual Behavior - Females 18+ that ever had vaginal sex with a man (%)
Sexual Behavior - Females 18+ that ever performed oral sex on a man (%)
Sexual Behavior - Females 18+ that ever had anal sex with a man (%)
Sexual Behavior - Females 18+ that ever had any kind of sex with a woman (%)
Sexual Behavior - Average age people first had sex
Sexual Behavior - Average number of female sex partners in lifetime (males 18+)
Sexual Behavior - Average number of female vaginal sex partners in lifetime (males 18+)
Sexual Behavior - Average age people first performed oral sex on a woman (18+)
Sexual Behavior - Average number of woman performed oral sex on in lifetime (18+)
Sexual Behavior - Average number of male sex partners in lifetime (males 18+)
Sexual Behavior - Average number of male anal sex partners in lifetime (males 18+)
Sexual Behavior - Average age people first performed oral sex on a man (18+)
Sexual Behavior - Average number of male oral sex partners in lifetime (18+)
Sexual Behavior - People using protection when performing oral sex (%)
Sexual Behavior - Average number of times people have vaginal or anal sex a year
Sexual Behavior - People having sex without condom (%)
Sexual Behavior - Average number of male sex partners in lifetime (females 18+)
Sexual Behavior - Average number of male vaginal sex partners in lifetime (females 18+)
Sexual Behavior - Average number of female sex partners in lifetime (females 18+)
Sexual Behavior - Circumcised males 18+ (%)
Sleep Disorders - Average hours sleeping at night
Sleep Disorders - People that has trouble sleeping (%)
Smoking-Cigarette Use - People smoking cigarettes (%)
Taste & Smell - People 40+ having problems with smell (%)
Taste & Smell - People 40+ having problems with taste (%)
Taste & Smell - People 40+ that ever had wisdom teeth removed (%)
Taste & Smell - People 40+ that ever had tonsils teeth removed (%)
Taste & Smell - People 40+ that ever had a loss of consciousness because of a head injury (%)
Taste & Smell - People 40+ that ever had a broken nose or other serious injury to face or skull (%)
Taste & Smell - People 40+ that ever had two or more sinus infections (%)
Weight - Average height (inches)
Weight - Average weight (pounds)
Weight - Average BMI
Weight - People that are obese (%)
Weight - People that ever were obese (%)
Weight - People trying to lose weight (%)
The City-Data.com crime index weighs serious crimes and violent crimes more heavily. Higher means more crime, U.S. average is 246.1. It adjusts for the number of visitors and daily workers commuting into cities.
Officers per 1,000 residents here:
36.36South Carolina average:
2.21
Latest news from Pawleys Island, SC collected exclusively by city-data.com from local newspapers, TV, and radio stations
Pawleys Island, SC City Guides: Ancestries: English (44.7%), Irish (10.5%), Scotch-Irish (10.5%), Scottish (9.2%), American (7.9%), British (6.6%).
Current Local Time:
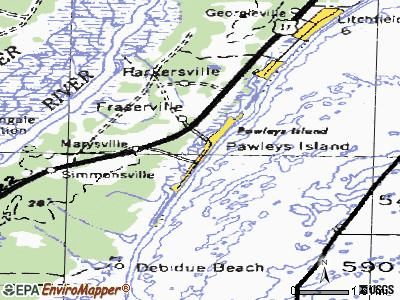
Land area: 0.70 square miles.
Population density: 190 people per square mile (very low).
4 residents are foreign born (2.9% Europe ).
This town:
2.9%South Carolina:
2.9%
Median real estate property taxes paid for housing units with mortgages in 2022: $4,845 (0.3%)Median real estate property taxes paid for housing units with no mortgage in 2022: $6,761 (0.4%)
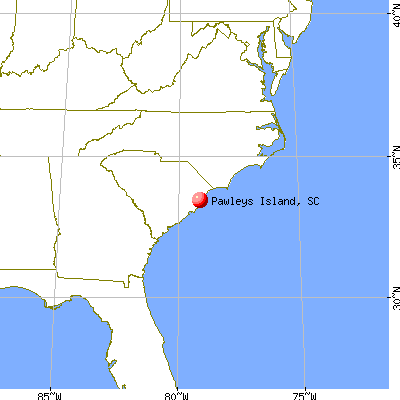
Nearest city with pop. 50,000+: North Charleston, SC
Nearest city with pop. 200,000+: Charlotte, NC
Nearest city with pop. 1,000,000+: Philadelphia, PA
Nearest cities:
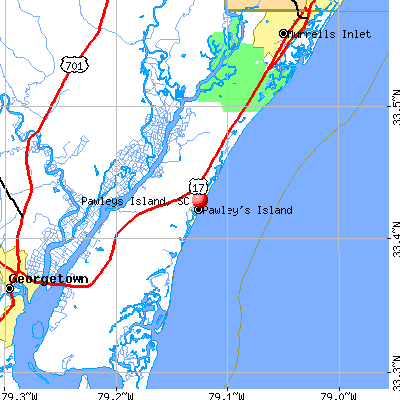
Latitude: 33.43 N, Longitude: 79.12 W
Pawleys Island tourist attractions:
Single-family new house construction building permits:
2004: 7 buildings , average cost: $514,6002003: 9 buildings , average cost: $600,0002002: 2 buildings , average cost: $565,5002001: 3 buildings , average cost: $441,0002000: 3 buildings , average cost: $441,0001999: 1 building , cost: $458,0001998: 3 buildings , average cost: $176,7001997: 4 buildings , average cost: $206,300Unemployment in December 2023: Here:
3.6%South Carolina:
3.1%
Most common occupations in Pawleys Island, SC (%)
Both Males Females
Other sales and related occupations, including supervisors (13.7%)
Other management occupations, except farmers and farm managers (8.2%)
Top executives (6.8%)
Operations specialties managers, except financial managers (6.8%)
Bookkeeping, accounting, and auditing clerks (6.8%)
Engineers (5.5%)
Life and physical scientists (5.5%)
Other sales and related occupations, including supervisors (14.3%)
Top executives (11.9%)
Operations specialties managers, except financial managers (11.9%)
Life and physical scientists (9.5%)
Other health diagnosing and treating practitioners and technical occupations (7.1%)
Architects, surveyors, and cartographers (7.1%)
Physicians and surgeons (7.1%)
Bookkeeping, accounting, and auditing clerks (16.1%)
Other management occupations, except farmers and farm managers (12.9%)
Other sales and related occupations, including supervisors (12.9%)
Secretaries and administrative assistants (9.7%)
Engineers (6.5%)
Registered nurses (6.5%)
Art and design workers (6.5%)
Air pollution and air quality trends(lower is better)
AQI PM10 Pb
Tornado activity:
Pawleys Island-area historical tornado activity is below South Carolina state average. It is 43% smaller than the overall U.S. average.
On 11/7/1995, a category F4 (max. wind speeds 207-260 mph) tornado 45.9 miles away from the Pawleys Island town center injured one person and caused between $500,000 and $5,000,000 in damages.
On 11/24/1967, a category F3 (max. wind speeds 158-206 mph) tornado 35.1 miles away from the town center injured one person and caused between $5000 and $50,000 in damages.
Earthquake activity:
Pawleys Island-area historical earthquake activity is significantly above South Carolina state average. It is 56% smaller than the overall U.S. average. On 11/22/1974 at 05:25:55, a magnitude 4.7 (4.7 MB, Class: Light, Intensity: IV - V) earthquake occurred 69.5 miles away from Pawleys Island center On 8/23/2011 at 17:51:04, a magnitude 5.8 (5.8 MW, Depth: 3.7 mi, Class: Moderate, Intensity: VI - VII) earthquake occurred 317.0 miles away from the city center On 8/21/1992 at 16:31:55, a magnitude 4.4 (4.1 MB, 4.1 LG, 4.4 LG, Depth: 6.2 mi) earthquake occurred 63.0 miles away from Pawleys Island center On 8/2/1974 at 08:52:09, a magnitude 4.9 (4.3 MB, 4.9 LG) earthquake occurred 196.0 miles away from Pawleys Island center On 8/9/2020 at 12:07:37, a magnitude 5.1 (5.1 MW, Depth: 4.7 mi) earthquake occurred 238.4 miles away from the city center On 4/17/1995 at 13:45:57, a magnitude 3.9 (3.9 LG, Depth: 6.2 mi, Class: Light, Intensity: II - III) earthquake occurred 64.0 miles away from Pawleys Island center Magnitude types: regional Lg-wave magnitude (LG), body-wave magnitude (MB), moment magnitude (MW) Natural disasters: The number of natural disasters in Georgetown County (19) is greater than the US average (15).Major Disasters (Presidential) Declared: 9Emergencies Declared: 5Hurricanes: 11, Storms: 3, Winter Storms: 3, Floods: 2, Tornado: 1, Tropical Storm: 1, Wind: 1, Other: 1 (Note: some incidents may be assigned to more than one category). Hospitals and medical centers in Pawleys Island: THE LAKES AT LITCHFIELD SNF (120 LAKES AT LITCHFIELD DRIVE)
Other hospitals and medical centers near Pawleys Island: TIDELANDS COMMUNITY HOSPICE (Hospital, about 10 miles away; GEORGETOWN, SC)
JESSAMINE COMM. RES. (Hospital, about 10 miles away; GEORGETOWN, SC)
AMEDISYS HOME HEALTH OF GEORGETOWN (Home Health Center, about 10 miles away; GEORGETOWN, SC)
FMC OF GEORGETOWN INC (Dialysis Facility, about 10 miles away; GEORGETOWN, SC)
MARYVILLE COMMUNITY RESIDENCE (Hospital, about 13 miles away; GEORGETOWN, SC)
GEORGETOWN HEALTHCARE AND REHAB, INC (Nursing Home, about 13 miles away; GEORGETOWN, SC)
FMC WINYAH (Dialysis Facility, about 13 miles away; GEORGETOWN, SC)
Colleges/universities with over 2000 students nearest to Pawleys Island:
Coastal Carolina University (about 27 miles; Conway, SC ; Full-time enrollment: 8,881)
Horry-Georgetown Technical College (about 27 miles; Conway, SC ; FT enrollment: 5,772)
Francis Marion University (about 61 miles; Florence, SC ; FT enrollment: 3,624)
Charleston Southern University (about 63 miles; Charleston, SC ; FT enrollment: 3,012)
Trident Technical College (about 63 miles; Charleston, SC ; FT enrollment: 13,125)
College of Charleston (about 65 miles; Charleston, SC ; FT enrollment: 10,974)
Medical University of South Carolina (about 66 miles; Charleston, SC ; FT enrollment: 2,138)
Public high school in Pawleys Island: WACCAMAW HIGH Location: 2412 KINGS RIVER ROAD, Grades: 9-12)
Private high school in Pawleys Island: LOWCOUNTRY PREP SCHOOL Students: 175, Location: 300 BLUE STEM DR, Grades: PK-12)
Public elementary/middle schools in Pawleys Island: WACCAMAW MIDDLE Students: 794, Location: 247 WILDCAT WAY, Grades: 7-8)WACCAMAW ELEMENTARY Students: 724, Location: 1364 WAVERLY ROAD, Grades: PK-3)WACCAMAW INTERMEDIATE Students: 575, Location: 320 WILDCAT WAY, Grades: 4-6)COASTAL MONTESSORI CHARTER Location: 247 WILDCAT WAY, Grades: 1-6, Charter school )
Private elementary/middle school in Pawleys Island: MONTESSORI SCHOOL OF PAWLEYS ISLAND Students: 79, Location: 236 COMMERCE DR, Grades: PK-6)
See full list of schools located in Pawleys Island
Notable location: (A) . Display/hide its location on the map
Park in Pawleys Island: (1) . Display/hide its location on the map
Tourist attractions:
Hotels:
Georgetown County has a predicted average indoor radon screening level less than 2 pCi/L (pico curies per liter) - Low Potential Drinking water stations with addresses in Pawleys Island and their reported violations in the past:
GCWSD/WACCAMAW NECK (2220010) (Population served: 36,023, Surface water):
Past monitoring violations:
Monitoring, Turbidity (Enhanced SWTR) - In JUL-2007, Contaminant: IESWTR. Follow-up actions: St Public Notif requested (AUG-28-2007), St Violation/Reminder Notice (AUG-28-2007), St Public Notif received (JUL-01-2008)
Population served: 2,122, Groundwater):
Past health violations:
MCL, Average - Between JAN-2008 and MAR-2008, Contaminant: TTHM. Follow-up actions: St Show-cause Hearing (NOV-27-2007), St Public Notif requested (MAY-02-2008), St Violation/Reminder Notice (MAY-02-2008), St Public Notif received (MAY-28-2008), St Compliance achieved (OCT-01-2008)
MCL, Average - Between OCT-2007 and DEC-2007, Contaminant: TTHM. Follow-up actions: St Show-cause Hearing (NOV-27-2007), St Public Notif requested (JAN-10-2008), St Violation/Reminder Notice (JAN-10-2008), St Public Notif received (FEB-14-2008), St Compliance achieved (OCT-01-2008)
MCL, Average - Between JUL-2007 and SEP-2007, Contaminant: TTHM. Follow-up actions: St Public Notif requested (OCT-08-2007), St Violation/Reminder Notice (OCT-08-2007), St Public Notif received (NOV-06-2007), St Show-cause Hearing (NOV-27-2007), St Compliance achieved (OCT-01-2008)
MCL, Average - Between JAN-2007 and MAR-2007, Contaminant: TTHM. Follow-up actions: St Public Notif requested (APR-27-2007), St Violation/Reminder Notice (APR-27-2007), St Show-cause Hearing (NOV-27-2007), St Compliance achieved (OCT-01-2008)
Drinking water stations with addresses in Pawleys Island that have no violations reported:
GCWSD/KILSOCK WATER SYS (2220002) (Population served: 4,096, Primary Water Source Type: Groundwater)
GCWSD/GARDEN CITY POINT (2220011) (Population served: 1,772, Primary Water Source Type: Purch surface water)
GCWSD/PLANTERSVILLE SYS (2220004) (Population served: 1,403, Primary Water Source Type: Groundwater)
GCWSD/WEDGEFIELD PLANTATION (2220006) (Population served: 1,034, Primary Water Source Type: Groundwater)
GCWSD/RED HILL (2220007) (Population served: 533, Primary Water Source Type: Groundwater)
Average household size: This town:
1.8 peopleSouth Carolina:
2.5 people
Percentage of family households: This town:
56.9%Whole state:
67.5%
Percentage of households with unmarried partners: This town:
1.7%Whole state:
6.0%
No gay or lesbian households reported
Banks with most branches in Pawleys Island (2011 data):
First Citizens Bank and Trust Company, Inc.: Pawleys Island Branch at 11022 Ocean Highway, branch established on 1985/12/23. Info updated 2011/08/24: Bank assets: $8,104.0 mil, Deposits: $6,880.8 mil, headquarters in Columbia, SC, positive income , 197 total offices , Holding Company: First Citizens Bancorporation, Inc.
Plantation Federal Bank: at 11039 Ocean Highway, branch established on 1986/10/20. Info updated 2011/07/21: Bank assets: $486.4 mil, Deposits: $440.5 mil, local headquarters , negative income in the last year , Commercial Lending Specialization, 6 total offices
Palmetto Heritage Bank & Trust: at 10919 Ocean Boulevard, branch established on 2005/01/03. Info updated 2006/11/03: Bank assets: $143.9 mil, Deposits: $117.2 mil, local headquarters , negative income in the last year , Commercial Lending Specialization, 3 total offices , Holding Company: Palmetto Heritage Bancshares, Inc.
Branch Banking and Trust Company: Pawleys Island Branch at 11403 Ocean Highway, branch established on 2002/12/09. Info updated 2010/03/29: Bank assets: $168,867.6 mil, Deposits: $127,549.5 mil, headquarters in Winston Salem, NC, positive income , Commercial Lending Specialization, 1793 total offices , Holding Company: Bb&T Corporation
Bank of North Carolina: Litchfield\pawleys Island Branch Off at 115 Willbrook Blvd, branch established on 2004/07/05. Info updated 2012/01/09: Bank assets: $2,453.6 mil, Deposits: $2,119.0 mil, headquarters in Thomasville, NC, positive income , Commercial Lending Specialization, 37 total offices , Holding Company: Bnc Bancorp
Wells Fargo Bank, National Association: Litchfield Beach Branch at 13272 Ocean Highway, branch established on 1976/05/17. Info updated 2011/04/05: Bank assets: $1,161,490.0 mil, Deposits: $905,653.0 mil, headquarters in Sioux Falls, SD, positive income , 6395 total offices , Holding Company: Wells Fargo & Company
The Conway National Bank: Pawleys Island Branch at 10608 Ocean Highway, branch established on 2005/12/05. Info updated 2010/06/01: Bank assets: $914.3 mil, Deposits: $733.3 mil, headquarters in Conway, SC, positive income , Commercial Lending Specialization, 15 total offices , Holding Company: Cnb Corporation
First Federal Savings and Loan Association of Charleston: Pawleys Island Branch at 13021 Ocean Highway, branch established on 1914/01/01. Info updated 2012/02/24: Bank assets: $3,140.4 mil, Deposits: $2,278.8 mil, headquarters in Charleston, SC, negative income in the last year , Mortgage Lending Specialization, 69 total offices
Bank of America, National Association: Pawleys Island Plaza Branch at Highway 17 South, branch established on 1990/03/26. Info updated 2009/11/18: Bank assets: $1,451,969.3 mil, Deposits: $1,077,176.8 mil, headquarters in Charlotte, NC, positive income , 5782 total offices , Holding Company: Bank Of America Corporation
3 other banks with 3 local branches
For population 15 years and over in Pawleys Island:
Never married: 2.8%Now married: 73.9%Separated: 0.8%Widowed: 13.2%Divorced: 9.2% For population 25 years and over in Pawleys Island:
High school or higher: 98.0%Bachelor's degree or higher: 79.4%Graduate or professional degree: 45.1%Unemployed: 2.7%Mean travel time to work (commute): 20.5 minutes
Education Gini index (Inequality in education) Here:
8.2South Carolina average:
11.1
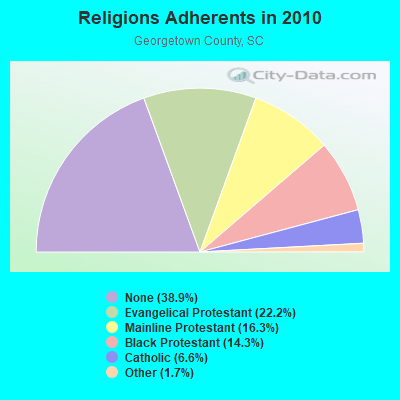
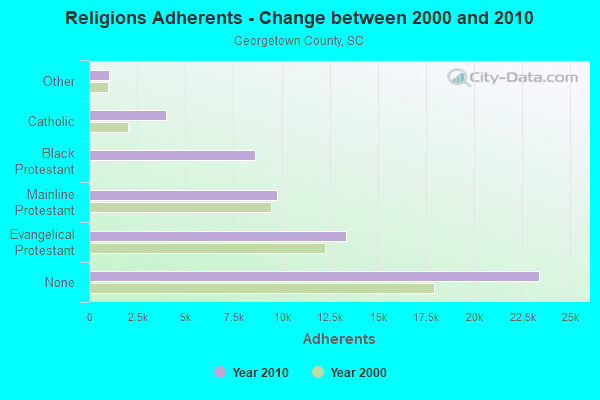
Religion statistics for Pawleys Island, SC (based on Georgetown County data)
Religion Adherents Congregations Evangelical Protestant 13,340 77 Mainline Protestant 9,784 22 Black Protestant 8,614 38 Catholic 3,990 3 Other 1,031 5 None 23,399 -
Source: Clifford Grammich, Kirk Hadaway, Richard Houseal, Dale E.Jones, Alexei Krindatch, Richie Stanley and Richard H.Taylor. 2012. 2010 U.S.Religion Census: Religious Congregations & Membership Study. Association of Statisticians of American Religious Bodies. Jones, Dale E., et al. 2002. Congregations and Membership in the United States 2000. Nashville, TN: Glenmary Research Center. Graphs represent county-level data
Food Environment Statistics: Number of grocery stores : 14Georgetown County :
2.32 / 10,000 pop.South Carolina :
1.99 / 10,000 pop.
Number of supercenters and club stores : 1Georgetown County :
0.17 / 10,000 pop.State :
0.15 / 10,000 pop.
Number of convenience stores (no gas) : 4This county :
0.66 / 10,000 pop.South Carolina :
0.85 / 10,000 pop.
Number of convenience stores (with gas) : 33Georgetown County :
5.46 / 10,000 pop.South Carolina :
5.38 / 10,000 pop.
Number of full-service restaurants : 81This county :
13.41 / 10,000 pop.State :
7.75 / 10,000 pop.
Adult diabetes rate : Georgetown County :
12.1%South Carolina :
10.6%
Adult obesity rate : Georgetown County :
30.3%South Carolina :
29.4%
Low-income preschool obesity rate : This county :
11.3%State :
13.4%
Health and Nutrition: Healthy diet rate : Pawleys Island:
65.1%South Carolina:
49.2%
Average overall health of teeth and gums : Here:
66.0%South Carolina:
46.2%
Average BMI : Pawleys Island:
27.6South Carolina:
29.0
People feeling badly about themselves : Pawleys Island:
18.5%South Carolina:
20.4%
People not drinking alcohol at all : This city:
7.7%State:
11.0%
Average hours sleeping at night : Overweight people : Pawleys Island:
42.5%South Carolina:
34.4%
General health condition : Pawleys Island:
67.5%South Carolina:
55.6%
Average condition of hearing : This city:
82.1%South Carolina:
79.9%
More about Health and Nutrition of Pawleys Island, SC Residents
Local government employment and payroll (March 2022)
Function
Full-time employees
Monthly full-time payroll
Average yearly full-time wage
Part-time employees
Monthly part-time payroll
Police Protection - Officers
4 $18,699 $56,097 0 $0 Other Government Administration
2 $13,186 $79,116 0 $0
Totals for Government
6 $31,885 $63,770 0 $0
Pawleys Island government finances - Expenditure in 2017 (per resident):
Current Operations - Police Protection: $379,000 ($2849.62)
Solid Waste Management: $171,000 ($1285.71)Central Staff Services: $120,000 ($902.26)Regular Highways: $109,000 ($819.55)General - Other: $98,000 ($736.84)Protective Inspection and Regulation - Other: $37,000 ($278.20)Parks and Recreation: $24,000 ($180.45)Other Capital Outlay - Police Protection: $1,000 ($7.52)
Total Salaries and Wages: $321,000 ($2413.53)
Pawleys Island government finances - Revenue in 2017 (per resident):
Miscellaneous - Interest Earnings: $63,000 ($473.68)
General Revenue - Other: $36,000 ($270.68)Donations From Private Sources: $16,000 ($120.30)Fines and Forfeits: $14,000 ($105.26)State Intergovernmental - Other: $462,000 ($3473.68)
General Local Government Support: $2,000 ($15.04)Tax - Other Selective Sales: $764,000 ($5744.36)
Public Utilities Sales: $47,000 ($353.38)
Pawleys Island government finances - Cash and Securities in 2017 (per resident):
Other Funds - Cash and Securities: $6,227,000 ($46819.55)
Businesses in Pawleys Island, SC
Name Count Name Count
Ace Hardware 1 Holiday Inn 1 Advance Auto Parts 1 KFC 1 CVS 1 McDonald's 1 Chevrolet 1 Nissan 1 Curves 1 SONIC Drive-In 1 Domino's Pizza 1 Starbucks 1 FedEx 4 Subway 1 Ford 1 Super 8 1 Hardee's 1 U-Haul 2 Hilton 1 UPS 6
Strongest AM radio stations in Pawleys Island:
WQJM (1450 AM; 10 kW; MYRTLE BEACH, SC; Owner: NM LICENSING, LLC)
WLMC (1470 AM; 1 kW; GEORGETOWN, SC; Owner: CUMBERLAND A & A CORPORATION)
WGTN (1400 AM; 1 kW; GEORGETOWN, SC; Owner: R.J. STALVEY)
WPJS (1330 AM; 5 kW; CONWAY, SC; Owner: WPJS BROADCASTING, INC.)
WIQB (1050 AM; 25 kW; CONWAY, SC; Owner: CUMULUS LICENSING CORP.)
WMIR (1200 AM; 6 kW; ATLANTIC BEACH, SC; Owner: ATLANTIC BEACH RADIO, INC.)
WCEO (840 AM; daytime; 50 kW; COLUMBIA, SC; Owner: EASTERN BROADCASTING GROUP, INC.)
WBAJ (890 AM; daytime; 50 kW; BLYTHEWOOD, SC; Owner: FAMILY FIRST)
WQTK (950 AM; 10 kW; MONCKS CORNER, SC; Owner: KIRKMAN BROADCASTING, INC.)
WPTF (680 AM; 50 kW; RALEIGH, NC; Owner: FIRST STATE COMMUNICATIONS)
WJMX (970 AM; 10 kW; FLORENCE, SC; Owner: QANTUM OF FLORENCE LICENSE COMPANY, LLC)
WDKD (1310 AM; 5 kW; KINGSTREE, SC; Owner: MILLER COMMUNICATIONS, INC.)
WHYM (1260 AM; 5 kW; LAKE CITY, SC; Owner: GHB OF LAKE CITY, INC.)
Strongest FM radio stations in Pawleys Island:
WSYN (106.5 FM; GEORGETOWN, SC; Owner: CUMULUS LICENSING CORP.)
WSEA (100.3 FM; ATLANTIC BEACH, SC; Owner: CUMULUS LICENSING CORP.)
WDAI (98.5 FM; PAWLEYS ISLAND, SC; Owner: CUMULUS LICENSING CORP.)
WYAV (104.1 FM; MYRTLE BEACH, SC; Owner: NM LICENSING, LLC)
WMYB (92.1 FM; MYRTLE BEACH, SC; Owner: NM LICENSING, LLC)
WGTR (107.9 FM; BUCKSPORT, SC; Owner: QANTUM OF MYRTLE BEACH LICENSE COMPANY, LLC)
WWXM (97.7 FM; GARDEN CITY, SC; Owner: QANTUM OF MYRTLE BEACH LICENSE COMPANY, LLC)
WYEZ (94.5 FM; MURRELLS INLET, SC; Owner: FIDELITY BROADCASTING CORPORATION)
WYAK-FM (103.1 FM; SURFSIDE BEACH, SC; Owner: CUMULUS LICENSING CORP.)
WMBJ (88.3 FM; MURRELLS INLET, SC; Owner: RADIO TRAINING NETWORK, INC.)
W260AK (99.9 FM; GEORGETOWN, SC; Owner: BIBLE BROADCASTING NETWORK, INC)
WSUY (96.9 FM; CHARLESTON, SC; Owner: CITADEL BROADCASTING COMPANY)
WGTN-FM (100.7 FM; ANDREWS, SC; Owner: COASTLINE COMMUNICATIONS OF CAROLINA INC.)
WCSQ (92.5 FM; MONCKS CORNER, SC; Owner: APEX BROADCASTING, INC.)
WXJY (93.7 FM; GEORGETOWN, SC; Owner: CUMULUS LICENSING CORP.)
WAVF (96.1 FM; HANAHAN, SC; Owner: APEX BROADCASTING, INC.)
WSCI (89.3 FM; CHARLESTON, SC; Owner: SOUTH CAROLINA EDUCATIONAL TV COMMISSION)
WRNN (99.5 FM; SOCASTEE, SC; Owner: NM LICENSING, LLC)
WLGI (90.9 FM; HEMINGWAY, SC; Owner: LOUIS G. GREGORY BAHA'I INSTITUTE)
WHMC-FM (90.1 FM; CONWAY, SC; Owner: SOUTH CAROLINA EDUCATIONAL TV COMMISSION)
TV broadcast stations around Pawleys Island:
W51AT (Channel 51; GEORGETOWN, SC; Owner: DOVE BROADCASTING, INC.)
WFXB (Channel 43; MYRTLE BEACH, SC; Owner: GE MEDIA, INC.)
WCSC-TV (Channel 5; CHARLESTON, SC; Owner: WCSC, INC.)
WITV (Channel 7; CHARLESTON, SC; Owner: SOUTH CAROLINA EDUCATIONAL TV COMMISSION)
WWSC-LP (Channel 28; MYRTLE BEACH, SC; Owner: WWSC TELEVISION, INC.)
W22CJ (Channel 22; GEORGETOWN, SC; Owner: TRINITY BROADCASTING NETWORK)
WCIV (Channel 4; CHARLESTON, SC; Owner: WCIV, LLC)
WMMP (Channel 36; CHARLESTON, SC; Owner: WMMP LICENSEE L.P.)
WTAT-TV (Channel 24; CHARLESTON, SC; Owner: WTAT LICENSEE, LLC)
WSFX-TV (Channel 26; WILMINGTON, NC; Owner: SOUTHEASTERN MEDIA HOLDINGS, INC.)
WHMC (Channel 23; CONWAY, SC; Owner: SOUTH CAROLINA EDUCATIONAL TV COMMISSION)
W34CQ (Channel 34; MYRTLE BEACH, SC; Owner: TRINITY BROADCASTING NETWORK)
W49AN (Channel 49; MYRTLE BEACH, SC; Owner: DOVE BROADCASTING, INC.)
National Bridge Inventory (NBI) Statistics 10 Number of bridges102ft / 30.9m Total length $316,000 Total costs20,400 Total average daily traffic633 Total average daily truck traffic21,799 Total future (year 2040) average daily traffic
New bridges - historical statistics
4 1900-1909 1 1980-1989 3 1990-1999 2 2000-2009
See full National Bridge Inventory statistics for Pawleys Island, SC
FCC Registered Cell Phone Towers: 2 (
See the full list of FCC Registered Cell Phone Towers in Pawleys Island )
FCC Registered Antenna Towers: 36 (
See the full list of FCC Registered Antenna Towers )
FCC Registered Broadcast Land Mobile Towers: 17 (
See the full list of FCC Registered Broadcast Land Mobile Towers in Pawleys Island, SC )
FCC Registered Microwave Towers: 3
Annie, 432 Sandy Island Road (Lat: 33.498278 Lon: -79.094639), Type: Gtower, Structure height: 91.4 m, Overall height: 93.6 m, Call Sign: WQPV674, Assigned Frequencies: 6034.15 MHz, Grant Date: 08/24/2012, Expiration Date: 08/24/2022, Cancellation Date: 10/25/2012, Certifier: John E Monday, Registrant: At&t Mobility LLC, 5601 Legacy Drive, Ms: A-3, Plano, TX 75024, Phone: (469) 229-7471, Fax: (469) 229-7297, Email:
Crown, 432 Sandy Island Road (Lat: 33.498278 Lon: -79.094639), Type: Silo, Structure height: 91.4 m, Overall height: 93.6 m, Call Sign: WRZQ779, Assigned Frequencies: 11075.0 MHz, 11075.0 MHz, 11075.0 MHz, 11075.0 MHz, 11075.0 MHz, 11075.0 MHz, 11075.0 MHz, 11075.0 MHz, 11075.0 MHz, 11075.0 MHz, 11075.0 MHz, 11075.0 MHz, Grant Date: 11/29/2023, Expiration Date: 11/29/2033, Certifier: Karen Bergman, Registrant: Intelpath, Hinsdale, IL 60522, Phone: (312) 841-9188, Email:
Island Tower, No Exact Address (Lat: 33.517972 Lon: -79.129222), Type: Ltower, Structure height: 18.3 m, Call Sign: WRZQ780, Assigned Frequencies: 11565.0 MHz, 11565.0 MHz, 11645.0 MHz, 11645.0 MHz, 11565.0 MHz, 11565.0 MHz, 11645.0 MHz, 11645.0 MHz, 11565.0 MHz, 11565.0 MHz... (+14 more), Grant Date: 11/29/2023, Expiration Date: 11/29/2033, Certifier: Karen Bergman, Registrant: Intelpath, Hinsdale, IL 60522, Phone: (312) 841-9188, Email:
FCC Registered Maritime Coast & Aviation Ground Towers: 3
2040 Willbrook Blvd (Lat: 33.502944 Lon: -79.128111), Type: Building, Overall height: 12 m, Call Sign: KOK786, Assigned Frequencies: 156.425 MHz, 156.450 MHz, 156.600 MHz, 156.800 MHz, Grant Date: 10/12/2000, Expiration Date: 10/12/2005, Cancellation Date: 01/07/2006, Registrant: Reserve Harbor Marina LLC, 2040 Willbrook Blvd, Pawleys Island, SC 29585 Heritage Plantation Marina Dockmasters Office (Lat: 33.250167 Lon: -79.249778), Type: Building, Overall height: 10 m, Call Sign: WQZ366, Licensee ID: L00029693, Assigned Frequencies: 156.450 MHz, 156.800 MHz, 156.425 MHz, Grant Date: 07/05/2000, Expiration Date: 08/09/2005, Cancellation Date: 01/07/2006, Registrant: Heritage Plantation Ltd, Myrtle Beach, SC 29578-2038 2040 Willbrook Blvd (Lat: 33.502944 Lon: -79.128111), Type: Bant, Structure height: 13 m, Overall height: 34 m, Call Sign: WQEM675, Assigned Frequencies: 156.425 MHz, 156.450 MHz, 156.600 MHz, 156.800 MHz, Grant Date: 03/07/2006, Expiration Date: 03/07/2016, Cancellation Date: 05/07/2016, Certifier: Jason Poe, Registrant: Morningstar Marinas - Reserve Harbor LLC, 2040 Willbrook Blvd, Pawleys Island, SC 29585, Phone: (843) 235-8262, Fax: (843) 235-8273, Email:
FCC Registered Amateur Radio Licenses: 71 (
See the full list of FCC Registered Amateur Radio Licenses in Pawleys Island )
FAA Registered Aircraft Manufacturers and Dealers: 1 (
See the full list of FAA Registered Manufacturers and Dealers in Pawleys Island )
FAA Registered Aircraft: 21 (
See the full list of FAA Registered Aircraft )
Fire-safe hotels and motels in Pawleys Island, South Carolina:
Hampton Inn Pawleys Island/Litchfield, 150 Willbrook Blvd, Pawleys Island, South Carolina 29585 Phone: (843) 235-2000, Fax: (843) 235-2099
Vista Inn & Suites, 7903 Ocean Hwy, Pawleys Island, South Carolina 29585 Phone: (843) 237-4261, Fax: (843) 237-9703
Best Western, 114451 Ocean Hwy, Pawleys Island, South Carolina 29585 Phone: (843) 235-0808, Fax: (843) 235-0175
Best Western, 1145 Ocean Hwy, Pawleys island, South Carolina 29585 Phone: (843) 235-0808, Fax: (843) 235-0175
All 4 fire-safe hotels and motels in Pawleys Island, South Carolina Pawleys Island compared to South Carolina state average:
Median house value significantly above state average. Unemployed percentage significantly below state average. Black race population percentage significantly below state average. Hispanic race population percentage significantly below state average. Median age significantly above state average. Foreign-born population percentage below state average. Renting percentage below state average. Length of stay since moving in significantly above state average. Number of rooms per house above state average. House age above state average. Number of college students below state average. Percentage of population with a bachelor's degree or higher significantly above state average.
Top Patent Applicants
Robert W. Honeycutt (16)
Daryl W. Greene (4)
Robert Honeycutt (2)
Guerry E. Green (2)
Charleson S. Bell (1)
Gina C. O'Dell (1)
Adam Kirby (1)
Steven Jay Greenberg (1)
Darrell Andrew Joye (1)
William Whiteside (1)
Total of 41 patent applications in 2008-2024.


 Recent articles from our blog. Our writers, many of them Ph.D. graduates or candidates, create easy-to-read articles on a wide variety of topics.


 (63.9 miles


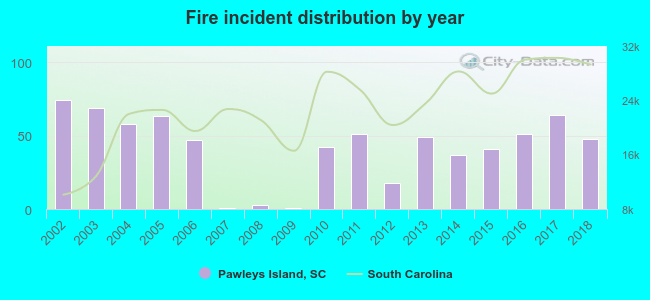 According to the data from the years 2002 - 2018 the average number of fires per year is 42. The highest number of reported fires - 74 took place in 2002, and the least - 1 in 2007. The data has a decreasing trend.
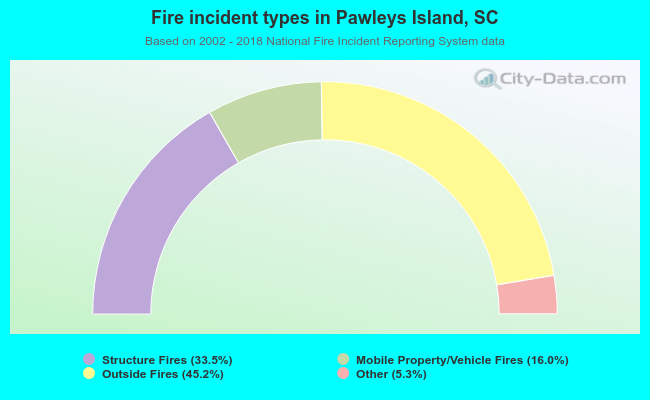 When looking into fire subcategories, the most incidents belonged to: Outside Fires (45.2%), and Structure Fires (33.5%).

