Phoenix, Oregon
Submit your own pictures of this city and show them to the world
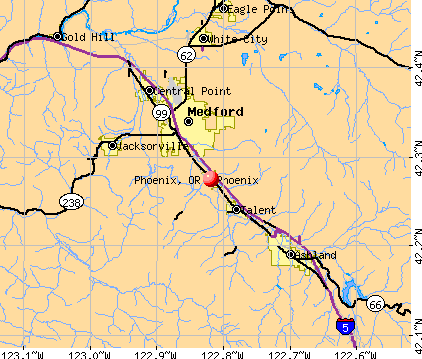
- OSM Map
- General Map
- Google Map
- MSN Map
Population change since 2000: +3.6%
 |
| Males: 1,916 | |
| Females: 2,290 |
| Median resident age: | 54.7 years |
| Oregon median age: | 40.5 years |
Zip codes: 97535.
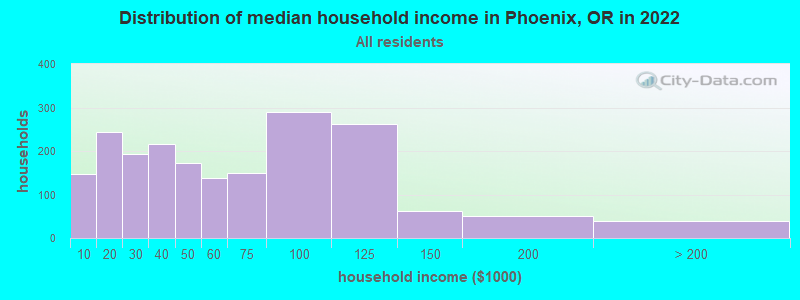
| Phoenix: | $48,405 |
| OR: | $75,657 |
Estimated per capita income in 2022: $30,991 (it was $16,828 in 2000)
Phoenix city income, earnings, and wages data
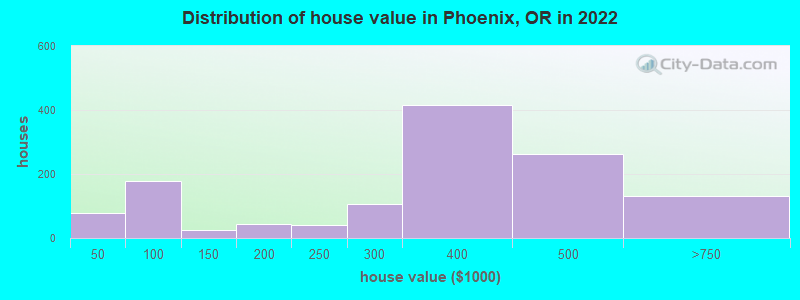
Estimated median house or condo value in 2022: $367,058 (it was $94,600 in 2000)
| Phoenix: | $367,058 |
| OR: | $475,600 |
Mean prices in 2022: all housing units: $284,424; detached houses: $370,372; townhouses or other attached units: $474,737; mobile homes: $80,983
Median gross rent in 2022: $1,143.
(15.1% for White Non-Hispanic residents, 4.9% for Black residents)
Detailed information about poverty and poor residents in Phoenix, OR

Compare current foreclosures near Phoenix, OR:
| Photo | Address | Area | Beds / Baths | Price | Details |
|---|---|---|---|---|---|

|
#1
B St
Phoenix, OR 97535
|
1,632 sq. feet
|
2 baths 3 beds |
show details | |

|
#2
Alder St
Phoenix, OR 97535
|
1,517 sq. feet
|
2 baths 3 beds |
show details | |

|
#3
Amerman Dr
Phoenix, OR 97535
|
2,691 sq. feet
|
3 baths 3 beds |
show details | |

|
#4
Meadow View Dr
Phoenix, OR 97535
|
1,969 sq. feet
|
2 baths 3 beds |
show details | |

|
#5
Elm St
Phoenix, OR 97535
|
- sq. feet
|
2 baths 3 beds |
show details | |

|
#6
S Pacific Hwy
Phoenix, OR 97535
|
- sq. feet
|
- baths - beds |
show details | |

|
#7
Cherry St
Medford, OR 97501
|
1,485 sq. feet
|
2 baths 4 beds |
$419,900
|
show details |

|
#8
Kellogg St
Gold Hill, OR 97525
|
1,300 sq. feet
|
2 baths 2 beds |
$409,000
|
show details |

|
#9
Glengrove Ave
Central Point, OR 97502
|
1,284 sq. feet
|
2 baths 3 beds |
show details | |

|
#10
E Ashland Ln
Ashland, OR 97520
|
280 sq. feet
|
1 baths - beds |
$139,900
|
show details |
| Photo | Address | Area | Beds / Baths | Price | Details |
|---|---|---|---|---|---|

|
#11
Alder St
Medford, OR 97501
|
1,578 sq. feet
|
1 baths 3 beds |
show details | |

|
#12
Windsor Way
Central Point, OR 97502
|
1,843 sq. feet
|
2 baths 4 beds |
show details | |

|
#13
E Hersey St
Ashland, OR 97520
|
944 sq. feet
|
1 baths 2 beds |
show details | |

|
#14
E Gregory Rd
Central Point, OR 97502
|
1,588 sq. feet
|
1 baths 3 beds |
show details | |

|
#15
Garfield St
Medford, OR 97501
|
1,434 sq. feet
|
1 baths 3 beds |
show details | |

|
#16
Torri Ln
White City, OR 97503
|
1,409 sq. feet
|
2 baths 3 beds |
show details | |

|
#17
Lillian St
Medford, OR 97501
|
1,283 sq. feet
|
2 baths 3 beds |
show details | |

|
#18
Carr St
White City, OR 97503
|
1,152 sq. feet
|
1 baths 3 beds |
show details | |

|
#19
Timberline Rd
White City, OR 97503
|
1,443 sq. feet
|
2 baths 3 beds |
show details | |

|
#20
Stacie Way
Medford, OR 97504
|
2,042 sq. feet
|
2 baths 3 beds |
show details |
| Photo | Address | Area | Beds / Baths | Price | Details |
|---|---|---|---|---|---|

|
#21
Timberlake Dr
Ashland, OR 97520
|
3,163 sq. feet
|
3 baths 3 beds |
show details | |

|
#22
E Barnett Rd # 5
Medford, OR 97504
|
1,226 sq. feet
|
2 baths 2 beds |
show details | |

|
#23
Bianca Ct
Medford, OR 97504
|
2,133 sq. feet
|
2 baths 3 beds |
show details | |

|
#24
Perry Rd
Central Point, OR 97502
|
2,748 sq. feet
|
4 baths 5 beds |
show details | |

|
#25
Springbrook Rd
Medford, OR 97504
|
1,600 sq. feet
|
2 baths 3 beds |
show details | |

|
#26
Dianne Way
Eagle Point, OR 97524
|
1,455 sq. feet
|
2 baths 3 beds |
show details | |

|
#27
Gangnes Dr
Talent, OR 97540
|
1,150 sq. feet
|
1 baths 3 beds |
show details | |

|
#28
Elliott Ave
Medford, OR 97501
|
1,144 sq. feet
|
1 baths 3 beds |
show details | |

|
#29
Green Park Dr
Central Point, OR 97502
|
1,385 sq. feet
|
2 baths 3 beds |
show details | |

|
#30
Wedgewood Dr
Central Point, OR 97502
|
1,497 sq. feet
|
2 baths 3 beds |
show details |
| Photo | Address | Area | Beds / Baths | Price | Details |
|---|---|---|---|---|---|

|
#31
W Clark St
Medford, OR 97501
|
1,296 sq. feet
|
1 baths 3 beds |
show details | |

|
#32
Reager St
Medford, OR 97501
|
1,264 sq. feet
|
1 baths 3 beds |
show details | |

|
#33
Whittle Ave
Medford, OR 97504
|
1,613 sq. feet
|
2 baths 3 beds |
show details | |

|
#34
Fairweather Dr
Medford, OR 97501
|
1,220 sq. feet
|
1 baths 3 beds |
show details | |

|
#35
Brookside Dr
Medford, OR 97504
|
1,212 sq. feet
|
2 baths 2 beds |
show details | |

|
#36
Juanita Way
Central Point, OR 97502
|
1,539 sq. feet
|
2 baths 3 beds |
show details | |

|
#37
Jessica Cir
Central Point, OR 97502
|
1,288 sq. feet
|
2 baths 3 beds |
show details | |

|
#38
Rochelle Ct
Central Point, OR 97502
|
1,313 sq. feet
|
2 baths 3 beds |
show details | |

|
#39
Kirk Ln
Ashland, OR 97520
|
1,614 sq. feet
|
2 baths 3 beds |
show details | |

|
#40
Candlis Point Ct
Medford, OR 97504
|
2,578 sq. feet
|
3 baths 2 beds |
show details |
| Photo | Address | Area | Beds / Baths | Price | Details |
|---|---|---|---|---|---|

|
#41
Morningside St
Medford, OR 97501
|
1,300 sq. feet
|
2 baths 3 beds |
show details | |

|
#42
Gilman Rd
Medford, OR 97504
|
1,476 sq. feet
|
2 baths 3 beds |
show details | |

|
#43
Beatty St
Medford, OR 97501
|
1,117 sq. feet
|
1 baths 2 beds |
show details | |

|
#44
Silky Oaks Ln
Medford, OR 97501
|
1,251 sq. feet
|
2 baths 3 beds |
show details | |

|
#45
Cody St
Medford, OR 97504
|
994 sq. feet
|
2 baths 3 beds |
show details | |

|
#46
Perrydale Ave
Medford, OR 97501
|
1,242 sq. feet
|
1 baths 3 beds |
show details | |

|
#47
Casey Way
Central Point, OR 97502
|
1,266 sq. feet
|
2 baths 2 beds |
show details | |

|
#48
Roberts Rd
Medford, OR 97504
|
1,878 sq. feet
|
2 baths 3 beds |
show details | |

|
#49
Corona Ave
Medford, OR 97504
|
1,000 sq. feet
|
1 baths 3 beds |
show details | |

|
Check over 1 million property listings on Foreclosure.com!
|
browse all offers | |||


- 3,37377.2%White alone
- 48111.0%Hispanic
- 4059.3%Other race alone
- 1082.5%Two or more races
- 451.0%Black alone
- 421.0%Native Hawaiian and Other
Pacific Islander alone - 360.8%Asian alone
- 200.5%American Indian alone
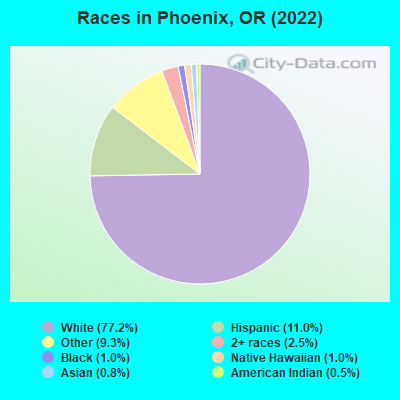
Races in Phoenix detailed stats: ancestries, foreign born residents, place of birth
According to our research of Oregon and other state lists, there were 4 registered sex offenders living in Phoenix, Oregon as of April 25, 2024.
The ratio of all residents to sex offenders in Phoenix is 1,162 to 1.
Type |
2009 |
2010 |
2011 |
2012 |
2013 |
2014 |
2015 |
2016 |
2017 |
2018 |
2019 |
2020 |
2021 |
2022 |
|---|---|---|---|---|---|---|---|---|---|---|---|---|---|---|
| Murders (per 100,000) | 0 (0.0) | 0 (0.0) | 0 (0.0) | 0 (0.0) | 0 (0.0) | 0 (0.0) | 0 (0.0) | 0 (0.0) | 0 (0.0) | 0 (0.0) | 0 (0.0) | 0 (0.0) | 0 (0.0) | 0 (0.0) |
| Rapes (per 100,000) | 0 (0.0) | 1 (22.0) | 2 (43.6) | 1 (21.7) | 2 (43.5) | 1 (21.6) | 0 (0.0) | 1 (21.8) | 5 (108.4) | 2 (43.5) | 0 (0.0) | 0 (0.0) | 3 (63.8) | 1 (24.7) |
| Robberies (per 100,000) | 0 (0.0) | 1 (22.0) | 0 (0.0) | 1 (21.7) | 3 (65.2) | 1 (21.6) | 2 (44.1) | 4 (87.4) | 4 (86.7) | 2 (43.5) | 2 (43.2) | 2 (42.7) | 0 (0.0) | 0 (0.0) |
| Assaults (per 100,000) | 5 (112.9) | 0 (0.0) | 3 (65.4) | 3 (65.1) | 4 (87.0) | 2 (43.3) | 10 (220.5) | 3 (65.5) | 1 (21.7) | 5 (108.8) | 13 (281.0) | 8 (170.9) | 4 (85.0) | 7 (172.8) |
| Burglaries (per 100,000) | 11 (248.4) | 22 (484.8) | 20 (436.1) | 8 (173.6) | 19 (413.0) | 25 (541.2) | 11 (242.6) | 16 (349.5) | 16 (346.8) | 30 (652.6) | 14 (302.6) | 16 (341.9) | 5 (106.3) | 18 (444.3) |
| Thefts (per 100,000) | 66 (1,490) | 77 (1,697) | 115 (2,508) | 118 (2,561) | 94 (2,043) | 72 (1,559) | 111 (2,448) | 142 (3,102) | 159 (3,446) | 202 (4,394) | 220 (4,755) | 197 (4,209) | 161 (3,422) | 102 (2,518) |
| Auto thefts (per 100,000) | 4 (90.3) | 8 (176.3) | 3 (65.4) | 7 (151.9) | 7 (152.2) | 7 (151.5) | 9 (198.5) | 14 (305.8) | 22 (476.8) | 10 (217.5) | 5 (108.1) | 15 (320.5) | 7 (148.8) | 16 (395.0) |
| Arson (per 100,000) | 0 (0.0) | 0 (0.0) | 0 (0.0) | 3 (65.1) | 1 (21.7) | 0 (0.0) | 2 (44.1) | 0 (0.0) | 0 (0.0) | 0 (0.0) | 1 (21.6) | 0 (0.0) | 1 (21.3) | 2 (49.4) |
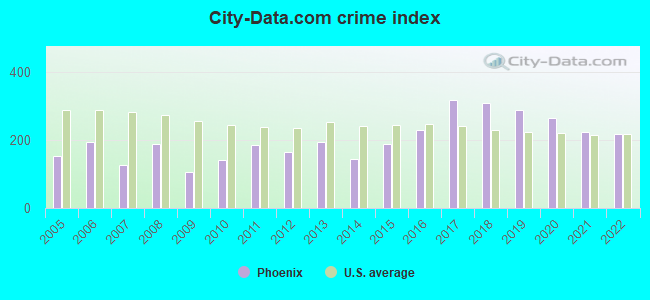
| City-Data.com crime index | 106.8 | 140.1 | 184.0 | 163.7 | 194.6 | 144.8 | 188.1 | 229.8 | 317.3 | 308.5 | 289.2 | 265.0 | 224.2 | 217.7 |
The City-Data.com crime index weighs serious crimes and violent crimes more heavily. Higher means more crime, U.S. average is 246.1. It adjusts for the number of visitors and daily workers commuting into cities.
Crime rate in Phoenix detailed stats: murders, rapes, robberies, assaults, burglaries, thefts, arson
Full-time law enforcement employees in 2021, including police officers: 10 (8 officers - 7 male; 1 female).
| Officers per 1,000 residents here: | 1.70 |
| Oregon average: | 1.48 |
 Recent articles from our blog. Our writers, many of them Ph.D. graduates or candidates, create easy-to-read articles on a wide variety of topics.


 | Moving my family from Phoenix to OR (38 replies) |
| Looking to move here in the future, but concerned about wildfires (170 replies) |
| Prescott vs Bend vs Spokane vs Colorado Springs :) (64 replies) |
| What I Love, Hate, Like, Dislike about Portland Oregon (777 replies) |
| Housing, Medford Area (3 replies) |
| Considering Bend, a couple questions though (26 replies) |
Latest news from Phoenix, OR collected exclusively by city-data.com from local newspapers, TV, and radio stations
Ancestries: English (25.6%), Irish (13.8%), American (5.1%), European (4.1%), German (4.1%), Swedish (3.7%).
Current Local Time: PST time zone
Incorporated in 1910
Elevation: 1543 feet
Land area: 1.25 square miles.
Population density: 3,367 people per square mile (average).

202 residents are foreign born (2.9% Latin America, 0.9% Europe, 0.6% Asia).
| This city: | 4.6% |
| Oregon: | 9.8% |
Median real estate property taxes paid for housing units with mortgages in 2022: $2,790 (0.7%)
Median real estate property taxes paid for housing units with no mortgage in 2022: $2,370 (1.1%)
Nearest city with pop. 50,000+: Medford, OR  (4.5 miles , pop. 63,154).
Nearest city with pop. 200,000+: Northwest Clackamas, OR (216.2 miles , pop. 224,220).
Nearest city with pop. 1,000,000+: Los Angeles, CA (615.5 miles , pop. 3,694,820).
Nearest cities:
), )Latitude: 42.27 N, Longitude: 122.82 W
Area code: 541
Phoenix, Oregon accommodation & food services, waste management - Economy and Business Data
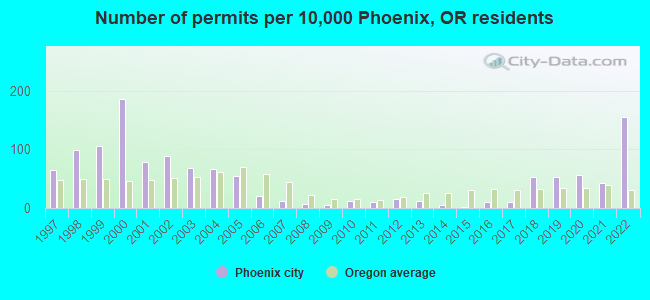
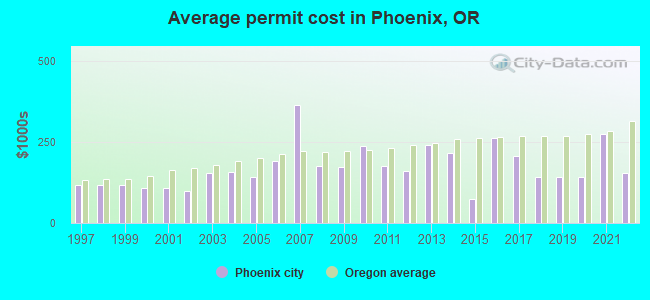
Single-family new house construction building permits:
- 2022: 63 buildings, average cost: $155,500
- 2021: 17 buildings, average cost: $274,200
- 2020: 23 buildings, average cost: $141,500
- 2019: 21 buildings, average cost: $141,500
- 2018: 21 buildings, average cost: $141,500
- 2017: 4 buildings, average cost: $206,400
- 2016: 4 buildings, average cost: $262,800
- 2015: 1 building, cost: $75,000
- 2014: 2 buildings, average cost: $214,600
- 2013: 5 buildings, average cost: $241,900
- 2012: 6 buildings, average cost: $160,400
- 2011: 4 buildings, average cost: $175,000
- 2010: 5 buildings, average cost: $237,200
- 2009: 2 buildings, average cost: $171,500
- 2008: 3 buildings, average cost: $175,000
- 2007: 5 buildings, average cost: $365,400
- 2006: 8 buildings, average cost: $191,000
- 2005: 22 buildings, average cost: $143,400
- 2004: 27 buildings, average cost: $156,600
- 2003: 28 buildings, average cost: $155,800
- 2002: 36 buildings, average cost: $98,800
- 2001: 32 buildings, average cost: $108,500
- 2000: 75 buildings, average cost: $109,200
- 1999: 43 buildings, average cost: $118,700
- 1998: 40 buildings, average cost: $116,300
- 1997: 26 buildings, average cost: $118,500
| Here: | 4.3% |
| Oregon: | 3.9% |
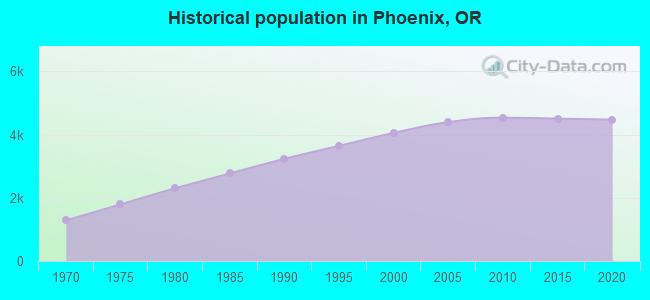
Population change in the 1990s: +580 (+16.7%).
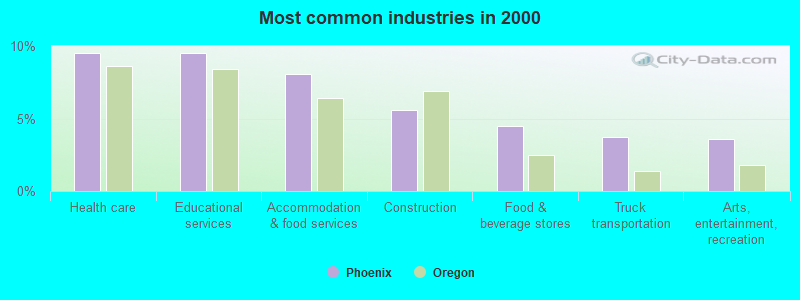
- Health care (9.6%)
- Educational services (9.5%)
- Accommodation & food services (8.1%)
- Construction (5.6%)
- Food & beverage stores (4.5%)
- Truck transportation (3.7%)
- Arts, entertainment, recreation (3.6%)
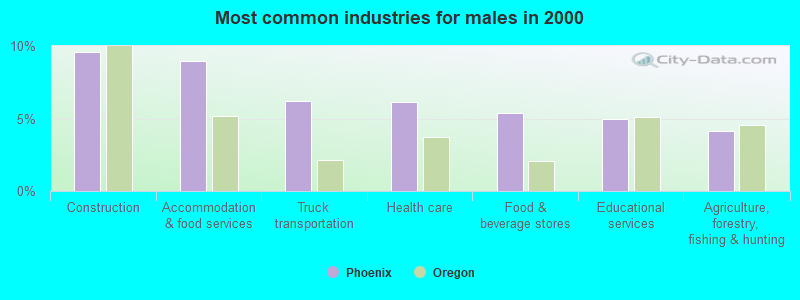
- Construction (9.6%)
- Accommodation & food services (9.0%)
- Truck transportation (6.2%)
- Health care (6.1%)
- Food & beverage stores (5.4%)
- Educational services (5.0%)
- Agriculture, forestry, fishing & hunting (4.1%)
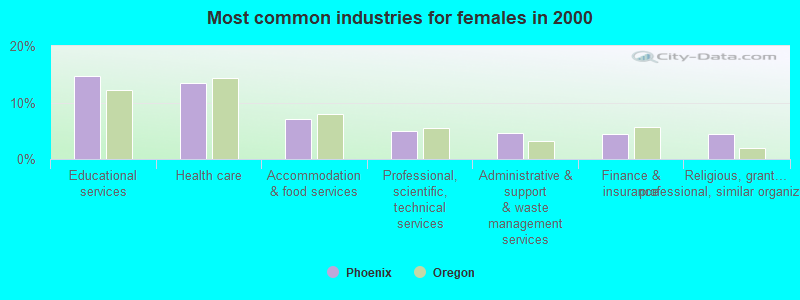
- Educational services (14.7%)
- Health care (13.5%)
- Accommodation & food services (7.1%)
- Professional, scientific, technical services (4.9%)
- Administrative & support & waste management services (4.6%)
- Finance & insurance (4.4%)
- Religious, grantmaking, civic, professional, similar organizations (4.4%)
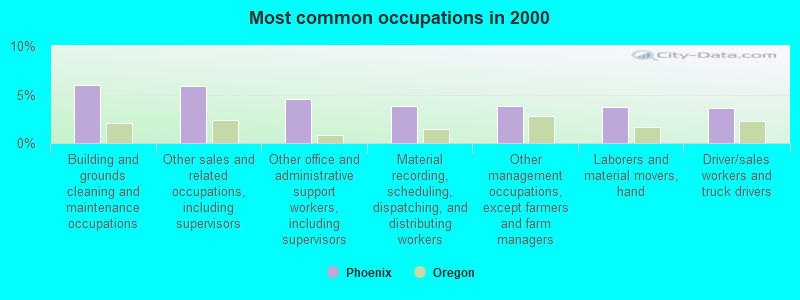
- Building and grounds cleaning and maintenance occupations (6.0%)
- Other sales and related occupations, including supervisors (5.9%)
- Other office and administrative support workers, including supervisors (4.6%)
- Material recording, scheduling, dispatching, and distributing workers (3.8%)
- Other management occupations, except farmers and farm managers (3.8%)
- Laborers and material movers, hand (3.7%)
- Driver/sales workers and truck drivers (3.7%)
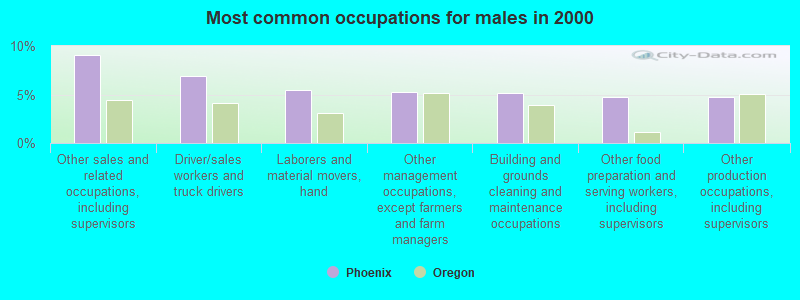
- Other sales and related occupations, including supervisors (9.1%)
- Driver/sales workers and truck drivers (6.9%)
- Laborers and material movers, hand (5.5%)
- Other management occupations, except farmers and farm managers (5.3%)
- Building and grounds cleaning and maintenance occupations (5.2%)
- Other food preparation and serving workers, including supervisors (4.7%)
- Other production occupations, including supervisors (4.7%)
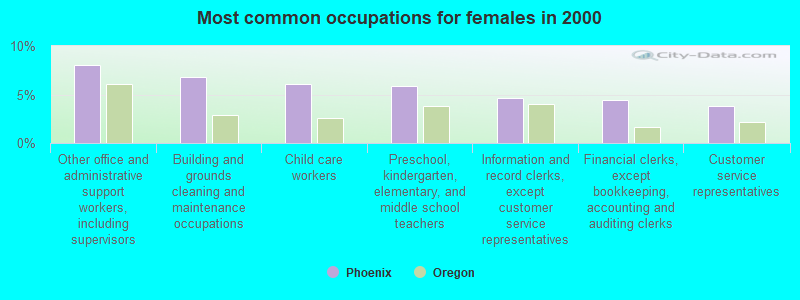
- Other office and administrative support workers, including supervisors (8.1%)
- Building and grounds cleaning and maintenance occupations (6.9%)
- Child care workers (6.1%)
- Preschool, kindergarten, elementary, and middle school teachers (5.9%)
- Information and record clerks, except customer service representatives (4.7%)
- Financial clerks, except bookkeeping, accounting and auditing clerks (4.4%)
- Customer service representatives (3.8%)
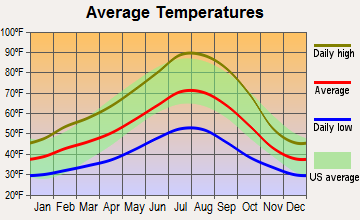
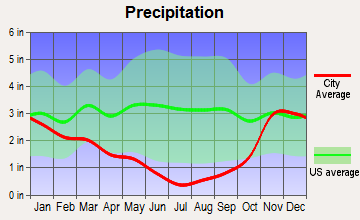
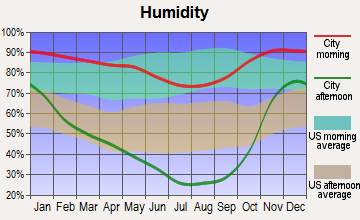
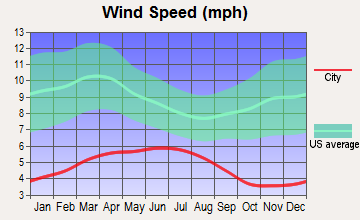
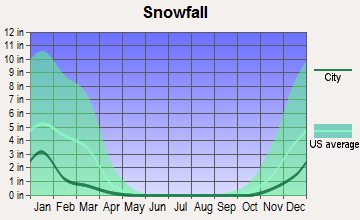
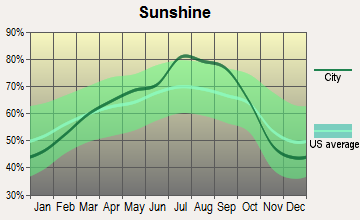
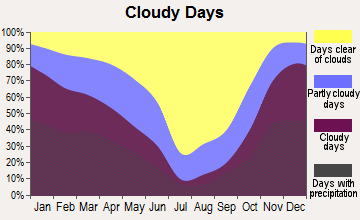
Average climate in Phoenix, Oregon
Based on data reported by over 4,000 weather stations
|
|


(lower is better)
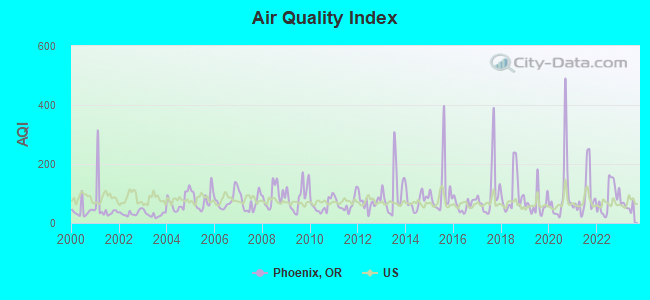
Air Quality Index (AQI) level in 2023 was 57.7. This is better than average.
| City: | 57.7 |
| U.S.: | 72.6 |

Carbon Monoxide (CO) [ppm] level in 2004 was 1.04. This is significantly worse than average. Closest monitor was 4.5 miles away from the city center.
| City: | 1.04 |
| U.S.: | 0.25 |
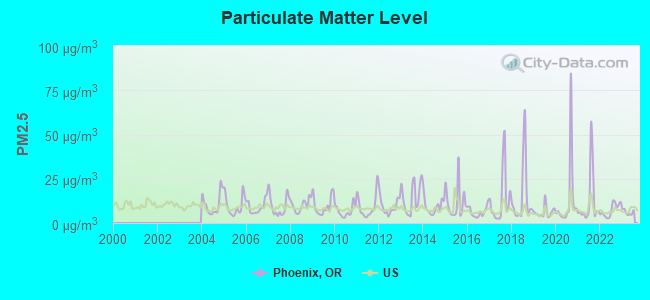
Particulate Matter (PM2.5) [µg/m3] level in 2023 was 6.13. This is better than average. Closest monitor was 4.1 miles away from the city center.
| City: | 6.13 |
| U.S.: | 8.11 |
Earthquake activity:
Phoenix-area historical earthquake activity is significantly above Oregon state average. It is 3409% greater than the overall U.S. average.On 1/31/1922 at 13:17:28, a magnitude 7.6 (7.6 UK, Class: Major, Intensity: VIII - XII) earthquake occurred 178.7 miles away from Phoenix center
On 11/8/1980 at 10:27:34, a magnitude 7.2 (6.2 MB, 7.2 MS, 7.2 MW, 7.0 ML) earthquake occurred 111.1 miles away from the city center
On 4/18/1906 at 13:12:21, a magnitude 7.9 (7.9 UK) earthquake occurred 295.8 miles away from the city center, causing $524,000,000 total damage
On 4/25/1992 at 18:06:04, a magnitude 7.2 (6.3 MB, 7.1 MS, 7.2 MW, 7.1 MW, Depth: 9.4 mi) earthquake occurred 148.1 miles away from the city center, causing $75,000,000 total damage
On 8/17/1991 at 22:17:14, a magnitude 7.1 (6.2 MB, 7.1 MS, 7.1 MW, 6.8 ML, Depth: 8.4 mi) earthquake occurred 146.8 miles away from the city center
On 6/15/2005 at 02:50:54, a magnitude 7.2 (7.2 MW, Depth: 9.9 mi) earthquake occurred 175.3 miles away from Phoenix center
Magnitude types: body-wave magnitude (MB), local magnitude (ML), surface-wave magnitude (MS), moment magnitude (MW)
Natural disasters:
The number of natural disasters in Jackson County (12) is smaller than the US average (15).Major Disasters (Presidential) Declared: 5
Emergencies Declared: 2
Causes of natural disasters: Fires: 5, Floods: 4, Storms: 2, Drought: 1, Heavy Rain: 1, Hurricane: 1, Landslide: 1, Mudslide: 1, Snow: 1, Wind: 1, Winter Storm: 1, Other: 1 (Note: some incidents may be assigned to more than one category).
Hospitals and medical centers near Phoenix:
- ROGUE VALLEY CARE CENTER (Nursing Home, about 1 miles away; MEDFORD, OR)
- ROGUE VALLEY MANOR (Nursing Home, about 3 miles away; MEDFORD, OR)
- ROGUE VALLEY DIALYSIS SERVICES (Dialysis Facility, about 3 miles away; MEDFORD, OR)
- HEARTHSTONE NURSING AND REHABILITATION CENTER (Nursing Home, about 3 miles away; MEDFORD, OR)
- ACCENTCARE HOME HEALTH OF ROGUE VALLEY, LLC (Home Health Center, about 3 miles away; MEDFORD, OR)
- ASANTE ROGUE REGIONAL MEDICAL CENTER Acute Care Hospitals (about 3 miles away; MEDFORD, OR)
- RVMC HOME CARE SERVICES HOSPIC (Hospital, about 4 miles away; MEDFORD, OR)
Amtrak stations near Phoenix:
Colleges/universities with over 2000 students nearest to Phoenix:
- Southern Oregon University (about 9 miles; Ashland, OR; Full-time enrollment: 4,650)
- Rogue Community College (about 31 miles; Grants Pass, OR; FT enrollment: 3,600)
- Oregon Institute of Technology (about 53 miles; Klamath Falls, OR; FT enrollment: 2,900)
- Humboldt State University (about 117 miles; Arcata, CA; FT enrollment: 7,353)
- Shasta College (about 117 miles; Redding, CA; FT enrollment: 5,645)
- Lane Community College (about 121 miles; Eugene, OR; FT enrollment: 6,373)
- University of Oregon (about 124 miles; Eugene, OR; FT enrollment: 23,329)
Public high schools in Phoenix:
- PHOENIX HIGH SCHOOL (Students: 808, Location: 745 N ROSE ST, Grades: 9-12)
- ARMADILLO TECHNICAL INSTITUTE (Students: 116, Location: 106 ROSE ST, Grades: 6-12, Charter school)
Public elementary/middle school in Phoenix:
- PHOENIX ELEMENTARY SCHOOL (Students: 435, Location: 215 N ROSE ST, Grades: KG-5)
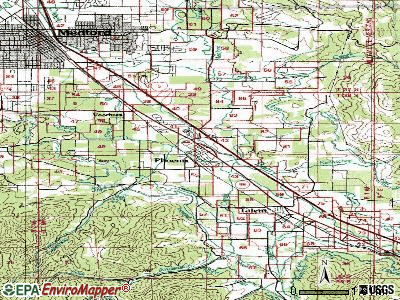
Points of interest:
Notable locations in Phoenix: Phoenix Historical Society Museum (A), Phoenix City Hall (B), Phoenix Branch Library (C), Phoenix Fire Department (D), Rogue Valley Genealogical Society Library (E). Display/hide their locations on the map
Cemetery: Phoenix Cemetery (1). Display/hide its location on the map
Creek: Payne Creek (A). Display/hide its location on the map
Tourist attraction: Phoenix Historical Society (Cultural Attractions- Events- & Facilities; 607 North Church Street).
Hotels: Pear Tree Motel (3730 Fern Valley Road), Bavarian Inn Motel (636 North Main Street), Phoenix Motel (510 North Main Street).
Birthplace of: Tami Farrell - Miss Teen USA 2003.
Drinking water stations with addresses in Phoenix and their reported violations in the past:
SOUTH VALLEY CHURCH (Population served: 70, Groundwater):Past monitoring violations:RISING SUN FARMS INC (Population served: 40, Groundwater):
- One regular monitoring violation
Past health violations:Past monitoring violations:
- MCL, Acute (TCR) - Between JUL-2011 and SEP-2011, Contaminant: Coliform. Follow-up actions: St Public Notif requested (JUL-14-2011), St Violation/Reminder Notice (AUG-01-2011), St Compliance achieved (MAR-12-2013)
- Follow-up Or Routine LCR Tap M/R - In JAN-01-2005, Contaminant: Lead and Copper Rule. Follow-up actions: St Compliance achieved (NOV-16-2005)
- Follow-up Or Routine LCR Tap M/R - In JAN-01-2004, Contaminant: Lead and Copper Rule. Follow-up actions: St Compliance achieved (NOV-16-2005)
- Initial Tap Sampling for Pb and Cu - In JAN-01-2003, Contaminant: Lead and Copper Rule. Follow-up actions: St Compliance achieved (NOV-16-2005)
- Initial Tap Sampling for Pb and Cu - In JUL-01-2002, Contaminant: Lead and Copper Rule. Follow-up actions: St Compliance achieved (NOV-16-2005)
- Initial Tap Sampling for Pb and Cu - In JAN-01-2001, Contaminant: Lead and Copper Rule. Follow-up actions: St Compliance achieved (NOV-16-2005)
- 7 routine major monitoring violations
- 3 regular monitoring violations
- One other older monitoring violation
| This city: | 2.3 people |
| Oregon: | 2.5 people |
| This city: | 58.9% |
| Whole state: | 63.4% |
| This city: | 6.9% |
| Whole state: | 8.0% |
Likely homosexual households (counted as self-reported same-sex unmarried-partner households)
- Lesbian couples: 0.2% of all households
- Gay men: 0.5% of all households
3 people in other group homes in 2000
3 people in agriculture workers' dormitories on farms in 2000
Banks with branches in Phoenix (2011 data):
- Wells Fargo Bank, National Association: Phoenix In-Store Branch at 735 North Main Street, branch established on 1997/09/05. Info updated 2011/04/05: Bank assets: $1,161,490.0 mil, Deposits: $905,653.0 mil, headquarters in Sioux Falls, SD, positive income, 6395 total offices, Holding Company: Wells Fargo & Company
- Umpqua Bank: Phoenix Branch at 4000 South Pacific Highway, branch established on 1980/01/31. Info updated 2011/09/02: Bank assets: $11,556.7 mil, Deposits: $9,325.3 mil, headquarters in Roseburg, OR, positive income, Commercial Lending Specialization, 193 total offices, Holding Company: Umpqua Holdings Corporation
For population 15 years and over in Phoenix:
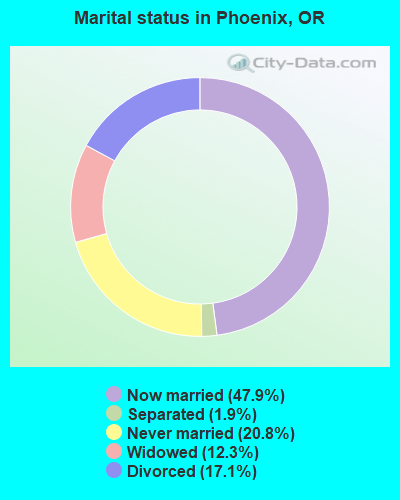
- Never married: 20.8%
- Now married: 47.9%
- Separated: 1.9%
- Widowed: 12.3%
- Divorced: 17.1%
For population 25 years and over in Phoenix:
- High school or higher: 94.1%
- Bachelor's degree or higher: 27.1%
- Graduate or professional degree: 11.6%
- Unemployed: 9.4%
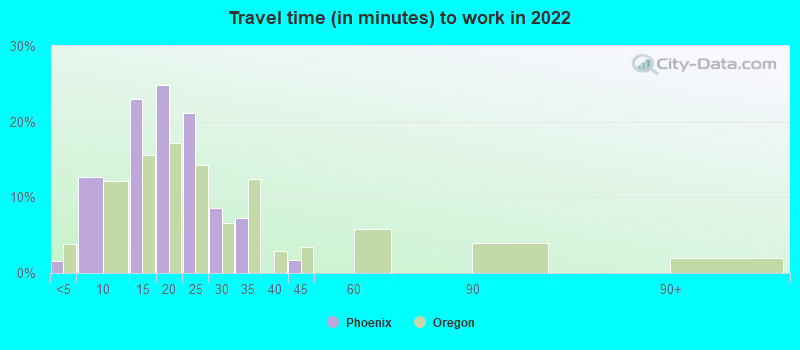
- Mean travel time to work (commute): 16.2 minutes

| Here: | 8.4 |
| Oregon average: | 11.6 |
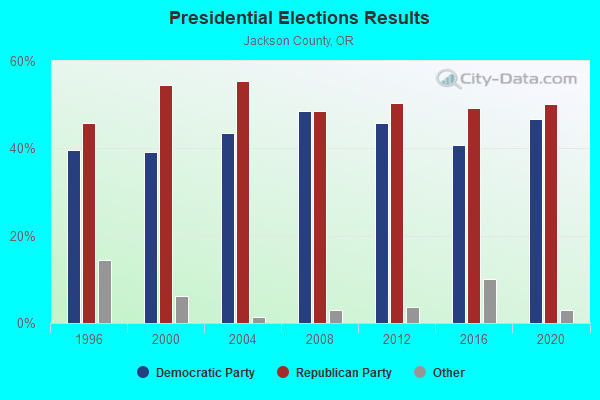
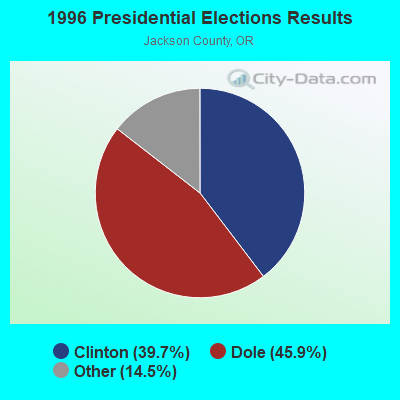
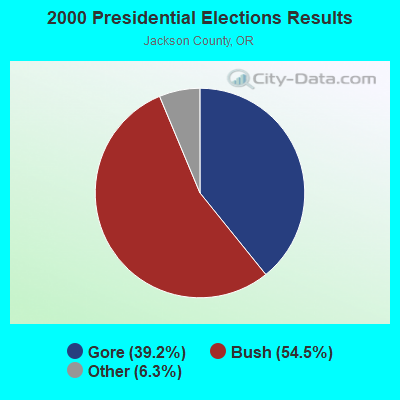
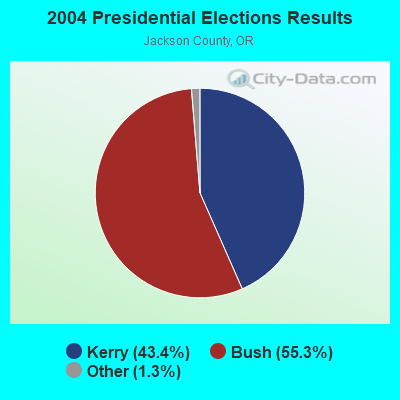

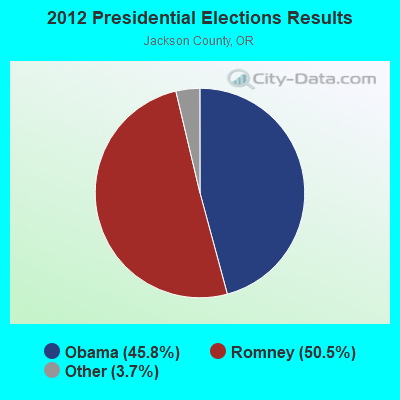
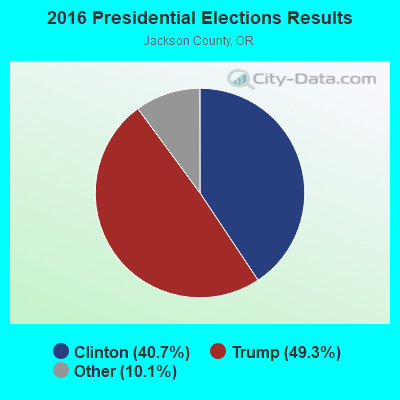
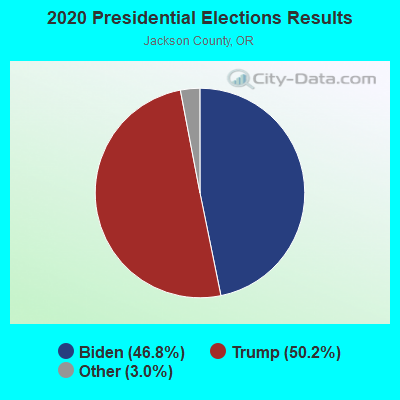
Graphs represent county-level data. Detailed 2008 Election Results
Religion statistics for Phoenix, OR (based on Jackson County data)
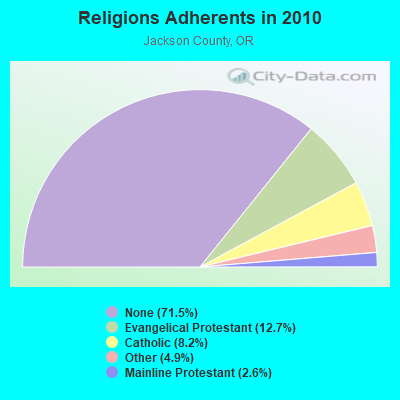
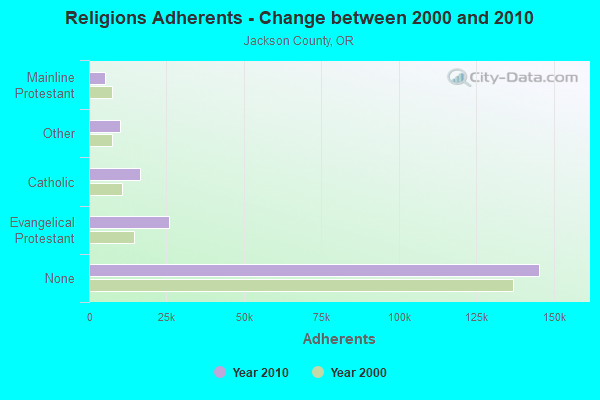
| Religion | Adherents | Congregations |
|---|---|---|
| Evangelical Protestant | 25,890 | 122 |
| Catholic | 16,565 | 6 |
| Other | 10,057 | 44 |
| Mainline Protestant | 5,252 | 23 |
| Orthodox | 100 | 2 |
| None | 145,342 | - |
Food Environment Statistics:
| Jackson County: | 1.66 / 10,000 pop. |
| State: | 2.03 / 10,000 pop. |
| Here: | 0.30 / 10,000 pop. |
| Oregon: | 0.33 / 10,000 pop. |
| This county: | 2.26 / 10,000 pop. |
| State: | 2.01 / 10,000 pop. |
| Jackson County: | 1.66 / 10,000 pop. |
| State: | 1.69 / 10,000 pop. |
| Here: | 10.00 / 10,000 pop. |
| Oregon: | 9.93 / 10,000 pop. |
| Jackson County: | 7.9% |
| State: | 7.4% |
| Jackson County: | 23.2% |
| Oregon: | 25.6% |
| This county: | 11.1% |
| Oregon: | 14.2% |
Health and Nutrition:
| Here: | 49.8% |
| State: | 49.6% |
| Phoenix: | 46.1% |
| Oregon: | 46.8% |
| Phoenix: | 29.0 |
| State: | 28.5 |
| Phoenix: | 22.0% |
| Oregon: | 21.2% |
| Phoenix: | 12.2% |
| Oregon: | 10.1% |
| Here: | 6.9 |
| State: | 6.8 |
| Phoenix: | 36.1% |
| Oregon: | 33.3% |
| This city: | 54.9% |
| Oregon: | 56.5% |
| Phoenix: | 76.0% |
| Oregon: | 78.7% |
More about Health and Nutrition of Phoenix, OR Residents
| Local government employment and payroll (March 2022) | |||||
| Function | Full-time employees | Monthly full-time payroll | Average yearly full-time wage | Part-time employees | Monthly part-time payroll |
|---|---|---|---|---|---|
| Police Protection - Officers | 9 | $60,253 | $80,337 | 0 | $0 |
| Parks and Recreation | 4 | $23,043 | $69,129 | 0 | $0 |
| Other Government Administration | 4 | $14,103 | $42,309 | 0 | $0 |
| Totals for Government | 17 | $97,398 | $68,752 | 0 | $0 |
Phoenix government finances - Expenditure in 2017 (per resident):
- Current Operations - Police Protection: $1,212,000 ($288.16)
Water Utilities: $1,131,000 ($268.90)
Regular Highways: $545,000 ($129.58)
Central Staff Services: $467,000 ($111.03)
Financial Administration: $276,000 ($65.62)
Parks and Recreation: $111,000 ($26.39)
Judicial and Legal Services: $11,000 ($2.62)
- Total Salaries and Wages: $1,252,000 ($297.67)
- Water Utilities - Interest on Debt: $73,000 ($17.36)
Phoenix government finances - Revenue in 2017 (per resident):
- Charges - Regular Highways: $231,000 ($54.92)
Other: $34,000 ($8.08)
- Miscellaneous - Fines and Forfeits: $180,000 ($42.80)
General Revenue - Other: $95,000 ($22.59)
Interest Earnings: $38,000 ($9.03)
- Revenue - Water Utilities: $1,263,000 ($300.29)
- State Intergovernmental - Highways: $371,000 ($88.21)
Other: $153,000 ($36.38)
General Local Government Support: $74,000 ($17.59)
- Tax - Property: $902,000 ($214.46)
Public Utilities Sales: $344,000 ($81.79)
Other License: $110,000 ($26.15)
Other Selective Sales: $92,000 ($21.87)
Occupation and Business License - Other: $26,000 ($6.18)
Alcoholic Beverage License: $1,000 ($0.24)
Phoenix government finances - Debt in 2017 (per resident):
- Long Term Debt - Beginning Outstanding - Unspecified Public Purpose: $5,011,000 ($1191.39)
Outstanding Unspecified Public Purpose: $4,882,000 ($1160.72)
Retired Unspecified Public Purpose: $208,000 ($49.45)
Issue, Unspecified Public Purpose: $79,000 ($18.78)
Phoenix government finances - Cash and Securities in 2017 (per resident):
- Other Funds - Cash and Securities: $5,212,000 ($1239.18)
| Businesses in Phoenix, OR | ||||
| Name | Count | Name | Count | |
|---|---|---|---|---|
| AT&T | 1 | Kincaid | 1 | |
| Circle K | 1 | La-Z-Boy | 1 | |
| FedEx | 1 | Subway | 1 | |
| Home Depot | 1 | |||
Strongest AM radio stations in Phoenix:
- KAPL (1300 AM; 20 kW; PHOENIX, OR; Owner: APPLEGATE MEDIA, INC.)
- KMED (1440 AM; 5 kW; MEDFORD, OR; Owner: CITICASTERS LICENSES, L.P.)
- KLVB (730 AM; 1 kW; MEDFORD, OR)
- KCMX (880 AM; 1 kW; PHOENIX, OR; Owner: MAPLETON COMMUNICATIONS, LLC)
- KTMT (580 AM; 10 kW; ASHLAND, OR; Owner: MAPLETON COMMUNICATIONS, LLC)
- KRTA (610 AM; 5 kW; MEDFORD, OR; Owner: OPUS BROADCASTING SYSTEMS, INC.)
- KSJK (1230 AM; 1 kW; TALENT, OR; Owner: ST. OF OR. ACT & ST. BD. OF HGR ED.)
- KAJO (1270 AM; 10 kW; GRANTS PASS, OR; Owner: GRANTS PASS BROADCASTING CORPORATION)
- KGRV (700 AM; 25 kW; WINSTON, OR; Owner: PACIFIC CASCADE COMMUNICATIONS CORP.)
- KAGI (930 AM; 5 kW; GRANTS PASS, OR; Owner: SOUTHERN OREGON STATE COLLEGE)
- KDUN (1030 AM; 50 kW; REEDSPORT, OR; Owner: PAMPLIN BROADCASTING-OREGON, INC.)
- KPNW (1120 AM; 50 kW; EUGENE, OR; Owner: CAPSTAR TX LIMITED PARTNERSHIP)
- KPOJ (620 AM; 50 kW; PORTLAND, OR; Owner: CITICASTERS LICENSES, L.P.)
Strongest FM radio stations in Phoenix:
- KIFS (107.5 FM; ASHLAND, OR; Owner: CITICASTERS LICENSES, L.P.)
- K204CY (88.7 FM; MEDFORD, OR; Owner: EDUCATIONAL MEDIA FOUNDATION)
- KSMF (89.1 FM; ASHLAND, OR; Owner: STATE OF OREGON/STATE BD HIGHER EDUC)
- K216DR (91.1 FM; CENTRAL POINT, OR; Owner: EDUCATIONAL MEDIA FOUNDATION)
- KSRG (88.3 FM; ASHLAND, OR; Owner: ST. BOARD OF HIGHER ED/SO. OR ST COL)
- K209CP (89.7 FM; TALENT, OR; Owner: EDUCATIONAL MEDIA FOUNDATION)
- K227AA (93.3 FM; ASHLAND, ETC., OR; Owner: MAPLETON COMMUNICATIONS, LLC)
- K284AE (104.7 FM; ASHLAND, OR; Owner: MAPLETON COMMUNICATIONS, LLC)
- K214BO (90.7 FM; ASHLAND, OR; Owner: FAMILY STATIONS, INC.)
- KLDZ (103.5 FM; MEDFORD, OR; Owner: CITICASTERS LICENSES, L.P.)
- K254AD (98.7 FM; MEDFORD, OR; Owner: GRANTS PASS BROADCASTING CORPORATION)
- KZZE (106.3 FM; EAGLE POINT, OR; Owner: CITICASTERS LICENSES, L.P.)
- KAKT (105.1 FM; PHOENIX, OR; Owner: MAPLETON COMMUNICATIONS, LLC)
- KTMT-FM (93.7 FM; MEDFORD, OR; Owner: MAPLETON COMMUNICATIONS, LLC)
- KCMX-FM (101.9 FM; ASHLAND, OR; Owner: MAPLETON COMMUNICATIONS, LLC)
- KROG (96.9 FM; GRANTS PASS, OR; Owner: OPUS BROADCASTING SYSTEMS, INC.)
- KRRM (94.7 FM; ROGUE RIVER, OR; Owner: SHIRLEY M. BELL)
- K290AF (105.9 FM; ROGUE RIVER, OR; Owner: CITICASTERS LICENSES, L.P.)
- KLDR (98.3 FM; HARBECK-FRUITDALE, OR; Owner: GRANTS PASS BROADCASTING CORP.)
- K266AC (101.1 FM; ROGUE RIVER, OR; Owner: CITICASTERS LICENSES, L.P.)
TV broadcast stations around Phoenix:
- KMVU (Channel 26; MEDFORD, OR; Owner: BROADCASTING LICENSES, L.P.)
- K34DJ (Channel 34; PHOENIX, ETC., OR; Owner: SOUTHERN OREGON PUBLIC TELEVISION)
- K04EO (Channel 4; ASHLAND, ETC., OR; Owner: FREEDOM BROADCASTING OF OREGON, INC.)
- K16CU (Channel 16; PHOENIX, TALENT, OR; Owner: FREEDOM BROADCASTING OF OREGON, INC.)
- K32DY (Channel 32; MEDFORD, OR; Owner: CALIFORNIA OREGON BROADCASTING, INC.)
- K39EF (Channel 39; ASHLAND, OR; Owner: WATCHTV, INC.)
- K52EE (Channel 52; MEDFORD, OR; Owner: BETTER LIFE TELEVISION)
- KTVL (Channel 10; MEDFORD, OR; Owner: FREEDOM BROADCASTING OF OREGON, INC.)
- K07RQ (Channel 7; JACKSONVILLE, OR; Owner: SOUTHERN OREGON PUBLIC TELEVISION)
- K21BG (Channel 21; JACKSONVILLE, OR; Owner: SODA MOUNTAIN BROADCASTING, INC.)
- National Bridge Inventory (NBI) Statistics
- 5Number of bridges
- 98ft / 29.9mTotal length
- 97,465Total average daily traffic
- 11,267Total average daily truck traffic
FCC Registered Antenna Towers:
14 (See the full list of FCC Registered Antenna Towers in Phoenix)FCC Registered Private Land Mobile Towers:
1- Mount Baldy 3 Mi Ne (Lat: 42.299028 Lon: -122.750028), Structure height: 21 m, Call Sign: KNJH997,
Assigned Frequencies: 856.037 MHz, 857.037 MHz, 858.037 MHz, 859.037 MHz, 860.037 MHz, 861.962 MHz, 862.962 MHz, 863.962 MHz, 864.962 MHz, 865.962 MHz, Grant Date: 12/23/2008, Expiration Date: 01/30/2019, Cancellation Date: 06/27/2012, Registrant: Sprint Nextel Corporation, 12502 Sunrise Valley Drive, M/S: Varesa0209, Reston, VA 20196, Phone: (703) 433-4000, Fax: (703) 433-4483
FCC Registered Broadcast Land Mobile Towers:
5- City Hall 510 W First St (Lat: 42.270972 Lon: -122.819750), Call Sign: WZM998, Licensee ID: L00320376,
Assigned Frequencies: 155.670 MHz, Grant Date: 07/03/2004, Expiration Date: 07/13/2014, Cancellation Date: 09/13/2014, Registrant: City Of Phoenix, 510 W First St City Hall, Phoenix, OR 97535, Phone: (503) 535-1113
- Lat: 42.298194 Lon: -122.750861, Call Sign: WPDS300,
Assigned Frequencies: 461.375 MHz, 463.300 MHz, 466.375 MHz, 468.300 MHz, Grant Date: 07/10/2019, Expiration Date: 09/21/2029, Registrant: Lukas, Nace, Gutierrez & Sachs, LLP, 8300 Greensboro Drive, Ste. 1200, Mclean, VA 22102, Phone: (703) 584-8676, Fax: (703) 584-8696, Email:
- 3345 North Phoenix Rd (Lat: 42.282500 Lon: -122.815000), Call Sign: WQHE533,
Assigned Frequencies: 467.762 MHz, 467.837 MHz, 467.850 MHz, 467.875 MHz, 467.900 MHz, Grant Date: 06/27/2017, Expiration Date: 07/12/2027, Certifier: Jim Fisher, Registrant: Advanced Wireless Communications, 20809 Kensington Blvd, Lakeville, MN 55044, Phone: (952) 469-5400, Fax: (952) 469-0170, Email:
- PHOENIX HS, Lat: 42.276361 Lon: -122.824833, Call Sign: WRFL888,
Assigned Frequencies: 467.212 MHz, 467.237 MHz, Grant Date: 03/26/2020, Expiration Date: 03/26/2030, Certifier: Jonathan A Mccalip, Registrant: Innovation Wireless, 11869 Teale St, Culver City, CA 90230, Phone: (888) 559-5565, Fax: (310) 482-3480, Email:
- Lat: 42.259361 Lon: -122.801222, Call Sign: WRKT865,
Assigned Frequencies: 452.662 MHz, 452.887 MHz, 452.987 MHz, 457.887 MHz, 457.987 MHz, Grant Date: 02/11/2021, Expiration Date: 02/11/2031, Certifier: John Mccalip, Registrant: Radio Licensing Services, Milwaukie, OR 97269, Phone: (503) 659-1240, Fax: (503) 794-3759, Email:
FCC Registered Microwave Towers:
1- PHOENIX, 4401 S Pacific Highway (Lat: 42.271611 Lon: -122.810556), Type: Mtower, Structure height: 36.9 m, Overall height: 38.4 m, Call Sign: WQXG503,
Assigned Frequencies: 6685.00 MHz, 6685.00 MHz, 5945.20 MHz, Grant Date: 02/26/2016, Expiration Date: 02/26/2026, Certifier: John Monday, Registrant: At&t Services, Inc., 208 S. Akard St., 20f, Dallas, TX 75202, Phone: (855) 699-7073, Email:
FCC Registered Paging Towers:
5- Mount Baldy, 4.8 Kilometers Northeast Of (Lat: 42.299000 Lon: -122.750028), Overall height: 48 m, Call Sign: KNLS595,
Assigned Frequencies: 931.812 MHz, Grant Date: 04/17/1998, Expiration Date: 04/17/2008, Cancellation Date: 09/27/2002, Registrant: Mobilemedia Communications, Inc., Debtor-In-Possession, 2101 Wilson Boulevard, Suite 935, Arlington, VA 22201, Phone: (703) 312-5153, Fax: (703) 312-5155, Email:
- MOUNT BALDE, 2.42 Km East Of Phoenix (Lat: 42.295111 Lon: -122.751139), Structure height: 9.1 m, Overall height: 1122.5 m, Call Sign: KNKL929,
Assigned Frequencies: 931.212 MHz, Expiration Date: 04/01/1999, Cancellation Date: 06/05/1999, Registrant: Young & Jatlow, 2300 N Street, N.W. Suite 600, Washington, DC 20037, Phone: (202) 663-9080
- Mount Balde, 2.42 Km E Of (Lat: 42.295111 Lon: -122.751139), Overall height: 7.6 m, Call Sign: KNKL939, Licensee ID: L01422065,
Assigned Frequencies: 931.212 MHz, 931.612 MHz, Grant Date: 05/07/2019, Expiration Date: 04/01/2029, Certifier: Shawn E Endsley, Registrant: Spok, Inc., 3000 Technology Dr., Ste. 400, Plano, TX 75074, Phone: (972) 801-0177, Fax: (888) 833-7112, Email:
- Mt Baldy, 3 Mi Ne Of (Lat: 42.299000 Lon: -122.750028), Overall height: 21.3 m, Call Sign: WQZD509,
Assigned Frequencies: 931.937 MHz, Grant Date: 04/23/2019, Expiration Date: 04/01/2029, Certifier: J. Roy Pottle, Registrant: Wilkinson Barker Knauer, LLP, 1800 M Street, N.W., Suite 800n, Washington, DC 20036, Phone: (202) 783-4141, Fax: (202) 783-5851, Email:
- Mt Baldy, 3 Mi. Ne Of (Lat: 42.299000 Lon: -122.750028), Call Sign: KNKP485,
Assigned Frequencies: 931.437 MHz, Grant Date: 08/19/1999, Expiration Date: 04/01/2009, Cancellation Date: 11/10/2004, Registrant: Skytel Corp., 500 Clinton Center Drive, Clinton, MS 39056, Phone: (601) 460-3890, Fax: (601) 460-3889, Email:
FCC Registered Amateur Radio Licenses:
47 (See the full list of FCC Registered Amateur Radio Licenses in Phoenix)FAA Registered Aircraft:
14 (See the full list of FAA Registered Aircraft in Phoenix)2002 - 2017 National Fire Incident Reporting System (NFIRS) incidents
- Fire incident types reported to NFIRS in Phoenix, OR
- 16846.3%Structure Fires
- 12835.3%Outside Fires
- 4813.2%Mobile Property/Vehicle Fires
- 195.2%Other
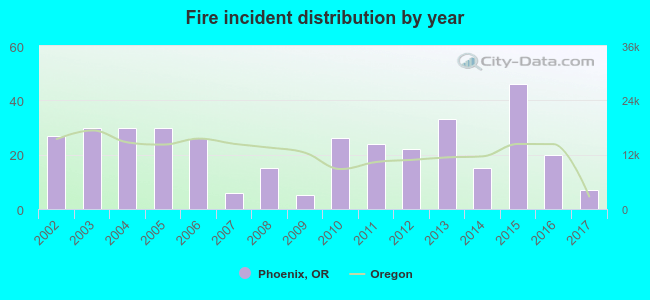 According to the data from the years 2002 - 2017 the average number of fires per year is 23. The highest number of reported fires - 46 took place in 2015, and the least - 5 in 2009. The data has a dropping trend.
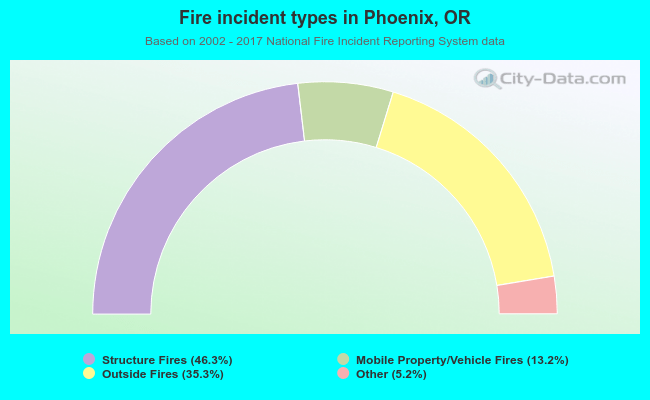 When looking into fire subcategories, the most incidents belonged to: Structure Fires (46.3%), and Outside Fires (35.3%).
| Most common first names in Phoenix, OR among deceased individuals | ||
| Name | Count | Lived (average) |
|---|---|---|
| Mary | 36 | 79.2 years |
| William | 27 | 76.9 years |
| James | 26 | 73.7 years |
| Robert | 24 | 74.9 years |
| John | 23 | 77.1 years |
| Charles | 17 | 75.4 years |
| Joseph | 14 | 81.4 years |
| Dorothy | 13 | 73.1 years |
| Donald | 12 | 79.2 years |
| Richard | 12 | 67.2 years |
| Most common last names in Phoenix, OR among deceased individuals | ||
| Last name | Count | Lived (average) |
|---|---|---|
| Smith | 21 | 79.3 years |
| Davis | 10 | 82.8 years |
| Martin | 9 | 81.4 years |
| Anderson | 8 | 80.5 years |
| Cook | 7 | 79.2 years |
| Brown | 6 | 82.0 years |
| Hamilton | 6 | 78.7 years |
| Jones | 6 | 78.7 years |
| Taylor | 6 | 73.0 years |
| Baker | 5 | 79.6 years |
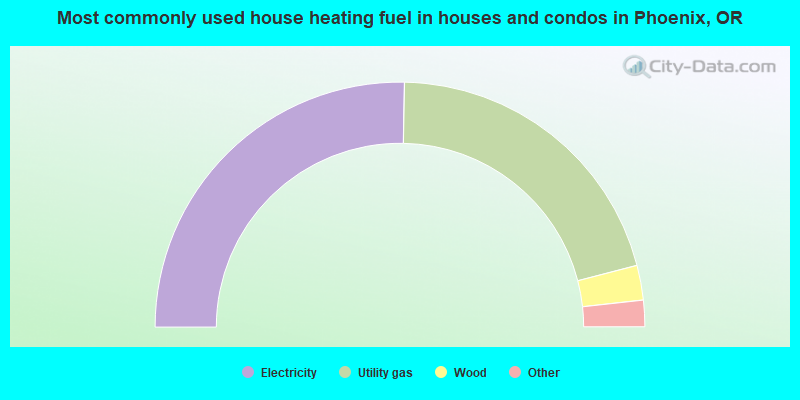
- 50.7%Electricity
- 41.4%Utility gas
- 4.6%Wood
- 1.9%Other fuel
- 1.5%Bottled, tank, or LP gas
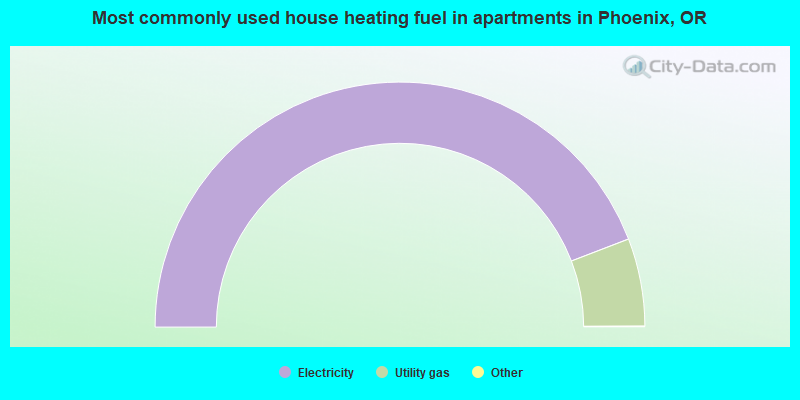
- 88.4%Electricity
- 11.6%Utility gas
Phoenix compared to Oregon state average:
- Median household income below state average.
- Median age above state average.
- Foreign-born population percentage below state average.
- Length of stay since moving in significantly above state average.
- Number of college students below state average.

|
Total of 4 patent applications in 2008-2024.