Pleasanton, California Submit your own pictures of this city and show them to the world
OSM Map
General Map
Google Map
MSN Map
OSM Map
General Map
Google Map
MSN Map
OSM Map
General Map
Google Map
MSN Map
OSM Map
General Map
Google Map
MSN Map
Please wait while loading the map...
Population in 2022: 76,689 (99% urban, 1% rural). Population change since 2000: +20.5%Males: 38,837 Females: 37,852
March 2022 cost of living index in Pleasanton: 124.9 (high, U.S. average is 100) Percentage of residents living in poverty in 2022: 5.7%for White Non-Hispanic residents , 13.1% for Black residents , 13.8% for Hispanic or Latino residents , 9.6% for American Indian residents , 14.9% for Native Hawaiian and other Pacific Islander residents , 25.4% for other race residents , 9.0% for two or more races residents )
Profiles of local businesses
Business Search - 14 Million verified businesses
Data:
Median household income ($)
Median household income (% change since 2000)
Household income diversity
Ratio of average income to average house value (%)
Ratio of average income to average rent
Median household income ($) - White
Median household income ($) - Black or African American
Median household income ($) - Asian
Median household income ($) - Hispanic or Latino
Median household income ($) - American Indian and Alaska Native
Median household income ($) - Multirace
Median household income ($) - Other Race
Median household income for houses/condos with a mortgage ($)
Median household income for apartments without a mortgage ($)
Races - White alone (%)
Races - White alone (% change since 2000)
Races - Black alone (%)
Races - Black alone (% change since 2000)
Races - American Indian alone (%)
Races - American Indian alone (% change since 2000)
Races - Asian alone (%)
Races - Asian alone (% change since 2000)
Races - Hispanic (%)
Races - Hispanic (% change since 2000)
Races - Native Hawaiian and Other Pacific Islander alone (%)
Races - Native Hawaiian and Other Pacific Islander alone (% change since 2000)
Races - Two or more races (%)
Races - Two or more races (% change since 2000)
Races - Other race alone (%)
Races - Other race alone (% change since 2000)
Racial diversity
Unemployment (%)
Unemployment (% change since 2000)
Unemployment (%) - White
Unemployment (%) - Black or African American
Unemployment (%) - Asian
Unemployment (%) - Hispanic or Latino
Unemployment (%) - American Indian and Alaska Native
Unemployment (%) - Multirace
Unemployment (%) - Other Race
Population density (people per square mile)
Population - Males (%)
Population - Females (%)
Population - Males (%) - White
Population - Males (%) - Black or African American
Population - Males (%) - Asian
Population - Males (%) - Hispanic or Latino
Population - Males (%) - American Indian and Alaska Native
Population - Males (%) - Multirace
Population - Males (%) - Other Race
Population - Females (%) - White
Population - Females (%) - Black or African American
Population - Females (%) - Asian
Population - Females (%) - Hispanic or Latino
Population - Females (%) - American Indian and Alaska Native
Population - Females (%) - Multirace
Population - Females (%) - Other Race
Coronavirus confirmed cases (Apr 24, 2024)
Deaths caused by coronavirus (Apr 24, 2024)
Coronavirus confirmed cases (per 100k population) (Apr 24, 2024)
Deaths caused by coronavirus (per 100k population) (Apr 24, 2024)
Daily increase in number of cases (Apr 24, 2024)
Weekly increase in number of cases (Apr 24, 2024)
Cases doubled (in days) (Apr 24, 2024)
Hospitalized patients (Apr 18, 2022)
Negative test results (Apr 18, 2022)
Total test results (Apr 18, 2022)
COVID Vaccine doses distributed (per 100k population) (Sep 19, 2023)
COVID Vaccine doses administered (per 100k population) (Sep 19, 2023)
COVID Vaccine doses distributed (Sep 19, 2023)
COVID Vaccine doses administered (Sep 19, 2023)
Likely homosexual households (%)
Likely homosexual households (% change since 2000)
Likely homosexual households - Lesbian couples (%)
Likely homosexual households - Lesbian couples (% change since 2000)
Likely homosexual households - Gay men (%)
Likely homosexual households - Gay men (% change since 2000)
Cost of living index
Median gross rent ($)
Median contract rent ($)
Median monthly housing costs ($)
Median house or condo value ($)
Median house or condo value ($ change since 2000)
Mean house or condo value by units in structure - 1, detached ($)
Mean house or condo value by units in structure - 1, attached ($)
Mean house or condo value by units in structure - 2 ($)
Mean house or condo value by units in structure by units in structure - 3 or 4 ($)
Mean house or condo value by units in structure - 5 or more ($)
Mean house or condo value by units in structure - Boat, RV, van, etc. ($)
Mean house or condo value by units in structure - Mobile home ($)
Median house or condo value ($) - White
Median house or condo value ($) - Black or African American
Median house or condo value ($) - Asian
Median house or condo value ($) - Hispanic or Latino
Median house or condo value ($) - American Indian and Alaska Native
Median house or condo value ($) - Multirace
Median house or condo value ($) - Other Race
Median resident age
Resident age diversity
Median resident age - Males
Median resident age - Females
Median resident age - White
Median resident age - Black or African American
Median resident age - Asian
Median resident age - Hispanic or Latino
Median resident age - American Indian and Alaska Native
Median resident age - Multirace
Median resident age - Other Race
Median resident age - Males - White
Median resident age - Males - Black or African American
Median resident age - Males - Asian
Median resident age - Males - Hispanic or Latino
Median resident age - Males - American Indian and Alaska Native
Median resident age - Males - Multirace
Median resident age - Males - Other Race
Median resident age - Females - White
Median resident age - Females - Black or African American
Median resident age - Females - Asian
Median resident age - Females - Hispanic or Latino
Median resident age - Females - American Indian and Alaska Native
Median resident age - Females - Multirace
Median resident age - Females - Other Race
Commute - mean travel time to work (minutes)
Travel time to work - Less than 5 minutes (%)
Travel time to work - Less than 5 minutes (% change since 2000)
Travel time to work - 5 to 9 minutes (%)
Travel time to work - 5 to 9 minutes (% change since 2000)
Travel time to work - 10 to 19 minutes (%)
Travel time to work - 10 to 19 minutes (% change since 2000)
Travel time to work - 20 to 29 minutes (%)
Travel time to work - 20 to 29 minutes (% change since 2000)
Travel time to work - 30 to 39 minutes (%)
Travel time to work - 30 to 39 minutes (% change since 2000)
Travel time to work - 40 to 59 minutes (%)
Travel time to work - 40 to 59 minutes (% change since 2000)
Travel time to work - 60 to 89 minutes (%)
Travel time to work - 60 to 89 minutes (% change since 2000)
Travel time to work - 90 or more minutes (%)
Travel time to work - 90 or more minutes (% change since 2000)
Marital status - Never married (%)
Marital status - Now married (%)
Marital status - Separated (%)
Marital status - Widowed (%)
Marital status - Divorced (%)
Median family income ($)
Median family income (% change since 2000)
Median non-family income ($)
Median non-family income (% change since 2000)
Median per capita income ($)
Median per capita income (% change since 2000)
Median family income ($) - White
Median family income ($) - Black or African American
Median family income ($) - Asian
Median family income ($) - Hispanic or Latino
Median family income ($) - American Indian and Alaska Native
Median family income ($) - Multirace
Median family income ($) - Other Race
Median year house/condo built
Median year apartment built
Year house built - Built 2005 or later (%)
Year house built - Built 2000 to 2004 (%)
Year house built - Built 1990 to 1999 (%)
Year house built - Built 1980 to 1989 (%)
Year house built - Built 1970 to 1979 (%)
Year house built - Built 1960 to 1969 (%)
Year house built - Built 1950 to 1959 (%)
Year house built - Built 1940 to 1949 (%)
Year house built - Built 1939 or earlier (%)
Average household size
Household density (households per square mile)
Average household size - White
Average household size - Black or African American
Average household size - Asian
Average household size - Hispanic or Latino
Average household size - American Indian and Alaska Native
Average household size - Multirace
Average household size - Other Race
Occupied housing units (%)
Vacant housing units (%)
Owner occupied housing units (%)
Renter occupied housing units (%)
Vacancy status - For rent (%)
Vacancy status - For sale only (%)
Vacancy status - Rented or sold, not occupied (%)
Vacancy status - For seasonal, recreational, or occasional use (%)
Vacancy status - For migrant workers (%)
Vacancy status - Other vacant (%)
Residents with income below the poverty level (%)
Residents with income below 50% of the poverty level (%)
Children below poverty level (%)
Poor families by family type - Married-couple family (%)
Poor families by family type - Male, no wife present (%)
Poor families by family type - Female, no husband present (%)
Poverty status for native-born residents (%)
Poverty status for foreign-born residents (%)
Poverty among high school graduates not in families (%)
Poverty among people who did not graduate high school not in families (%)
Residents with income below the poverty level (%) - White
Residents with income below the poverty level (%) - Black or African American
Residents with income below the poverty level (%) - Asian
Residents with income below the poverty level (%) - Hispanic or Latino
Residents with income below the poverty level (%) - American Indian and Alaska Native
Residents with income below the poverty level (%) - Multirace
Residents with income below the poverty level (%) - Other Race
Air pollution - Air Quality Index (AQI)
Air pollution - CO
Air pollution - NO2
Air pollution - SO2
Air pollution - Ozone
Air pollution - PM10
Air pollution - PM25
Air pollution - Pb
Crime - Murders per 100,000 population
Crime - Rapes per 100,000 population
Crime - Robberies per 100,000 population
Crime - Assaults per 100,000 population
Crime - Burglaries per 100,000 population
Crime - Thefts per 100,000 population
Crime - Auto thefts per 100,000 population
Crime - Arson per 100,000 population
Crime - City-data.com crime index
Crime - Violent crime index
Crime - Property crime index
Crime - Murders per 100,000 population (5 year average)
Crime - Rapes per 100,000 population (5 year average)
Crime - Robberies per 100,000 population (5 year average)
Crime - Assaults per 100,000 population (5 year average)
Crime - Burglaries per 100,000 population (5 year average)
Crime - Thefts per 100,000 population (5 year average)
Crime - Auto thefts per 100,000 population (5 year average)
Crime - Arson per 100,000 population (5 year average)
Crime - City-data.com crime index (5 year average)
Crime - Violent crime index (5 year average)
Crime - Property crime index (5 year average)
1996 Presidential Elections Results (%) - Democratic Party (Clinton)
1996 Presidential Elections Results (%) - Republican Party (Dole)
1996 Presidential Elections Results (%) - Other
2000 Presidential Elections Results (%) - Democratic Party (Gore)
2000 Presidential Elections Results (%) - Republican Party (Bush)
2000 Presidential Elections Results (%) - Other
2004 Presidential Elections Results (%) - Democratic Party (Kerry)
2004 Presidential Elections Results (%) - Republican Party (Bush)
2004 Presidential Elections Results (%) - Other
2008 Presidential Elections Results (%) - Democratic Party (Obama)
2008 Presidential Elections Results (%) - Republican Party (McCain)
2008 Presidential Elections Results (%) - Other
2012 Presidential Elections Results (%) - Democratic Party (Obama)
2012 Presidential Elections Results (%) - Republican Party (Romney)
2012 Presidential Elections Results (%) - Other
2016 Presidential Elections Results (%) - Democratic Party (Clinton)
2016 Presidential Elections Results (%) - Republican Party (Trump)
2016 Presidential Elections Results (%) - Other
2020 Presidential Elections Results (%) - Democratic Party (Biden)
2020 Presidential Elections Results (%) - Republican Party (Trump)
2020 Presidential Elections Results (%) - Other
Ancestries Reported - Arab (%)
Ancestries Reported - Czech (%)
Ancestries Reported - Danish (%)
Ancestries Reported - Dutch (%)
Ancestries Reported - English (%)
Ancestries Reported - French (%)
Ancestries Reported - French Canadian (%)
Ancestries Reported - German (%)
Ancestries Reported - Greek (%)
Ancestries Reported - Hungarian (%)
Ancestries Reported - Irish (%)
Ancestries Reported - Italian (%)
Ancestries Reported - Lithuanian (%)
Ancestries Reported - Norwegian (%)
Ancestries Reported - Polish (%)
Ancestries Reported - Portuguese (%)
Ancestries Reported - Russian (%)
Ancestries Reported - Scotch-Irish (%)
Ancestries Reported - Scottish (%)
Ancestries Reported - Slovak (%)
Ancestries Reported - Subsaharan African (%)
Ancestries Reported - Swedish (%)
Ancestries Reported - Swiss (%)
Ancestries Reported - Ukrainian (%)
Ancestries Reported - United States (%)
Ancestries Reported - Welsh (%)
Ancestries Reported - West Indian (%)
Ancestries Reported - Other (%)
Educational Attainment - No schooling completed (%)
Educational Attainment - Less than high school (%)
Educational Attainment - High school or equivalent (%)
Educational Attainment - Less than 1 year of college (%)
Educational Attainment - 1 or more years of college (%)
Educational Attainment - Associate degree (%)
Educational Attainment - Bachelor's degree (%)
Educational Attainment - Master's degree (%)
Educational Attainment - Professional school degree (%)
Educational Attainment - Doctorate degree (%)
School Enrollment - Nursery, preschool (%)
School Enrollment - Kindergarten (%)
School Enrollment - Grade 1 to 4 (%)
School Enrollment - Grade 5 to 8 (%)
School Enrollment - Grade 9 to 12 (%)
School Enrollment - College undergrad (%)
School Enrollment - Graduate or professional (%)
School Enrollment - Not enrolled in school (%)
School enrollment - Public schools (%)
School enrollment - Private schools (%)
School enrollment - Not enrolled (%)
Median number of rooms in houses and condos
Median number of rooms in apartments
Housing units lacking complete plumbing facilities (%)
Housing units lacking complete kitchen facilities (%)
Density of houses
Urban houses (%)
Rural houses (%)
Households with people 60 years and over (%)
Households with people 65 years and over (%)
Households with people 75 years and over (%)
Households with one or more nonrelatives (%)
Households with no nonrelatives (%)
Population in households (%)
Family households (%)
Nonfamily households (%)
Population in families (%)
Family households with own children (%)
Median number of bedrooms in owner occupied houses
Mean number of bedrooms in owner occupied houses
Median number of bedrooms in renter occupied houses
Mean number of bedrooms in renter occupied houses
Median number of vehichles in owner occupied houses
Mean number of vehichles in owner occupied houses
Median number of vehichles in renter occupied houses
Mean number of vehichles in renter occupied houses
Mortgage status - with mortgage (%)
Mortgage status - with second mortgage (%)
Mortgage status - with home equity loan (%)
Mortgage status - with both second mortgage and home equity loan (%)
Mortgage status - without a mortgage (%)
Average family size
Average family size - White
Average family size - Black or African American
Average family size - Asian
Average family size - Hispanic or Latino
Average family size - American Indian and Alaska Native
Average family size - Multirace
Average family size - Other Race
Geographical mobility - Same house 1 year ago (%)
Geographical mobility - Moved within same county (%)
Geographical mobility - Moved from different county within same state (%)
Geographical mobility - Moved from different state (%)
Geographical mobility - Moved from abroad (%)
Place of birth - Born in state of residence (%)
Place of birth - Born in other state (%)
Place of birth - Native, outside of US (%)
Place of birth - Foreign born (%)
Housing units in structures - 1, detached (%)
Housing units in structures - 1, attached (%)
Housing units in structures - 2 (%)
Housing units in structures - 3 or 4 (%)
Housing units in structures - 5 to 9 (%)
Housing units in structures - 10 to 19 (%)
Housing units in structures - 20 to 49 (%)
Housing units in structures - 50 or more (%)
Housing units in structures - Mobile home (%)
Housing units in structures - Boat, RV, van, etc. (%)
House/condo owner moved in on average (years ago)
Renter moved in on average (years ago)
Year householder moved into unit - Moved in 1999 to March 2000 (%)
Year householder moved into unit - Moved in 1995 to 1998 (%)
Year householder moved into unit - Moved in 1990 to 1994 (%)
Year householder moved into unit - Moved in 1980 to 1989 (%)
Year householder moved into unit - Moved in 1970 to 1979 (%)
Year householder moved into unit - Moved in 1969 or earlier (%)
Means of transportation to work - Drove car alone (%)
Means of transportation to work - Carpooled (%)
Means of transportation to work - Public transportation (%)
Means of transportation to work - Bus or trolley bus (%)
Means of transportation to work - Streetcar or trolley car (%)
Means of transportation to work - Subway or elevated (%)
Means of transportation to work - Railroad (%)
Means of transportation to work - Ferryboat (%)
Means of transportation to work - Taxicab (%)
Means of transportation to work - Motorcycle (%)
Means of transportation to work - Bicycle (%)
Means of transportation to work - Walked (%)
Means of transportation to work - Other means (%)
Working at home (%)
Industry diversity
Most Common Industries - Agriculture, forestry, fishing and hunting, and mining (%)
Most Common Industries - Agriculture, forestry, fishing and hunting (%)
Most Common Industries - Mining, quarrying, and oil and gas extraction (%)
Most Common Industries - Construction (%)
Most Common Industries - Manufacturing (%)
Most Common Industries - Wholesale trade (%)
Most Common Industries - Retail trade (%)
Most Common Industries - Transportation and warehousing, and utilities (%)
Most Common Industries - Transportation and warehousing (%)
Most Common Industries - Utilities (%)
Most Common Industries - Information (%)
Most Common Industries - Finance and insurance, and real estate and rental and leasing (%)
Most Common Industries - Finance and insurance (%)
Most Common Industries - Real estate and rental and leasing (%)
Most Common Industries - Professional, scientific, and management, and administrative and waste management services (%)
Most Common Industries - Professional, scientific, and technical services (%)
Most Common Industries - Management of companies and enterprises (%)
Most Common Industries - Administrative and support and waste management services (%)
Most Common Industries - Educational services, and health care and social assistance (%)
Most Common Industries - Educational services (%)
Most Common Industries - Health care and social assistance (%)
Most Common Industries - Arts, entertainment, and recreation, and accommodation and food services (%)
Most Common Industries - Arts, entertainment, and recreation (%)
Most Common Industries - Accommodation and food services (%)
Most Common Industries - Other services, except public administration (%)
Most Common Industries - Public administration (%)
Occupation diversity
Most Common Occupations - Management, business, science, and arts occupations (%)
Most Common Occupations - Management, business, and financial occupations (%)
Most Common Occupations - Management occupations (%)
Most Common Occupations - Business and financial operations occupations (%)
Most Common Occupations - Computer, engineering, and science occupations (%)
Most Common Occupations - Computer and mathematical occupations (%)
Most Common Occupations - Architecture and engineering occupations (%)
Most Common Occupations - Life, physical, and social science occupations (%)
Most Common Occupations - Education, legal, community service, arts, and media occupations (%)
Most Common Occupations - Community and social service occupations (%)
Most Common Occupations - Legal occupations (%)
Most Common Occupations - Education, training, and library occupations (%)
Most Common Occupations - Arts, design, entertainment, sports, and media occupations (%)
Most Common Occupations - Healthcare practitioners and technical occupations (%)
Most Common Occupations - Health diagnosing and treating practitioners and other technical occupations (%)
Most Common Occupations - Health technologists and technicians (%)
Most Common Occupations - Service occupations (%)
Most Common Occupations - Healthcare support occupations (%)
Most Common Occupations - Protective service occupations (%)
Most Common Occupations - Fire fighting and prevention, and other protective service workers including supervisors (%)
Most Common Occupations - Law enforcement workers including supervisors (%)
Most Common Occupations - Food preparation and serving related occupations (%)
Most Common Occupations - Building and grounds cleaning and maintenance occupations (%)
Most Common Occupations - Personal care and service occupations (%)
Most Common Occupations - Sales and office occupations (%)
Most Common Occupations - Sales and related occupations (%)
Most Common Occupations - Office and administrative support occupations (%)
Most Common Occupations - Natural resources, construction, and maintenance occupations (%)
Most Common Occupations - Farming, fishing, and forestry occupations (%)
Most Common Occupations - Construction and extraction occupations (%)
Most Common Occupations - Installation, maintenance, and repair occupations (%)
Most Common Occupations - Production, transportation, and material moving occupations (%)
Most Common Occupations - Production occupations (%)
Most Common Occupations - Transportation occupations (%)
Most Common Occupations - Material moving occupations (%)
People in Group quarters - Institutionalized population (%)
People in Group quarters - Correctional institutions (%)
People in Group quarters - Federal prisons and detention centers (%)
People in Group quarters - Halfway houses (%)
People in Group quarters - Local jails and other confinement facilities (including police lockups) (%)
People in Group quarters - Military disciplinary barracks (%)
People in Group quarters - State prisons (%)
People in Group quarters - Other types of correctional institutions (%)
People in Group quarters - Nursing homes (%)
People in Group quarters - Hospitals/wards, hospices, and schools for the handicapped (%)
People in Group quarters - Hospitals/wards and hospices for chronically ill (%)
People in Group quarters - Hospices or homes for chronically ill (%)
People in Group quarters - Military hospitals or wards for chronically ill (%)
People in Group quarters - Other hospitals or wards for chronically ill (%)
People in Group quarters - Hospitals or wards for drug/alcohol abuse (%)
People in Group quarters - Mental (Psychiatric) hospitals or wards (%)
People in Group quarters - Schools, hospitals, or wards for the mentally retarded (%)
People in Group quarters - Schools, hospitals, or wards for the physically handicapped (%)
People in Group quarters - Institutions for the deaf (%)
People in Group quarters - Institutions for the blind (%)
People in Group quarters - Orthopedic wards and institutions for the physically handicapped (%)
People in Group quarters - Wards in general hospitals for patients who have no usual home elsewhere (%)
People in Group quarters - Wards in military hospitals for patients who have no usual home elsewhere (%)
People in Group quarters - Juvenile institutions (%)
People in Group quarters - Long-term care (%)
People in Group quarters - Homes for abused, dependent, and neglected children (%)
People in Group quarters - Residential treatment centers for emotionally disturbed children (%)
People in Group quarters - Training schools for juvenile delinquents (%)
People in Group quarters - Short-term care, detention or diagnostic centers for delinquent children (%)
People in Group quarters - Type of juvenile institution unknown (%)
People in Group quarters - Noninstitutionalized population (%)
People in Group quarters - College dormitories (includes college quarters off campus) (%)
People in Group quarters - Military quarters (%)
People in Group quarters - On base (%)
People in Group quarters - Barracks, unaccompanied personnel housing (UPH), (Enlisted/Officer), ;and similar group living quarters for military personnel (%)
People in Group quarters - Transient quarters for temporary residents (%)
People in Group quarters - Military ships (%)
People in Group quarters - Group homes (%)
People in Group quarters - Homes or halfway houses for drug/alcohol abuse (%)
People in Group quarters - Homes for the mentally ill (%)
People in Group quarters - Homes for the mentally retarded (%)
People in Group quarters - Homes for the physically handicapped (%)
People in Group quarters - Other group homes (%)
People in Group quarters - Religious group quarters (%)
People in Group quarters - Dormitories (%)
People in Group quarters - Agriculture workers' dormitories on farms (%)
People in Group quarters - Job Corps and vocational training facilities (%)
People in Group quarters - Other workers' dormitories (%)
People in Group quarters - Crews of maritime vessels (%)
People in Group quarters - Other nonhousehold living situations (%)
People in Group quarters - Other noninstitutional group quarters (%)
Residents speaking English at home (%)
Residents speaking English at home - Born in the United States (%)
Residents speaking English at home - Native, born elsewhere (%)
Residents speaking English at home - Foreign born (%)
Residents speaking Spanish at home (%)
Residents speaking Spanish at home - Born in the United States (%)
Residents speaking Spanish at home - Native, born elsewhere (%)
Residents speaking Spanish at home - Foreign born (%)
Residents speaking other language at home (%)
Residents speaking other language at home - Born in the United States (%)
Residents speaking other language at home - Native, born elsewhere (%)
Residents speaking other language at home - Foreign born (%)
Class of Workers - Employee of private company (%)
Class of Workers - Self-employed in own incorporated business (%)
Class of Workers - Private not-for-profit wage and salary workers (%)
Class of Workers - Local government workers (%)
Class of Workers - State government workers (%)
Class of Workers - Federal government workers (%)
Class of Workers - Self-employed workers in own not incorporated business and Unpaid family workers (%)
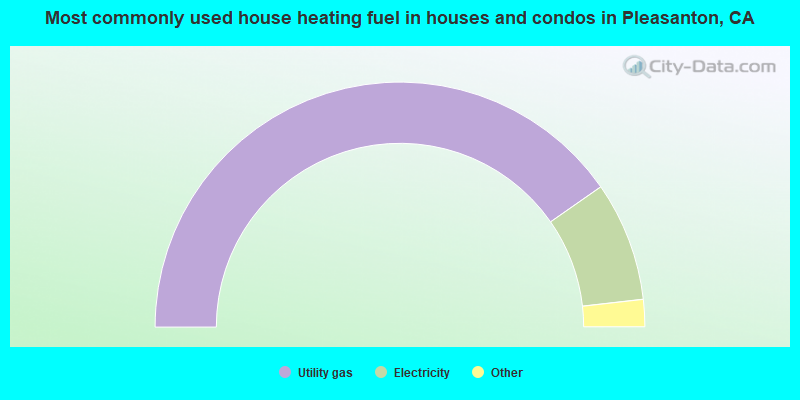
House heating fuel used in houses and condos - Utility gas (%)
House heating fuel used in houses and condos - Bottled, tank, or LP gas (%)
House heating fuel used in houses and condos - Electricity (%)
House heating fuel used in houses and condos - Fuel oil, kerosene, etc. (%)
House heating fuel used in houses and condos - Coal or coke (%)
House heating fuel used in houses and condos - Wood (%)
House heating fuel used in houses and condos - Solar energy (%)
House heating fuel used in houses and condos - Other fuel (%)
House heating fuel used in houses and condos - No fuel used (%)
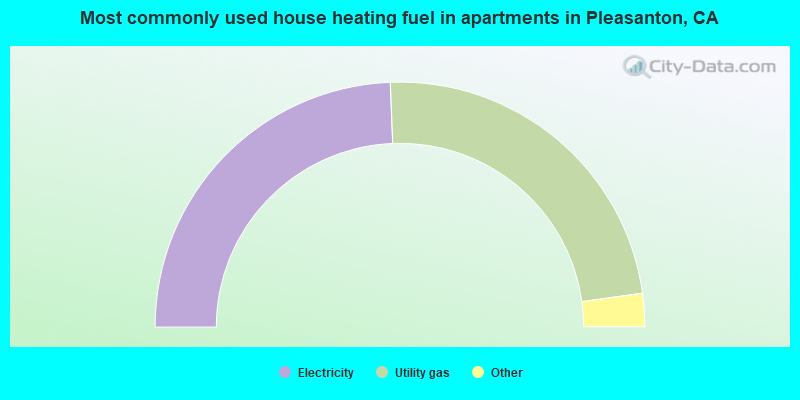
House heating fuel used in apartments - Utility gas (%)
House heating fuel used in apartments - Bottled, tank, or LP gas (%)
House heating fuel used in apartments - Electricity (%)
House heating fuel used in apartments - Fuel oil, kerosene, etc. (%)
House heating fuel used in apartments - Coal or coke (%)
House heating fuel used in apartments - Wood (%)
House heating fuel used in apartments - Solar energy (%)
House heating fuel used in apartments - Other fuel (%)
House heating fuel used in apartments - No fuel used (%)
Armed forces status - In Armed Forces (%)
Armed forces status - Civilian (%)
Armed forces status - Civilian - Veteran (%)
Armed forces status - Civilian - Nonveteran (%)
Fatal accidents locations in years 2005-2021
Fatal accidents locations in 2005
Fatal accidents locations in 2006
Fatal accidents locations in 2007
Fatal accidents locations in 2008
Fatal accidents locations in 2009
Fatal accidents locations in 2010
Fatal accidents locations in 2011
Fatal accidents locations in 2012
Fatal accidents locations in 2013
Fatal accidents locations in 2014
Fatal accidents locations in 2015
Fatal accidents locations in 2016
Fatal accidents locations in 2017
Fatal accidents locations in 2018
Fatal accidents locations in 2019
Fatal accidents locations in 2020
Fatal accidents locations in 2021
Alcohol use - People drinking some alcohol every month (%)
Alcohol use - People not drinking at all (%)
Alcohol use - Average days/month drinking alcohol
Alcohol use - Average drinks/week
Alcohol use - Average days/year people drink much
Audiometry - Average condition of hearing (%)
Audiometry - People that can hear a whisper from across a quiet room (%)
Audiometry - People that can hear normal voice from across a quiet room (%)
Audiometry - Ears ringing, roaring, buzzing (%)
Audiometry - Had a job exposure to loud noise (%)
Audiometry - Had off-work exposure to loud noise (%)
Blood Pressure & Cholesterol - Has high blood pressure (%)
Blood Pressure & Cholesterol - Checking blood pressure at home (%)
Blood Pressure & Cholesterol - Frequently checking blood cholesterol (%)
Blood Pressure & Cholesterol - Has high cholesterol level (%)
Consumer Behavior - Money monthly spent on food at supermarket/grocery store
Consumer Behavior - Money monthly spent on food at other stores
Consumer Behavior - Money monthly spent on eating out
Consumer Behavior - Money monthly spent on carryout/delivered foods
Consumer Behavior - Income spent on food at supermarket/grocery store (%)
Consumer Behavior - Income spent on food at other stores (%)
Consumer Behavior - Income spent on eating out (%)
Consumer Behavior - Income spent on carryout/delivered foods (%)
Current Health Status - General health condition (%)
Current Health Status - Blood donors (%)
Current Health Status - Has blood ever tested for HIV virus (%)
Current Health Status - Left-handed people (%)
Dermatology - People using sunscreen (%)
Diabetes - Diabetics (%)
Diabetes - Had a blood test for high blood sugar (%)
Diabetes - People taking insulin (%)
Diet Behavior & Nutrition - Diet health (%)
Diet Behavior & Nutrition - Milk product consumption (# of products/month)
Diet Behavior & Nutrition - Meals not home prepared (#/week)
Diet Behavior & Nutrition - Meals from fast food or pizza place (#/week)
Diet Behavior & Nutrition - Ready-to-eat foods (#/month)
Diet Behavior & Nutrition - Frozen meals/pizza (#/month)
Drug Use - People that ever used marijuana or hashish (%)
Drug Use - Ever used hard drugs (%)
Drug Use - Ever used any form of cocaine (%)
Drug Use - Ever used heroin (%)
Drug Use - Ever used methamphetamine (%)
Health Insurance - People covered by health insurance (%)
Kidney Conditions-Urology - Avg. # of times urinating at night
Medical Conditions - People with asthma (%)
Medical Conditions - People with anemia (%)
Medical Conditions - People with psoriasis (%)
Medical Conditions - People with overweight (%)
Medical Conditions - Elderly people having difficulties in thinking or remembering (%)
Medical Conditions - People who ever received blood transfusion (%)
Medical Conditions - People having trouble seeing even with glass/contacts (%)
Medical Conditions - People with arthritis (%)
Medical Conditions - People with gout (%)
Medical Conditions - People with congestive heart failure (%)
Medical Conditions - People with coronary heart disease (%)
Medical Conditions - People with angina pectoris (%)
Medical Conditions - People who ever had heart attack (%)
Medical Conditions - People who ever had stroke (%)
Medical Conditions - People with emphysema (%)
Medical Conditions - People with thyroid problem (%)
Medical Conditions - People with chronic bronchitis (%)
Medical Conditions - People with any liver condition (%)
Medical Conditions - People who ever had cancer or malignancy (%)
Mental Health - People who have little interest in doing things (%)
Mental Health - People feeling down, depressed, or hopeless (%)
Mental Health - People who have trouble sleeping or sleeping too much (%)
Mental Health - People feeling tired or having little energy (%)
Mental Health - People with poor appetite or overeating (%)
Mental Health - People feeling bad about themself (%)
Mental Health - People who have trouble concentrating on things (%)
Mental Health - People moving or speaking slowly or too fast (%)
Mental Health - People having thoughts they would be better off dead (%)
Oral Health - Average years since last visit a dentist
Oral Health - People embarrassed because of mouth (%)
Oral Health - People with gum disease (%)
Oral Health - General health of teeth and gums (%)
Oral Health - Average days a week using dental floss/device
Oral Health - Average days a week using mouthwash for dental problem
Oral Health - Average number of teeth
Pesticide Use - Households using pesticides to control insects (%)
Pesticide Use - Households using pesticides to kill weeds (%)
Physical Activity - People doing vigorous-intensity work activities (%)
Physical Activity - People doing moderate-intensity work activities (%)
Physical Activity - People walking or bicycling (%)
Physical Activity - People doing vigorous-intensity recreational activities (%)
Physical Activity - People doing moderate-intensity recreational activities (%)
Physical Activity - Average hours a day doing sedentary activities
Physical Activity - Average hours a day watching TV or videos
Physical Activity - Average hours a day using computer
Physical Functioning - People having limitations keeping them from working (%)
Physical Functioning - People limited in amount of work they can do (%)
Physical Functioning - People that need special equipment to walk (%)
Physical Functioning - People experiencing confusion/memory problems (%)
Physical Functioning - People requiring special healthcare equipment (%)
Prescription Medications - Average number of prescription medicines taking
Preventive Aspirin Use - Adults 40+ taking low-dose aspirin (%)
Reproductive Health - Vaginal deliveries (%)
Reproductive Health - Cesarean deliveries (%)
Reproductive Health - Deliveries resulted in a live birth (%)
Reproductive Health - Pregnancies resulted in a delivery (%)
Reproductive Health - Women breastfeeding newborns (%)
Reproductive Health - Women that had a hysterectomy (%)
Reproductive Health - Women that had both ovaries removed (%)
Reproductive Health - Women that have ever taken birth control pills (%)
Reproductive Health - Women taking birth control pills (%)
Reproductive Health - Women that have ever used Depo-Provera or injectables (%)
Reproductive Health - Women that have ever used female hormones (%)
Sexual Behavior - People 18+ that ever had sex (vaginal, anal, or oral) (%)
Sexual Behavior - Males 18+ that ever had vaginal sex with a woman (%)
Sexual Behavior - Males 18+ that ever performed oral sex on a woman (%)
Sexual Behavior - Males 18+ that ever had anal sex with a woman (%)
Sexual Behavior - Males 18+ that ever had any sex with a man (%)
Sexual Behavior - Females 18+ that ever had vaginal sex with a man (%)
Sexual Behavior - Females 18+ that ever performed oral sex on a man (%)
Sexual Behavior - Females 18+ that ever had anal sex with a man (%)
Sexual Behavior - Females 18+ that ever had any kind of sex with a woman (%)
Sexual Behavior - Average age people first had sex
Sexual Behavior - Average number of female sex partners in lifetime (males 18+)
Sexual Behavior - Average number of female vaginal sex partners in lifetime (males 18+)
Sexual Behavior - Average age people first performed oral sex on a woman (18+)
Sexual Behavior - Average number of woman performed oral sex on in lifetime (18+)
Sexual Behavior - Average number of male sex partners in lifetime (males 18+)
Sexual Behavior - Average number of male anal sex partners in lifetime (males 18+)
Sexual Behavior - Average age people first performed oral sex on a man (18+)
Sexual Behavior - Average number of male oral sex partners in lifetime (18+)
Sexual Behavior - People using protection when performing oral sex (%)
Sexual Behavior - Average number of times people have vaginal or anal sex a year
Sexual Behavior - People having sex without condom (%)
Sexual Behavior - Average number of male sex partners in lifetime (females 18+)
Sexual Behavior - Average number of male vaginal sex partners in lifetime (females 18+)
Sexual Behavior - Average number of female sex partners in lifetime (females 18+)
Sexual Behavior - Circumcised males 18+ (%)
Sleep Disorders - Average hours sleeping at night
Sleep Disorders - People that has trouble sleeping (%)
Smoking-Cigarette Use - People smoking cigarettes (%)
Taste & Smell - People 40+ having problems with smell (%)
Taste & Smell - People 40+ having problems with taste (%)
Taste & Smell - People 40+ that ever had wisdom teeth removed (%)
Taste & Smell - People 40+ that ever had tonsils teeth removed (%)
Taste & Smell - People 40+ that ever had a loss of consciousness because of a head injury (%)
Taste & Smell - People 40+ that ever had a broken nose or other serious injury to face or skull (%)
Taste & Smell - People 40+ that ever had two or more sinus infections (%)
Weight - Average height (inches)
Weight - Average weight (pounds)
Weight - Average BMI
Weight - People that are obese (%)
Weight - People that ever were obese (%)
Weight - People trying to lose weight (%)
34,228 44.6% Asian alone 30,821 40.2% White alone 6,205 8.1% Hispanic 3,399 4.4% Two or more races 1,715 2.2% Black alone 282 0.4% Other race alone 39 0.05% Native Hawaiian and Other
According to our research of California and other state lists, there were 24 registered sex offenders living in Pleasanton, California as of April 24, 2024 . The ratio of all residents to sex offenders in Pleasanton is 3,295 to 1.The ratio of registered sex offenders to all residents in this city is lower than the state average.
Officers per 1,000 residents here:
0.96California average:
2.30
Latest news from Pleasanton, CA collected exclusively by city-data.com from local newspapers, TV, and radio stations
Ancestries: English (3.5%), German (3.2%), European (3.1%), American (2.8%), Irish (2.8%), Italian (2.6%).
Current Local Time:
Land area: 21.7 square miles.
Population density: 3,540 people per square mile (average).
27,831 residents are foreign born (28.1% Asia ).
This city:
36.1%California:
26.5%
Median real estate property taxes paid for housing units with mortgages in 2022: $10,001 (0.6%)Median real estate property taxes paid for housing units with no mortgage in 2022: $8,112 (0.5%)
Nearest city with pop. 200,000+: Fremont, CA
Nearest city with pop. 1,000,000+: Los Angeles, CA
Nearest cities:
Latitude: 37.67 N, Longitude: 121.88 W
Daytime population change due to commuting: +19,800 (+25.8%)Workers who live and work in this city: 19,427 (49.6%)
Pleasanton tourist attractions:
Single-family new house construction building permits:
2022: 63 buildings , average cost: $534,1002021: 77 buildings , average cost: $533,7002020: 72 buildings , average cost: $534,8002019: 71 buildings , average cost: $531,0002018: 42 buildings , average cost: $556,2002017: 48 buildings , average cost: $630,9002016: 72 buildings , average cost: $646,3002015: 94 buildings , average cost: $543,0002014: 78 buildings , average cost: $494,2002013: 180 buildings , average cost: $485,3002012: 89 buildings , average cost: $418,3002011: 41 buildings , average cost: $354,5002010: 42 buildings , average cost: $338,0002009: 14 buildings , average cost: $394,5002008: 32 buildings , average cost: $531,6002007: 47 buildings , average cost: $611,3002006: 136 buildings , average cost: $497,6002005: 210 buildings , average cost: $436,7002004: 237 buildings , average cost: $472,9002003: 253 buildings , average cost: $344,5002002: 259 buildings , average cost: $306,3002001: 189 buildings , average cost: $390,9002000: 368 buildings , average cost: $452,8001999: 227 buildings , average cost: $412,7001998: 389 buildings , average cost: $297,9001997: 702 buildings , average cost: $194,500Unemployment in December 2023:
Population change in the 1990s: +12,381 (+24.1%).
Most common occupations in Pleasanton, CA (%)
Both Males Females
Other management occupations, except farmers and farm managers (7.7%)
Computer specialists (7.1%)
Other sales and related occupations, including supervisors (5.6%)
Top executives (4.8%)
Sales representatives, services, wholesale and manufacturing (4.6%)
Other office and administrative support workers, including supervisors (4.4%)
Engineers (3.7%)
Other management occupations, except farmers and farm managers (9.1%)
Computer specialists (8.8%)
Top executives (7.2%)
Other sales and related occupations, including supervisors (6.3%)
Engineers (5.9%)
Sales representatives, services, wholesale and manufacturing (5.7%)
Operations specialties managers, except financial managers (3.7%)
Other office and administrative support workers, including supervisors (7.8%)
Other management occupations, except farmers and farm managers (5.9%)
Preschool, kindergarten, elementary, and middle school teachers (5.9%)
Secretaries and administrative assistants (5.7%)
Computer specialists (4.9%)
Other sales and related occupations, including supervisors (4.6%)
Retail sales workers, except cashiers (4.0%)
Earthquake activity:
Pleasanton-area historical earthquake activity is significantly above California state average. It is 7757% greater than the overall U.S. average. On 4/18/1906 at 13:12:21, a magnitude 7.9 (7.9 UK, Class: Major, Intensity: VIII - XII) earthquake occurred 65.1 miles away from the city center, causing $524,000,000 total damage On 10/18/1989 at 00:04:15, a magnitude 7.1 (6.5 MB, 7.1 MS, 6.9 MW, 7.0 ML) earthquake occurred 39.4 miles away from the city center, causing 62 deaths ( 62 shaking deaths) and 3757 injuries, causing $1,305,032,704 total damage On 11/4/1927 at 13:51:53, a magnitude 7.5 (7.5 UK) earthquake occurred 196.5 miles away from the city center On 7/21/1952 at 11:52:14, a magnitude 7.7 (7.7 UK) earthquake occurred 244.8 miles away from Pleasanton center, causing $50,000,000 total damage On 1/31/1922 at 13:17:28, a magnitude 7.6 (7.6 UK) earthquake occurred 287.3 miles away from the city center On 12/21/1932 at 06:10:09, a magnitude 7.2 (7.2 UK) earthquake occurred 214.7 miles away from the city center Magnitude types: body-wave magnitude (MB), local magnitude (ML), surface-wave magnitude (MS), moment magnitude (MW) Natural disasters: The number of natural disasters in Alameda County (20) is greater than the US average (15).Major Disasters (Presidential) Declared: 14Emergencies Declared: 2Floods: 13, Storms: 7, Mudslides: 6, Winter Storms: 6, Landslides: 4, Fires: 2, Drought: 1, Earthquake: 1, Freeze: 1, Hurricane: 1, Tornado: 1, Other: 1 (Note: some incidents may be assigned to more than one category). Main business address for: POLYCOM INC TELEPHONE & TELEGRAPH APPARATUS ), BRIGHTSTAR INFORMATION TECHNOLOGY GROUP INC SERVICES-COMPUTER INTEGRATED SYSTEMS DESIGN ), PEOPLESOFT INC SERVICES-PREPACKAGED SOFTWARE ), SAFEWAY INC RETAIL-GROCERY STORES ), LIPID SCIENCES INC/ BIOLOGICAL PRODUCTS (NO DIAGNOSTIC SUBSTANCES) ), THORATEC CORP ELECTROMEDICAL & ELECTROTHERAPEUTIC APPARATUS ), COOPER COMPANIES INC OPHTHALMIC GOODS ), ROSS STORES INC RETAIL-FAMILY CLOTHING STORES ) and 1 other public companies .
Hospitals and medical centers in Pleasanton: VALLEY SURGICAL CENTER (5720 STONERIDGE MALL RD, STE 300) VALLEYCARE MEDICAL CENTER (Voluntary non-profit - Private, 5555 WEST LAS POSITAS BOULEVARD) PLEASANTON NURSING AND REHABILITATION CENTER (300 NEAL STREET)
PLEASANTON DIALYSIS CENTER (5720 STONERIDGE MALL ROAD #160)
LIFEGUARD HOME HEALTH (5976 W LAS POSITAS BLVD SUITE 106)
SUNSHINE HOME HEALTH CARE, INC (4637 CHABOT DRIVE #240)
Heliports located in Pleasanton: Amtrak station: EAST DUBLIN-PLEASANTON (OWENS DR. AT BART WAY) - Bus Station
College/University in Pleasanton: Golden State College of Court Reporting Full-time enrollment: 69; Location: 7901 Stoneridge Drive, Suite 105; Private, for-profit; Website: goldenstatecourtreporting.com/)
Colleges/universities with over 2000 students nearest to Pleasanton:
Las Positas College (about 5 miles; Livermore, CA ; Full-time enrollment: 5,112)
California State University-East Bay (about 10 miles; Hayward, CA ; FT enrollment: 12,956)
Ohlone College (about 11 miles; Fremont, CA ; FT enrollment: 6,153)
Chabot College (about 13 miles; Hayward, CA ; FT enrollment: 7,610)
Wyotech-Fremont (about 15 miles; Fremont, CA ; FT enrollment: 2,383)
Saint Mary's College of California (about 17 miles; Moraga, CA ; FT enrollment: 4,200)
Merritt College (about 18 miles; Oakland, CA ; FT enrollment: 2,842)
Public high schools in Pleasanton: AMADOR VALLEY HIGH Students: 1,857, Location: 1155 SANTA RITA RD., Grades: 9-12)VILLAGE HIGH Students: 50, Location: 4645 BERNAL AVE., Grades: 9-12)FOOTHILL HIGH Location: 4375 FOOTHILL RD., Grades: 9-12)
Private high schools in Pleasanton: THE QUARRY LANE SCHOOL Students: 754, Location: 6363 TASSAJARA RD, Grades: PK-12)
LIGHTHOUSE BAPTIST SCHOOL Students: 32, Location: 6900 VALLEY TRAILS DR, Grades: KG-12)
Biggest public elementary/middle schools in Pleasanton: PLEASANTON MIDDLE Students: 1,228, Location: 5001 CASE AVE., Grades: 6-8)THOMAS S. HART MIDDLE Students: 1,135, Location: 4433 WILLOW RD., Grades: 6-8)HARVEST PARK MIDDLE Students: 1,135, Location: 4900 VALLEY AVE., Grades: 6-8)WALNUT GROVE ELEMENTARY Students: 485, Location: 1999 HARVEST RD., Grades: KG-5)PHOEBE APPERSON HEARST ELEMENTARY Students: 465, Location: 5301 CASE AVE., Grades: KG-5)FAIRLANDS ELEMENTARY Students: 465, Location: 4151 W. LAS POSITAS BLVD., Grades: KG-5)VALLEY VIEW ELEMENTARY Students: 463, Location: 480 ADAMS WAY, Grades: KG-5)DONLON ELEMENTARY Students: 443, Location: 4150 DORMAN RD., Grades: KG-5)VINTAGE HILLS ELEMENTARY Students: 436, Location: 1125 CONCORD ST., Grades: KG-5)ALISAL ELEMENTARY Students: 434, Location: 1454 SANTA RITA RD., Grades: KG-5)Private elementary/middle schools in Pleasanton: CARDEN WEST SCHOOL Students: 208, Location: 4576 WILLOW RD, Grades: PK-5)
HACIENDA SCHOOL Students: 56, Location: 3800 STONERIDGE DR, Grades: 1-8)
KINDERCARE LEARNING CENTER Students: 25, Location: 7110 KOLL CENTER PKWY, Grades: PK-5)
See full list of schools located in Pleasanton Library in Pleasanton: PLEASANTON PUBLIC LIBRARY Operating income: $4,041,992; Location: 400 OLD BERNAL AVE.; 170,029 books ; 8,104 e-books ; 12,701 audio materials ; 16,401 video materials ; 39 other licensed databases ; 354 print serial subscriptions )
User-submitted facts and corrections:
Private School, Quarry Lane School, now enrolls (PK-8). Formerly (PK-5).
Notable locations in Pleasanton: (A) , Pleasanton Fairways (B) , Amador-Livermore Valley Museum (C) , Veterans Memorial Auditorium (D) , Pleasanton Library (E) , Pleasanton City Hall (F) , Livermore - Pleasanton Fire Department Station 4 (G) , USDA Plant Materials Center (H) , Livermore - Pleasanton Fire Department Station 3 (I) , Livermore - Pleasanton Fire Department Station 2 (J) , Livermore - Pleasanton Fire Department Station 5 Ruby Hill Station (K) , Livermore - Pleasanton Fire Department Station 1 Headquarters (L) . Display/hide their locations on the map
Shopping Centers: (1) , Best Plaza Shopping Center (2) , Gateway Square Shopping Center (3) , Mission Plaza Shopping Center (4) , Oak Hills Shopping Center (5) , Rose Pavilion Shopping Center (6) , Stoneridge Mall Shopping Center (7) . Display/hide their locations on the map
Main business address in Pleasanton include: (A) , BRIGHTSTAR INFORMATION TECHNOLOGY GROUP INC (B) , PEOPLESOFT INC (C) , SAFEWAY INC (D) , LIPID SCIENCES INC/ (E) , THORATEC CORP (F) , COOPER COMPANIES INC (G) , ROSS STORES INC (H) . Display/hide their locations on the map
Churches in Pleasanton include: (A) , Saint Augustines Roman Catholic Church (B) . Display/hide their locations on the map
Cemetery: (1) . Display/hide its location on the map
Lake: (A) . Display/hide its location on the map
Streams, rivers, and creeks: (A) , Laurel Creek (B) , Tassajara Creek (C) , Tehan Creek (D) , South San Ramon Creek (E) , Arroyo Valle (F) , Arroyo Las Positas (G) , Arroyo Mocho (H) . Display/hide their locations on the map
Parks in Pleasanton include: (1) , Alameda County Fairgrounds (2) , Amador Valley Park (3) , Fairlands Park (4) , Hansen Park (5) , Harvest Park (6) , John Belucchi Memorial Park (7) , Kottinger Village Park (8) , Moller Park (9) . Display/hide their locations on the map
Tourist attraction: (1) . Display/hide its approximate location on the map
Birthplace of: Randal J. Kirk - Billionaire, Keith Millard - Football player and coach, Brett Larson - Television journalist, Joel Kribel - PGA Tour Golf player (born : 1/27/77), Scott Perry (American football) - Football player.
Alameda County has a predicted average indoor radon screening level between 2 and 4 pCi/L (pico curies per liter) - Moderate Potential Drinking water stations with addresses in Pleasanton and their reported violations in the past:
CASA DE AMIGOS MOBILE HOME PARK (Population served: 220, Groundwater):
Past health violations:
MCL, Monthly (TCR) - In SEP-2007, Contaminant: Coliform. Follow-up actions: St Violation/Reminder Notice (SEP-10-2007)
MCL, Monthly (TCR) - In SEP-2007, Contaminant: Coliform. Follow-up actions: St Violation/Reminder Notice (SEP-10-2007)
Serves OR, Population served: 70, Groundwater):
Past monitoring violations:
Failure to Conduct Assessment Monitoring - Between JAN-2013 and DEC-2013, Contaminant: COLIPHAGE
Initial Tap Sampling for Pb and Cu - In JUL-01-2011, Contaminant: Lead and Copper Rule. Follow-up actions: St Violation/Reminder Notice (AUG-01-2011)
6 routine major monitoring violations
One regular monitoring violation
Drinking water stations with addresses in Pleasanton that have no violations reported:
CASTLEWOOD DOMESTIC WATER SYSTEM (Population served: 499, Primary Water Source Type: Purch groundwater)
SHORE FUN R.V. PARK (Population served: 60, Primary Water Source Type: Groundwater)
Average household size: This city:
2.8 peopleCalifornia:
2.9 people
Percentage of family households: This city:
76.0%Whole state:
68.7%
Percentage of households with unmarried partners: This city:
4.1%Whole state:
7.2%
Likely homosexual households (counted as self-reported same-sex unmarried-partner households)
Lesbian couples: 0.4% of all households Gay men: 0.3% of all households
People in group quarters in Pleasanton in 2010:
165 people in other noninstitutional facilities
129 people in nursing facilities/skilled-nursing facilities
112 people in group homes intended for adults
43 people in workers' group living quarters and job corps centers
6 people in group homes for juveniles (non-correctional)
People in group quarters in Pleasanton in 2000:
161 people in nursing homes
70 people in other noninstitutional group quarters
4 people in religious group quarters
Banks with most branches in Pleasanton (2011 data):
Wells Fargo Bank, National Association: Hopyard-Hacienda Branch, Pleasanton Branch, Santa Rita & Valley, Stoneridge Mall. Info updated 2011/04/05: Bank assets: $1,161,490.0 mil, Deposits: $905,653.0 mil, headquarters in Sioux Falls, SD, positive income , 6395 total offices , Holding Company: Wells Fargo & Company
U.S. Bank National Association: Bemal Safeway, Stoneridge Branch, Pleasanton Main Branch. Info updated 2012/01/30: Bank assets: $330,470.8 mil, Deposits: $236,091.5 mil, headquarters in Cincinnati, OH, positive income , 3121 total offices , Holding Company: U.S. Bancorp
JPMorgan Chase Bank, National Association: Stoneridge Mall Rd Branch at 5800 Stoneridge Mall Road, branch established on 1988/12/27; 561 Main Street Branch at 561 Main Street, branch established on 1965/05/05. Info updated 2011/11/10: Bank assets: $1,811,678.0 mil, Deposits: $1,190,738.0 mil, headquarters in Columbus, OH, positive income , International Specialization, 5577 total offices , Holding Company: Jpmorgan Chase & Co.
Bank of America, National Association: Pleasanton Branch at 337 Main Street, branch established on 1927/02/19; Hacienda Business Park at 6005 Stoneridge Drive, branch established on 1984/11/01. Info updated 2009/11/18: Bank assets: $1,451,969.3 mil, Deposits: $1,077,176.8 mil, headquarters in Charlotte, NC, positive income , 5782 total offices , Holding Company: Bank Of America Corporation
Heritage Bank of Commerce: Pleasanton Office at 300 Main Street, branch established on 2004/01/26. Info updated 2007/07/02: Bank assets: $1,303.2 mil, Deposits: $1,073.8 mil, headquarters in San Jose, CA, positive income , Commercial Lending Specialization, 12 total offices , Holding Company: Heritage Commerce Corp
Westamerica Bank: Pleasanton Branch at 5700 Stoneridge Mall, Suite 110, branch established on 1996/09/16. Info updated 2011/06/21: Bank assets: $4,998.1 mil, Deposits: $4,253.2 mil, headquarters in San Rafael, CA, positive income , Commercial Lending Specialization, 98 total offices , Holding Company: Westamerica Bancorporation
Fremont Bank: Koll Center Parkway Branch at 6654 K0ll Center Parkway, Suite 345, branch established on 1996/11/01. Info updated 2006/11/03: Bank assets: $2,367.9 mil, Deposits: $1,975.1 mil, headquarters in Fremont, CA, positive income , Commercial Lending Specialization, 19 total offices , Holding Company: Fremont Bancorporation
Union Bank, National Association: Pleasanton Branch at 4747 Hopyard Road, Suite E2, branch established on 2007/10/01. Info updated 2011/09/01: Bank assets: $88,967.5 mil, Deposits: $65,286.4 mil, headquarters in San Francisco, CA, positive income , Commercial Lending Specialization, 403 total offices , Holding Company: Mitsubishi Ufj Financial Group, Inc.
Comerica Bank: Pleasanton - Main Street Banking Cen at 600 Main Street, branch established on 2009/06/30. Info updated 2011/07/29: Bank assets: $60,970.5 mil, Deposits: $48,300.9 mil, headquarters in Dallas, TX, positive income , Commercial Lending Specialization, 497 total offices , Holding Company: Comerica Incorporated
4 other banks with 4 local branches
For population 15 years and over in Pleasanton:
Never married: 20.8%Now married: 64.8%Separated: 1.5%Widowed: 5.8%Divorced: 7.2% For population 25 years and over in Pleasanton:
High school or higher: 97.5%Bachelor's degree or higher: 74.6%Graduate or professional degree: 37.7%Unemployed: 2.6%Mean travel time to work (commute): 23.5 minutes
Education Gini index (Inequality in education) Here:
9.4California average:
15.5
Religion statistics for Pleasanton, CA (based on Alameda County data)
Religion Adherents Congregations Catholic 231,500 53 Evangelical Protestant 123,422 538 Other 87,110 227 Mainline Protestant 40,185 181 Black Protestant 20,716 76 Orthodox 6,640 16 None 1,000,698 -
Source: Clifford Grammich, Kirk Hadaway, Richard Houseal, Dale E.Jones, Alexei Krindatch, Richie Stanley and Richard H.Taylor. 2012. 2010 U.S.Religion Census: Religious Congregations & Membership Study. Association of Statisticians of American Religious Bodies. Jones, Dale E., et al. 2002. Congregations and Membership in the United States 2000. Nashville, TN: Glenmary Research Center. Graphs represent county-level data
Food Environment Statistics: Number of grocery stores : 364Alameda County :
2.50 / 10,000 pop.State :
2.14 / 10,000 pop.
Number of supercenters and club stores : 5Alameda County :
0.03 / 10,000 pop.California :
0.04 / 10,000 pop.
Number of convenience stores (no gas) : 97Alameda County :
0.67 / 10,000 pop.California :
0.62 / 10,000 pop.
Number of convenience stores (with gas) : 232This county :
1.60 / 10,000 pop.California :
1.49 / 10,000 pop.
Number of full-service restaurants : 1,299Here :
8.94 / 10,000 pop.State :
7.42 / 10,000 pop.
Adult diabetes rate : This county :
6.9%California :
7.3%
Adult obesity rate : Alameda County :
19.3%California :
21.3%
Low-income preschool obesity rate : Alameda County :
16.6%California :
17.9%
Health and Nutrition: Healthy diet rate : Pleasanton:
54.0%California:
49.4%
Average overall health of teeth and gums : Here:
53.3%California:
48.0%
Average BMI : Pleasanton:
27.9State:
28.1
People feeling badly about themselves : Pleasanton:
19.4%California:
20.2%
People not drinking alcohol at all : Pleasanton:
9.8%State:
11.2%
Average hours sleeping at night : This city:
6.9California:
6.8
Overweight people : This city:
32.8%California:
31.5%
General health condition : Pleasanton:
60.6%California:
56.4%
Average condition of hearing : This city:
81.6%State:
80.9%
More about Health and Nutrition of Pleasanton, CA Residents
Local government employment and payroll (March 2022)
Function
Full-time employees
Monthly full-time payroll
Average yearly full-time wage
Part-time employees
Monthly part-time payroll
Firefighters
91 $1,098,962 $144,918 0 $0 Police Protection - Officers
66 $728,311 $132,420 2 $7,032 Parks and Recreation
54 $354,559 $78,791 98 $104,738 Police - Other
28 $190,701 $81,729 2 $6,856 Other Government Administration
26 $238,675 $110,158 17 $6,387 Streets and Highways
24 $217,149 $108,575 1 $481 Water Supply
21 $154,484 $88,277 6 $16,573 Other and Unallocable
20 $156,168 $93,701 0 $0 Financial Administration
17 $162,330 $114,586 0 $0 Fire - Other
13 $160,089 $147,774 3 $5,378 Local Libraries
11 $90,635 $98,875 34 $57,671 Sewerage
7 $53,886 $92,376 0 $0 Housing and Community Development (Local)
3 $31,508 $126,032 1 $1,672 Judicial and Legal
2 $32,736 $196,416 2 $12,245 Welfare
1 $4,094 $49,128 4 $6,416
Totals for Government
384 $3,674,287 $114,821 170 $225,449
Pleasanton government finances - Expenditure in 2017 (per resident):
Construction - Water Utilities: $9,680,000 ($126.22)
Current Operations - Police Protection: $27,404,000 ($357.34)
Parks and Recreation: $24,736,000 ($322.55)Water Utilities: $24,298,000 ($316.84)Local Fire Protection: $18,110,000 ($236.15)Central Staff Services: $15,992,000 ($208.53)Sewerage: $13,537,000 ($176.52)Regular Highways: $9,491,000 ($123.76)Housing and Community Development: $9,368,000 ($122.16)Libraries: $4,268,000 ($55.65)Protective Inspection and Regulation - Other: $3,330,000 ($43.42)Financial Administration: $3,222,000 ($42.01)Transit Utilities: $1,267,000 ($16.52)General - Other: $939,000 ($12.24)Miscellaneous Commercial Activities - Other: $267,000 ($3.48)General - Interest on Debt: $26,000 ($0.34)
Total Salaries and Wages: $355,000 ($4.63)
Water Utilities - Interest on Debt: $153,000 ($2.00)
Pleasanton government finances - Revenue in 2017 (per resident):
Charges - Sewerage: $15,370,000 ($200.42)
Housing and Community Development: $7,461,000 ($97.29)Parks and Recreation: $7,377,000 ($96.19)Other: $5,933,000 ($77.36)Regular Highways: $4,850,000 ($63.24)Miscellaneous Commercial Activities: $120,000 ($1.56)Federal Intergovernmental - Other: $854,000 ($11.14)
Housing and Community Development: $141,000 ($1.84)Local Intergovernmental - Other: $682,000 ($8.89)
Transit Utilities: $496,000 ($6.47)Miscellaneous - Special Assessments: $3,929,000 ($51.23)
General Revenue - Other: $2,826,000 ($36.85)Interest Earnings: $1,425,000 ($18.58)Rents: $575,000 ($7.50)Donations From Private Sources: $423,000 ($5.52)Fines and Forfeits: $381,000 ($4.97)Revenue - Water Utilities: $24,817,000 ($323.61)
Transit Utilities: $48,000 ($0.63)State Intergovernmental - Other: $1,788,000 ($23.31)
Highways: $1,473,000 ($19.21)Water Utilities: $835,000 ($10.89)General Local Government Support: $369,000 ($4.81)Tax - Property: $60,835,000 ($793.27)
General Sales and Gross Receipts: $25,649,000 ($334.45)Other: $9,663,000 ($126.00)Other Selective Sales: $6,263,000 ($81.67)Occupation and Business License - Other: $4,045,000 ($52.75)Other License: $3,820,000 ($49.81)Public Utilities Sales: $2,637,000 ($34.39)Documentary and Stock Transfer: $874,000 ($11.40)
Pleasanton government finances - Debt in 2017 (per resident):
Long Term Debt - Beginning Outstanding - Public Debt for Private Purpose: $48,316,000 ($630.03)
Outstanding Nonguaranteed - Industrial Revenue: $46,300,000 ($603.74)Outstanding Unspecified Public Purpose: $19,553,000 ($254.96)Issue, Unspecified Public Purpose: $11,631,000 ($151.66)Beginning Outstanding - Unspecified Public Purpose: $8,241,000 ($107.46)Retired Nonguaranteed - Public Debt for Private Purpose: $2,016,000 ($26.29)Retired Unspecified Public Purpose: $320,000 ($4.17)
Pleasanton government finances - Cash and Securities in 2017 (per resident):
Bond Funds - Cash and Securities: $60,926,000 ($794.46)
Other Funds - Cash and Securities: $122,126,000 ($1592.48)
Sinking Funds - Cash and Securities: $46,300,000 ($603.74)
6.77% of this county's 2021 resident taxpayers lived in other counties in 2020 ($121,106 average adjusted gross income )
Here:
6.77%California average:
5.19%
0.01% of residents moved from foreign countries ($76 average AGI )Alameda County:
0.01%California average:
0.03%
Top counties from which taxpayers relocated into this county between 2020 and 2021:
8.96% of this county's 2020 resident taxpayers moved to other counties in 2021 ($131,786 average adjusted gross income )
Here:
8.96%California average:
6.14%
0.01% of residents moved to foreign countries ($103 average AGI )Alameda County:
0.01%California average:
0.02%
Top counties to which taxpayers relocated from this county between 2020 and 2021:
Businesses in Pleasanton, CA
Name Count Name Count
24 Hour Fitness 2 KFC 1 7-Eleven 2 Kohl's 1 ALDO 1 Kroger 1 AT&T 3 La-Z-Boy 1 Aeropostale 1 Lane Bryant 1 American Eagle Outfitters 1 Lane Furniture 1 Ann Taylor 1 LensCrafters 1 Apple Store 1 Little Caesars Pizza 2 Arby's 1 Macy's 2 BMW 1 Marriott 3 Baja Fresh Mexican Grill 1 MasterBrand Cabinets 2 Bakers 1 McDonald's 4 Banana Republic 1 Men's Wearhouse 2 Baskin-Robbins 1 Motel 6 1 Bath & Body Works 1 Motherhood Maternity 2 Bebe 1 New Balance 6 Best Western 1 New York & Co 1 Big O Tires 1 Nike 14 Blockbuster 1 Nordstrom 1 Brookstone 1 OfficeMax 1 Budget Car Rental 1 Pac Sun 1 Burger King 1 Panda Express 2 CVS 1 Payless 2 Cache 1 Penske 1 Carl\s Jr. 1 Plato's Closet 1 Chico's 1 Pottery Barn 1 Cinnabon 1 Pottery Barn Kids 1 Cold Stone Creamery 1 Quiznos 1 Coldwater Creek 1 RadioShack 1 Curves 1 Red Robin 1 DHL 2 Rite Aid 1 Decora Cabinetry 2 SAS Shoes 1 Dennys 1 Safeway 1 Domino's Pizza 1 Sears 1 Ethan Allen 1 Sephora 2 Express 2 Sheraton 1 Extended Stay Deluxe 1 Soma Intimates 1 FedEx 13 Sprint Nextel 2 Foot Locker 1 Starbucks 6 Forever 21 1 T-Mobile 4 Fredericks Of Hollywood 1 T.G.I. Driday's 1 GNC 2 Taco Bell 3 GameStop 1 Talbots 1 Gap 1 The Cheesecake Factory 1 Gymboree 1 The Room Place 1 H&M 1 Torrid 1 H&R Block 2 Toys"R"Us 1 Haagen-Dazs 1 Trader Joe's 1 Hilton 2 True Value 2 Home Depot 1 U-Haul 1 Hot Topic 1 UPS 19 J. Jill 1 Vans 6 J.Crew 1 Verizon Wireless 4 JCPenney 3 Victoria's Secret 1 Jack In The Box 2 Vons 1 Jamba Juice 2 Walgreens 1 Jones New York 3 Walmart 1 Journeys 1 Wet Seal 1 Justice 1
Strongest AM radio stations in Pleasanton:
KGO (810 AM; 50 kW; SAN FRANCISCO, CA; Owner: KGO-AM RADIO, INC.)
KFAX (1100 AM; 50 kW; SAN FRANCISCO, CA; Owner: GOLDEN GATE BROADCASTING CO, INC.)
KTCT (1050 AM; 50 kW; SAN MATEO, CA; Owner: SUSQUEHANNA RADIO CORP.)
KNBR (680 AM; 50 kW; SAN FRANCISCO, CA; Owner: KNBR LICO, INC.)
KTRB (860 AM; 50 kW; MODESTO, CA; Owner: PAPPAS RADIO OF CALIFORNIA, A CALIFORNIA LIMITED PARTNERSHIP)
KLOK (1170 AM; 50 kW; SAN JOSE, CA; Owner: ENTRAVISION HOLDINGS, LLC)
KYCY (1550 AM; 50 kW; SAN FRANCISCO, CA; Owner: INFINITY BROADCASTING OPERATIONS, INC.)
KIQI (1010 AM; 35 kW; SAN FRANCISCO, CA; Owner: RADIO UNICA OF SAN FRANCISCO LICENSE CORP.)
KCBS (740 AM; 50 kW; SAN FRANCISCO, CA; Owner: INFINITY BROADCASTING OPERATIONS, INC.)
KNEW (910 AM; 20 kW; OAKLAND, CA; Owner: AMFM RADIO LICENSES, L.L.C.)
KCBC (770 AM; 50 kW; RIVERBANK, CA; Owner: KIERTRON, INC.)
KSJX (1500 AM; 10 kW; SAN JOSE, CA; Owner: MULTICULTURAL RADIO BROADCASTING INC)
KATD (990 AM; 10 kW; PITTSBURG, CA; Owner: RADIO UNICA OF SACRAMENTO LICENSE CORP.)
Strongest FM radio stations in Pleasanton:
KZBR-FM2 (95.7 FM; LIVERMORE, ETC., CA; Owner: BONNEVILLE HOLDING COMPANY)
KKSF-FM1 (103.7 FM; PLEASANTON, ETC., CA; Owner: AMFM RADIO LICENSES, L.L.C.)
KFRC-FM3 (99.7 FM; WALNUT CREEK, CA; Owner: INFINITY KFRC-FM, INC.)
KZBR-FM1 (95.7 FM; WALNUT CREEK, CA; Owner: BONNEVILLE HOLDING COMPANY)
KBLX-FM2 (102.9 FM; PLEASANTON, CA; Owner: ICBC BROADCAST HOLDINGS -CA, INC.)
KSOL-FM3 (98.9 FM; PLEASANTON, CA; Owner: TMS LICENSE CALIFORNIA, INC)
KISQ-FM3 (98.1 FM; CONCORD, CA; Owner: AMFM RADIO LICENSES, L.L.C.)
KMEL-FM1 (106.1 FM; CONCORD, CA; Owner: AMFM RADIO LICENSES, L.L.C.)
K238AC (95.5 FM; SALIDA, CA; Owner: FAMILY STATIONS, INC.)
KBAA (94.5 FM; GILROY, CA; Owner: INFINITY RADIO OPERATIONS INC.)
KFJC (89.7 FM; LOS ALTOS, CA; Owner: FOOTHILL-DE ANZA COMM. COLLEGE DIST.)
KFJO (92.1 FM; WALNUT CREEK, CA; Owner: CHASE RADIO PROPERTIES, L.L.C.)
KOHL (89.3 FM; FREMONT, CA; Owner: FREMONT-NEWARK COMMUNITY COLL. DIST.)
KSQL (99.1 FM; SANTA CRUZ, CA; Owner: TMS LICENSE CALIFORNIA, INC)
KKUP (91.5 FM; CUPERTINO, CA; Owner: ASSURANCE SCIENCES FOUNDATION)
KBRG (100.3 FM; SAN JOSE, CA; Owner: ENTRAVISION HOLDINGS, LLC)
KUOP (91.3 FM; STOCKTON, CA; Owner: UNIVERSITY OF THE PACIFIC)
KLLC (97.3 FM; SAN FRANCISCO, CA; Owner: INFINITY BROADCASTING OPERATIONS, INC.)
KDFC-FM1 (102.1 FM; LAFAYETTE, CA; Owner: BONNEVILLE HOLDING COMPANY)
KOIT-FM2 (96.5 FM; MARTINEZ, ETC., CA; Owner: BONNEVILLE HOLDING CO. C/O KOIT(FM))
TV broadcast stations around Pleasanton:
KQED (Channel 9; SAN FRANCISCO, CA; Owner: KQED, INC.)
KBIT-CA (Channel 28; SAN FRANCISCO, ETC., CA; Owner: POLAR BROADCASTING, INC.)
KICU-TV (Channel 36; SAN JOSE, CA; Owner: KTVU PARTNERSHIP)
KTEH (Channel 54; SAN JOSE, CA; Owner: KTEH FOUNDATION)
KDTV (Channel 14; SAN FRANCISCO, CA; Owner: KDTV LICENSE PARTNERSHIP, G.P.)
KSTS (Channel 48; SAN JOSE, CA; Owner: TELEMUNDO OF NORTHERN CALIFORNIA LICENSE CORP.)
KOVR (Channel 13; STOCKTON, CA; Owner: SCI - SACRAMENTO LICENSEE, LLC)
KXTV (Channel 10; SACRAMENTO, CA; Owner: KXTV, INC.)
KCRA-TV (Channel 3; SACRAMENTO, CA; Owner: KCRA HEARST-ARGYLE TELEVISION, INC.)
KSPX (Channel 29; SACRAMENTO, CA; Owner: PAXSON SACRAMENTO LICENSE, INC.)
KGO-TV (Channel 7; SAN FRANCISCO, CA; Owner: KGO TELEVISION, INC.)
KPIX-TV (Channel 5; SAN FRANCISCO, CA; Owner: CBS BROADCASTING INC.)
KUVS (Channel 19; MODESTO, CA; Owner: KUVS LICENSE PARTNERSHIP, G.P.)
KTXL (Channel 40; SACRAMENTO, CA; Owner: CHANNEL 40, INC.)
KQCA (Channel 58; STOCKTON, CA; Owner: KCRA HEARST-ARGYLE TELEVISION, INC.)
KVIE (Channel 6; SACRAMENTO, CA; Owner: KVIE, INC.)
KMAX-TV (Channel 31; SACRAMENTO, CA; Owner: UPN STATIONS GROUP INC.)
KTVU (Channel 2; OAKLAND, CA; Owner: KTVU PARTNERSHIP)
KRON-TV (Channel 4; SAN FRANCISCO, CA; Owner: YOUNG BROADCASTING OF SAN FRANCISCO, INC.)
KMTP-TV (Channel 32; SAN FRANCISCO, CA; Owner: MINORITY TELEVISION PROJECT)
KBHK-TV (Channel 44; SAN FRANCISCO, CA; Owner: VIACOM TELEVISION STATIONS GROUP OF SAN FRANCISCO INC.)
KBWB (Channel 20; SAN FRANCISCO, CA; Owner: KBWB LICENSE, INC.)
KFSF (Channel 66; VALLEJO, CA; Owner: TELEFUTURA SAN FRANCISCO LLC)
KCNS (Channel 38; SAN FRANCISCO, CA; Owner: WRAY, INC.)
KTNC-TV (Channel 42; CONCORD, CA; Owner: KTNC LICENSE, LLC)
National Bridge Inventory (NBI) Statistics 85 Number of bridges2,133ft / 650m Total length $10,746,000 Total costs5,826,054 Total average daily traffic555,718 Total average daily truck traffic
New bridges - historical statistics
1 1920-1929 4 1950-1959 24 1960-1969 7 1970-1979 16 1980-1989 10 1990-1999 20 2000-2009 3 2010-2019
See full National Bridge Inventory statistics for Pleasanton, CA
Home Mortgage Disclosure Act Aggregated Statistics For Year 2009(Based on 5 full and 6 partial tracts) A) FHA, FSA/RHS & VA B) Conventional C) Refinancings D) Home Improvement Loans E) Loans on Dwellings For 5+ Families F) Non-occupant Loans on G) Loans On Manufactured Number Average Value Number Average Value Number Average Value Number Average Value Number Average Value Number Average Value Number Average Value
LOANS ORIGINATED 81 $503,217 388 $465,368 2,938 $370,652 111 $265,805 3 $12,235,867 79 $282,290 1 $31,110 APPLICATIONS APPROVED, NOT ACCEPTED 11 $574,655 39 $416,783 323 $416,501 5 $323,402 1 $470,760 11 $350,075 0 $0 APPLICATIONS DENIED 6 $417,247 57 $482,301 493 $468,316 19 $125,215 1 $13,244,000 26 $299,393 0 $0 APPLICATIONS WITHDRAWN 10 $439,798 57 $483,973 342 $419,611 10 $147,722 1 $469,850 16 $274,242 1 $386,000 FILES CLOSED FOR INCOMPLETENESS 2 $497,210 10 $447,501 124 $431,875 7 $104,783 0 $0 5 $252,516 0 $0
Aggregated Statistics For Year 2008(Based on 5 full and 6 partial tracts) A) FHA, FSA/RHS & VA B) Conventional C) Refinancings D) Home Improvement Loans E) Loans on Dwellings For 5+ Families F) Non-occupant Loans on G) Loans On Manufactured Number Average Value Number Average Value Number Average Value Number Average Value Number Average Value Number Average Value Number Average Value
LOANS ORIGINATED 34 $506,277 392 $462,863 1,068 $404,752 65 $218,765 2 $2,939,260 64 $355,837 1 $595,940 APPLICATIONS APPROVED, NOT ACCEPTED 5 $478,962 89 $474,671 204 $423,853 15 $120,205 0 $0 21 $344,123 2 $99,685 APPLICATIONS DENIED 12 $564,200 87 $459,927 286 $495,591 39 $249,937 1 $423,870 29 $285,199 6 $59,040 APPLICATIONS WITHDRAWN 4 $477,260 60 $534,467 167 $434,073 15 $324,721 1 $1,613,490 15 $328,237 0 $0 FILES CLOSED FOR INCOMPLETENESS 1 $277,890 17 $527,064 64 $473,199 8 $219,448 0 $0 3 $244,977 0 $0
Aggregated Statistics For Year 2007(Based on 5 full and 6 partial tracts) B) Conventional C) Refinancings D) Home Improvement Loans E) Loans on Dwellings For 5+ Families F) Non-occupant Loans on G) Loans On Manufactured Number Average Value Number Average Value Number Average Value Number Average Value Number Average Value Number Average Value
LOANS ORIGINATED 666 $526,593 1,215 $450,643 143 $278,952 2 $9,437,440 103 $426,178 2 $67,715 APPLICATIONS APPROVED, NOT ACCEPTED 165 $582,808 224 $479,403 30 $277,597 0 $0 14 $425,945 3 $77,263 APPLICATIONS DENIED 120 $570,746 365 $515,307 44 $274,954 0 $0 26 $359,322 2 $62,010 APPLICATIONS WITHDRAWN 51 $507,089 176 $465,105 23 $297,082 1 $5,000,000 18 $399,984 0 $0 FILES CLOSED FOR INCOMPLETENESS 18 $500,998 57 $493,670 12 $278,167 0 $0 3 $205,460 0 $0
Aggregated Statistics For Year 2006(Based on 5 full and 6 partial tracts) A) FHA, FSA/RHS & VA B) Conventional C) Refinancings D) Home Improvement Loans E) Loans on Dwellings For 5+ Families F) Non-occupant Loans on G) Loans On Manufactured Number Average Value Number Average Value Number Average Value Number Average Value Number Average Value Number Average Value Number Average Value
LOANS ORIGINATED 0 $0 819 $503,572 1,371 $441,096 196 $321,952 3 $6,777,473 124 $379,687 2 $87,025 APPLICATIONS APPROVED, NOT ACCEPTED 1 $389,410 158 $481,624 218 $443,506 31 $346,600 1 $234,680 17 $475,594 2 $53,170 APPLICATIONS DENIED 0 $0 147 $466,139 323 $508,385 39 $341,028 0 $0 31 $392,510 2 $173,000 APPLICATIONS WITHDRAWN 0 $0 78 $482,859 273 $428,745 21 $242,256 0 $0 19 $464,442 1 $118,000 FILES CLOSED FOR INCOMPLETENESS 0 $0 22 $525,776 70 $420,907 7 $219,747 0 $0 4 $353,058 0 $0
Aggregated Statistics For Year 2005(Based on 5 full and 6 partial tracts) B) Conventional C) Refinancings D) Home Improvement Loans E) Loans on Dwellings For 5+ Families F) Non-occupant Loans on G) Loans On Manufactured Number Average Value Number Average Value Number Average Value Number Average Value Number Average Value Number Average Value
LOANS ORIGINATED 1,083 $520,331 1,939 $436,498 215 $337,301 1 $2,852,300 178 $375,413 1 $114,410 APPLICATIONS APPROVED, NOT ACCEPTED 170 $500,671 221 $450,650 24 $263,448 0 $0 17 $404,714 1 $25,270 APPLICATIONS DENIED 202 $528,855 340 $466,455 71 $230,546 1 $722,100 31 $499,255 6 $184,482 APPLICATIONS WITHDRAWN 148 $533,824 364 $415,607 37 $291,991 0 $0 32 $362,443 3 $79,597 FILES CLOSED FOR INCOMPLETENESS 39 $434,708 88 $456,478 9 $300,943 0 $0 5 $325,534 0 $0
Aggregated Statistics For Year 2004(Based on 5 full and 6 partial tracts) A) FHA, FSA/RHS & VA B) Conventional C) Refinancings D) Home Improvement Loans E) Loans on Dwellings For 5+ Families F) Non-occupant Loans on G) Loans On Manufactured Number Average Value Number Average Value Number Average Value Number Average Value Number Average Value Number Average Value Number Average Value
LOANS ORIGINATED 1 $252,730 1,197 $454,945 2,710 $371,374 169 $254,708 3 $3,642,557 210 $298,748 2 $40,250 APPLICATIONS APPROVED, NOT ACCEPTED 0 $0 205 $463,710 389 $362,331 23 $183,266 0 $0 33 $307,456 1 $39,740 APPLICATIONS DENIED 0 $0 196 $416,452 410 $395,411 51 $204,300 0 $0 42 $290,059 1 $159,000 APPLICATIONS WITHDRAWN 0 $0 158 $507,270 436 $381,975 43 $240,648 1 $321,330 24 $302,648 0 $0 FILES CLOSED FOR INCOMPLETENESS 0 $0 36 $526,372 102 $398,133 7 $171,880 0 $0 5 $251,126 0 $0
Aggregated Statistics For Year 2003(Based on 5 full and 6 partial tracts) A) FHA, FSA/RHS & VA B) Conventional C) Refinancings D) Home Improvement Loans E) Loans on Dwellings For 5+ Families F) Non-occupant Loans on Number Average Value Number Average Value Number Average Value Number Average Value Number Average Value Number Average Value
LOANS ORIGINATED 0 $0 1,225 $370,551 6,615 $301,189 67 $84,866 4 $2,936,950 333 $228,540 APPLICATIONS APPROVED, NOT ACCEPTED 0 $0 153 $408,950 825 $315,742 22 $85,837 0 $0 34 $239,606 APPLICATIONS DENIED 0 $0 127 $378,309 584 $351,888 34 $70,450 0 $0 49 $286,270 APPLICATIONS WITHDRAWN 1 $112,650 164 $414,013 699 $306,080 9 $192,613 0 $0 27 $265,799 FILES CLOSED FOR INCOMPLETENESS 0 $0 38 $439,674 178 $347,544 3 $41,417 0 $0 14 $274,173
Aggregated Statistics For Year 2002(Based on 4 full and 5 partial tracts) A) FHA, FSA/RHS & VA B) Conventional C) Refinancings D) Home Improvement Loans F) Non-occupant Loans on Number Average Value Number Average Value Number Average Value Number Average Value Number Average Value
LOANS ORIGINATED 6 $233,500 1,146 $332,880 4,761 $303,068 58 $63,885 200 $240,283 APPLICATIONS APPROVED, NOT ACCEPTED 3 $101,157 151 $358,182 629 $304,618 12 $90,644 34 $235,994 APPLICATIONS DENIED 1 $166,930 87 $325,812 363 $329,367 22 $54,094 21 $247,851 APPLICATIONS WITHDRAWN 0 $0 135 $389,645 511 $302,986 17 $77,401 17 $175,184 FILES CLOSED FOR INCOMPLETENESS 0 $0 43 $379,976 112 $333,051 1 $15,000 11 $298,565
Aggregated Statistics For Year 2001(Based on 4 full and 5 partial tracts) A) FHA, FSA/RHS & VA B) Conventional C) Refinancings D) Home Improvement Loans E) Loans on Dwellings For 5+ Families F) Non-occupant Loans on Number Average Value Number Average Value Number Average Value Number Average Value Number Average Value Number Average Value
LOANS ORIGINATED 4 $214,042 793 $312,459 3,194 $297,296 135 $62,959 1 $974,830 145 $227,639 APPLICATIONS APPROVED, NOT ACCEPTED 0 $0 87 $269,444 365 $291,398 27 $62,958 0 $0 14 $210,584 APPLICATIONS DENIED 0 $0 87 $311,718 375 $304,009 27 $45,056 0 $0 14 $290,090 APPLICATIONS WITHDRAWN 0 $0 90 $276,200 480 $295,224 28 $65,983 0 $0 14 $228,160 FILES CLOSED FOR INCOMPLETENESS 1 $151,340 25 $345,051 125 $308,915 7 $118,946 0 $0 6 $202,012
Aggregated Statistics For Year 2000(Based on 4 full and 5 partial tracts) A) FHA, FSA/RHS & VA B) Conventional C) Refinancings D) Home Improvement Loans E) Loans on Dwellings For 5+ Families F) Non-occupant Loans on Number Average Value Number Average Value Number Average Value Number Average Value Number Average Value Number Average Value
LOANS ORIGINATED 6 $193,857 1,066 $305,497 711 $226,756 166 $50,578 0 $0 81 $217,502 APPLICATIONS APPROVED, NOT ACCEPTED 2 $62,975 179 $312,083 88 $237,390 40 $50,168 0 $0 13 $225,536 APPLICATIONS DENIED 3 $135,503 135 $296,511 181 $228,810 39 $42,946 1 $128,890 14 $157,674 APPLICATIONS WITHDRAWN 1 $136,200 87 $335,283 165 $212,682 30 $43,478 0 $0 8 $171,800 FILES CLOSED FOR INCOMPLETENESS 0 $0 47 $327,433 94 $249,463 5 $63,320 0 $0 3 $243,490
Aggregated Statistics For Year 1999(Based on 4 full and 6 partial tracts) A) FHA, FSA/RHS & VA B) Conventional C) Refinancings D) Home Improvement Loans E) Loans on Dwellings For 5+ Families F) Non-occupant Loans on Number Average Value Number Average Value Number Average Value Number Average Value Number Average Value Number Average Value
LOANS ORIGINATED 19 $173,536 1,382 $249,517 1,805 $241,925 142 $40,821 2 $1,126,020 136 $185,672 APPLICATIONS APPROVED, NOT ACCEPTED 2 $149,250 132 $279,139 298 $227,729 54 $37,933 0 $0 15 $205,174 APPLICATIONS DENIED 1 $180,400 128 $228,196 298 $240,334 42 $32,812 2 $190,440 21 $187,734 APPLICATIONS WITHDRAWN 4 $129,885 139 $232,632 303 $214,451 10 $76,797 0 $0 15 $172,414 FILES CLOSED FOR INCOMPLETENESS 1 $127,300 51 $294,653 139 $242,965 5 $36,552 0 $0 7 $240,980
Detailed mortgage data for all 11 tracts in Pleasanton, CA
Private Mortgage Insurance Companies Aggregated Statistics For Year 2009(Based on 5 full and 5 partial tracts) A) Conventional B) Refinancings Number Average Value Number Average Value
LOANS ORIGINATED 22 $422,927 9 $446,270 APPLICATIONS APPROVED, NOT ACCEPTED 7 $459,879 5 $401,754 APPLICATIONS DENIED 4 $407,750 7 $487,776 APPLICATIONS WITHDRAWN 1 $319,930 1 $675,320 FILES CLOSED FOR INCOMPLETENESS 0 $0 0 $0
Aggregated Statistics For Year 2008(Based on 5 full and 5 partial tracts) A) Conventional B) Refinancings C) Non-occupant Loans on Number Average Value Number Average Value Number Average Value
LOANS ORIGINATED 32 $497,201 9 $536,479 0 $0 APPLICATIONS APPROVED, NOT ACCEPTED 5 $543,758 7 $493,911 1 $405,000 APPLICATIONS DENIED 2 $412,100 4 $487,735 2 $573,250 APPLICATIONS WITHDRAWN 2 $436,485 1 $505,500 0 $0 FILES CLOSED FOR INCOMPLETENESS 0 $0 0 $0 0 $0
Aggregated Statistics For Year 2007(Based on 4 full and 5 partial tracts) A) Conventional B) Refinancings C) Non-occupant Loans on Number Average Value Number Average Value Number Average Value
LOANS ORIGINATED 8 $553,121 5 $466,888 0 $0 APPLICATIONS APPROVED, NOT ACCEPTED 1 $199,110 2 $801,575 0 $0 APPLICATIONS DENIED 0 $0 3 $810,000 1 $810,000 APPLICATIONS WITHDRAWN 0 $0 0 $0 0 $0 FILES CLOSED FOR INCOMPLETENESS 0 $0 0 $0 0 $0
Aggregated Statistics For Year 2006(Based on 4 partial tracts) A) Conventional B) Refinancings C) Non-occupant Loans on Number Average Value Number Average Value Number Average Value
LOANS ORIGINATED 1 $597,290 1 $790,930 0 $0 APPLICATIONS APPROVED, NOT ACCEPTED 1 $279,010 1 $623,620 1 $279,010 APPLICATIONS DENIED 0 $0 0 $0 0 $0 APPLICATIONS WITHDRAWN 0 $0 1 $350,100 0 $0 FILES CLOSED FOR INCOMPLETENESS 0 $0 0 $0 0 $0
Aggregated Statistics For Year 2005(Based on 3 full and 5 partial tracts) A) Conventional B) Refinancings Number Average Value Number Average Value
LOANS ORIGINATED 6 $556,937 3 $527,517 APPLICATIONS APPROVED, NOT ACCEPTED 0 $0 1 $255,030 APPLICATIONS DENIED 0 $0 1 $635,920 APPLICATIONS WITHDRAWN 0 $0 1 $585,760 FILES CLOSED FOR INCOMPLETENESS 0 $0 0 $0
Aggregated Statistics For Year 2004(Based on 4 full and 6 partial tracts) A) Conventional B) Refinancings Number Average Value Number Average Value
LOANS ORIGINATED 20 $265,830 6 $479,268 APPLICATIONS APPROVED, NOT ACCEPTED 2 $351,895 3 $303,120 APPLICATIONS DENIED 0 $0 0 $0 APPLICATIONS WITHDRAWN 1 $242,170 0 $0 FILES CLOSED FOR INCOMPLETENESS 0 $0 0 $0
Aggregated Statistics For Year 2003(Based on 5 full and 6 partial tracts) A) Conventional B) Refinancings C) Non-occupant Loans on Number Average Value Number Average Value Number Average Value
LOANS ORIGINATED 26 $336,066 20 $329,724 1 $276,970 APPLICATIONS APPROVED, NOT ACCEPTED 4 $272,135 10 $345,298 1 $276,970 APPLICATIONS DENIED 0 $0 0 $0 0 $0 APPLICATIONS WITHDRAWN 3 $273,657 3 $372,710 1 $293,430 FILES CLOSED FOR INCOMPLETENESS 0 $0 0 $0 0 $0
Aggregated Statistics For Year 2002(Based on 4 full and 5 partial tracts) A) Conventional B) Refinancings C) Non-occupant Loans on Number Average Value Number Average Value Number Average Value
LOANS ORIGINATED 32 $320,273 16 $379,893 1 $217,560 APPLICATIONS APPROVED, NOT ACCEPTED 7 $330,116 12 $401,346 0 $0 APPLICATIONS DENIED 1 $231,270 0 $0 0 $0 APPLICATIONS WITHDRAWN 3 $210,743 3 $379,757 0 $0 FILES CLOSED FOR INCOMPLETENESS 1 $380,000 0 $0 0 $0
Aggregated Statistics For Year 2001(Based on 4 full and 5 partial tracts) A) Conventional B) Refinancings C) Non-occupant Loans on Number Average Value Number Average Value Number Average Value
LOANS ORIGINATED 30 $308,219 10 $385,401 2 $212,615 APPLICATIONS APPROVED, NOT ACCEPTED 5 $355,698 7 $327,353 0 $0 APPLICATIONS DENIED 1 $408,360 0 $0 0 $0 APPLICATIONS WITHDRAWN 1 $251,380 0 $0 0 $0 FILES CLOSED FOR INCOMPLETENESS 0 $0 0 $0 0 $0
Aggregated Statistics For Year 2000(Based on 4 full and 5 partial tracts) A) Conventional B) Refinancings C) Non-occupant Loans on Number Average Value Number Average Value Number Average Value
LOANS ORIGINATED 74 $324,144 16 $303,277 2 $219,430 APPLICATIONS APPROVED, NOT ACCEPTED 20 $284,048 9 $275,022 1 $65,180 APPLICATIONS DENIED 1 $210,170 2 $226,890 0 $0 APPLICATIONS WITHDRAWN 4 $239,592 1 $250,000 0 $0 FILES CLOSED FOR INCOMPLETENESS 0 $0 0 $0 0 $0
Aggregated Statistics For Year 1999(Based on 4 full and 6 partial tracts) A) Conventional B) Refinancings C) Non-occupant Loans on Number Average Value Number Average Value Number Average Value
LOANS ORIGINATED 101 $286,838 33 $230,359 2 $161,775 APPLICATIONS APPROVED, NOT ACCEPTED 19 $252,398 16 $220,138 0 $0 APPLICATIONS DENIED 6 $258,463 4 $147,100 0 $0 APPLICATIONS WITHDRAWN 5 $251,714 2 $137,760 0 $0 FILES CLOSED FOR INCOMPLETENESS 0 $0 1 $367,910 0 $0
Fire-safe hotels and motels in Pleasanton, California:
Four Points Pleasanton, 5115 Hopyard Rd, Pleasanton, California 94588 Phone: (925) 460-8800, Fax: (925) 847-9455
Sheraton-Pleasanton, 5990 Stoneridge Mall Rd, Pleasanton, California 94588 Phone: (925) 463-3330, Fax: (925) 463-3315
Pleasanton Marriott, 11950 Dublin Canyon Rd, Pleasanton, California 94588 Phone: (925) 847-6000, Fax: (925) 463-2585
Hyatt House Pleasanton, 4545 Chabot Dr, Pleasanton, California 94588 Phone: (925) 730-0070, Fax: (925) 930-0075
Best Western Plus - Pleasanton Inn, 5375 Owens Ct, Pleasanton, California 94588 Phone: (925) 463-1300, Fax: (925) 734-8843
Extended Stay America - Pleasanton - Chabot Dr, 4555 Chabot Dr, Pleasanton, California 94588 Phone: (925) 730-0000, Fax: (925) 730-0050
Residence Inn By Marriott Pleasanton, 11920 Dublin Canyon Rd, Pleasanton, California 94588 Phone: (800) 331-3131, Fax: (925) 828-1199
Hyatt House Pleasanton, 4545 Chabot Dr, Pleasanton, California 94588 Phone: (925) 730-0070, Fax: (925) 730-0075
All 8 fire-safe hotels and motels in Pleasanton, California
Most common first names in Pleasanton, CA among deceased individuals Name Count Lived (average)
John 201 75.3 years Mary 180 80.5 years Robert 137 72.5 years William 136 75.8 years James 114 71.9 years George 95 76.6 years Frank 90 75.7 years Margaret 89 81.5 years Joseph 88 76.6 years Helen 85 82.3 years
Most common last names in Pleasanton, CA among deceased individuals Last name Count Lived (average)
Johnson 37 72.1 years Smith 37 79.4 years Jones 37 77.4 years Brown 33 80.6 years Anderson 30 74.2 years Hansen 29 80.6 years Wilson 27 75.6 years Nelson 26 76.1 years Silva 25 80.7 years Miller 25 69.8 years
Pleasanton compared to California state average:
Median household income above state average. Median house value significantly above state average. Unemployed percentage significantly below state average. Black race population percentage below state average. Hispanic race population percentage significantly below state average. Median age significantly above state average. Foreign-born population percentage above state average. Renting percentage below state average. House age below state average. Percentage of population with a bachelor's degree or higher significantly above state average. Pleasanton on our top lists :
#6 on the list of "Top 101 cities with largest percentage of females in industries: construction (population 50,000+)"
#7 on the list of "Top 100 cities with highest median household income (pop. 50,000+)"
#8 on the list of "Top 101 cities with largest percentage of males in occupations: architecture and engineering occupations (population 50,000+)"
#8 on the list of "Top 101 cities with largest percentage of females in occupations: business and financial operations occupations (population 50,000+)"
#14 on the list of "Top 101 cities with largest percentage of females in occupations: computer and mathematical occupations (population 50,000+)"
#15 on the list of "Top 101 cities with largest percentage of males in occupations: management occupations (population 50,000+)"
#20 on the list of "Top 100 cities with highest median house value (pop. 50,000+)"
#21 on the list of "Top 101 cities with largest percentage of males in industries: professional, scientific, and technical services (population 50,000+)"
#26 on the list of "Top 101 cities with the largest differences between morning and afternoon humidity (population 50,000+)"
#27 on the list of "Top 101 cities with the largest humidity differences during a year (population 50,000+)"
#29 on the list of "Top 101 cities with the least people below 50% of the poverty level (population 50,000+)"
#29 on the list of "Top 101 cities with the lowest city-data.com crime index (population 50,000+)"
#33 on the list of "Top 101 cities with the lowest number of assaults per 100,000 residents (population 50,000+)"
#35 on the list of "Top 101 cities with the most people below the poverty level, excluding cities with 15% or more of residents in college and with the median age below 28 (population 50,000+)"
#35 on the list of "Top 101 cities with the highest cost per building permit(population 50,000+)"
#36 on the list of "Top 101 cities with the least people below the poverty level (population 50,000+)"
#37 on the list of "Top 101 cities with largest percentage of males in occupations: computer and mathematical occupations (population 50,000+)"
#37 on the list of "Top 101 cities with largest percentage of females in industries: professional, scientific, and technical services (population 50,000+)"
#38 on the list of "Top 101 cities with the lowest number of burglaries per 100,000 residents (population 50,000+)"
#38 on the list of "Top 101 cities with largest percentage of females in occupations: architecture and engineering occupations (population 50,000+)"
#11 on the list of "Top 101 counties with the lowest Ozone (1-hour) air pollution readings in 2012 (ppm)"
#17 on the list of "Top 101 counties with highest percentage of residents voting for Obama (Democrat) in the 2012 Presidential Election (pop. 50,000+)"
#18 on the list of "Top 101 counties with the most Other congregations"
#21 on the list of "Top 101 counties with the highest surface withdrawal of fresh water for public supply (pop. 50,000+)"
#22 on the list of "Top 101 counties with the highest percentage of residents that exercised in the past month"
Top Patent Applicants
Ayman Hammad (196)
Patrick Faith (129)
James L. Hedrick (99)
Bin Huang (96)
Yiming Huai (95)
Michael P. Wallace (80)
Shahid Rauf (77)
Sudheer A. Grandhi (66)
Stephen Grant (59)
Andrew D. Bailey, Iii (53)
Total of 9573 patent applications in 2008-2024.
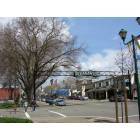

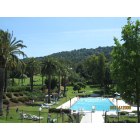
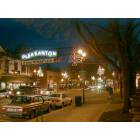

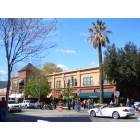


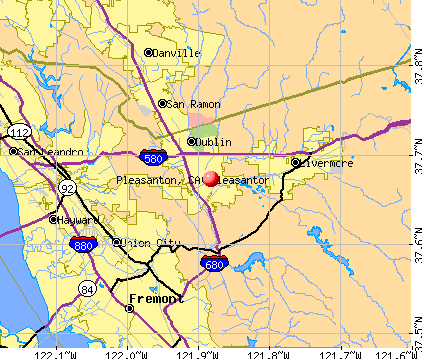


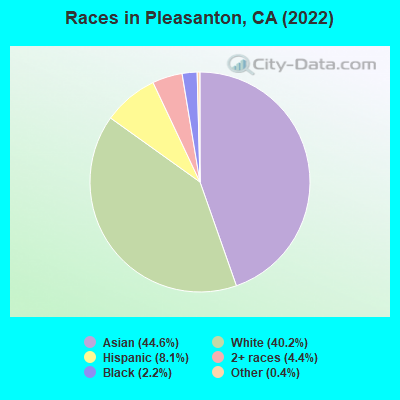
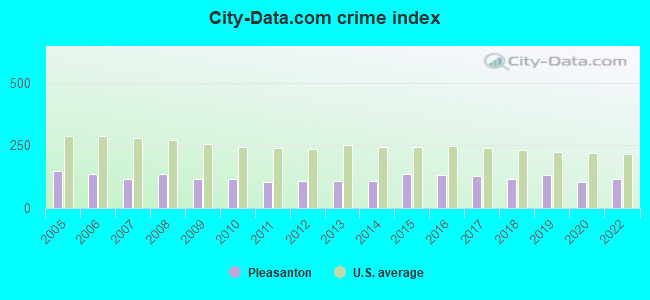
 Recent articles from our blog. Our writers, many of them Ph.D. graduates or candidates, create easy-to-read articles on a wide variety of topics.


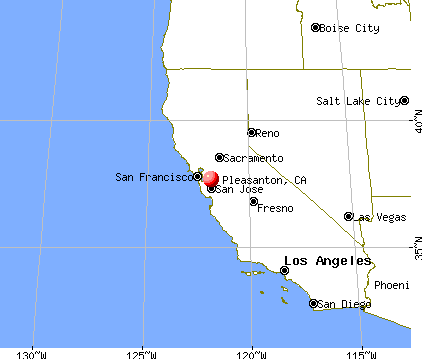
 (10.5 miles
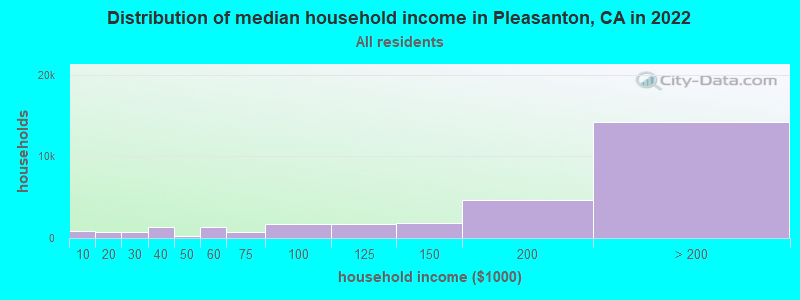
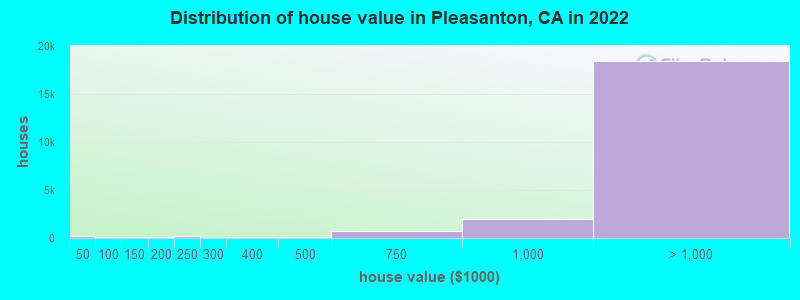
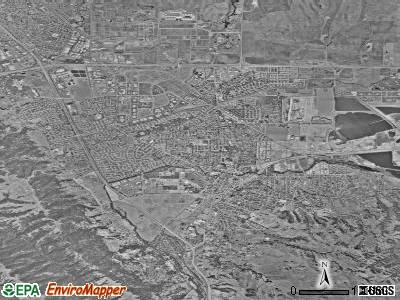
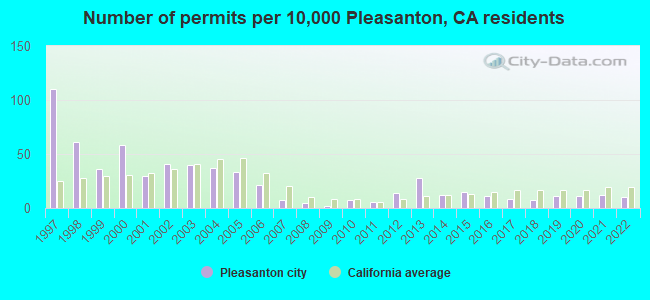
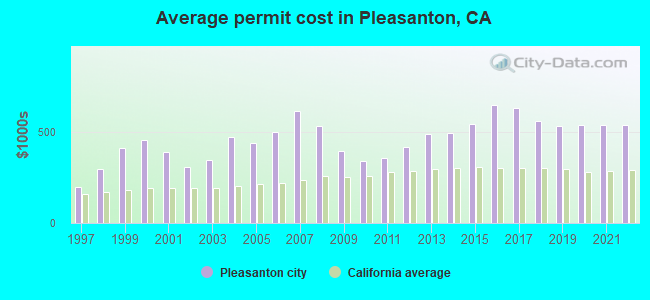
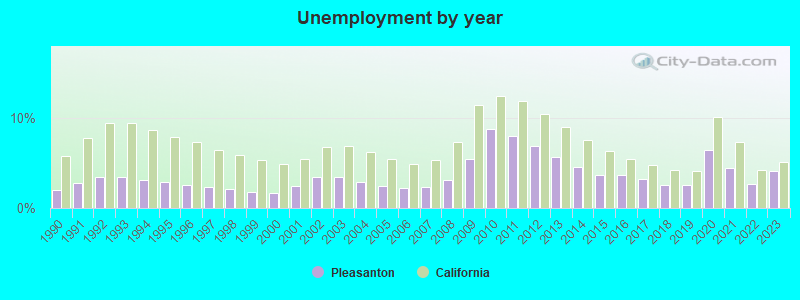
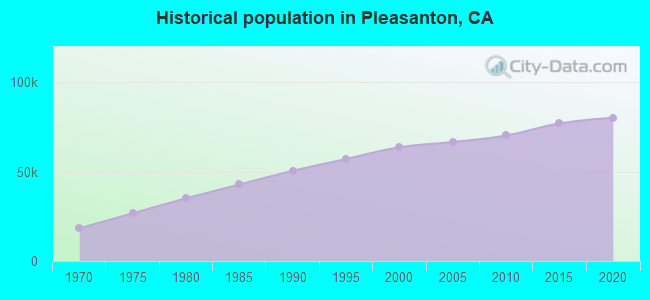
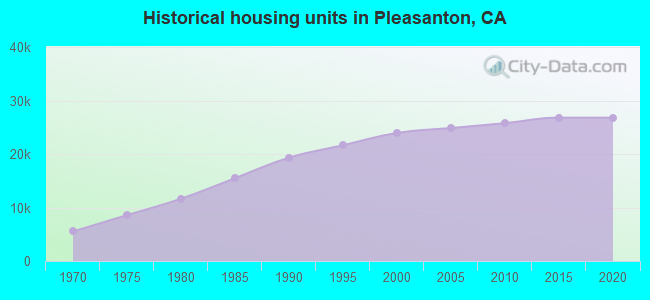
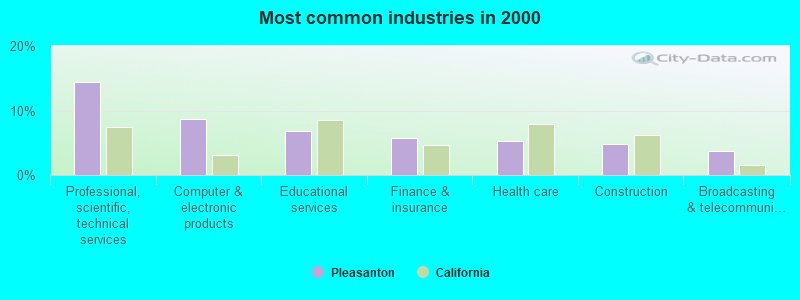
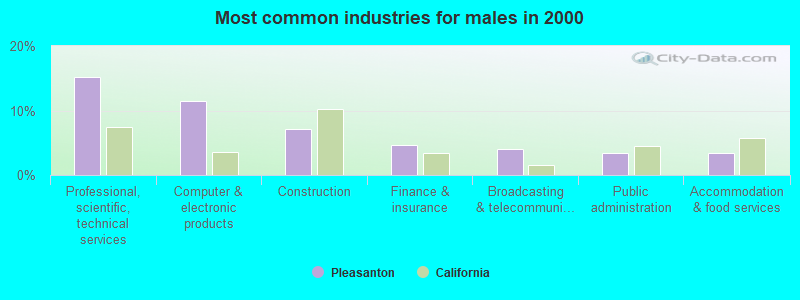
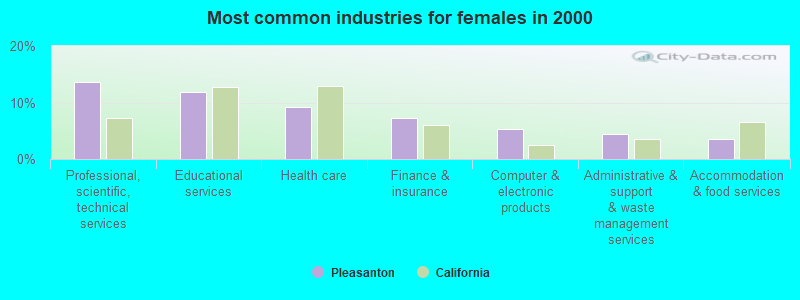
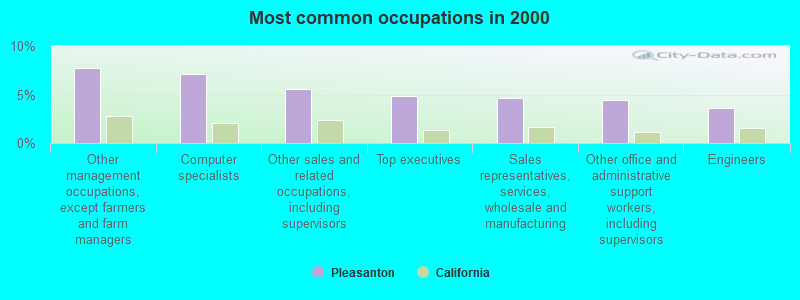
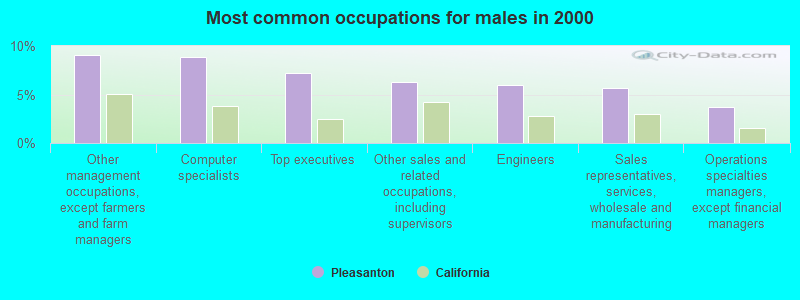
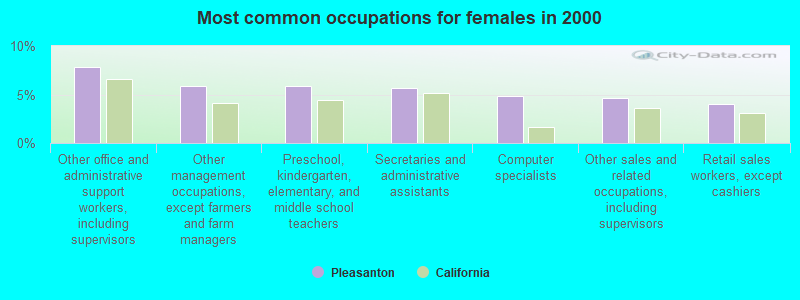
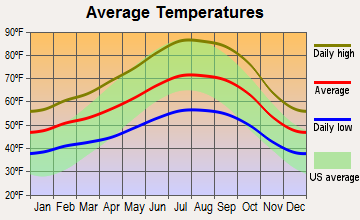
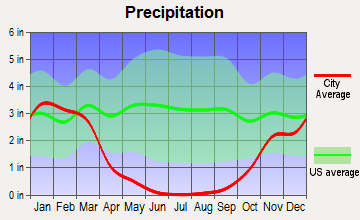
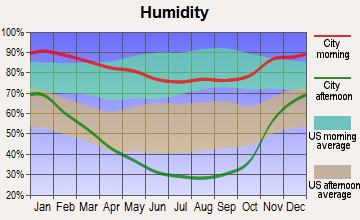
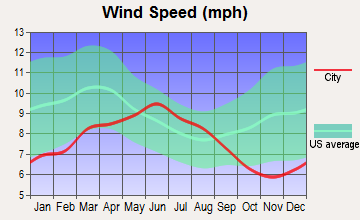
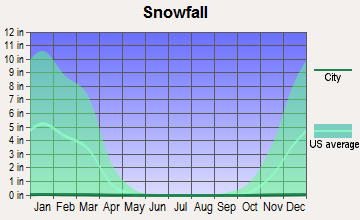
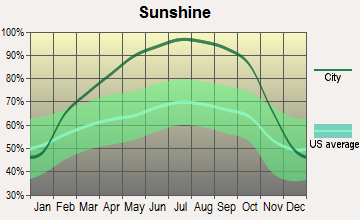
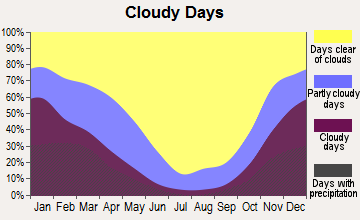
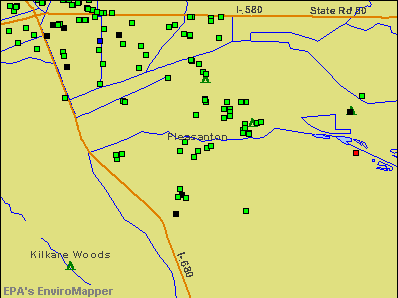

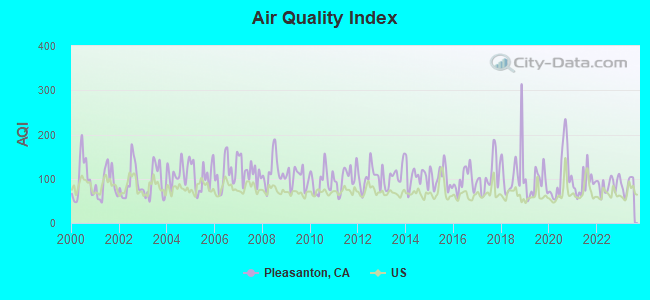
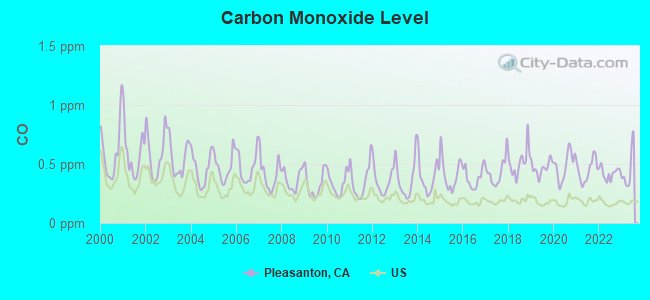
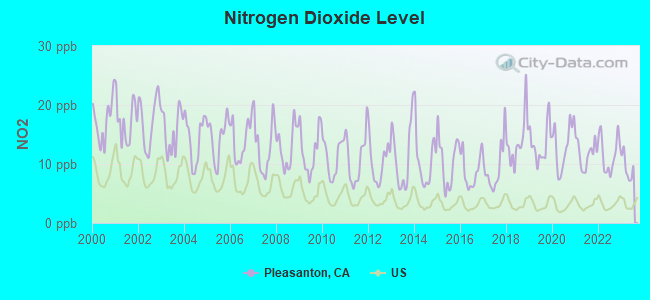
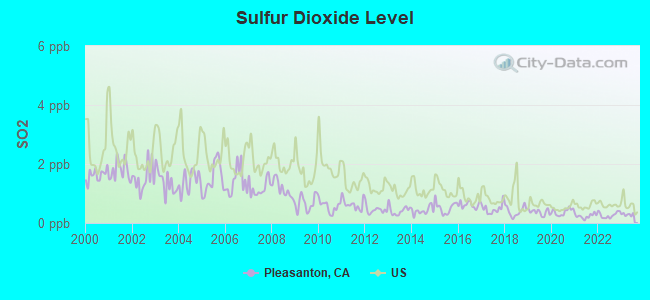
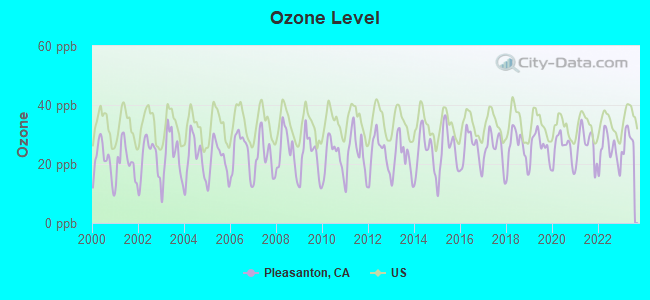
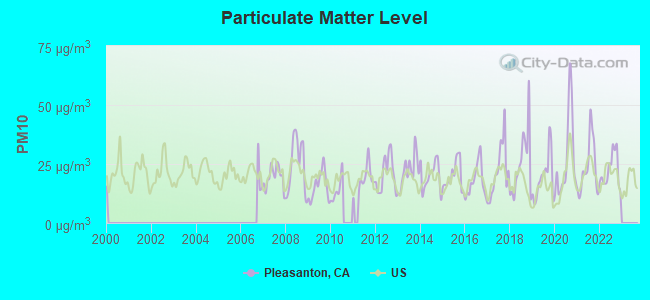
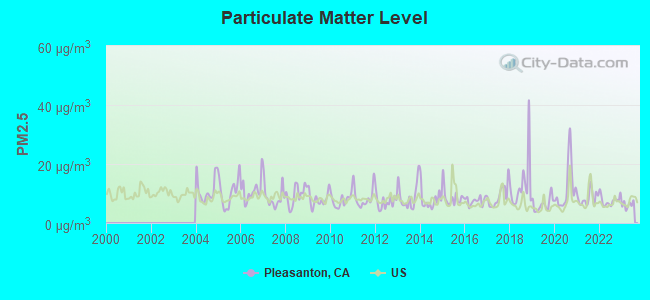
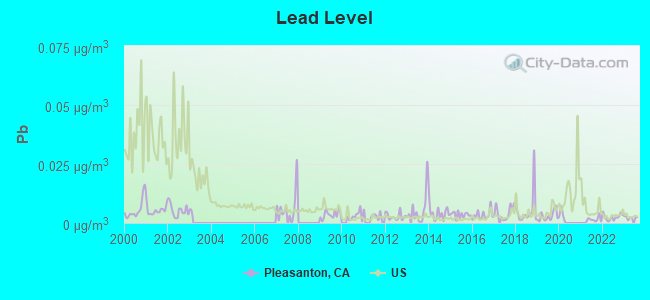
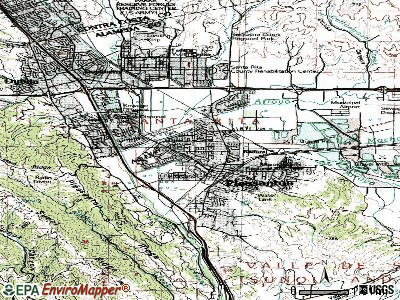
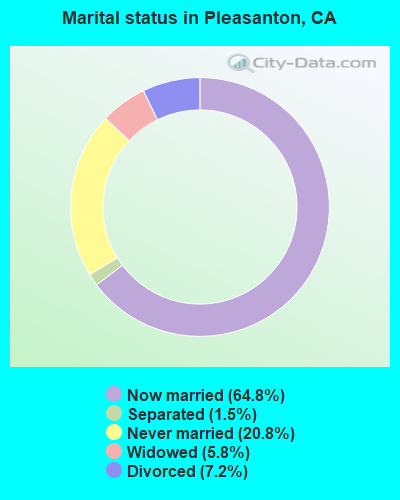
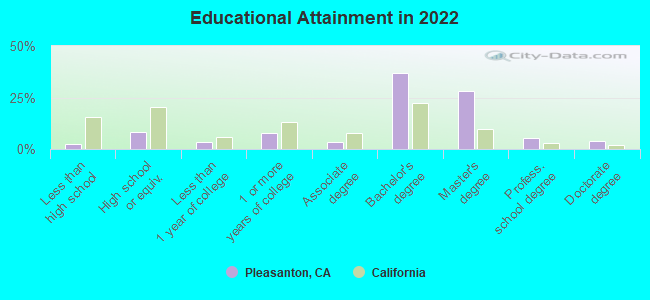
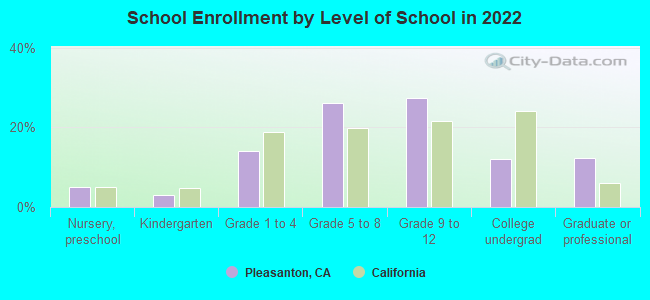
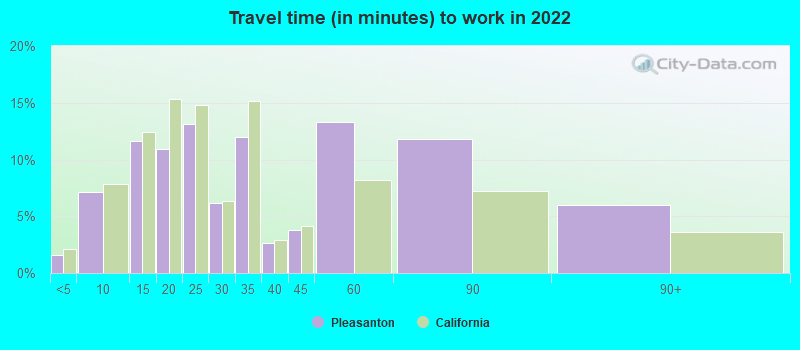
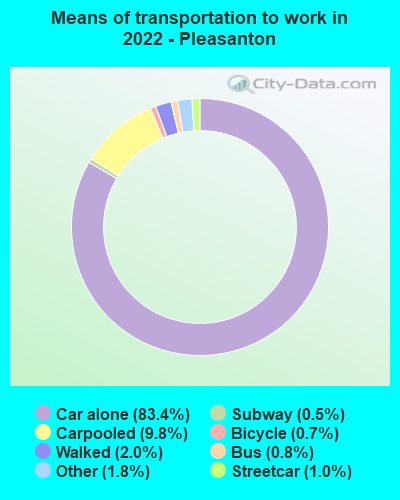
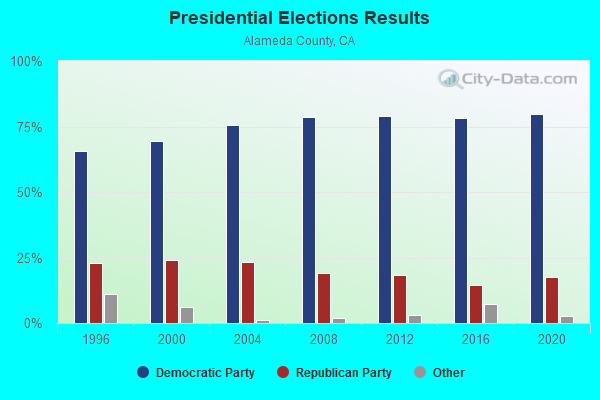
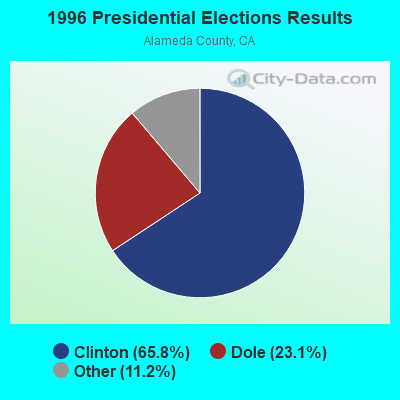
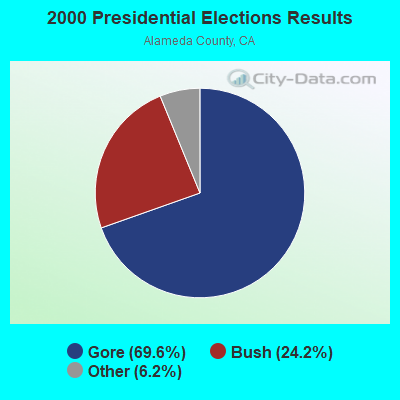
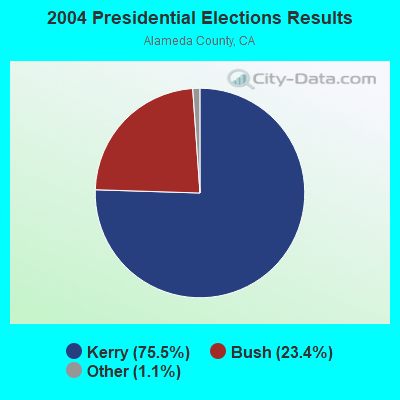
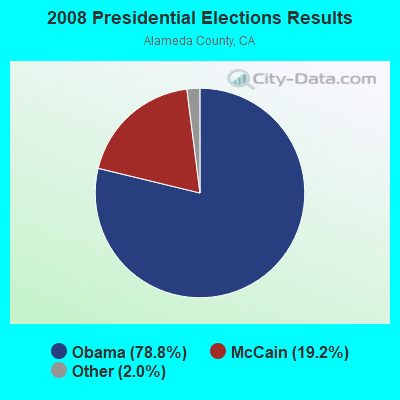

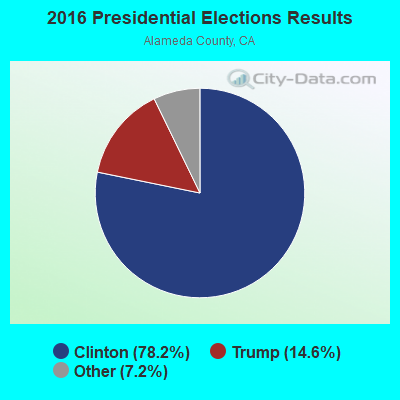
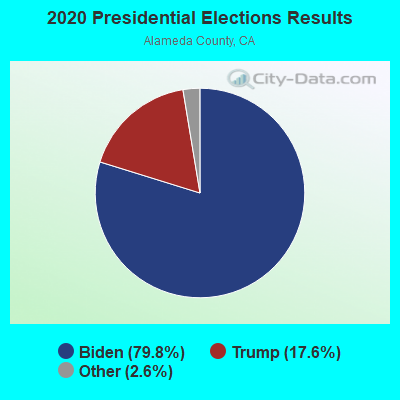
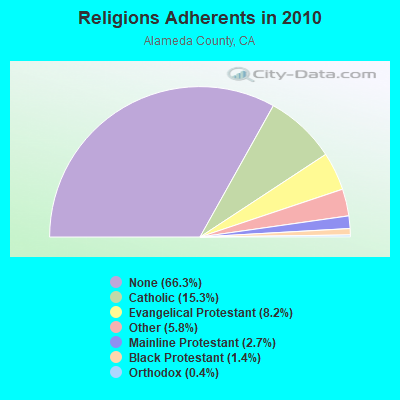
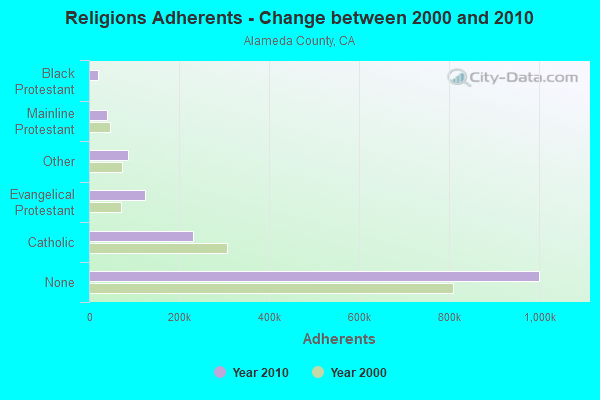
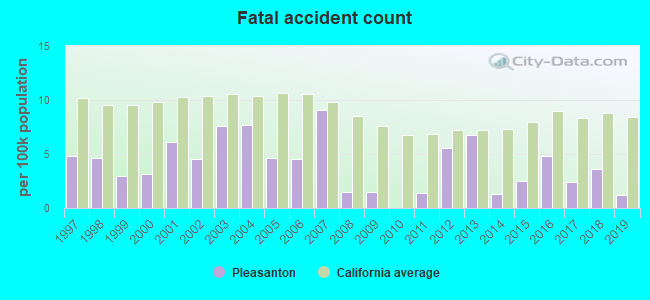
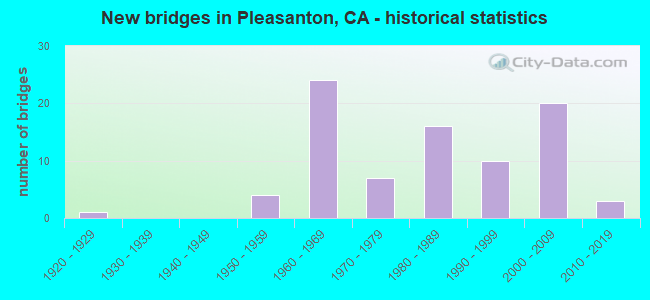
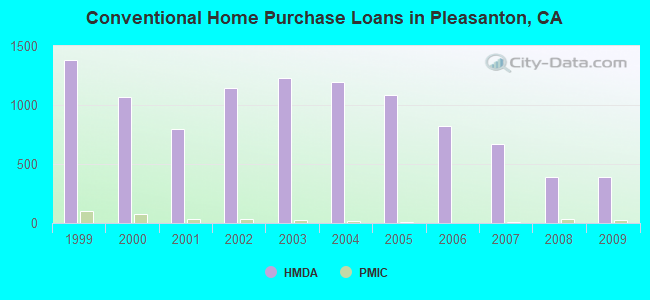
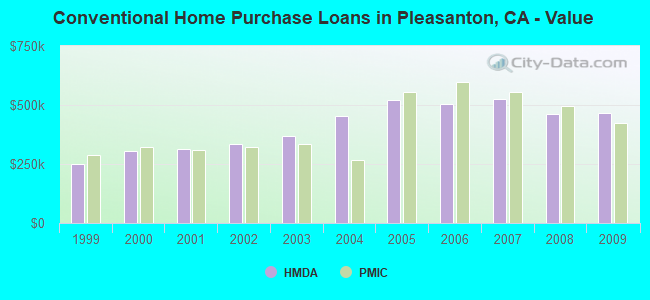
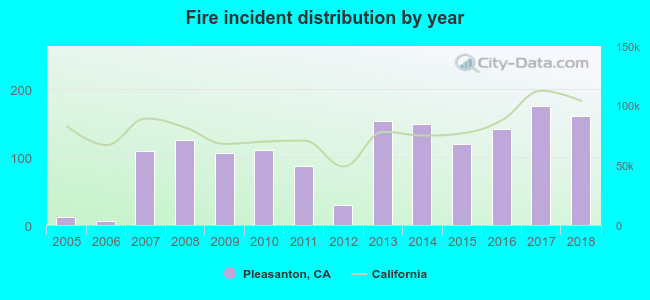 According to the data from the years 2005 - 2018 the average number of fires per year is 106. The highest number of reported fires - 176 took place in 2017, and the least - 6 in 2006. The data has a growing trend.
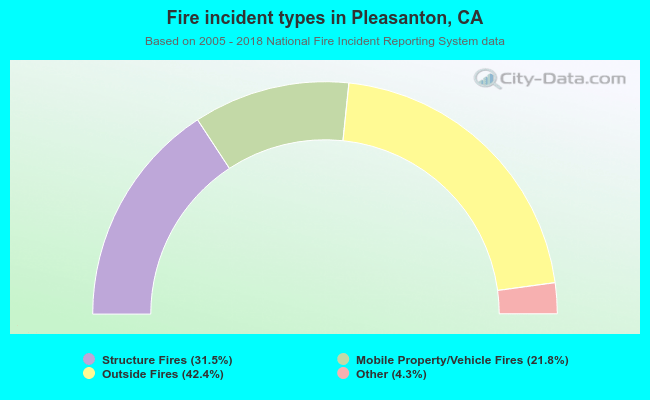 When looking into fire subcategories, the most incidents belonged to: Outside Fires (42.4%), and Structure Fires (31.5%).