Pontiac, Michigan Submit your own pictures of this city and show them to the world
OSM Map
General Map
Google Map
MSN Map
OSM Map
General Map
Google Map
MSN Map
OSM Map
General Map
Google Map
MSN Map
OSM Map
General Map
Google Map
MSN Map
Please wait while loading the map...
Population in 2022: 61,854 (100% urban, 0% rural). Population change since 2000: -6.8%Males: 29,927 Females: 31,927
March 2022 cost of living index in Pontiac: 94.9 (less than average, U.S. average is 100) Percentage of residents living in poverty in 2022: 26.7%for White Non-Hispanic residents , 24.4% for Black residents , 39.3% for Hispanic or Latino residents , 0.6% for American Indian residents , 22.8% for other race residents , 34.0% for two or more races residents )
Profiles of local businesses
Business Search - 14 Million verified businesses
Data:
Median household income ($)
Median household income (% change since 2000)
Household income diversity
Ratio of average income to average house value (%)
Ratio of average income to average rent
Median household income ($) - White
Median household income ($) - Black or African American
Median household income ($) - Asian
Median household income ($) - Hispanic or Latino
Median household income ($) - American Indian and Alaska Native
Median household income ($) - Multirace
Median household income ($) - Other Race
Median household income for houses/condos with a mortgage ($)
Median household income for apartments without a mortgage ($)
Races - White alone (%)
Races - White alone (% change since 2000)
Races - Black alone (%)
Races - Black alone (% change since 2000)
Races - American Indian alone (%)
Races - American Indian alone (% change since 2000)
Races - Asian alone (%)
Races - Asian alone (% change since 2000)
Races - Hispanic (%)
Races - Hispanic (% change since 2000)
Races - Native Hawaiian and Other Pacific Islander alone (%)
Races - Native Hawaiian and Other Pacific Islander alone (% change since 2000)
Races - Two or more races (%)
Races - Two or more races (% change since 2000)
Races - Other race alone (%)
Races - Other race alone (% change since 2000)
Racial diversity
Unemployment (%)
Unemployment (% change since 2000)
Unemployment (%) - White
Unemployment (%) - Black or African American
Unemployment (%) - Asian
Unemployment (%) - Hispanic or Latino
Unemployment (%) - American Indian and Alaska Native
Unemployment (%) - Multirace
Unemployment (%) - Other Race
Population density (people per square mile)
Population - Males (%)
Population - Females (%)
Population - Males (%) - White
Population - Males (%) - Black or African American
Population - Males (%) - Asian
Population - Males (%) - Hispanic or Latino
Population - Males (%) - American Indian and Alaska Native
Population - Males (%) - Multirace
Population - Males (%) - Other Race
Population - Females (%) - White
Population - Females (%) - Black or African American
Population - Females (%) - Asian
Population - Females (%) - Hispanic or Latino
Population - Females (%) - American Indian and Alaska Native
Population - Females (%) - Multirace
Population - Females (%) - Other Race
Coronavirus confirmed cases (Apr 24, 2024)
Deaths caused by coronavirus (Apr 24, 2024)
Coronavirus confirmed cases (per 100k population) (Apr 24, 2024)
Deaths caused by coronavirus (per 100k population) (Apr 24, 2024)
Daily increase in number of cases (Apr 24, 2024)
Weekly increase in number of cases (Apr 24, 2024)
Cases doubled (in days) (Apr 24, 2024)
Hospitalized patients (Apr 18, 2022)
Negative test results (Apr 18, 2022)
Total test results (Apr 18, 2022)
COVID Vaccine doses distributed (per 100k population) (Sep 19, 2023)
COVID Vaccine doses administered (per 100k population) (Sep 19, 2023)
COVID Vaccine doses distributed (Sep 19, 2023)
COVID Vaccine doses administered (Sep 19, 2023)
Likely homosexual households (%)
Likely homosexual households (% change since 2000)
Likely homosexual households - Lesbian couples (%)
Likely homosexual households - Lesbian couples (% change since 2000)
Likely homosexual households - Gay men (%)
Likely homosexual households - Gay men (% change since 2000)
Cost of living index
Median gross rent ($)
Median contract rent ($)
Median monthly housing costs ($)
Median house or condo value ($)
Median house or condo value ($ change since 2000)
Mean house or condo value by units in structure - 1, detached ($)
Mean house or condo value by units in structure - 1, attached ($)
Mean house or condo value by units in structure - 2 ($)
Mean house or condo value by units in structure by units in structure - 3 or 4 ($)
Mean house or condo value by units in structure - 5 or more ($)
Mean house or condo value by units in structure - Boat, RV, van, etc. ($)
Mean house or condo value by units in structure - Mobile home ($)
Median house or condo value ($) - White
Median house or condo value ($) - Black or African American
Median house or condo value ($) - Asian
Median house or condo value ($) - Hispanic or Latino
Median house or condo value ($) - American Indian and Alaska Native
Median house or condo value ($) - Multirace
Median house or condo value ($) - Other Race
Median resident age
Resident age diversity
Median resident age - Males
Median resident age - Females
Median resident age - White
Median resident age - Black or African American
Median resident age - Asian
Median resident age - Hispanic or Latino
Median resident age - American Indian and Alaska Native
Median resident age - Multirace
Median resident age - Other Race
Median resident age - Males - White
Median resident age - Males - Black or African American
Median resident age - Males - Asian
Median resident age - Males - Hispanic or Latino
Median resident age - Males - American Indian and Alaska Native
Median resident age - Males - Multirace
Median resident age - Males - Other Race
Median resident age - Females - White
Median resident age - Females - Black or African American
Median resident age - Females - Asian
Median resident age - Females - Hispanic or Latino
Median resident age - Females - American Indian and Alaska Native
Median resident age - Females - Multirace
Median resident age - Females - Other Race
Commute - mean travel time to work (minutes)
Travel time to work - Less than 5 minutes (%)
Travel time to work - Less than 5 minutes (% change since 2000)
Travel time to work - 5 to 9 minutes (%)
Travel time to work - 5 to 9 minutes (% change since 2000)
Travel time to work - 10 to 19 minutes (%)
Travel time to work - 10 to 19 minutes (% change since 2000)
Travel time to work - 20 to 29 minutes (%)
Travel time to work - 20 to 29 minutes (% change since 2000)
Travel time to work - 30 to 39 minutes (%)
Travel time to work - 30 to 39 minutes (% change since 2000)
Travel time to work - 40 to 59 minutes (%)
Travel time to work - 40 to 59 minutes (% change since 2000)
Travel time to work - 60 to 89 minutes (%)
Travel time to work - 60 to 89 minutes (% change since 2000)
Travel time to work - 90 or more minutes (%)
Travel time to work - 90 or more minutes (% change since 2000)
Marital status - Never married (%)
Marital status - Now married (%)
Marital status - Separated (%)
Marital status - Widowed (%)
Marital status - Divorced (%)
Median family income ($)
Median family income (% change since 2000)
Median non-family income ($)
Median non-family income (% change since 2000)
Median per capita income ($)
Median per capita income (% change since 2000)
Median family income ($) - White
Median family income ($) - Black or African American
Median family income ($) - Asian
Median family income ($) - Hispanic or Latino
Median family income ($) - American Indian and Alaska Native
Median family income ($) - Multirace
Median family income ($) - Other Race
Median year house/condo built
Median year apartment built
Year house built - Built 2005 or later (%)
Year house built - Built 2000 to 2004 (%)
Year house built - Built 1990 to 1999 (%)
Year house built - Built 1980 to 1989 (%)
Year house built - Built 1970 to 1979 (%)
Year house built - Built 1960 to 1969 (%)
Year house built - Built 1950 to 1959 (%)
Year house built - Built 1940 to 1949 (%)
Year house built - Built 1939 or earlier (%)
Average household size
Household density (households per square mile)
Average household size - White
Average household size - Black or African American
Average household size - Asian
Average household size - Hispanic or Latino
Average household size - American Indian and Alaska Native
Average household size - Multirace
Average household size - Other Race
Occupied housing units (%)
Vacant housing units (%)
Owner occupied housing units (%)
Renter occupied housing units (%)
Vacancy status - For rent (%)
Vacancy status - For sale only (%)
Vacancy status - Rented or sold, not occupied (%)
Vacancy status - For seasonal, recreational, or occasional use (%)
Vacancy status - For migrant workers (%)
Vacancy status - Other vacant (%)
Residents with income below the poverty level (%)
Residents with income below 50% of the poverty level (%)
Children below poverty level (%)
Poor families by family type - Married-couple family (%)
Poor families by family type - Male, no wife present (%)
Poor families by family type - Female, no husband present (%)
Poverty status for native-born residents (%)
Poverty status for foreign-born residents (%)
Poverty among high school graduates not in families (%)
Poverty among people who did not graduate high school not in families (%)
Residents with income below the poverty level (%) - White
Residents with income below the poverty level (%) - Black or African American
Residents with income below the poverty level (%) - Asian
Residents with income below the poverty level (%) - Hispanic or Latino
Residents with income below the poverty level (%) - American Indian and Alaska Native
Residents with income below the poverty level (%) - Multirace
Residents with income below the poverty level (%) - Other Race
Air pollution - Air Quality Index (AQI)
Air pollution - CO
Air pollution - NO2
Air pollution - SO2
Air pollution - Ozone
Air pollution - PM10
Air pollution - PM25
Air pollution - Pb
Crime - Murders per 100,000 population
Crime - Rapes per 100,000 population
Crime - Robberies per 100,000 population
Crime - Assaults per 100,000 population
Crime - Burglaries per 100,000 population
Crime - Thefts per 100,000 population
Crime - Auto thefts per 100,000 population
Crime - Arson per 100,000 population
Crime - City-data.com crime index
Crime - Violent crime index
Crime - Property crime index
Crime - Murders per 100,000 population (5 year average)
Crime - Rapes per 100,000 population (5 year average)
Crime - Robberies per 100,000 population (5 year average)
Crime - Assaults per 100,000 population (5 year average)
Crime - Burglaries per 100,000 population (5 year average)
Crime - Thefts per 100,000 population (5 year average)
Crime - Auto thefts per 100,000 population (5 year average)
Crime - Arson per 100,000 population (5 year average)
Crime - City-data.com crime index (5 year average)
Crime - Violent crime index (5 year average)
Crime - Property crime index (5 year average)
1996 Presidential Elections Results (%) - Democratic Party (Clinton)
1996 Presidential Elections Results (%) - Republican Party (Dole)
1996 Presidential Elections Results (%) - Other
2000 Presidential Elections Results (%) - Democratic Party (Gore)
2000 Presidential Elections Results (%) - Republican Party (Bush)
2000 Presidential Elections Results (%) - Other
2004 Presidential Elections Results (%) - Democratic Party (Kerry)
2004 Presidential Elections Results (%) - Republican Party (Bush)
2004 Presidential Elections Results (%) - Other
2008 Presidential Elections Results (%) - Democratic Party (Obama)
2008 Presidential Elections Results (%) - Republican Party (McCain)
2008 Presidential Elections Results (%) - Other
2012 Presidential Elections Results (%) - Democratic Party (Obama)
2012 Presidential Elections Results (%) - Republican Party (Romney)
2012 Presidential Elections Results (%) - Other
2016 Presidential Elections Results (%) - Democratic Party (Clinton)
2016 Presidential Elections Results (%) - Republican Party (Trump)
2016 Presidential Elections Results (%) - Other
2020 Presidential Elections Results (%) - Democratic Party (Biden)
2020 Presidential Elections Results (%) - Republican Party (Trump)
2020 Presidential Elections Results (%) - Other
Ancestries Reported - Arab (%)
Ancestries Reported - Czech (%)
Ancestries Reported - Danish (%)
Ancestries Reported - Dutch (%)
Ancestries Reported - English (%)
Ancestries Reported - French (%)
Ancestries Reported - French Canadian (%)
Ancestries Reported - German (%)
Ancestries Reported - Greek (%)
Ancestries Reported - Hungarian (%)
Ancestries Reported - Irish (%)
Ancestries Reported - Italian (%)
Ancestries Reported - Lithuanian (%)
Ancestries Reported - Norwegian (%)
Ancestries Reported - Polish (%)
Ancestries Reported - Portuguese (%)
Ancestries Reported - Russian (%)
Ancestries Reported - Scotch-Irish (%)
Ancestries Reported - Scottish (%)
Ancestries Reported - Slovak (%)
Ancestries Reported - Subsaharan African (%)
Ancestries Reported - Swedish (%)
Ancestries Reported - Swiss (%)
Ancestries Reported - Ukrainian (%)
Ancestries Reported - United States (%)
Ancestries Reported - Welsh (%)
Ancestries Reported - West Indian (%)
Ancestries Reported - Other (%)
Educational Attainment - No schooling completed (%)
Educational Attainment - Less than high school (%)
Educational Attainment - High school or equivalent (%)
Educational Attainment - Less than 1 year of college (%)
Educational Attainment - 1 or more years of college (%)
Educational Attainment - Associate degree (%)
Educational Attainment - Bachelor's degree (%)
Educational Attainment - Master's degree (%)
Educational Attainment - Professional school degree (%)
Educational Attainment - Doctorate degree (%)
School Enrollment - Nursery, preschool (%)
School Enrollment - Kindergarten (%)
School Enrollment - Grade 1 to 4 (%)
School Enrollment - Grade 5 to 8 (%)
School Enrollment - Grade 9 to 12 (%)
School Enrollment - College undergrad (%)
School Enrollment - Graduate or professional (%)
School Enrollment - Not enrolled in school (%)
School enrollment - Public schools (%)
School enrollment - Private schools (%)
School enrollment - Not enrolled (%)
Median number of rooms in houses and condos
Median number of rooms in apartments
Housing units lacking complete plumbing facilities (%)
Housing units lacking complete kitchen facilities (%)
Density of houses
Urban houses (%)
Rural houses (%)
Households with people 60 years and over (%)
Households with people 65 years and over (%)
Households with people 75 years and over (%)
Households with one or more nonrelatives (%)
Households with no nonrelatives (%)
Population in households (%)
Family households (%)
Nonfamily households (%)
Population in families (%)
Family households with own children (%)
Median number of bedrooms in owner occupied houses
Mean number of bedrooms in owner occupied houses
Median number of bedrooms in renter occupied houses
Mean number of bedrooms in renter occupied houses
Median number of vehichles in owner occupied houses
Mean number of vehichles in owner occupied houses
Median number of vehichles in renter occupied houses
Mean number of vehichles in renter occupied houses
Mortgage status - with mortgage (%)
Mortgage status - with second mortgage (%)
Mortgage status - with home equity loan (%)
Mortgage status - with both second mortgage and home equity loan (%)
Mortgage status - without a mortgage (%)
Average family size
Average family size - White
Average family size - Black or African American
Average family size - Asian
Average family size - Hispanic or Latino
Average family size - American Indian and Alaska Native
Average family size - Multirace
Average family size - Other Race
Geographical mobility - Same house 1 year ago (%)
Geographical mobility - Moved within same county (%)
Geographical mobility - Moved from different county within same state (%)
Geographical mobility - Moved from different state (%)
Geographical mobility - Moved from abroad (%)
Place of birth - Born in state of residence (%)
Place of birth - Born in other state (%)
Place of birth - Native, outside of US (%)
Place of birth - Foreign born (%)
Housing units in structures - 1, detached (%)
Housing units in structures - 1, attached (%)
Housing units in structures - 2 (%)
Housing units in structures - 3 or 4 (%)
Housing units in structures - 5 to 9 (%)
Housing units in structures - 10 to 19 (%)
Housing units in structures - 20 to 49 (%)
Housing units in structures - 50 or more (%)
Housing units in structures - Mobile home (%)
Housing units in structures - Boat, RV, van, etc. (%)
House/condo owner moved in on average (years ago)
Renter moved in on average (years ago)
Year householder moved into unit - Moved in 1999 to March 2000 (%)
Year householder moved into unit - Moved in 1995 to 1998 (%)
Year householder moved into unit - Moved in 1990 to 1994 (%)
Year householder moved into unit - Moved in 1980 to 1989 (%)
Year householder moved into unit - Moved in 1970 to 1979 (%)
Year householder moved into unit - Moved in 1969 or earlier (%)
Means of transportation to work - Drove car alone (%)
Means of transportation to work - Carpooled (%)
Means of transportation to work - Public transportation (%)
Means of transportation to work - Bus or trolley bus (%)
Means of transportation to work - Streetcar or trolley car (%)
Means of transportation to work - Subway or elevated (%)
Means of transportation to work - Railroad (%)
Means of transportation to work - Ferryboat (%)
Means of transportation to work - Taxicab (%)
Means of transportation to work - Motorcycle (%)
Means of transportation to work - Bicycle (%)
Means of transportation to work - Walked (%)
Means of transportation to work - Other means (%)
Working at home (%)
Industry diversity
Most Common Industries - Agriculture, forestry, fishing and hunting, and mining (%)
Most Common Industries - Agriculture, forestry, fishing and hunting (%)
Most Common Industries - Mining, quarrying, and oil and gas extraction (%)
Most Common Industries - Construction (%)
Most Common Industries - Manufacturing (%)
Most Common Industries - Wholesale trade (%)
Most Common Industries - Retail trade (%)
Most Common Industries - Transportation and warehousing, and utilities (%)
Most Common Industries - Transportation and warehousing (%)
Most Common Industries - Utilities (%)
Most Common Industries - Information (%)
Most Common Industries - Finance and insurance, and real estate and rental and leasing (%)
Most Common Industries - Finance and insurance (%)
Most Common Industries - Real estate and rental and leasing (%)
Most Common Industries - Professional, scientific, and management, and administrative and waste management services (%)
Most Common Industries - Professional, scientific, and technical services (%)
Most Common Industries - Management of companies and enterprises (%)
Most Common Industries - Administrative and support and waste management services (%)
Most Common Industries - Educational services, and health care and social assistance (%)
Most Common Industries - Educational services (%)
Most Common Industries - Health care and social assistance (%)
Most Common Industries - Arts, entertainment, and recreation, and accommodation and food services (%)
Most Common Industries - Arts, entertainment, and recreation (%)
Most Common Industries - Accommodation and food services (%)
Most Common Industries - Other services, except public administration (%)
Most Common Industries - Public administration (%)
Occupation diversity
Most Common Occupations - Management, business, science, and arts occupations (%)
Most Common Occupations - Management, business, and financial occupations (%)
Most Common Occupations - Management occupations (%)
Most Common Occupations - Business and financial operations occupations (%)
Most Common Occupations - Computer, engineering, and science occupations (%)
Most Common Occupations - Computer and mathematical occupations (%)
Most Common Occupations - Architecture and engineering occupations (%)
Most Common Occupations - Life, physical, and social science occupations (%)
Most Common Occupations - Education, legal, community service, arts, and media occupations (%)
Most Common Occupations - Community and social service occupations (%)
Most Common Occupations - Legal occupations (%)
Most Common Occupations - Education, training, and library occupations (%)
Most Common Occupations - Arts, design, entertainment, sports, and media occupations (%)
Most Common Occupations - Healthcare practitioners and technical occupations (%)
Most Common Occupations - Health diagnosing and treating practitioners and other technical occupations (%)
Most Common Occupations - Health technologists and technicians (%)
Most Common Occupations - Service occupations (%)
Most Common Occupations - Healthcare support occupations (%)
Most Common Occupations - Protective service occupations (%)
Most Common Occupations - Fire fighting and prevention, and other protective service workers including supervisors (%)
Most Common Occupations - Law enforcement workers including supervisors (%)
Most Common Occupations - Food preparation and serving related occupations (%)
Most Common Occupations - Building and grounds cleaning and maintenance occupations (%)
Most Common Occupations - Personal care and service occupations (%)
Most Common Occupations - Sales and office occupations (%)
Most Common Occupations - Sales and related occupations (%)
Most Common Occupations - Office and administrative support occupations (%)
Most Common Occupations - Natural resources, construction, and maintenance occupations (%)
Most Common Occupations - Farming, fishing, and forestry occupations (%)
Most Common Occupations - Construction and extraction occupations (%)
Most Common Occupations - Installation, maintenance, and repair occupations (%)
Most Common Occupations - Production, transportation, and material moving occupations (%)
Most Common Occupations - Production occupations (%)
Most Common Occupations - Transportation occupations (%)
Most Common Occupations - Material moving occupations (%)
People in Group quarters - Institutionalized population (%)
People in Group quarters - Correctional institutions (%)
People in Group quarters - Federal prisons and detention centers (%)
People in Group quarters - Halfway houses (%)
People in Group quarters - Local jails and other confinement facilities (including police lockups) (%)
People in Group quarters - Military disciplinary barracks (%)
People in Group quarters - State prisons (%)
People in Group quarters - Other types of correctional institutions (%)
People in Group quarters - Nursing homes (%)
People in Group quarters - Hospitals/wards, hospices, and schools for the handicapped (%)
People in Group quarters - Hospitals/wards and hospices for chronically ill (%)
People in Group quarters - Hospices or homes for chronically ill (%)
People in Group quarters - Military hospitals or wards for chronically ill (%)
People in Group quarters - Other hospitals or wards for chronically ill (%)
People in Group quarters - Hospitals or wards for drug/alcohol abuse (%)
People in Group quarters - Mental (Psychiatric) hospitals or wards (%)
People in Group quarters - Schools, hospitals, or wards for the mentally retarded (%)
People in Group quarters - Schools, hospitals, or wards for the physically handicapped (%)
People in Group quarters - Institutions for the deaf (%)
People in Group quarters - Institutions for the blind (%)
People in Group quarters - Orthopedic wards and institutions for the physically handicapped (%)
People in Group quarters - Wards in general hospitals for patients who have no usual home elsewhere (%)
People in Group quarters - Wards in military hospitals for patients who have no usual home elsewhere (%)
People in Group quarters - Juvenile institutions (%)
People in Group quarters - Long-term care (%)
People in Group quarters - Homes for abused, dependent, and neglected children (%)
People in Group quarters - Residential treatment centers for emotionally disturbed children (%)
People in Group quarters - Training schools for juvenile delinquents (%)
People in Group quarters - Short-term care, detention or diagnostic centers for delinquent children (%)
People in Group quarters - Type of juvenile institution unknown (%)
People in Group quarters - Noninstitutionalized population (%)
People in Group quarters - College dormitories (includes college quarters off campus) (%)
People in Group quarters - Military quarters (%)
People in Group quarters - On base (%)
People in Group quarters - Barracks, unaccompanied personnel housing (UPH), (Enlisted/Officer), ;and similar group living quarters for military personnel (%)
People in Group quarters - Transient quarters for temporary residents (%)
People in Group quarters - Military ships (%)
People in Group quarters - Group homes (%)
People in Group quarters - Homes or halfway houses for drug/alcohol abuse (%)
People in Group quarters - Homes for the mentally ill (%)
People in Group quarters - Homes for the mentally retarded (%)
People in Group quarters - Homes for the physically handicapped (%)
People in Group quarters - Other group homes (%)
People in Group quarters - Religious group quarters (%)
People in Group quarters - Dormitories (%)
People in Group quarters - Agriculture workers' dormitories on farms (%)
People in Group quarters - Job Corps and vocational training facilities (%)
People in Group quarters - Other workers' dormitories (%)
People in Group quarters - Crews of maritime vessels (%)
People in Group quarters - Other nonhousehold living situations (%)
People in Group quarters - Other noninstitutional group quarters (%)
Residents speaking English at home (%)
Residents speaking English at home - Born in the United States (%)
Residents speaking English at home - Native, born elsewhere (%)
Residents speaking English at home - Foreign born (%)
Residents speaking Spanish at home (%)
Residents speaking Spanish at home - Born in the United States (%)
Residents speaking Spanish at home - Native, born elsewhere (%)
Residents speaking Spanish at home - Foreign born (%)
Residents speaking other language at home (%)
Residents speaking other language at home - Born in the United States (%)
Residents speaking other language at home - Native, born elsewhere (%)
Residents speaking other language at home - Foreign born (%)
Class of Workers - Employee of private company (%)
Class of Workers - Self-employed in own incorporated business (%)
Class of Workers - Private not-for-profit wage and salary workers (%)
Class of Workers - Local government workers (%)
Class of Workers - State government workers (%)
Class of Workers - Federal government workers (%)
Class of Workers - Self-employed workers in own not incorporated business and Unpaid family workers (%)
House heating fuel used in houses and condos - Utility gas (%)
House heating fuel used in houses and condos - Bottled, tank, or LP gas (%)
House heating fuel used in houses and condos - Electricity (%)
House heating fuel used in houses and condos - Fuel oil, kerosene, etc. (%)
House heating fuel used in houses and condos - Coal or coke (%)
House heating fuel used in houses and condos - Wood (%)
House heating fuel used in houses and condos - Solar energy (%)
House heating fuel used in houses and condos - Other fuel (%)
House heating fuel used in houses and condos - No fuel used (%)
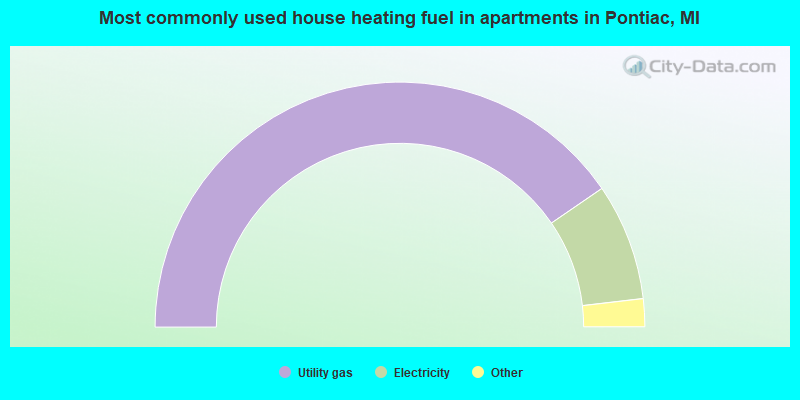
House heating fuel used in apartments - Utility gas (%)
House heating fuel used in apartments - Bottled, tank, or LP gas (%)
House heating fuel used in apartments - Electricity (%)
House heating fuel used in apartments - Fuel oil, kerosene, etc. (%)
House heating fuel used in apartments - Coal or coke (%)
House heating fuel used in apartments - Wood (%)
House heating fuel used in apartments - Solar energy (%)
House heating fuel used in apartments - Other fuel (%)
House heating fuel used in apartments - No fuel used (%)
Armed forces status - In Armed Forces (%)
Armed forces status - Civilian (%)
Armed forces status - Civilian - Veteran (%)
Armed forces status - Civilian - Nonveteran (%)
Fatal accidents locations in years 2005-2021
Fatal accidents locations in 2005
Fatal accidents locations in 2006
Fatal accidents locations in 2007
Fatal accidents locations in 2008
Fatal accidents locations in 2009
Fatal accidents locations in 2010
Fatal accidents locations in 2011
Fatal accidents locations in 2012
Fatal accidents locations in 2013
Fatal accidents locations in 2014
Fatal accidents locations in 2015
Fatal accidents locations in 2016
Fatal accidents locations in 2017
Fatal accidents locations in 2018
Fatal accidents locations in 2019
Fatal accidents locations in 2020
Fatal accidents locations in 2021
Alcohol use - People drinking some alcohol every month (%)
Alcohol use - People not drinking at all (%)
Alcohol use - Average days/month drinking alcohol
Alcohol use - Average drinks/week
Alcohol use - Average days/year people drink much
Audiometry - Average condition of hearing (%)
Audiometry - People that can hear a whisper from across a quiet room (%)
Audiometry - People that can hear normal voice from across a quiet room (%)
Audiometry - Ears ringing, roaring, buzzing (%)
Audiometry - Had a job exposure to loud noise (%)
Audiometry - Had off-work exposure to loud noise (%)
Blood Pressure & Cholesterol - Has high blood pressure (%)
Blood Pressure & Cholesterol - Checking blood pressure at home (%)
Blood Pressure & Cholesterol - Frequently checking blood cholesterol (%)
Blood Pressure & Cholesterol - Has high cholesterol level (%)
Consumer Behavior - Money monthly spent on food at supermarket/grocery store
Consumer Behavior - Money monthly spent on food at other stores
Consumer Behavior - Money monthly spent on eating out
Consumer Behavior - Money monthly spent on carryout/delivered foods
Consumer Behavior - Income spent on food at supermarket/grocery store (%)
Consumer Behavior - Income spent on food at other stores (%)
Consumer Behavior - Income spent on eating out (%)
Consumer Behavior - Income spent on carryout/delivered foods (%)
Current Health Status - General health condition (%)
Current Health Status - Blood donors (%)
Current Health Status - Has blood ever tested for HIV virus (%)
Current Health Status - Left-handed people (%)
Dermatology - People using sunscreen (%)
Diabetes - Diabetics (%)
Diabetes - Had a blood test for high blood sugar (%)
Diabetes - People taking insulin (%)
Diet Behavior & Nutrition - Diet health (%)
Diet Behavior & Nutrition - Milk product consumption (# of products/month)
Diet Behavior & Nutrition - Meals not home prepared (#/week)
Diet Behavior & Nutrition - Meals from fast food or pizza place (#/week)
Diet Behavior & Nutrition - Ready-to-eat foods (#/month)
Diet Behavior & Nutrition - Frozen meals/pizza (#/month)
Drug Use - People that ever used marijuana or hashish (%)
Drug Use - Ever used hard drugs (%)
Drug Use - Ever used any form of cocaine (%)
Drug Use - Ever used heroin (%)
Drug Use - Ever used methamphetamine (%)
Health Insurance - People covered by health insurance (%)
Kidney Conditions-Urology - Avg. # of times urinating at night
Medical Conditions - People with asthma (%)
Medical Conditions - People with anemia (%)
Medical Conditions - People with psoriasis (%)
Medical Conditions - People with overweight (%)
Medical Conditions - Elderly people having difficulties in thinking or remembering (%)
Medical Conditions - People who ever received blood transfusion (%)
Medical Conditions - People having trouble seeing even with glass/contacts (%)
Medical Conditions - People with arthritis (%)
Medical Conditions - People with gout (%)
Medical Conditions - People with congestive heart failure (%)
Medical Conditions - People with coronary heart disease (%)
Medical Conditions - People with angina pectoris (%)
Medical Conditions - People who ever had heart attack (%)
Medical Conditions - People who ever had stroke (%)
Medical Conditions - People with emphysema (%)
Medical Conditions - People with thyroid problem (%)
Medical Conditions - People with chronic bronchitis (%)
Medical Conditions - People with any liver condition (%)
Medical Conditions - People who ever had cancer or malignancy (%)
Mental Health - People who have little interest in doing things (%)
Mental Health - People feeling down, depressed, or hopeless (%)
Mental Health - People who have trouble sleeping or sleeping too much (%)
Mental Health - People feeling tired or having little energy (%)
Mental Health - People with poor appetite or overeating (%)
Mental Health - People feeling bad about themself (%)
Mental Health - People who have trouble concentrating on things (%)
Mental Health - People moving or speaking slowly or too fast (%)
Mental Health - People having thoughts they would be better off dead (%)
Oral Health - Average years since last visit a dentist
Oral Health - People embarrassed because of mouth (%)
Oral Health - People with gum disease (%)
Oral Health - General health of teeth and gums (%)
Oral Health - Average days a week using dental floss/device
Oral Health - Average days a week using mouthwash for dental problem
Oral Health - Average number of teeth
Pesticide Use - Households using pesticides to control insects (%)
Pesticide Use - Households using pesticides to kill weeds (%)
Physical Activity - People doing vigorous-intensity work activities (%)
Physical Activity - People doing moderate-intensity work activities (%)
Physical Activity - People walking or bicycling (%)
Physical Activity - People doing vigorous-intensity recreational activities (%)
Physical Activity - People doing moderate-intensity recreational activities (%)
Physical Activity - Average hours a day doing sedentary activities
Physical Activity - Average hours a day watching TV or videos
Physical Activity - Average hours a day using computer
Physical Functioning - People having limitations keeping them from working (%)
Physical Functioning - People limited in amount of work they can do (%)
Physical Functioning - People that need special equipment to walk (%)
Physical Functioning - People experiencing confusion/memory problems (%)
Physical Functioning - People requiring special healthcare equipment (%)
Prescription Medications - Average number of prescription medicines taking
Preventive Aspirin Use - Adults 40+ taking low-dose aspirin (%)
Reproductive Health - Vaginal deliveries (%)
Reproductive Health - Cesarean deliveries (%)
Reproductive Health - Deliveries resulted in a live birth (%)
Reproductive Health - Pregnancies resulted in a delivery (%)
Reproductive Health - Women breastfeeding newborns (%)
Reproductive Health - Women that had a hysterectomy (%)
Reproductive Health - Women that had both ovaries removed (%)
Reproductive Health - Women that have ever taken birth control pills (%)
Reproductive Health - Women taking birth control pills (%)
Reproductive Health - Women that have ever used Depo-Provera or injectables (%)
Reproductive Health - Women that have ever used female hormones (%)
Sexual Behavior - People 18+ that ever had sex (vaginal, anal, or oral) (%)
Sexual Behavior - Males 18+ that ever had vaginal sex with a woman (%)
Sexual Behavior - Males 18+ that ever performed oral sex on a woman (%)
Sexual Behavior - Males 18+ that ever had anal sex with a woman (%)
Sexual Behavior - Males 18+ that ever had any sex with a man (%)
Sexual Behavior - Females 18+ that ever had vaginal sex with a man (%)
Sexual Behavior - Females 18+ that ever performed oral sex on a man (%)
Sexual Behavior - Females 18+ that ever had anal sex with a man (%)
Sexual Behavior - Females 18+ that ever had any kind of sex with a woman (%)
Sexual Behavior - Average age people first had sex
Sexual Behavior - Average number of female sex partners in lifetime (males 18+)
Sexual Behavior - Average number of female vaginal sex partners in lifetime (males 18+)
Sexual Behavior - Average age people first performed oral sex on a woman (18+)
Sexual Behavior - Average number of woman performed oral sex on in lifetime (18+)
Sexual Behavior - Average number of male sex partners in lifetime (males 18+)
Sexual Behavior - Average number of male anal sex partners in lifetime (males 18+)
Sexual Behavior - Average age people first performed oral sex on a man (18+)
Sexual Behavior - Average number of male oral sex partners in lifetime (18+)
Sexual Behavior - People using protection when performing oral sex (%)
Sexual Behavior - Average number of times people have vaginal or anal sex a year
Sexual Behavior - People having sex without condom (%)
Sexual Behavior - Average number of male sex partners in lifetime (females 18+)
Sexual Behavior - Average number of male vaginal sex partners in lifetime (females 18+)
Sexual Behavior - Average number of female sex partners in lifetime (females 18+)
Sexual Behavior - Circumcised males 18+ (%)
Sleep Disorders - Average hours sleeping at night
Sleep Disorders - People that has trouble sleeping (%)
Smoking-Cigarette Use - People smoking cigarettes (%)
Taste & Smell - People 40+ having problems with smell (%)
Taste & Smell - People 40+ having problems with taste (%)
Taste & Smell - People 40+ that ever had wisdom teeth removed (%)
Taste & Smell - People 40+ that ever had tonsils teeth removed (%)
Taste & Smell - People 40+ that ever had a loss of consciousness because of a head injury (%)
Taste & Smell - People 40+ that ever had a broken nose or other serious injury to face or skull (%)
Taste & Smell - People 40+ that ever had two or more sinus infections (%)
Weight - Average height (inches)
Weight - Average weight (pounds)
Weight - Average BMI
Weight - People that are obese (%)
Weight - People that ever were obese (%)
Weight - People trying to lose weight (%)
The City-Data.com crime index weighs serious crimes and violent crimes more heavily. Higher means more crime, U.S. average is 246.1. It adjusts for the number of visitors and daily workers commuting into cities.
- means the value is smaller than the state average.
- means the value is about the same as the state average.
- means the value is bigger than the state average.
- means the value is much bigger than the state average.
Crime rate in Pontiac detailed stats: murders, rapes, robberies, assaults, burglaries, thefts, arson Officers per 1,000 residents here:
0.02Michigan average:
1.72
Latest news from Pontiac, MI collected exclusively by city-data.com from local newspapers, TV, and radio stations
Ancestries: English (2.7%), German (2.2%), American (1.9%), Irish (1.3%).
Current Local Time:
Land area: 20.0 square miles.
Population density: 3,094 people per square mile (average).
5,322 residents are foreign born (5.4% Latin America , 2.3% Asia ).
This city:
8.6%Michigan:
6.9%
Median real estate property taxes paid for housing units with mortgages in 2022: $1,312 (1.0%)Median real estate property taxes paid for housing units with no mortgage in 2022: $984 (1.2%)
Nearest city with pop. 200,000+: Detroit, MI
Nearest city with pop. 1,000,000+: Chicago, IL
Nearest cities:
Latitude: 42.65 N, Longitude: 83.29 W
Daytime population change due to commuting: +9,056 (+14.6%)Workers who live and work in this city: 7,746 (30.7%)
Single-family new house construction building permits:
2022: 4 buildings , average cost: $143,2002021: 5 buildings , average cost: $143,2002020: 6 buildings , average cost: $143,2002019: 3 buildings , average cost: $143,2002018: 3 buildings , average cost: $143,2002017: 12 buildings , average cost: $150,4002016: 30 buildings , average cost: $136,4002015: 8 buildings , average cost: $111,7002014: 26 buildings , average cost: $147,6002013: 16 buildings , average cost: $118,5002012: 25 buildings , average cost: $82,4002011: 26 buildings , average cost: $96,6002010: 37 buildings , average cost: $96,7002009: 38 buildings , average cost: $96,7002008: 44 buildings , average cost: $96,7002007: 74 buildings , average cost: $96,8002006: 109 buildings , average cost: $96,2002005: 140 buildings , average cost: $99,4002004: 186 buildings , average cost: $88,0002003: 213 buildings , average cost: $79,4002002: 186 buildings , average cost: $80,9002001: 237 buildings , average cost: $74,7002000: 210 buildings , average cost: $72,4001999: 203 buildings , average cost: $75,1001998: 117 buildings , average cost: $68,4001997: 76 buildings , average cost: $60,700Unemployment in December 2023:
Most common occupations in Pontiac, MI (%)
Both Males Females
Other production occupations, including supervisors (5.8%)
Building and grounds cleaning and maintenance occupations (5.6%)
Assemblers and fabricators (5.3%)
Metal workers and plastic workers (4.5%)
Other office and administrative support workers, including supervisors (3.7%)
Material recording, scheduling, dispatching, and distributing workers (3.5%)
Cooks and food preparation workers (3.0%)
Other production occupations, including supervisors (7.8%)
Metal workers and plastic workers (6.3%)
Assemblers and fabricators (6.1%)
Building and grounds cleaning and maintenance occupations (5.8%)
Driver/sales workers and truck drivers (4.6%)
Laborers and material movers, hand (4.6%)
Material recording, scheduling, dispatching, and distributing workers (4.4%)
Other office and administrative support workers, including supervisors (6.2%)
Building and grounds cleaning and maintenance occupations (5.4%)
Nursing, psychiatric, and home health aides (4.8%)
Cashiers (4.7%)
Secretaries and administrative assistants (4.6%)
Assemblers and fabricators (4.5%)
Information and record clerks, except customer service representatives (4.2%)
Tornado activity:
Pontiac-area historical tornado activity is slightly above Michigan state average. It is 40% greater than the overall U.S. average.
On 3/20/1976, a category F4 (max. wind speeds 207-260 mph) tornado 6.9 miles away from the Pontiac city center killed one person and injured 55 people and caused between $5,000,000 and $50,000,000 in damages.
On 7/4/1957, a category F4 tornado 12.4 miles away from the city center injured 6 people and caused between $50,000 and $500,000 in damages.
Earthquake activity:
Pontiac-area historical earthquake activity is significantly above Michigan state average. It is 48% smaller than the overall U.S. average. On 9/25/1998 at 19:52:52, a magnitude 5.2 (4.8 MB, 4.3 MS, 5.2 LG, 4.5 MW, Depth: 3.1 mi, Class: Moderate, Intensity: VI - VII) earthquake occurred 168.8 miles away from Pontiac center On 1/31/1986 at 16:46:43, a magnitude 5.0 (5.0 MB) earthquake occurred 131.1 miles away from the city center On 7/12/1986 at 08:19:37, a magnitude 4.5 (4.5 MB, Class: Light, Intensity: IV - V) earthquake occurred 156.2 miles away from Pontiac center On 5/2/2015 at 16:23:07, a magnitude 4.2 (4.2 MW, Depth: 2.8 mi) earthquake occurred 112.7 miles away from Pontiac center On 7/27/1980 at 18:52:21, a magnitude 5.2 (5.1 MB, 4.7 MS, 5.0 UK, 5.2 UK) earthquake occurred 309.1 miles away from the city center On 8/23/2011 at 17:51:04, a magnitude 5.8 (5.8 MW, Depth: 3.7 mi) earthquake occurred 432.5 miles away from Pontiac center Magnitude types: regional Lg-wave magnitude (LG), body-wave magnitude (MB), surface-wave magnitude (MS), moment magnitude (MW) Natural disasters: The number of natural disasters in Oakland County (12) is smaller than the US average (15).Major Disasters (Presidential) Declared: 6Emergencies Declared: 5Storms: 6, Floods: 5, Tornadoes: 3, Winter Storms: 2, Blizzard: 1, Hurricane: 1, Power Outage: 1, Snowstorm: 1, Wind: 1, Other: 1 (Note: some incidents may be assigned to more than one category). Hospitals in Pontiac: CLINTON VALLEY CENTER (provides emergency services, 140 ELIZABETH LAKE RD) DOCTORS' HOSPITAL OF MICHIGAN (Physician, 461 W HURON ST) MCLAREN OAKLAND (Voluntary non-profit - Private, 50 NORTH PERRY) SELECT SPECIALTY HOSPITAL-PONTIAC (44405 WOODWARD AVENUE, 8TH FLOOR) ST JOSEPH MERCY OAKLAND (Voluntary non-profit - Private, 44405 WOODWARD AVE) Nursing Homes in Pontiac: GROVECREST CONV CENTER (121 PRALL ST) OAKLAND GERIATRIC VILLAGE (1255 W SILVER BELL RD) ORCHARD HILLS-A MERCY LIVING CENTER AF (532 ORCHARD LAKE RD) Dialysis Facilities in Pontiac: GREENFIELD HS - PONTIAC (44200 WOODWARD AVE STE 109) NORTH OAKLAND KIDNEY CENTER OF DAVITA (450 NORTH TELEGRAPH) Home Health Centers in Pontiac: ADVANCED PROFESSIONAL HOME HEALTH CARE (35 S JOHNSON) LEGEND HOME CARE, INC (161 STATE ST, SUITE D) Amtrak station: PONTIAC (1600 WIDE TRACK DR.)
.
Services: partially wheelchair accessible, enclosed waiting area, public payphones, vending machines, free short-term parking, free long-term parking, call for taxi service, intercity bus service, public transit connection.
College/University in Pontiac: Dorsey Business Schools-Waterford Pontiac Full-time enrollment: 267; Location: 440 N Telegraph Rd; Private, for-profit; Website: www.dorsey.edu)
Colleges/universities with over 2000 students nearest to Pontiac:
Baker College of Auburn Hills (about 3 miles; Auburn Hills, MI ; Full-time enrollment: 2,284)
Oakland University (about 5 miles; Rochester Hills, MI ; FT enrollment: 16,449)
Oakland Community College (about 8 miles; Bloomfield Hills, MI ; FT enrollment: 18,956)
Lawrence Technological University (about 13 miles; Southfield, MI ; FT enrollment: 2,430)
Schoolcraft College (about 18 miles; Livonia, MI ; FT enrollment: 10,867)
University of Detroit Mercy (about 18 miles; Detroit, MI ; FT enrollment: 3,406)
Macomb Community College (about 19 miles; Warren, MI ; FT enrollment: 15,669)
Public high schools in Pontiac: PONTIAC ACADEMY FOR EXCELLENCE - HIGH SCHOOL Students: 1,106, Location: 196 CESAR E CHAVEZ AVE, Grades: 9-12, Charter school )ARTS AND TECHNOLOGY ACADEMY OF PONTIAC Students: 366, Location: 888 ENTERPRISE DR, Grades: KG-11, Charter school )LIFE SKILLS CENTER OF PONTIAC Students: 196, Location: 142 AUBURN AVE, Grades: 9-12, Charter school )CHILDREN'S VILLAGE SCHOOL Students: 192, Location: 1200 NORTH TELEGRAPH RD, Grades: KG-12)KENNEDY CENTER Students: 125, Location: 1700 BALDWIN AVE, Grades: KG-12)MICHIGAN SCHOOL FOR THE ARTS Location: 825 GOLF DRIVE, Grades: KG-9, Charter school )PONTIAC MIDDLE SCHOOL Location: 1275 NORTH PERRY ST, Grades: 7-9)
PONTIAC HIGH SCHOOL Location: 1051 ARLENE AVE, Grades: 10-12)
Private high school in Pontiac: NOTRE DAME PREPARATORY SCHOOL & MARIST ACADEMY Students: 907, Location: 1300 GIDDINGS RD, Grades: 6-12)
Public elementary/middle schools in Pontiac: WALTON CHARTER ACADEMY Students: 695, Location: 744 EAST WALTON BLVD, Grades: KG-8, Charter school )WHITMER HUMAN RESOURCE CENTER Students: 556, Location: 60 PARKHURST ST, Grades: KG-6)HERRINGTON SCHOOL Students: 371, Location: 541 BAY ST, Grades: KG-6)ALCOTT SCHOOL Students: 340, Location: 460 WEST KENNETT RD, Grades: KG-6)OWEN ELEMENTARY SCHOOL Students: 295, Location: 1700 BALDWIN AVE, Grades: KG-6)GREAT LAKES ACADEMY Students: 287, Location: 46312 WOODWARD AVE, Grades: KG-8, Charter school )PONTIAC ACADEMY FOR EXCELLENCE - MIDDLE SCHOOL Location: 196 CESAR E CHAVEZ AVE, Grades: 6-8, Charter school )
PONTIAC ACADEMY FOR EXCELLENCE - ELEMENTARY Location: 196 CESAR E CHAVEZ AVE, Grades: KG-5, Charter school )
SARAH J. WEBBER MEDIA ARTS ACADEMY Location: 48980 WOODWARD AVE, Grades: KG-8, Charter school )
See full list of schools located in Pontiac Libraries in Pontiac: PONTIAC PUBLIC LIBRARY Operating income: $1,291,563; Location: 60 EAST PIKE STREET; 104,546 books ; 6,750 audio materials ; 797 video materials ; 1 other licensed databases ; 50 print serial subscriptions )
OAKLAND COUNTY RESEARCH LIBRARY Operating income: $533,149; Location: 1200 NORTH TELEGRAPH ROAD; 60,133 books ; 33 audio materials ; 279 video materials ; 6 local licensed databases ; 79 other licensed databases ; 92 print serial subscriptions ; 1 electronic serial subscriptions )
Notable locations in Pontiac: (A) , Pontiac Amtrak Station (B) , Pontiac Municipal Golf Course (C) , Oliver Playground (D) , Montcalm Playground (E) , Pontiac City Hall (F) , Star Emergency Medical Services (G) , Saint Joseph Mercy Medical Office Building (H) , Haynes Jones Community Center (I) , Oakland County Administrative Offices (J) , Oakland County Courthouse (K) , Oakland County Health Department (L) , Oakland County Research Library (M) , Pontiac Chamber of Commerce (N) , Pontiac Fire Department Station 1 Headquarters (O) , Pontiac Silverdome (P) , Mercy Place-Neighborhood Clinic (Q) , Pontiac Fire Department Station 5 (R) , Pontiac Fire Department Station 4 (S) , Pontiac Fire Department Station 6 (T) . Display/hide their locations on the map
Shopping Centers: (1) , Phoenix Center Plaza Shopping Center (2) , Oakland Pointe Shopping Center (3) , Bloomfield Complex Shopping Center (4) , Atlas Foodland Plaza Shopping Center (5) , Tel-Huron Shopping Center (6) . Display/hide their locations on the map
Churches in Pontiac include: (A) , James Church (B) , Mount Hope Church (C) , Newman African Methodist Episcopal Church (D) , Calvary Church (E) . Display/hide their locations on the map
Cemeteries: (1) , Mount Hope Cemetery (2) , Oak Hill Cemetery (3) , Oakland Cemetery (4) . Display/hide their locations on the map
Lakes and reservoirs: (A) , Harris Lake (B) , Galloway Lake (C) , Crystal Lake (D) , Spring Lake (E) , Terry Lake (F) , Dawsons Millpond (G) . Display/hide their locations on the map
Creek: (A) . Display/hide its location on the map
Parks in Pontiac include: (1) , Terry Lake Park (2) , Beaudette Park (3) , Clinton Valley Center Historical Marker (4) , Elizabeth Denison Forth Historical Marker (5) , First Baptist Church Historical Marker (6) , First Methodist Episcopal Church Historical Marker (7) , First Presbyterian Church Historical Marker (8) , Franklin Boulevard Historic District Historical Marker (9) . Display/hide their locations on the map
Tourist attractions:
Hotel:
Court:
Birthplace of: Jack Kevorkian - Pathologist, Gary Peters (Michigan politician) - Politician, Kirk Gibson - Professional baseball player, Elvin Jones - musician, Pinklon Thomas - Boxer, Chad "Corntassel" Smith - Lawyer, Micki King - Diver, Tony Lucca - Musician, David Holston - Professional basketball player, Virgil Bernero - Politician.
Oakland County has a predicted average indoor radon screening level between 2 and 4 pCi/L (pico curies per liter) - Moderate Potential Drinking water stations with addresses in Pontiac and their reported violations in the past:
MCLAREN MEDICAL CENTER-ORTONVILLE (Population served: 100, Groundwater):
Past monitoring violations:
2 routine major monitoring violations
Population served: 100, Groundwater):
Past monitoring violations:
One routine major monitoring violation
2 regular monitoring violations
Drinking water stations with addresses in Pontiac that have no violations reported:
HARTLAND TOWN & COUNTRY PROFESSIONAL CENTER (Population served: 48, Primary Water Source Type: Groundwater)
Average household size: This city:
2.6 peopleMichigan:
2.5 people
Percentage of family households: This city:
60.1%Whole state:
66.0%
Percentage of households with unmarried partners: This city:
8.9%Whole state:
6.4%
Likely homosexual households (counted as self-reported same-sex unmarried-partner households)
Lesbian couples: 0.3% of all households Gay men: 0.2% of all households
People in group quarters in Pontiac in 2010:
1,467 people in local jails and other municipal confinement facilities
523 people in other noninstitutional facilities
244 people in emergency and transitional shelters (with sleeping facilities) for people experiencing homelessness
179 people in group homes intended for adults
102 people in nursing facilities/skilled-nursing facilities
16 people in college/university student housing
15 people in residential treatment centers for adults
14 people in correctional residential facilities
3 people in group homes for juveniles (non-correctional)
People in group quarters in Pontiac in 2000:
328 people in other noninstitutional group quarters
283 people in nursing homes
181 people in training schools for juvenile delinquents
119 people in halfway houses
117 people in homes for the mentally ill
110 people in homes or halfway houses for drug/alcohol abuse
79 people in other nonhousehold living situations
68 people in other group homes
52 people in homes for the mentally retarded
40 people in college dormitories (includes college quarters off campus)
31 people in wards in general hospitals for patients who have no usual home elsewhere
17 people in mental (psychiatric) hospitals or wards
16 people in hospitals or wards for drug/alcohol abuse
Banks with branches in Pontiac (2011 data):
PNC Bank, National Association: Woodward/East Blvd Branch at 44330 Woodward Avenue, branch established on 1961/11/01; Perry Street Branch at 584 North Perry Street, branch established on 1946/11/01. Info updated 2012/03/20: Bank assets: $263,309.6 mil, Deposits: $197,343.0 mil, headquarters in Wilmington, DE, positive income , Commercial Lending Specialization, 3085 total offices , Holding Company: Pnc Financial Services Group, Inc., The
JPMorgan Chase Bank, National Association: Pontiac Downtown Branch at 28 N Saginaw St, branch established on 2002/06/21; Baldwin Branch at 1261 Baldwin Avenue, branch established on 1957/03/13. Info updated 2011/11/10: Bank assets: $1,811,678.0 mil, Deposits: $1,190,738.0 mil, headquarters in Columbus, OH, positive income , International Specialization, 5577 total offices , Holding Company: Jpmorgan Chase & Co.
Flagstar Bank, FSB: Pontiac Banking Center Branch at 1648 N Perry Rd, branch established on 2002/02/21; Pontiac Branch at 983 Orchard Lake Road, branch established on 2008/02/25. Info updated 2011/07/21: Bank assets: $13,623.5 mil, Deposits: $7,802.8 mil, headquarters in Troy, MI, negative income in the last year , Mortgage Lending Specialization, 135 total offices
Bank of America, National Association: Downtown Pontiac at 40 N Saginaw Street, branch established on 2009/12/07. Info updated 2009/11/18: Bank assets: $1,451,969.3 mil, Deposits: $1,077,176.8 mil, headquarters in Charlotte, NC, positive income , 5782 total offices , Holding Company: Bank Of America Corporation
Fifth Third Bank: Pontiac Branch at 442 W. Huron, branch established on 2000/12/27. Info updated 2009/10/05: Bank assets: $114,540.4 mil, Deposits: $89,689.1 mil, headquarters in Cincinnati, OH, positive income , Commercial Lending Specialization, 1378 total offices , Holding Company: Fifth Third Bancorp
For population 15 years and over in Pontiac:
Never married: 52.5%Now married: 25.9%Separated: 2.2%Widowed: 6.1%Divorced: 13.4% For population 25 years and over in Pontiac:
High school or higher: 81.1%Bachelor's degree or higher: 16.1%Graduate or professional degree: 4.9%Unemployed: 6.8%Mean travel time to work (commute): 19.0 minutes
Education Gini index (Inequality in education) Here:
11.9Michigan average:
11.0
Religion statistics for Pontiac, MI (based on Oakland County data)
Religion Adherents Congregations Catholic 289,116 64 Evangelical Protestant 155,826 319 Mainline Protestant 73,373 159 Other 58,590 117 Black Protestant 16,826 35 Orthodox 13,844 23 None 594,787 -
Source: Clifford Grammich, Kirk Hadaway, Richard Houseal, Dale E.Jones, Alexei Krindatch, Richie Stanley and Richard H.Taylor. 2012. 2010 U.S.Religion Census: Religious Congregations & Membership Study. Association of Statisticians of American Religious Bodies. Jones, Dale E., et al. 2002. Congregations and Membership in the United States 2000. Nashville, TN: Glenmary Research Center. Graphs represent county-level data
Food Environment Statistics: Number of grocery stores : 293Oakland County :
2.44 / 10,000 pop.Michigan :
2.34 / 10,000 pop.
Number of supercenters and club stores : 22Oakland County :
0.18 / 10,000 pop.State :
0.18 / 10,000 pop.
Number of convenience stores (no gas) : 162Here :
1.35 / 10,000 pop.Michigan :
1.52 / 10,000 pop.
Number of convenience stores (with gas) : 292Oakland County :
2.43 / 10,000 pop.State :
2.99 / 10,000 pop.
Number of full-service restaurants : 983Oakland County :
8.18 / 10,000 pop.Michigan :
6.80 / 10,000 pop.
Adult diabetes rate : Oakland County :
8.8%Michigan :
9.7%
Adult obesity rate : This county :
25.6%State :
29.7%
Low-income preschool obesity rate : Oakland County :
13.0%Michigan :
13.4%
Health and Nutrition:
Average overall health of teeth and gums : This city:
44.0%State:
47.9%
Average BMI : This city:
29.3Michigan:
28.7
People feeling badly about themselves : Pontiac:
20.6%Michigan:
20.6%
People not drinking alcohol at all : This city:
12.0%Michigan:
10.4%
Average hours sleeping at night : Overweight people : Pontiac:
33.3%Michigan:
34.1%
General health condition : This city:
54.0%Michigan:
57.0%
Average condition of hearing : More about Health and Nutrition of Pontiac, MI Residents
Local government employment and payroll (March 2022)
Function
Full-time employees
Monthly full-time payroll
Average yearly full-time wage
Part-time employees
Monthly part-time payroll
Judicial and Legal
35 $194,264 $66,605 2 $3,729 Other Government Administration
16 $71,838 $53,879 0 $0 Financial Administration
10 $54,181 $65,017 0 $0 Other and Unallocable
10 $46,604 $55,925 0 $0 Housing and Community Development (Local)
10 $38,710 $46,452 0 $0 Local Libraries
7 $28,954 $49,635 8 $11,863 Streets and Highways
7 $35,300 $60,514 0 $0 Correction
5 $23,901 $57,362 0 $0 Welfare
4 $20,664 $61,992 0 $0 Parks and Recreation
2 $6,836 $41,016 8 $7,642 Police - Other
0 $0 1 $188 Health
0 $0 1 $2,201
Totals for Government
106 $521,252 $59,010 20 $25,623
Pontiac government finances - Expenditure in 2021 (per resident):
Current Operations - Police Protection: $13,711,000 ($221.67)
General - Other: $13,495,000 ($218.18)Regular Highways: $12,838,000 ($207.55)Local Fire Protection: $8,112,000 ($131.15)Judicial and Legal Services: $4,218,000 ($68.19)Solid Waste Management: $3,733,000 ($60.35)Protective Inspection and Regulation - Other: $2,751,000 ($44.48)Financial Administration: $2,103,000 ($34.00)Central Staff Services: $2,060,000 ($33.30)Parks and Recreation: $1,782,000 ($28.81)General Public Buildings: $353,000 ($5.71)Corrections - Other: $316,000 ($5.11)General - Interest on Debt: $870,000 ($14.07)
Intergovernmental to Local - Other - Police Protection: $15,027,000 ($242.94)
Other - Local Fire Protection: $8,077,000 ($130.58)Other - Regular Highways: $642,000 ($10.38)Other - General - Other: $523,000 ($8.46)Other - Elementary and Secondary Education: $32,000 ($0.52)Intergovernmental to State - Regular Highways: $326,000 ($5.27)
Other Capital Outlay - Regular Highways: $9,843,000 ($159.13)
General - Other: $391,000 ($6.32)Total Salaries and Wages: $5,019,000 ($81.14)
Pontiac government finances - Revenue in 2021 (per resident):
Charges - Other: $4,312,000 ($69.71)
Parking Facilities: $80,000 ($1.29)Federal Intergovernmental - Other: $3,008,000 ($48.63)
Miscellaneous - General Revenue - Other: $4,197,000 ($67.85)
Donations From Private Sources: $1,018,000 ($16.46)Fines and Forfeits: $694,000 ($11.22)Rents: $526,000 ($8.50)Interest Earnings: $156,000 ($2.52)Sale of Property: $5,000 ($0.08)State Intergovernmental - Highways: $10,932,000 ($176.74)
General Local Government Support: $10,801,000 ($174.62)Other: $1,135,000 ($18.35)Tax - Individual Income: $15,118,000 ($244.41)
Property: $14,387,000 ($232.60)Other License: $3,432,000 ($55.49)Occupation and Business License - Other: $105,000 ($1.70)Other Selective Sales: $3,000 ($0.05)
Pontiac government finances - Debt in 2021 (per resident):
Long Term Debt - Outstanding Unspecified Public Purpose: $22,510,000 ($363.92)
Beginning Outstanding - Unspecified Public Purpose: $20,480,000 ($331.10)Issue, Unspecified Public Purpose: $5,600,000 ($90.54)Retired Unspecified Public Purpose: $3,570,000 ($57.72)
Pontiac government finances - Cash and Securities in 2021 (per resident):
Other Funds - Cash and Securities: $70,972,000 ($1147.41)
5.91% of this county's 2021 resident taxpayers lived in other counties in 2020 ($79,655 average adjusted gross income )
Here:
5.91%Michigan average:
5.83%
0.01% of residents moved from foreign countries ($78 average AGI )Oakland County:
0.01%Michigan average:
0.00%
Top counties from which taxpayers relocated into this county between 2020 and 2021:
6.21% of this county's 2020 resident taxpayers moved to other counties in 2021 ($89,748 average adjusted gross income )
Here:
6.21%Michigan average:
5.95%
0.01% of residents moved to foreign countries ($55 average AGI )Oakland County:
0.01%Michigan average:
0.00%
Top counties to which taxpayers relocated from this county between 2020 and 2021:
Businesses in Pontiac, MI
Name Count Name Count
7-Eleven 1 Marriott 3 Advance Auto Parts 2 MasterBrand Cabinets 4 Arby's 2 McDonald's 2 AutoZone 1 Nike 1 Baskin-Robbins 1 Payless 1 Blockbuster 1 Popeyes 1 Burger King 2 Quiznos 1 CVS 1 RadioShack 1 Church's Chicken 1 Rite Aid 3 Cold Stone Creamery 1 T-Mobile 1 Dairy Queen 3 Taco Bell 1 Decora Cabinetry 1 Tim Hortons 2 Dunkin Donuts 1 Toys"R"Us 1 FedEx 3 True Value 1 GNC 1 U-Haul 1 GameStop 1 UPS 3 H&R Block 3 Verizon Wireless 1 Home Depot 1 Walgreens 1 KFC 3 Wendy's 2 Little Caesars Pizza 3 White Castle 1
Strongest AM radio stations in Pontiac:
WXYT (1270 AM; 50 kW; DETROIT, MI; Owner: INFINITY BROADCASTING CORP. OF DETROIT)
WWJ (950 AM; 50 kW; DETROIT, MI; Owner: INFINITY BROADCASTING OPERATIONS, INC.)
WJR (760 AM; 50 kW; DETROIT, MI; Owner: ABC, INC.)
WCHB (1200 AM; 50 kW; TAYLOR, MI; Owner: RADIO ONE OF DETROIT, LLC)
WFDF (910 AM; 50 kW; FLINT, MI; Owner: ABC, INC.)
WDFN (1130 AM; 50 kW; DETROIT, MI; Owner: AMFM RADIO LICENSES, L.L.C.)
WOAP (1080 AM; 50 kW; OWOSSO, MI)
WUFL (1030 AM; daytime; 5 kW; STERLING HEIGHTS, MI; Owner: FAMILY LIFE BROADCASTING SYSTEM)
WDEO (990 AM; 9 kW; YPSILANTI, MI; Owner: WORD BROADCASTERS, INC.)
WTKA (1050 AM; 10 kW; ANN ARBOR, MI; Owner: CAPSTAR TX LIMITED PARTNERSHIP)
WXDX (1310 AM; 5 kW; DEARBORN, MI; Owner: AMFM RADIO LICENSES, L.L.C.)
WLSP (1530 AM; daytime; 5 kW; LAPEER, MI; Owner: REGENT BROADCASTING OF FLINT INC.)
WTRX (1330 AM; 5 kW; FLINT, MI; Owner: CITADEL BROADCASTING COMPANY)
Strongest FM radio stations in Pontiac:
WRIF (101.1 FM; DETROIT, MI; Owner: GREATER BOSTON RADIO, INC.)
WKRK-FM (97.1 FM; DETROIT, MI; Owner: INFINITY BROADCASTING OPERATIONS, INC.)
WAHS (89.5 FM; AUBURN HEIGHTS, MI; Owner: AVONDALE SCHOOL DISTRICT)
WXOU (88.3 FM; AUBURN HILLS, MI; Owner: OAKLAND UNIVERSITY)
WMGC-FM (105.1 FM; DETROIT, MI; Owner: GREATER BOSTON RADIO, INC.)
WCSX (94.7 FM; BIRMINGHAM, MI; Owner: GREATER BOSTON RADIO, INC.)
WYCD (99.5 FM; DETROIT, MI; Owner: INFINITY BROADCASTING CORPORATION OF MICHIGAN)
WDTJ (105.9 FM; DETROIT, MI; Owner: RADIO ONE OF DETROIT, LLC)
WBFH (88.1 FM; BLOOMFIELD HILLS, MI; Owner: BLOOMFIELD HILLS SCHOOL DISTRICT)
WDRQ (93.1 FM; DETROIT, MI; Owner: ABC, INC.)
WDVD (96.3 FM; DETROIT, MI; Owner: ABC, INC.)
WKQI (95.5 FM; DETROIT, MI; Owner: AMFM RADIO LICENSES, L.L.C.)
WNIC (100.3 FM; DEARBORN, MI; Owner: AMFM RADIO LICENSES, L.L.C.)
WMXD (92.3 FM; DETROIT, MI; Owner: AMFM RADIO LICENSES, L.L.C.)
WDTW (106.7 FM; DETROIT, MI; Owner: AMFM RADIO LICENSES, L.L.C.)
WOMC (104.3 FM; DETROIT, MI; Owner: INFINITY BROADCASTING CORPORATION OF MICHIGAN)
WJLB (97.9 FM; DETROIT, MI; Owner: AMFM RADIO LICENSES, L.L.C.)
WDTR-FM (90.9 FM; DETROIT, MI; Owner: BOARD OF EDUCATION, CITY OF DETROIT)
WMUZ (103.5 FM; DETROIT, MI; Owner: WMUZ RADIO, INC.)
WFUM-FM (91.1 FM; FLINT, MI; Owner: THE REGENTS OF THE UNIV. OF MICHIGAN)
TV broadcast stations around Pontiac:
WXYZ-TV (Channel 7; DETROIT, MI; Owner: CHANNEL 7 OF DETROIT, INC.)
WJBK (Channel 2; DETROIT, MI; Owner: FOX TELEVISION STATIONS, INC.)
WKBD (Channel 50; DETROIT, MI; Owner: VIACOM STATIONS GROUP OF DETROIT INC.)
WDIV-TV (Channel 4; DETROIT, MI; Owner: POST-NEWSWEEK STATIONS, MICHIGAN, INC.)
WWJ-TV (Channel 62; DETROIT, MI; Owner: CBS BROADCASTING INC.)
WDWB (Channel 20; DETROIT, MI; Owner: WXON LICENSE, INC.)
WTVS (Channel 56; DETROIT, MI; Owner: DETROIT EDUC. TV FOUNDATION)
WBXD-CA (Channel 5; DETROIT, MI; Owner: THE BOX WORLDWIDE LLC)
WFUM (Channel 28; FLINT, MI; Owner: UNIVERSITY OF MICHIGAN)
WADL (Channel 38; MOUNT CLEMENS, MI; Owner: ADELL BROADCASTING CORPORATION)
WEYI-TV (Channel 25; SAGINAW, MI; Owner: WEYI BROADCASTING, LLC)
W33BY (Channel 68; DETROIT, MI; Owner: HIGHLAND PARK BROADCASTING, L.P.)
WPXD (Channel 31; ANN ARBOR, MI; Owner: PAXSON COMMUNICATIONS LICENSE COMPANY, LLC)
WLPC-LP (Channel 26; DETROIT, MI; Owner: GLENN R. AND KARIN A. PLUMMER)
WDWO-CA (Channel 18; DETROIT, MI; Owner: TCT OF MICHIGAN, INC.)
W48AV (Channel 48; DETROIT, MI; Owner: PAXSON COMMUNICATIONS LICENSE COMPANY, LLC)
Medal of Honor Recipients
Medal of Honor Recipients born in Pontiac: Donald R. Moyer, George C. Shaw, Harold A. Furlong.
National Bridge Inventory (NBI) Statistics 49 Number of bridges351ft / 107m Total length $811,000 Total costs882,047 Total average daily traffic30,025 Total average daily truck traffic
New bridges - historical statistics
1 1920-1929 4 1930-1939 3 1950-1959 26 1960-1969 3 1970-1979 1 1980-1989 3 1990-1999 5 2000-2009 3 2010-2019
See full National Bridge Inventory statistics for Pontiac, MI
Home Mortgage Disclosure Act Aggregated Statistics For Year 2009(Based on 18 full tracts) A) FHA, FSA/RHS & VA B) Conventional C) Refinancings D) Home Improvement Loans E) Loans on Dwellings For 5+ Families F) Non-occupant Loans on G) Loans On Manufactured Number Average Value Number Average Value Number Average Value Number Average Value Number Average Value Number Average Value Number Average Value
LOANS ORIGINATED 99 $63,515 47 $52,851 144 $95,194 35 $10,971 1 $245,000 30 $49,733 0 $0 APPLICATIONS APPROVED, NOT ACCEPTED 14 $79,000 7 $92,857 24 $83,083 7 $18,714 1 $122,000 5 $52,600 0 $0 APPLICATIONS DENIED 53 $59,755 54 $57,537 157 $88,395 73 $30,137 1 $250,000 33 $50,364 9 $35,333 APPLICATIONS WITHDRAWN 31 $77,452 11 $62,364 78 $94,833 10 $27,100 1 $104,000 12 $50,750 0 $0 FILES CLOSED FOR INCOMPLETENESS 4 $64,500 5 $69,800 19 $93,158 4 $32,750 0 $0 3 $80,000 0 $0
Aggregated Statistics For Year 2008(Based on 18 full tracts) A) FHA, FSA/RHS & VA B) Conventional C) Refinancings D) Home Improvement Loans E) Loans on Dwellings For 5+ Families F) Non-occupant Loans on G) Loans On Manufactured Number Average Value Number Average Value Number Average Value Number Average Value Number Average Value Number Average Value Number Average Value
LOANS ORIGINATED 83 $77,386 105 $65,400 251 $83,841 82 $14,134 2 $2,290,000 118 $55,466 1 $22,000 APPLICATIONS APPROVED, NOT ACCEPTED 10 $84,900 24 $72,667 74 $94,054 19 $19,895 0 $0 22 $56,727 5 $36,000 APPLICATIONS DENIED 80 $96,325 163 $73,362 611 $96,570 157 $26,707 0 $0 153 $63,778 32 $42,875 APPLICATIONS WITHDRAWN 25 $99,520 35 $72,229 132 $97,250 29 $39,552 0 $0 31 $70,000 0 $0 FILES CLOSED FOR INCOMPLETENESS 8 $95,125 13 $98,846 46 $86,957 8 $30,875 0 $0 19 $66,579 1 $39,000
Aggregated Statistics For Year 2007(Based on 18 full tracts) A) FHA, FSA/RHS & VA B) Conventional C) Refinancings D) Home Improvement Loans E) Loans on Dwellings For 5+ Families F) Non-occupant Loans on G) Loans On Manufactured Number Average Value Number Average Value Number Average Value Number Average Value Number Average Value Number Average Value Number Average Value
LOANS ORIGINATED 40 $98,650 355 $85,406 721 $85,401 147 $28,626 5 $1,184,800 307 $68,186 2 $55,000 APPLICATIONS APPROVED, NOT ACCEPTED 5 $108,200 97 $89,392 268 $90,937 40 $34,425 0 $0 88 $66,523 6 $51,667 APPLICATIONS DENIED 27 $104,296 409 $90,856 1,490 $98,764 281 $34,609 1 $122,000 321 $73,639 33 $40,697 APPLICATIONS WITHDRAWN 6 $106,500 66 $79,742 434 $107,601 46 $34,696 0 $0 48 $78,979 1 $170,000 FILES CLOSED FOR INCOMPLETENESS 1 $55,000 31 $97,806 140 $96,200 7 $74,000 0 $0 23 $77,826 0 $0
Aggregated Statistics For Year 2006(Based on 18 full tracts) A) FHA, FSA/RHS & VA B) Conventional C) Refinancings D) Home Improvement Loans E) Loans on Dwellings For 5+ Families F) Non-occupant Loans on G) Loans On Manufactured Number Average Value Number Average Value Number Average Value Number Average Value Number Average Value Number Average Value Number Average Value
LOANS ORIGINATED 57 $104,316 828 $82,562 1,385 $85,851 214 $29,621 2 $118,500 469 $71,614 11 $28,727 APPLICATIONS APPROVED, NOT ACCEPTED 3 $100,000 256 $88,777 409 $97,323 40 $36,775 0 $0 114 $73,325 13 $48,538 APPLICATIONS DENIED 15 $104,600 615 $83,493 1,945 $98,587 346 $38,014 1 $120,000 347 $78,066 17 $45,412 APPLICATIONS WITHDRAWN 14 $102,643 186 $82,651 756 $103,040 55 $51,036 2 $1,061,000 93 $75,688 1 $113,000 FILES CLOSED FOR INCOMPLETENESS 4 $96,000 56 $96,893 287 $106,422 4 $25,000 0 $0 37 $88,919 0 $0
Aggregated Statistics For Year 2005(Based on 18 full tracts) A) FHA, FSA/RHS & VA B) Conventional C) Refinancings D) Home Improvement Loans E) Loans on Dwellings For 5+ Families F) Non-occupant Loans on G) Loans On Manufactured Number Average Value Number Average Value Number Average Value Number Average Value Number Average Value Number Average Value Number Average Value
LOANS ORIGINATED 75 $106,053 1,243 $87,825 1,809 $91,564 277 $38,343 5 $371,000 598 $71,040 8 $84,500 APPLICATIONS APPROVED, NOT ACCEPTED 14 $108,429 317 $83,057 506 $96,368 42 $56,762 0 $0 122 $68,484 15 $50,467 APPLICATIONS DENIED 25 $111,320 606 $82,261 2,164 $98,207 307 $47,498 0 $0 291 $72,045 39 $52,077 APPLICATIONS WITHDRAWN 15 $106,667 313 $111,642 984 $104,078 143 $106,867 0 $0 141 $86,050 0 $0 FILES CLOSED FOR INCOMPLETENESS 1 $103,000 63 $91,698 582 $107,153 12 $76,083 0 $0 39 $81,256 1 $65,000
Aggregated Statistics For Year 2004(Based on 18 full tracts) A) FHA, FSA/RHS & VA B) Conventional C) Refinancings D) Home Improvement Loans E) Loans on Dwellings For 5+ Families F) Non-occupant Loans on G) Loans On Manufactured Number Average Value Number Average Value Number Average Value Number Average Value Number Average Value Number Average Value Number Average Value
LOANS ORIGINATED 125 $110,944 1,076 $98,417 2,104 $88,394 263 $41,738 2 $205,500 609 $68,729 14 $71,857 APPLICATIONS APPROVED, NOT ACCEPTED 27 $100,667 328 $91,149 607 $89,272 41 $46,683 1 $360,000 146 $70,288 10 $69,200 APPLICATIONS DENIED 48 $106,062 456 $91,173 1,838 $89,748 276 $33,504 0 $0 271 $71,797 24 $50,625 APPLICATIONS WITHDRAWN 14 $100,714 178 $99,618 914 $94,708 90 $42,311 2 $5,330,000 81 $72,667 5 $141,000 FILES CLOSED FOR INCOMPLETENESS 5 $134,800 47 $93,191 454 $101,187 10 $41,200 0 $0 50 $77,740 0 $0
Aggregated Statistics For Year 2002(Based on 18 full tracts) A) FHA, FSA/RHS & VA B) Conventional C) Refinancings D) Home Improvement Loans E) Loans on Dwellings For 5+ Families F) Non-occupant Loans on Number Average Value Number Average Value Number Average Value Number Average Value Number Average Value Number Average Value
LOANS ORIGINATED 249 $96,145 638 $87,378 2,343 $84,602 169 $15,473 2 $643,000 472 $61,229 APPLICATIONS APPROVED, NOT ACCEPTED 23 $95,217 146 $79,158 525 $79,539 58 $21,793 1 $98,000 83 $60,398 APPLICATIONS DENIED 45 $92,556 264 $67,777 1,683 $79,066 268 $13,306 3 $679,667 170 $62,671 APPLICATIONS WITHDRAWN 27 $84,667 78 $88,679 858 $81,829 29 $29,172 0 $0 68 $64,441 FILES CLOSED FOR INCOMPLETENESS 7 $92,571 41 $85,805 339 $85,375 7 $10,286 0 $0 22 $59,409
Aggregated Statistics For Year 2001(Based on 18 full tracts) A) FHA, FSA/RHS & VA B) Conventional C) Refinancings D) Home Improvement Loans E) Loans on Dwellings For 5+ Families F) Non-occupant Loans on Number Average Value Number Average Value Number Average Value Number Average Value Number Average Value Number Average Value
LOANS ORIGINATED 290 $90,907 616 $91,821 2,373 $78,991 297 $15,680 7 $1,751,571 408 $57,515 APPLICATIONS APPROVED, NOT ACCEPTED 15 $93,800 141 $77,397 481 $71,726 113 $19,336 1 $150,000 66 $48,682 APPLICATIONS DENIED 44 $87,818 398 $64,193 1,745 $68,640 479 $12,768 1 $65,000 186 $49,780 APPLICATIONS WITHDRAWN 20 $86,950 126 $100,262 769 $69,769 45 $31,200 1 $300,000 54 $49,315 FILES CLOSED FOR INCOMPLETENESS 15 $93,400 20 $79,050 236 $77,644 5 $25,200 0 $0 18 $71,444
Aggregated Statistics For Year 2000(Based on 18 full tracts) A) FHA, FSA/RHS & VA B) Conventional C) Refinancings D) Home Improvement Loans E) Loans on Dwellings For 5+ Families F) Non-occupant Loans on Number Average Value Number Average Value Number Average Value Number Average Value Number Average Value Number Average Value
LOANS ORIGINATED 375 $85,120 648 $77,458 1,191 $62,581 321 $12,975 3 $358,667 260 $46,973 APPLICATIONS APPROVED, NOT ACCEPTED 15 $81,667 156 $63,615 344 $63,648 159 $17,440 1 $83,000 38 $48,789 APPLICATIONS DENIED 55 $81,636 621 $55,271 1,122 $57,371 553 $16,116 1 $446,000 135 $42,726 APPLICATIONS WITHDRAWN 35 $80,771 117 $80,803 493 $59,740 45 $41,333 0 $0 38 $52,947 FILES CLOSED FOR INCOMPLETENESS 7 $83,143 27 $68,963 223 $69,803 5 $45,400 0 $0 18 $50,389
Aggregated Statistics For Year 1999(Based on 18 full tracts) A) FHA, FSA/RHS & VA B) Conventional C) Refinancings D) Home Improvement Loans E) Loans on Dwellings For 5+ Families F) Non-occupant Loans on Number Average Value Number Average Value Number Average Value Number Average Value Number Average Value Number Average Value
LOANS ORIGINATED 394 $81,927 670 $78,776 1,511 $60,143 309 $12,465 2 $325,000 261 $47,138 APPLICATIONS APPROVED, NOT ACCEPTED 17 $87,486 206 $60,075 485 $58,030 134 $15,232 0 $0 63 $55,413 APPLICATIONS DENIED 42 $77,917 626 $52,118 1,018 $55,985 567 $10,119 1 $145,000 109 $43,079 APPLICATIONS WITHDRAWN 43 $76,261 108 $83,747 698 $53,309 36 $28,590 0 $0 64 $49,724 FILES CLOSED FOR INCOMPLETENESS 9 $60,998 15 $63,740 190 $55,136 3 $31,000 0 $0 16 $40,820
Detailed mortgage data for all 18 tracts in Pontiac, MI
Private Mortgage Insurance Companies Aggregated Statistics For Year 2009(Based on 10 full tracts) A) Conventional B) Refinancings C) Non-occupant Loans on Number Average Value Number Average Value Number Average Value
LOANS ORIGINATED 13 $88,769 1 $96,000 0 $0 APPLICATIONS APPROVED, NOT ACCEPTED 8 $104,500 0 $0 1 $54,000 APPLICATIONS DENIED 11 $94,818 0 $0 1 $90,000 APPLICATIONS WITHDRAWN 1 $54,000 0 $0 0 $0 FILES CLOSED FOR INCOMPLETENESS 1 $76,000 0 $0 0 $0
Aggregated Statistics For Year 2008(Based on 18 full tracts) A) Conventional B) Refinancings C) Non-occupant Loans on Number Average Value Number Average Value Number Average Value
LOANS ORIGINATED 48 $82,458 16 $112,562 13 $62,923 APPLICATIONS APPROVED, NOT ACCEPTED 62 $90,661 24 $98,542 22 $64,909 APPLICATIONS DENIED 9 $81,556 3 $132,000 7 $68,286 APPLICATIONS WITHDRAWN 7 $80,714 0 $0 1 $83,000 FILES CLOSED FOR INCOMPLETENESS 2 $95,000 0 $0 1 $95,000
Aggregated Statistics For Year 2007(Based on 17 full tracts) A) Conventional B) Refinancings C) Non-occupant Loans on D) Loans On Manufactured Number Average Value Number Average Value Number Average Value Number Average Value
LOANS ORIGINATED 174 $91,684 103 $106,379 46 $73,370 0 $0 APPLICATIONS APPROVED, NOT ACCEPTED 54 $111,056 37 $131,081 17 $91,235 0 $0 APPLICATIONS DENIED 3 $120,333 5 $185,800 0 $0 0 $0 APPLICATIONS WITHDRAWN 17 $109,118 7 $114,000 9 $88,111 0 $0 FILES CLOSED FOR INCOMPLETENESS 0 $0 3 $105,333 0 $0 1 $170,000
Aggregated Statistics For Year 2006(Based on 17 full tracts) A) Conventional B) Refinancings C) Non-occupant Loans on Number Average Value Number Average Value Number Average Value
LOANS ORIGINATED 124 $107,815 103 $103,524 35 $78,429 APPLICATIONS APPROVED, NOT ACCEPTED 45 $98,067 20 $123,550 16 $66,438 APPLICATIONS DENIED 4 $89,750 1 $145,000 0 $0 APPLICATIONS WITHDRAWN 12 $85,583 9 $152,111 6 $69,000 FILES CLOSED FOR INCOMPLETENESS 0 $0 1 $140,000 0 $0
Aggregated Statistics For Year 2005(Based on 17 full tracts) A) Conventional B) Refinancings C) Non-occupant Loans on Number Average Value Number Average Value Number Average Value
LOANS ORIGINATED 195 $106,785 108 $115,231 66 $69,439 APPLICATIONS APPROVED, NOT ACCEPTED 46 $113,891 37 $106,405 18 $76,611 APPLICATIONS DENIED 1 $75,000 3 $109,333 3 $77,667 APPLICATIONS WITHDRAWN 6 $75,833 8 $99,125 4 $77,250 FILES CLOSED FOR INCOMPLETENESS 1 $81,000 2 $63,000 2 $68,000
Aggregated Statistics For Year 2004(Based on 17 full tracts) A) Conventional B) Refinancings C) Non-occupant Loans on Number Average Value Number Average Value Number Average Value
LOANS ORIGINATED 282 $109,429 138 $115,312 85 $66,835 APPLICATIONS APPROVED, NOT ACCEPTED 37 $118,838 48 $121,562 16 $64,875 APPLICATIONS DENIED 13 $90,846 1 $183,000 5 $74,000 APPLICATIONS WITHDRAWN 11 $139,000 13 $116,154 5 $111,800 FILES CLOSED FOR INCOMPLETENESS 6 $44,000 0 $0 6 $44,000
Aggregated Statistics For Year 2003(Based on 17 full tracts) A) Conventional B) Refinancings C) Non-occupant Loans on Number Average Value Number Average Value Number Average Value
LOANS ORIGINATED 266 $97,684 249 $110,554 115 $66,452 APPLICATIONS APPROVED, NOT ACCEPTED 49 $93,286 69 $114,058 22 $64,182 APPLICATIONS DENIED 7 $75,286 12 $120,500 9 $89,444 APPLICATIONS WITHDRAWN 12 $92,500 26 $115,846 10 $83,900 FILES CLOSED FOR INCOMPLETENESS 0 $0 1 $80,000 0 $0
Aggregated Statistics For Year 2002(Based on 17 full tracts) A) Conventional B) Refinancings C) Non-occupant Loans on Number Average Value Number Average Value Number Average Value
LOANS ORIGINATED 257 $96,198 253 $112,755 82 $61,988 APPLICATIONS APPROVED, NOT ACCEPTED 49 $94,020 56 $104,482 8 $56,375 APPLICATIONS DENIED 10 $59,300 13 $103,154 6 $59,000 APPLICATIONS WITHDRAWN 18 $82,500 23 $103,522 8 $49,000 FILES CLOSED FOR INCOMPLETENESS 1 $53,000 4 $116,000 0 $0
Aggregated Statistics For Year 2001(Based on 18 full tracts) A) Conventional B) Refinancings C) Non-occupant Loans on Number Average Value Number Average Value Number Average Value
LOANS ORIGINATED 267 $103,007 213 $106,023 75 $68,800 APPLICATIONS APPROVED, NOT ACCEPTED 43 $93,651 62 $100,290 13 $56,077 APPLICATIONS DENIED 10 $80,100 14 $130,857 5 $91,800 APPLICATIONS WITHDRAWN 5 $76,400 11 $104,000 2 $57,500 FILES CLOSED FOR INCOMPLETENESS 2 $49,000 3 $75,667 3 $46,333
Aggregated Statistics For Year 2000(Based on 17 full tracts) A) Conventional B) Refinancings C) Non-occupant Loans on Number Average Value Number Average Value Number Average Value
LOANS ORIGINATED 245 $89,714 147 $74,435 72 $59,208 APPLICATIONS APPROVED, NOT ACCEPTED 30 $82,133 21 $86,238 10 $58,800 APPLICATIONS DENIED 16 $105,562 9 $67,444 7 $83,571 APPLICATIONS WITHDRAWN 7 $116,000 3 $81,333 1 $116,000 FILES CLOSED FOR INCOMPLETENESS 1 $47,000 2 $76,500 1 $48,000
Aggregated Statistics For Year 1999(Based on 17 full tracts) A) Conventional B) Refinancings C) Non-occupant Loans on Number Average Value Number Average Value Number Average Value
LOANS ORIGINATED 271 $90,676 89 $70,218 51 $53,094 APPLICATIONS APPROVED, NOT ACCEPTED 32 $82,356 18 $87,234 7 $38,143 APPLICATIONS DENIED 15 $79,791 3 $79,923 4 $37,250 APPLICATIONS WITHDRAWN 4 $108,660 2 $60,910 2 $89,265 FILES CLOSED FOR INCOMPLETENESS 2 $124,500 1 $78,000 0 $0
Most common first names in Pontiac, MI among deceased individuals Name Count Lived (average)
James 181 67.0 years Mary 150 75.2 years John 141 72.3 years Robert 135 66.3 years William 121 72.9 years Willie 89 69.3 years Charles 84 70.3 years Dorothy 77 75.3 years Helen 65 77.9 years George 63 71.9 years
Most common last names in Pontiac, MI among deceased individuals Last name Count Lived (average)
Williams 116 67.6 years Smith 92 73.1 years Johnson 85 70.1 years Brown 81 69.2 years Jones 54 68.4 years Jackson 43 73.4 years Wilson 40 69.5 years Davis 38 68.4 years White 34 73.1 years Harris 34 71.9 years
Pontiac compared to Michigan state average:
Median household income below state average. Median house value below state average. Unemployed percentage below state average. Black race population percentage significantly above state average. Hispanic race population percentage significantly above state average. Median age below state average. Renting percentage above state average. Length of stay since moving in significantly above state average. Institutionalized population percentage above state average.
#6 on the list of "Top 101 cities with the highest number of assaults per 100,000 residents, excludes tourist destinations and others with a lot of outsiders visiting based on city industries data (population 50,000+)"
#7 on the list of "Top 101 larger cities with the largest decrease or smallest increase in household income from 2000 (population 50,000+)"
#9 on the list of "Top 101 cities with the highest number of rapes per 100,000 residents, excludes tourist destinations and others with a lot of outsiders visiting based on city industries data (population 50,000+)"
#10 on the list of "Top 101 cities with largest percentage of males in occupations: health technologists and technicians (population 50,000+)"
#10 on the list of "Top 101 cities with the largest city-data.com crime index per police officer (population 50,000+)"
#11 on the list of "Top 101 larger cities with the largest decrease or smallest increase in house/condo value from 2000 (population 50,000+)"
#14 on the list of "Top 101 cities with the lowest percentage of workers working at home, population 50,000+"
#14 on the list of "Top 100 cities with declining populations from 2000 to 2014 (pop. 50,000+)"
#14 on the list of "Top 101 cities with the largest percentage population decrease from 2000 (population 50,000+)"
#16 on the list of "Top 100 cities with lowest ratio of median house value to median household income (pop. 50,000+)"
#18 on the list of "Top 101 cities with largest percentage of males in occupations: food preparation and serving related occupations (population 50,000+)"
#21 on the list of "Top 101 cities with the lowest cost per building permit (population 50,000+)"
#25 on the list of "Top 101 cities with largest percentage population decreases in the 1990s) (population 50,000+)"
#26 on the list of "Top 101 cities with largest percentage of females in industries: administrative and support and waste management services (population 50,000+)"
#26 on the list of "Top 101 cities with the highest percentage of single-parent households, population 50,000+"
#27 on the list of "Top 100 least-safe cities (highest city-data.com crime index) (pop. 50,000+)"
#27 on the list of "Top 101 cities with largest percentage of males in industries: accommodation and food services (population 50,000+)"
#31 on the list of "Top 101 cities with the least people having Master's or Doctorate degrees (population 50,000+)"
#41 on the list of "Top 101 cities with largest percentage of males in occupations: community and social service occupations (population 50,000+)"
#42 on the list of "Top 101 cities with the highest city-data.com crime index, excludes tourist destinations and others with a lot of outsiders visiting based on city industries data (population 50,000+)"
#15 (48342) on the list of "Top 101 zip codes with the lowest average reported salary/wage in 2012 (pop 5,000+)"
#73 (48342) on the list of "Top 101 zip codes with the lowest 2012 average Adjusted Gross Income (AGI) for individuals (pop 5,000+)"
#6 on the list of "Top 101 counties with the highest percentage of residents that visited a dentist within the past year"
#12 on the list of "Top 101 counties with the most Orthodox congregations"
#14 on the list of "Top 101 counties with the most Orthodox adherents"
#38 on the list of "Top 101 counties with the most Mainline Protestant adherents"
#39 on the list of "Top 101 counties with the most Catholic adherents"
Top Patent Applicants
Gregg R. Kittinger (13)
Kyle Golsch (9)
Edwin J. Stanke (7)
Patricia Yulkowski (6)
Carnell E. Williams (4)
Guixian Lu (3)
Roger Magerman (3)
Jeyachandrabose Chinniah (3)
Barry Groves (3)
Ronald D. Pearce (2)
Total of 106 patent applications in 2008-2024.
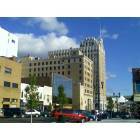
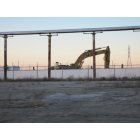
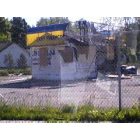
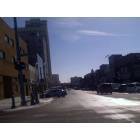
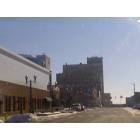


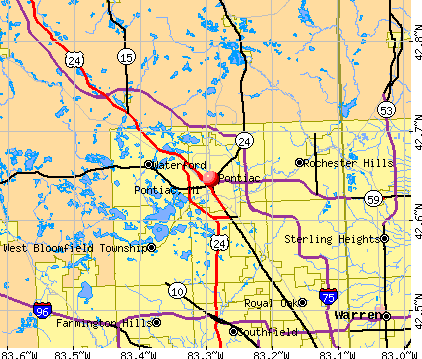


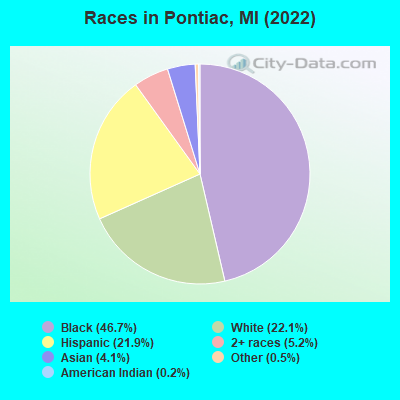
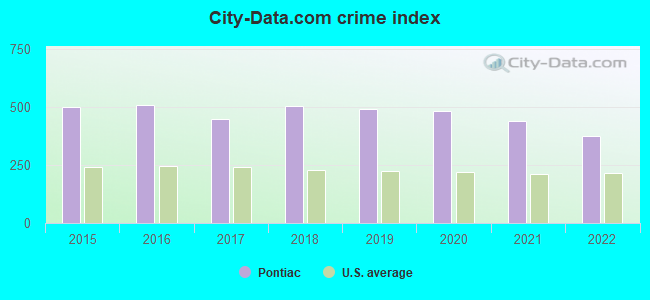
 Recent articles from our blog. Our writers, many of them Ph.D. graduates or candidates, create easy-to-read articles on a wide variety of topics.


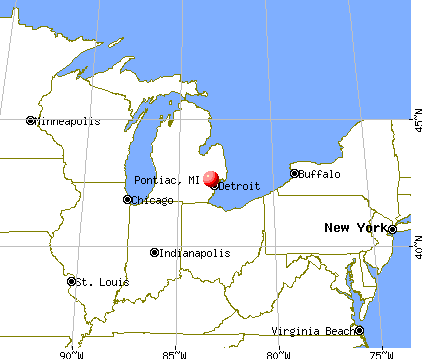
 (20.4 miles
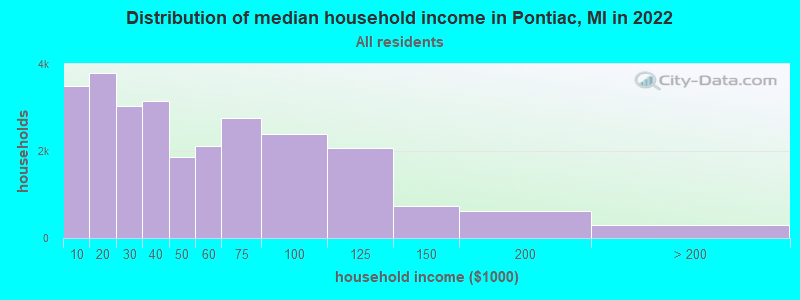
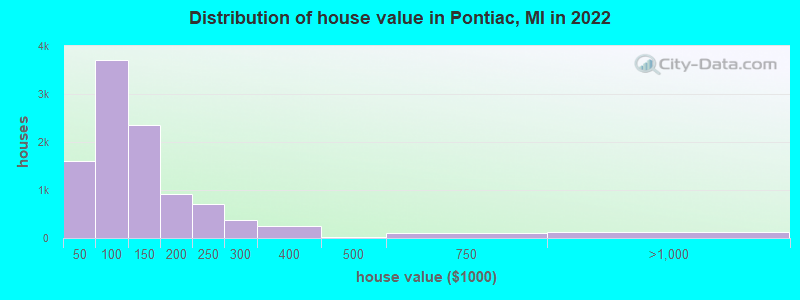
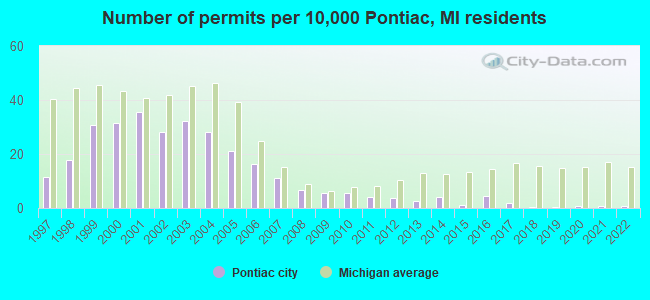
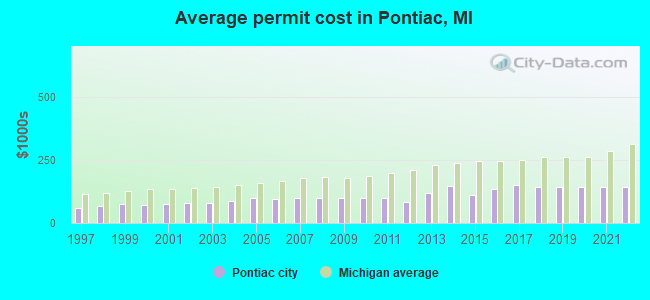
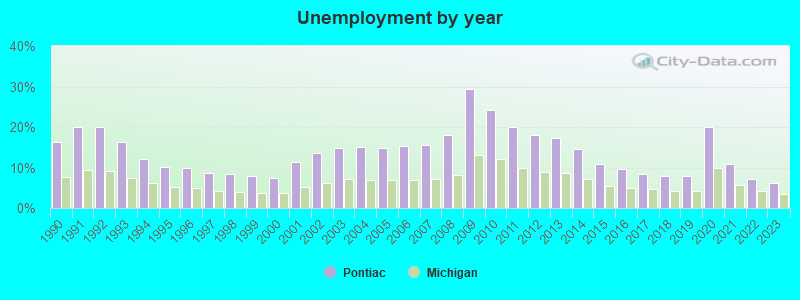
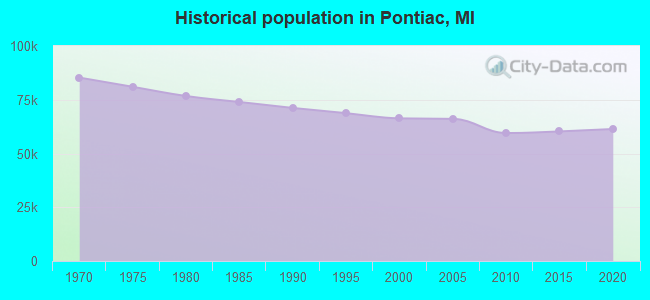
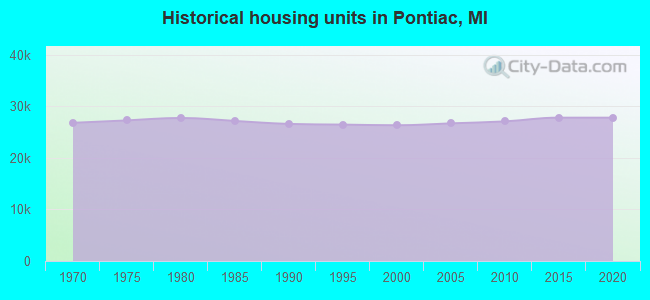
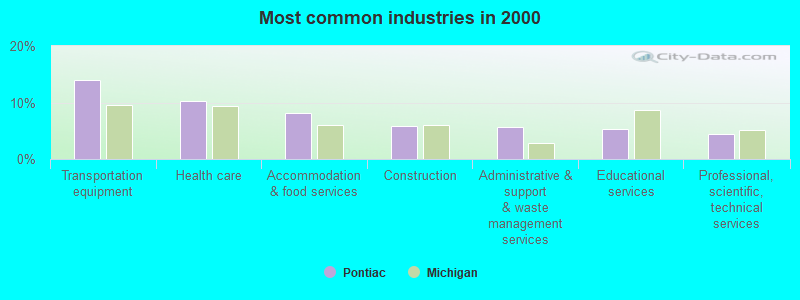
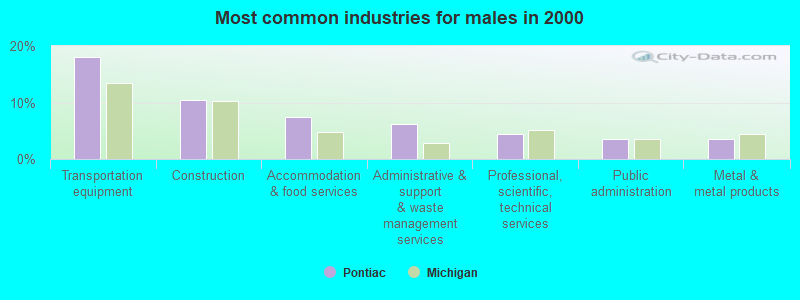
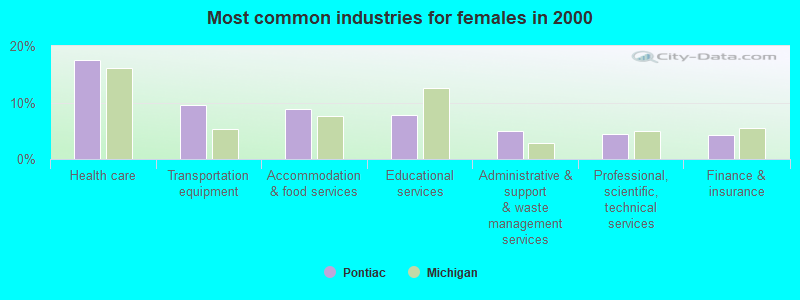
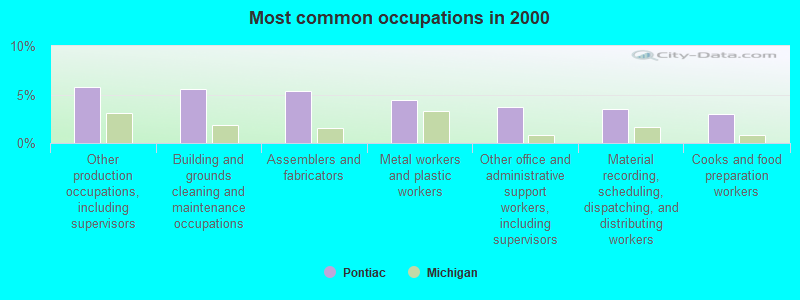
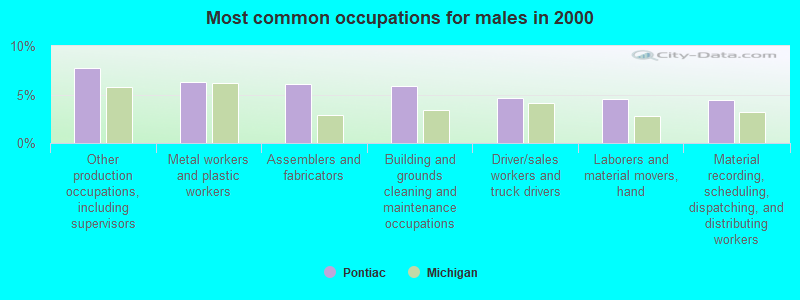
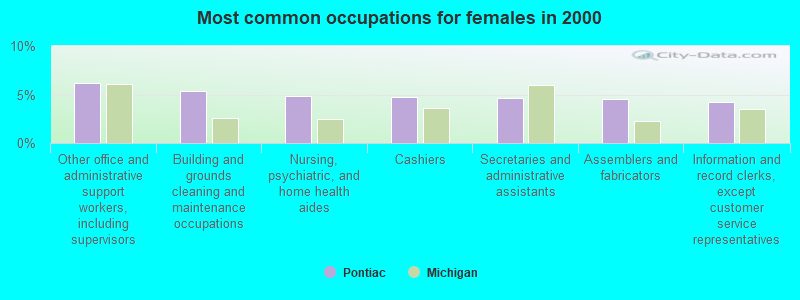
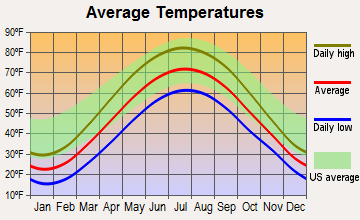
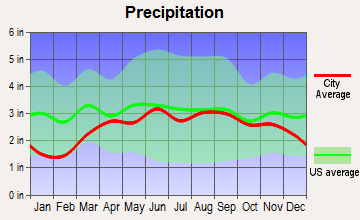
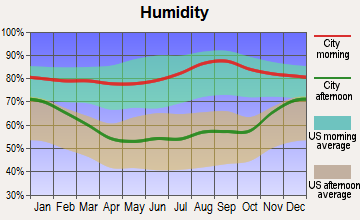
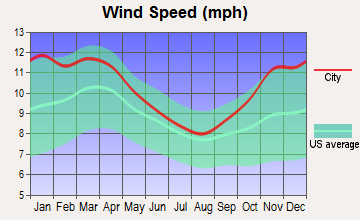
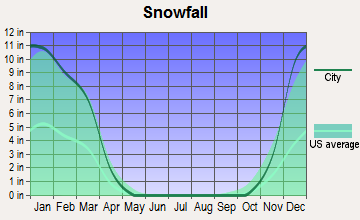
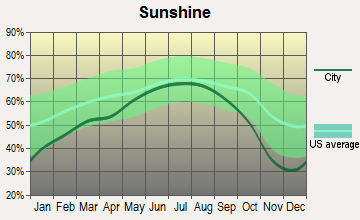
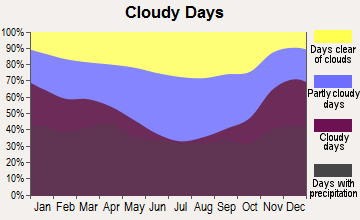
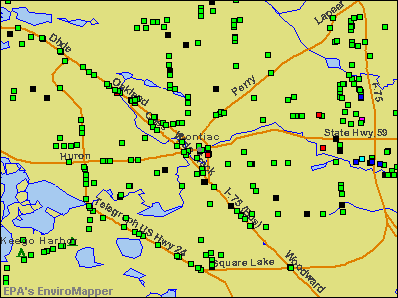

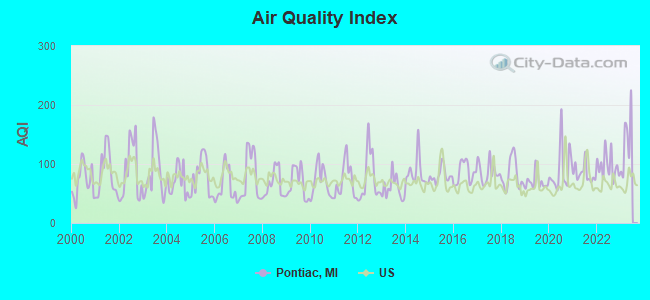
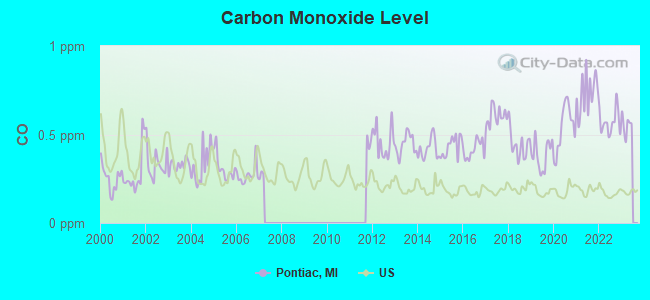
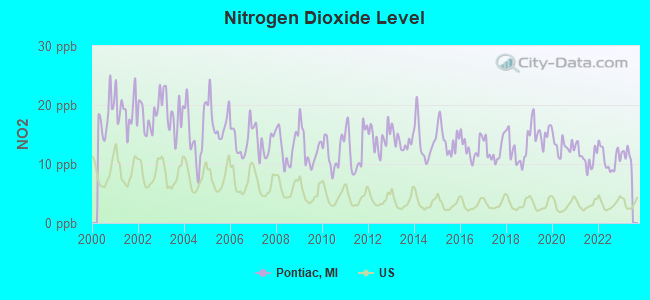
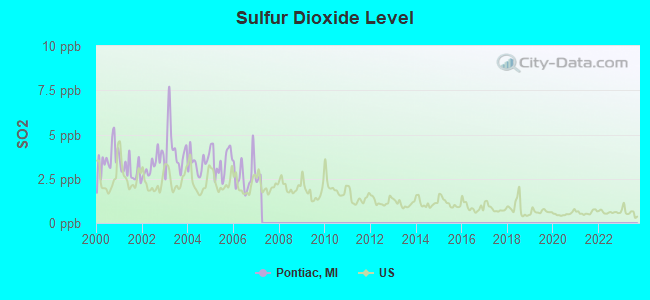
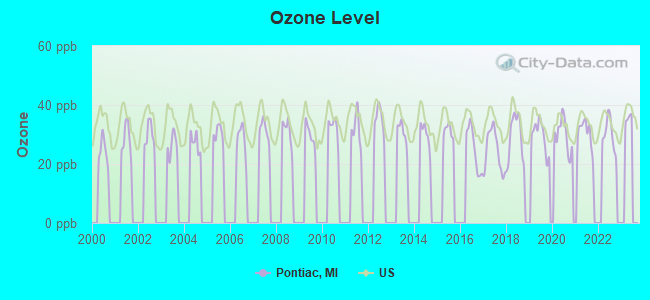
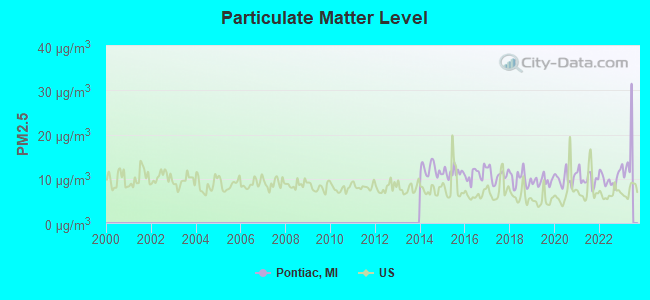
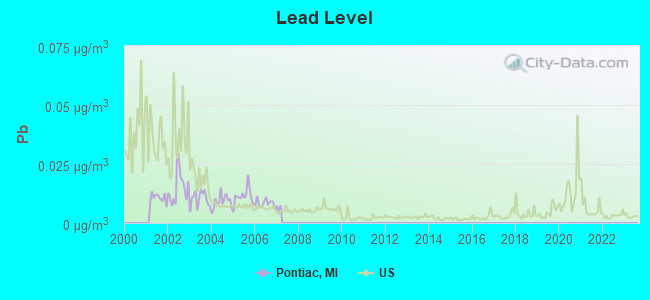
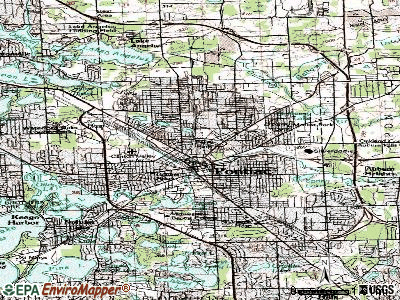
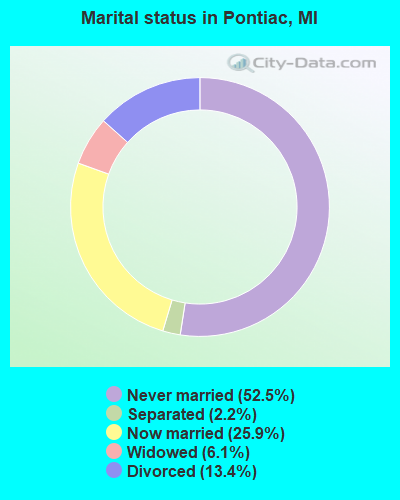
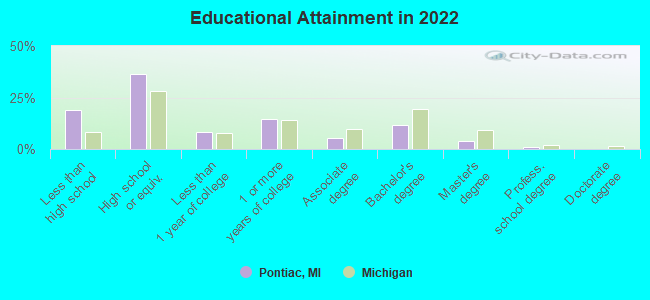
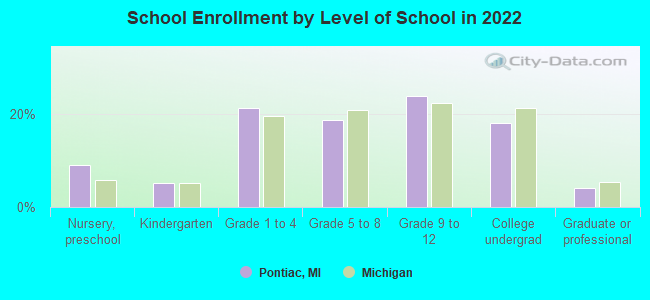

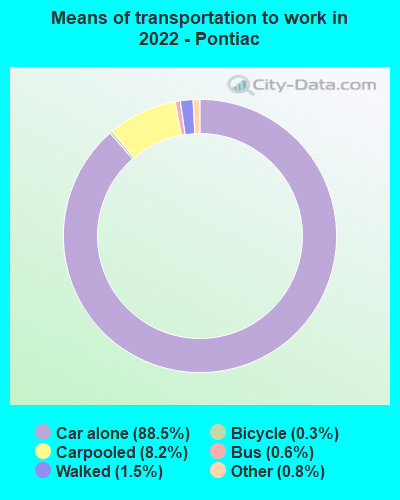
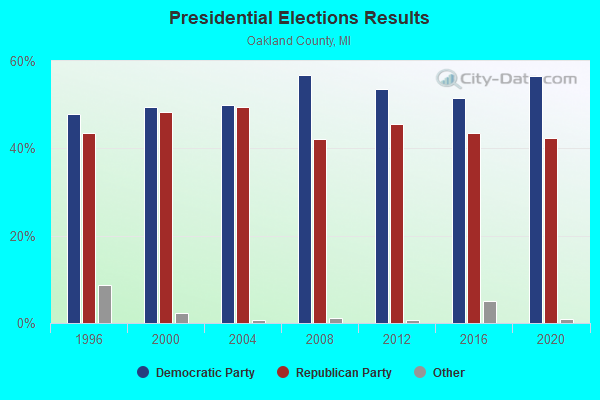
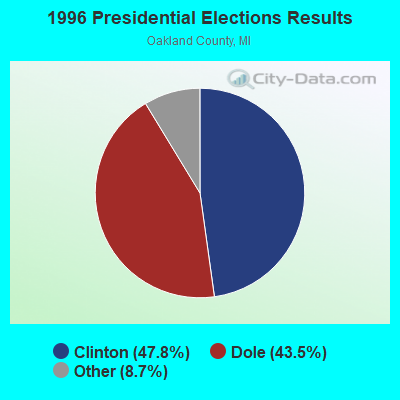
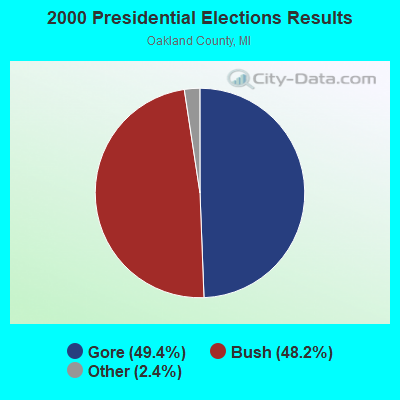
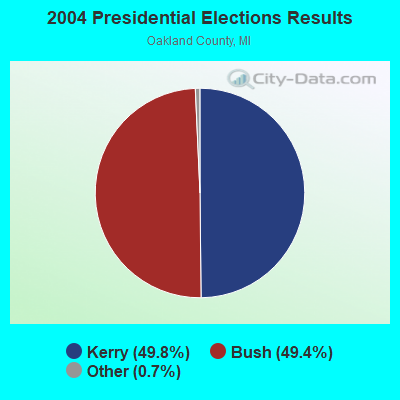
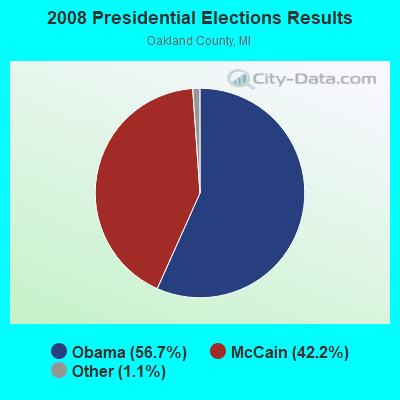
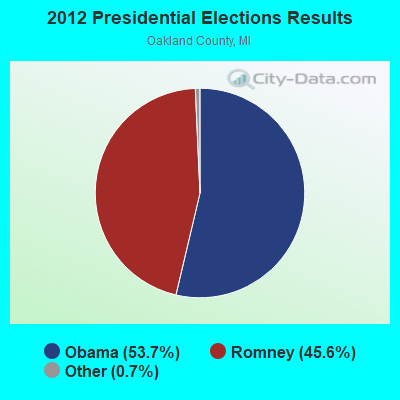
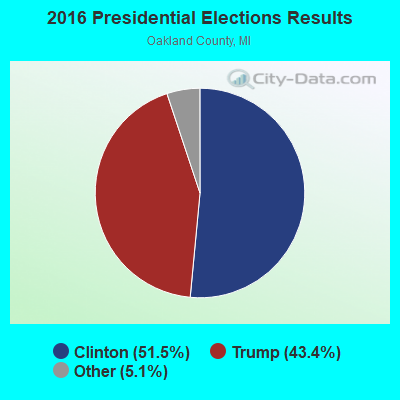
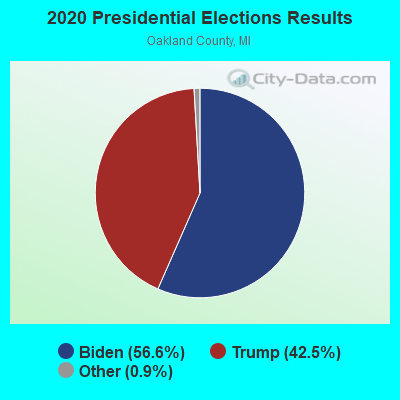
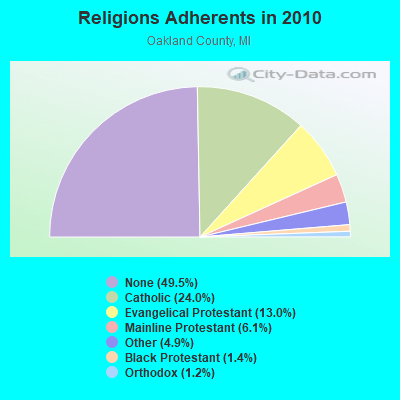
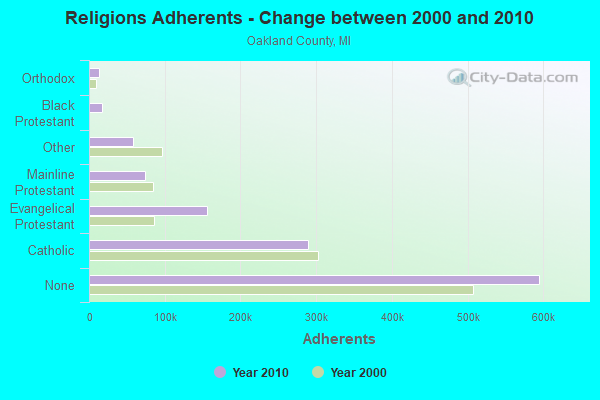
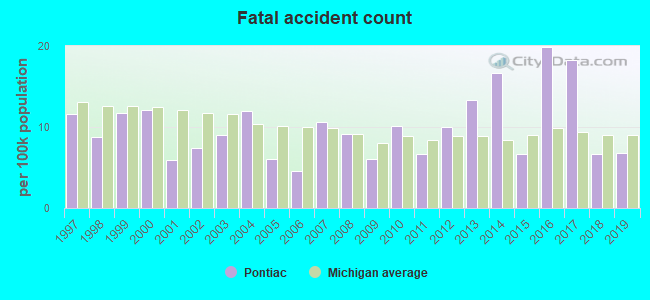
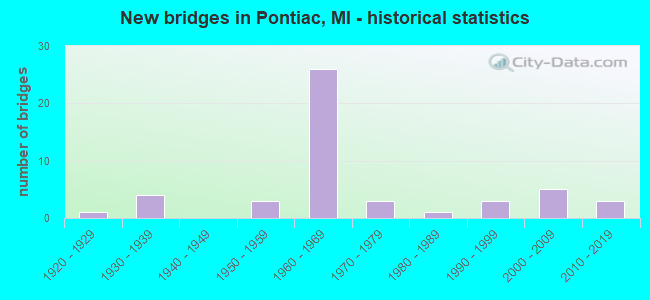
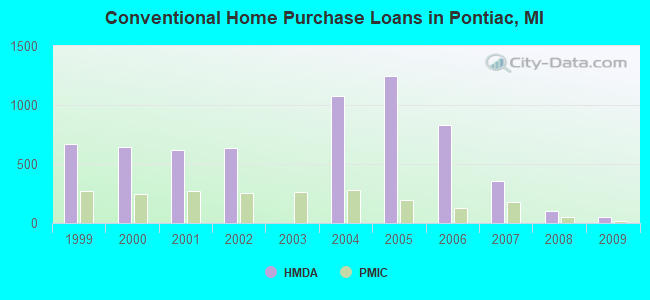
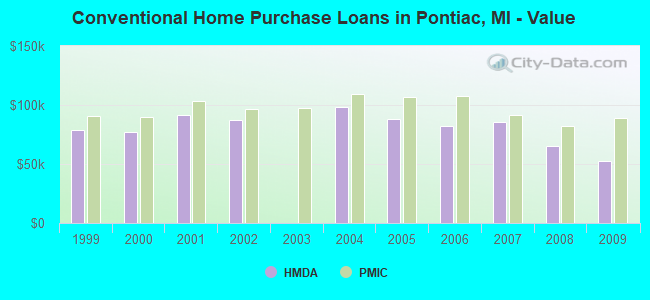
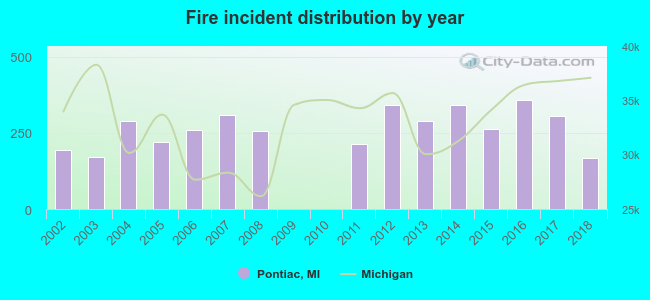 Based on the data from the years 2002 - 2018 the average number of fires per year is 234. The highest number of fires - 357 took place in 2016, and the least - 0 in 2009. The data has a decreasing trend.
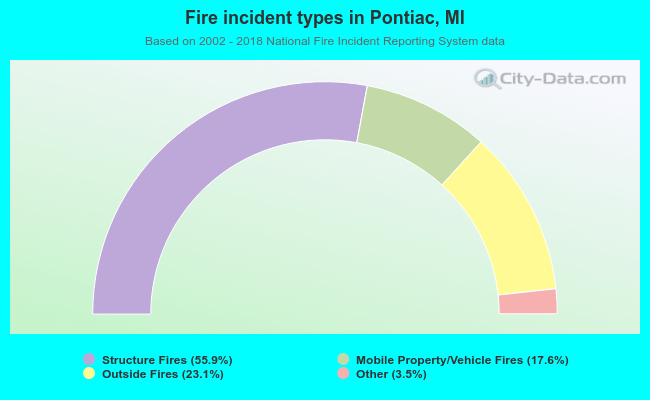 When looking into fire subcategories, the most reports belonged to: Structure Fires (55.9%), and Outside Fires (23.1%).