Rancho Palos Verdes, California Submit your own pictures of this city and show them to the world
OSM Map
General Map
Google Map
MSN Map
OSM Map
General Map
Google Map
MSN Map
OSM Map
General Map
Google Map
MSN Map
OSM Map
General Map
Google Map
MSN Map
Please wait while loading the map...
Population in 2022: 40,527 (100% urban, 0% rural). Population change since 2000: -1.5%Males: 19,702 Females: 20,825
March 2022 cost of living index in Rancho Palos Verdes: 144.8 (very high, U.S. average is 100) Percentage of residents living in poverty in 2022: 4.0%for White Non-Hispanic residents , 8.6% for Black residents , 5.6% for Hispanic or Latino residents , 29.2% for American Indian residents , 3.1% for Native Hawaiian and other Pacific Islander residents , 9.9% for other race residents , 1.3% for two or more races residents )
Profiles of local businesses
Business Search - 14 Million verified businesses
Data:
Median household income ($)
Median household income (% change since 2000)
Household income diversity
Ratio of average income to average house value (%)
Ratio of average income to average rent
Median household income ($) - White
Median household income ($) - Black or African American
Median household income ($) - Asian
Median household income ($) - Hispanic or Latino
Median household income ($) - American Indian and Alaska Native
Median household income ($) - Multirace
Median household income ($) - Other Race
Median household income for houses/condos with a mortgage ($)
Median household income for apartments without a mortgage ($)
Races - White alone (%)
Races - White alone (% change since 2000)
Races - Black alone (%)
Races - Black alone (% change since 2000)
Races - American Indian alone (%)
Races - American Indian alone (% change since 2000)
Races - Asian alone (%)
Races - Asian alone (% change since 2000)
Races - Hispanic (%)
Races - Hispanic (% change since 2000)
Races - Native Hawaiian and Other Pacific Islander alone (%)
Races - Native Hawaiian and Other Pacific Islander alone (% change since 2000)
Races - Two or more races (%)
Races - Two or more races (% change since 2000)
Races - Other race alone (%)
Races - Other race alone (% change since 2000)
Racial diversity
Unemployment (%)
Unemployment (% change since 2000)
Unemployment (%) - White
Unemployment (%) - Black or African American
Unemployment (%) - Asian
Unemployment (%) - Hispanic or Latino
Unemployment (%) - American Indian and Alaska Native
Unemployment (%) - Multirace
Unemployment (%) - Other Race
Population density (people per square mile)
Population - Males (%)
Population - Females (%)
Population - Males (%) - White
Population - Males (%) - Black or African American
Population - Males (%) - Asian
Population - Males (%) - Hispanic or Latino
Population - Males (%) - American Indian and Alaska Native
Population - Males (%) - Multirace
Population - Males (%) - Other Race
Population - Females (%) - White
Population - Females (%) - Black or African American
Population - Females (%) - Asian
Population - Females (%) - Hispanic or Latino
Population - Females (%) - American Indian and Alaska Native
Population - Females (%) - Multirace
Population - Females (%) - Other Race
Coronavirus confirmed cases (Apr 19, 2024)
Deaths caused by coronavirus (Apr 19, 2024)
Coronavirus confirmed cases (per 100k population) (Apr 19, 2024)
Deaths caused by coronavirus (per 100k population) (Apr 19, 2024)
Daily increase in number of cases (Apr 19, 2024)
Weekly increase in number of cases (Apr 19, 2024)
Cases doubled (in days) (Apr 19, 2024)
Hospitalized patients (Apr 18, 2022)
Negative test results (Apr 18, 2022)
Total test results (Apr 18, 2022)
COVID Vaccine doses distributed (per 100k population) (Sep 19, 2023)
COVID Vaccine doses administered (per 100k population) (Sep 19, 2023)
COVID Vaccine doses distributed (Sep 19, 2023)
COVID Vaccine doses administered (Sep 19, 2023)
Likely homosexual households (%)
Likely homosexual households (% change since 2000)
Likely homosexual households - Lesbian couples (%)
Likely homosexual households - Lesbian couples (% change since 2000)
Likely homosexual households - Gay men (%)
Likely homosexual households - Gay men (% change since 2000)
Cost of living index
Median gross rent ($)
Median contract rent ($)
Median monthly housing costs ($)
Median house or condo value ($)
Median house or condo value ($ change since 2000)
Mean house or condo value by units in structure - 1, detached ($)
Mean house or condo value by units in structure - 1, attached ($)
Mean house or condo value by units in structure - 2 ($)
Mean house or condo value by units in structure by units in structure - 3 or 4 ($)
Mean house or condo value by units in structure - 5 or more ($)
Mean house or condo value by units in structure - Boat, RV, van, etc. ($)
Mean house or condo value by units in structure - Mobile home ($)
Median house or condo value ($) - White
Median house or condo value ($) - Black or African American
Median house or condo value ($) - Asian
Median house or condo value ($) - Hispanic or Latino
Median house or condo value ($) - American Indian and Alaska Native
Median house or condo value ($) - Multirace
Median house or condo value ($) - Other Race
Median resident age
Resident age diversity
Median resident age - Males
Median resident age - Females
Median resident age - White
Median resident age - Black or African American
Median resident age - Asian
Median resident age - Hispanic or Latino
Median resident age - American Indian and Alaska Native
Median resident age - Multirace
Median resident age - Other Race
Median resident age - Males - White
Median resident age - Males - Black or African American
Median resident age - Males - Asian
Median resident age - Males - Hispanic or Latino
Median resident age - Males - American Indian and Alaska Native
Median resident age - Males - Multirace
Median resident age - Males - Other Race
Median resident age - Females - White
Median resident age - Females - Black or African American
Median resident age - Females - Asian
Median resident age - Females - Hispanic or Latino
Median resident age - Females - American Indian and Alaska Native
Median resident age - Females - Multirace
Median resident age - Females - Other Race
Commute - mean travel time to work (minutes)
Travel time to work - Less than 5 minutes (%)
Travel time to work - Less than 5 minutes (% change since 2000)
Travel time to work - 5 to 9 minutes (%)
Travel time to work - 5 to 9 minutes (% change since 2000)
Travel time to work - 10 to 19 minutes (%)
Travel time to work - 10 to 19 minutes (% change since 2000)
Travel time to work - 20 to 29 minutes (%)
Travel time to work - 20 to 29 minutes (% change since 2000)
Travel time to work - 30 to 39 minutes (%)
Travel time to work - 30 to 39 minutes (% change since 2000)
Travel time to work - 40 to 59 minutes (%)
Travel time to work - 40 to 59 minutes (% change since 2000)
Travel time to work - 60 to 89 minutes (%)
Travel time to work - 60 to 89 minutes (% change since 2000)
Travel time to work - 90 or more minutes (%)
Travel time to work - 90 or more minutes (% change since 2000)
Marital status - Never married (%)
Marital status - Now married (%)
Marital status - Separated (%)
Marital status - Widowed (%)
Marital status - Divorced (%)
Median family income ($)
Median family income (% change since 2000)
Median non-family income ($)
Median non-family income (% change since 2000)
Median per capita income ($)
Median per capita income (% change since 2000)
Median family income ($) - White
Median family income ($) - Black or African American
Median family income ($) - Asian
Median family income ($) - Hispanic or Latino
Median family income ($) - American Indian and Alaska Native
Median family income ($) - Multirace
Median family income ($) - Other Race
Median year house/condo built
Median year apartment built
Year house built - Built 2005 or later (%)
Year house built - Built 2000 to 2004 (%)
Year house built - Built 1990 to 1999 (%)
Year house built - Built 1980 to 1989 (%)
Year house built - Built 1970 to 1979 (%)
Year house built - Built 1960 to 1969 (%)
Year house built - Built 1950 to 1959 (%)
Year house built - Built 1940 to 1949 (%)
Year house built - Built 1939 or earlier (%)
Average household size
Household density (households per square mile)
Average household size - White
Average household size - Black or African American
Average household size - Asian
Average household size - Hispanic or Latino
Average household size - American Indian and Alaska Native
Average household size - Multirace
Average household size - Other Race
Occupied housing units (%)
Vacant housing units (%)
Owner occupied housing units (%)
Renter occupied housing units (%)
Vacancy status - For rent (%)
Vacancy status - For sale only (%)
Vacancy status - Rented or sold, not occupied (%)
Vacancy status - For seasonal, recreational, or occasional use (%)
Vacancy status - For migrant workers (%)
Vacancy status - Other vacant (%)
Residents with income below the poverty level (%)
Residents with income below 50% of the poverty level (%)
Children below poverty level (%)
Poor families by family type - Married-couple family (%)
Poor families by family type - Male, no wife present (%)
Poor families by family type - Female, no husband present (%)
Poverty status for native-born residents (%)
Poverty status for foreign-born residents (%)
Poverty among high school graduates not in families (%)
Poverty among people who did not graduate high school not in families (%)
Residents with income below the poverty level (%) - White
Residents with income below the poverty level (%) - Black or African American
Residents with income below the poverty level (%) - Asian
Residents with income below the poverty level (%) - Hispanic or Latino
Residents with income below the poverty level (%) - American Indian and Alaska Native
Residents with income below the poverty level (%) - Multirace
Residents with income below the poverty level (%) - Other Race
Air pollution - Air Quality Index (AQI)
Air pollution - CO
Air pollution - NO2
Air pollution - SO2
Air pollution - Ozone
Air pollution - PM10
Air pollution - PM25
Air pollution - Pb
Crime - Murders per 100,000 population
Crime - Rapes per 100,000 population
Crime - Robberies per 100,000 population
Crime - Assaults per 100,000 population
Crime - Burglaries per 100,000 population
Crime - Thefts per 100,000 population
Crime - Auto thefts per 100,000 population
Crime - Arson per 100,000 population
Crime - City-data.com crime index
Crime - Violent crime index
Crime - Property crime index
Crime - Murders per 100,000 population (5 year average)
Crime - Rapes per 100,000 population (5 year average)
Crime - Robberies per 100,000 population (5 year average)
Crime - Assaults per 100,000 population (5 year average)
Crime - Burglaries per 100,000 population (5 year average)
Crime - Thefts per 100,000 population (5 year average)
Crime - Auto thefts per 100,000 population (5 year average)
Crime - Arson per 100,000 population (5 year average)
Crime - City-data.com crime index (5 year average)
Crime - Violent crime index (5 year average)
Crime - Property crime index (5 year average)
1996 Presidential Elections Results (%) - Democratic Party (Clinton)
1996 Presidential Elections Results (%) - Republican Party (Dole)
1996 Presidential Elections Results (%) - Other
2000 Presidential Elections Results (%) - Democratic Party (Gore)
2000 Presidential Elections Results (%) - Republican Party (Bush)
2000 Presidential Elections Results (%) - Other
2004 Presidential Elections Results (%) - Democratic Party (Kerry)
2004 Presidential Elections Results (%) - Republican Party (Bush)
2004 Presidential Elections Results (%) - Other
2008 Presidential Elections Results (%) - Democratic Party (Obama)
2008 Presidential Elections Results (%) - Republican Party (McCain)
2008 Presidential Elections Results (%) - Other
2012 Presidential Elections Results (%) - Democratic Party (Obama)
2012 Presidential Elections Results (%) - Republican Party (Romney)
2012 Presidential Elections Results (%) - Other
2016 Presidential Elections Results (%) - Democratic Party (Clinton)
2016 Presidential Elections Results (%) - Republican Party (Trump)
2016 Presidential Elections Results (%) - Other
2020 Presidential Elections Results (%) - Democratic Party (Biden)
2020 Presidential Elections Results (%) - Republican Party (Trump)
2020 Presidential Elections Results (%) - Other
Ancestries Reported - Arab (%)
Ancestries Reported - Czech (%)
Ancestries Reported - Danish (%)
Ancestries Reported - Dutch (%)
Ancestries Reported - English (%)
Ancestries Reported - French (%)
Ancestries Reported - French Canadian (%)
Ancestries Reported - German (%)
Ancestries Reported - Greek (%)
Ancestries Reported - Hungarian (%)
Ancestries Reported - Irish (%)
Ancestries Reported - Italian (%)
Ancestries Reported - Lithuanian (%)
Ancestries Reported - Norwegian (%)
Ancestries Reported - Polish (%)
Ancestries Reported - Portuguese (%)
Ancestries Reported - Russian (%)
Ancestries Reported - Scotch-Irish (%)
Ancestries Reported - Scottish (%)
Ancestries Reported - Slovak (%)
Ancestries Reported - Subsaharan African (%)
Ancestries Reported - Swedish (%)
Ancestries Reported - Swiss (%)
Ancestries Reported - Ukrainian (%)
Ancestries Reported - United States (%)
Ancestries Reported - Welsh (%)
Ancestries Reported - West Indian (%)
Ancestries Reported - Other (%)
Educational Attainment - No schooling completed (%)
Educational Attainment - Less than high school (%)
Educational Attainment - High school or equivalent (%)
Educational Attainment - Less than 1 year of college (%)
Educational Attainment - 1 or more years of college (%)
Educational Attainment - Associate degree (%)
Educational Attainment - Bachelor's degree (%)
Educational Attainment - Master's degree (%)
Educational Attainment - Professional school degree (%)
Educational Attainment - Doctorate degree (%)
School Enrollment - Nursery, preschool (%)
School Enrollment - Kindergarten (%)
School Enrollment - Grade 1 to 4 (%)
School Enrollment - Grade 5 to 8 (%)
School Enrollment - Grade 9 to 12 (%)
School Enrollment - College undergrad (%)
School Enrollment - Graduate or professional (%)
School Enrollment - Not enrolled in school (%)
School enrollment - Public schools (%)
School enrollment - Private schools (%)
School enrollment - Not enrolled (%)
Median number of rooms in houses and condos
Median number of rooms in apartments
Housing units lacking complete plumbing facilities (%)
Housing units lacking complete kitchen facilities (%)
Density of houses
Urban houses (%)
Rural houses (%)
Households with people 60 years and over (%)
Households with people 65 years and over (%)
Households with people 75 years and over (%)
Households with one or more nonrelatives (%)
Households with no nonrelatives (%)
Population in households (%)
Family households (%)
Nonfamily households (%)
Population in families (%)
Family households with own children (%)
Median number of bedrooms in owner occupied houses
Mean number of bedrooms in owner occupied houses
Median number of bedrooms in renter occupied houses
Mean number of bedrooms in renter occupied houses
Median number of vehichles in owner occupied houses
Mean number of vehichles in owner occupied houses
Median number of vehichles in renter occupied houses
Mean number of vehichles in renter occupied houses
Mortgage status - with mortgage (%)
Mortgage status - with second mortgage (%)
Mortgage status - with home equity loan (%)
Mortgage status - with both second mortgage and home equity loan (%)
Mortgage status - without a mortgage (%)
Average family size
Average family size - White
Average family size - Black or African American
Average family size - Asian
Average family size - Hispanic or Latino
Average family size - American Indian and Alaska Native
Average family size - Multirace
Average family size - Other Race
Geographical mobility - Same house 1 year ago (%)
Geographical mobility - Moved within same county (%)
Geographical mobility - Moved from different county within same state (%)
Geographical mobility - Moved from different state (%)
Geographical mobility - Moved from abroad (%)
Place of birth - Born in state of residence (%)
Place of birth - Born in other state (%)
Place of birth - Native, outside of US (%)
Place of birth - Foreign born (%)
Housing units in structures - 1, detached (%)
Housing units in structures - 1, attached (%)
Housing units in structures - 2 (%)
Housing units in structures - 3 or 4 (%)
Housing units in structures - 5 to 9 (%)
Housing units in structures - 10 to 19 (%)
Housing units in structures - 20 to 49 (%)
Housing units in structures - 50 or more (%)
Housing units in structures - Mobile home (%)
Housing units in structures - Boat, RV, van, etc. (%)
House/condo owner moved in on average (years ago)
Renter moved in on average (years ago)
Year householder moved into unit - Moved in 1999 to March 2000 (%)
Year householder moved into unit - Moved in 1995 to 1998 (%)
Year householder moved into unit - Moved in 1990 to 1994 (%)
Year householder moved into unit - Moved in 1980 to 1989 (%)
Year householder moved into unit - Moved in 1970 to 1979 (%)
Year householder moved into unit - Moved in 1969 or earlier (%)
Means of transportation to work - Drove car alone (%)
Means of transportation to work - Carpooled (%)
Means of transportation to work - Public transportation (%)
Means of transportation to work - Bus or trolley bus (%)
Means of transportation to work - Streetcar or trolley car (%)
Means of transportation to work - Subway or elevated (%)
Means of transportation to work - Railroad (%)
Means of transportation to work - Ferryboat (%)
Means of transportation to work - Taxicab (%)
Means of transportation to work - Motorcycle (%)
Means of transportation to work - Bicycle (%)
Means of transportation to work - Walked (%)
Means of transportation to work - Other means (%)
Working at home (%)
Industry diversity
Most Common Industries - Agriculture, forestry, fishing and hunting, and mining (%)
Most Common Industries - Agriculture, forestry, fishing and hunting (%)
Most Common Industries - Mining, quarrying, and oil and gas extraction (%)
Most Common Industries - Construction (%)
Most Common Industries - Manufacturing (%)
Most Common Industries - Wholesale trade (%)
Most Common Industries - Retail trade (%)
Most Common Industries - Transportation and warehousing, and utilities (%)
Most Common Industries - Transportation and warehousing (%)
Most Common Industries - Utilities (%)
Most Common Industries - Information (%)
Most Common Industries - Finance and insurance, and real estate and rental and leasing (%)
Most Common Industries - Finance and insurance (%)
Most Common Industries - Real estate and rental and leasing (%)
Most Common Industries - Professional, scientific, and management, and administrative and waste management services (%)
Most Common Industries - Professional, scientific, and technical services (%)
Most Common Industries - Management of companies and enterprises (%)
Most Common Industries - Administrative and support and waste management services (%)
Most Common Industries - Educational services, and health care and social assistance (%)
Most Common Industries - Educational services (%)
Most Common Industries - Health care and social assistance (%)
Most Common Industries - Arts, entertainment, and recreation, and accommodation and food services (%)
Most Common Industries - Arts, entertainment, and recreation (%)
Most Common Industries - Accommodation and food services (%)
Most Common Industries - Other services, except public administration (%)
Most Common Industries - Public administration (%)
Occupation diversity
Most Common Occupations - Management, business, science, and arts occupations (%)
Most Common Occupations - Management, business, and financial occupations (%)
Most Common Occupations - Management occupations (%)
Most Common Occupations - Business and financial operations occupations (%)
Most Common Occupations - Computer, engineering, and science occupations (%)
Most Common Occupations - Computer and mathematical occupations (%)
Most Common Occupations - Architecture and engineering occupations (%)
Most Common Occupations - Life, physical, and social science occupations (%)
Most Common Occupations - Education, legal, community service, arts, and media occupations (%)
Most Common Occupations - Community and social service occupations (%)
Most Common Occupations - Legal occupations (%)
Most Common Occupations - Education, training, and library occupations (%)
Most Common Occupations - Arts, design, entertainment, sports, and media occupations (%)
Most Common Occupations - Healthcare practitioners and technical occupations (%)
Most Common Occupations - Health diagnosing and treating practitioners and other technical occupations (%)
Most Common Occupations - Health technologists and technicians (%)
Most Common Occupations - Service occupations (%)
Most Common Occupations - Healthcare support occupations (%)
Most Common Occupations - Protective service occupations (%)
Most Common Occupations - Fire fighting and prevention, and other protective service workers including supervisors (%)
Most Common Occupations - Law enforcement workers including supervisors (%)
Most Common Occupations - Food preparation and serving related occupations (%)
Most Common Occupations - Building and grounds cleaning and maintenance occupations (%)
Most Common Occupations - Personal care and service occupations (%)
Most Common Occupations - Sales and office occupations (%)
Most Common Occupations - Sales and related occupations (%)
Most Common Occupations - Office and administrative support occupations (%)
Most Common Occupations - Natural resources, construction, and maintenance occupations (%)
Most Common Occupations - Farming, fishing, and forestry occupations (%)
Most Common Occupations - Construction and extraction occupations (%)
Most Common Occupations - Installation, maintenance, and repair occupations (%)
Most Common Occupations - Production, transportation, and material moving occupations (%)
Most Common Occupations - Production occupations (%)
Most Common Occupations - Transportation occupations (%)
Most Common Occupations - Material moving occupations (%)
People in Group quarters - Institutionalized population (%)
People in Group quarters - Correctional institutions (%)
People in Group quarters - Federal prisons and detention centers (%)
People in Group quarters - Halfway houses (%)
People in Group quarters - Local jails and other confinement facilities (including police lockups) (%)
People in Group quarters - Military disciplinary barracks (%)
People in Group quarters - State prisons (%)
People in Group quarters - Other types of correctional institutions (%)
People in Group quarters - Nursing homes (%)
People in Group quarters - Hospitals/wards, hospices, and schools for the handicapped (%)
People in Group quarters - Hospitals/wards and hospices for chronically ill (%)
People in Group quarters - Hospices or homes for chronically ill (%)
People in Group quarters - Military hospitals or wards for chronically ill (%)
People in Group quarters - Other hospitals or wards for chronically ill (%)
People in Group quarters - Hospitals or wards for drug/alcohol abuse (%)
People in Group quarters - Mental (Psychiatric) hospitals or wards (%)
People in Group quarters - Schools, hospitals, or wards for the mentally retarded (%)
People in Group quarters - Schools, hospitals, or wards for the physically handicapped (%)
People in Group quarters - Institutions for the deaf (%)
People in Group quarters - Institutions for the blind (%)
People in Group quarters - Orthopedic wards and institutions for the physically handicapped (%)
People in Group quarters - Wards in general hospitals for patients who have no usual home elsewhere (%)
People in Group quarters - Wards in military hospitals for patients who have no usual home elsewhere (%)
People in Group quarters - Juvenile institutions (%)
People in Group quarters - Long-term care (%)
People in Group quarters - Homes for abused, dependent, and neglected children (%)
People in Group quarters - Residential treatment centers for emotionally disturbed children (%)
People in Group quarters - Training schools for juvenile delinquents (%)
People in Group quarters - Short-term care, detention or diagnostic centers for delinquent children (%)
People in Group quarters - Type of juvenile institution unknown (%)
People in Group quarters - Noninstitutionalized population (%)
People in Group quarters - College dormitories (includes college quarters off campus) (%)
People in Group quarters - Military quarters (%)
People in Group quarters - On base (%)
People in Group quarters - Barracks, unaccompanied personnel housing (UPH), (Enlisted/Officer), ;and similar group living quarters for military personnel (%)
People in Group quarters - Transient quarters for temporary residents (%)
People in Group quarters - Military ships (%)
People in Group quarters - Group homes (%)
People in Group quarters - Homes or halfway houses for drug/alcohol abuse (%)
People in Group quarters - Homes for the mentally ill (%)
People in Group quarters - Homes for the mentally retarded (%)
People in Group quarters - Homes for the physically handicapped (%)
People in Group quarters - Other group homes (%)
People in Group quarters - Religious group quarters (%)
People in Group quarters - Dormitories (%)
People in Group quarters - Agriculture workers' dormitories on farms (%)
People in Group quarters - Job Corps and vocational training facilities (%)
People in Group quarters - Other workers' dormitories (%)
People in Group quarters - Crews of maritime vessels (%)
People in Group quarters - Other nonhousehold living situations (%)
People in Group quarters - Other noninstitutional group quarters (%)
Residents speaking English at home (%)
Residents speaking English at home - Born in the United States (%)
Residents speaking English at home - Native, born elsewhere (%)
Residents speaking English at home - Foreign born (%)
Residents speaking Spanish at home (%)
Residents speaking Spanish at home - Born in the United States (%)
Residents speaking Spanish at home - Native, born elsewhere (%)
Residents speaking Spanish at home - Foreign born (%)
Residents speaking other language at home (%)
Residents speaking other language at home - Born in the United States (%)
Residents speaking other language at home - Native, born elsewhere (%)
Residents speaking other language at home - Foreign born (%)
Class of Workers - Employee of private company (%)
Class of Workers - Self-employed in own incorporated business (%)
Class of Workers - Private not-for-profit wage and salary workers (%)
Class of Workers - Local government workers (%)
Class of Workers - State government workers (%)
Class of Workers - Federal government workers (%)
Class of Workers - Self-employed workers in own not incorporated business and Unpaid family workers (%)
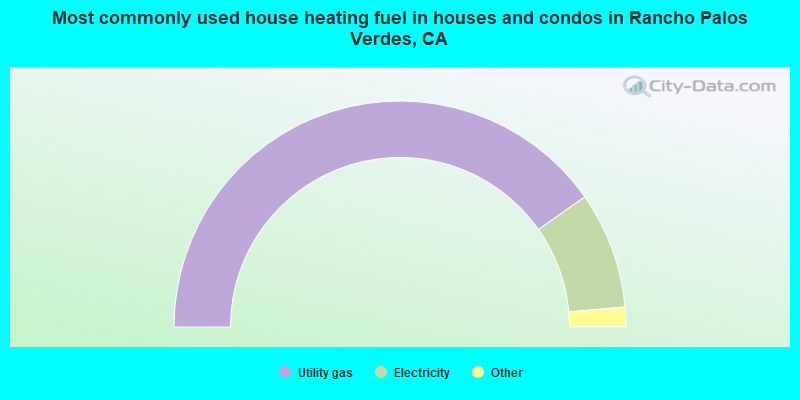
House heating fuel used in houses and condos - Utility gas (%)
House heating fuel used in houses and condos - Bottled, tank, or LP gas (%)
House heating fuel used in houses and condos - Electricity (%)
House heating fuel used in houses and condos - Fuel oil, kerosene, etc. (%)
House heating fuel used in houses and condos - Coal or coke (%)
House heating fuel used in houses and condos - Wood (%)
House heating fuel used in houses and condos - Solar energy (%)
House heating fuel used in houses and condos - Other fuel (%)
House heating fuel used in houses and condos - No fuel used (%)
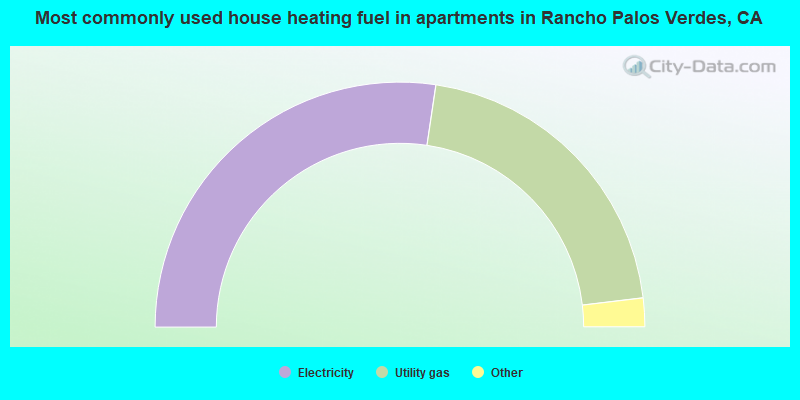
House heating fuel used in apartments - Utility gas (%)
House heating fuel used in apartments - Bottled, tank, or LP gas (%)
House heating fuel used in apartments - Electricity (%)
House heating fuel used in apartments - Fuel oil, kerosene, etc. (%)
House heating fuel used in apartments - Coal or coke (%)
House heating fuel used in apartments - Wood (%)
House heating fuel used in apartments - Solar energy (%)
House heating fuel used in apartments - Other fuel (%)
House heating fuel used in apartments - No fuel used (%)
Armed forces status - In Armed Forces (%)
Armed forces status - Civilian (%)
Armed forces status - Civilian - Veteran (%)
Armed forces status - Civilian - Nonveteran (%)
Fatal accidents locations in years 2005-2021
Fatal accidents locations in 2005
Fatal accidents locations in 2006
Fatal accidents locations in 2007
Fatal accidents locations in 2008
Fatal accidents locations in 2009
Fatal accidents locations in 2010
Fatal accidents locations in 2011
Fatal accidents locations in 2012
Fatal accidents locations in 2013
Fatal accidents locations in 2014
Fatal accidents locations in 2015
Fatal accidents locations in 2016
Fatal accidents locations in 2017
Fatal accidents locations in 2018
Fatal accidents locations in 2019
Fatal accidents locations in 2020
Fatal accidents locations in 2021
Alcohol use - People drinking some alcohol every month (%)
Alcohol use - People not drinking at all (%)
Alcohol use - Average days/month drinking alcohol
Alcohol use - Average drinks/week
Alcohol use - Average days/year people drink much
Audiometry - Average condition of hearing (%)
Audiometry - People that can hear a whisper from across a quiet room (%)
Audiometry - People that can hear normal voice from across a quiet room (%)
Audiometry - Ears ringing, roaring, buzzing (%)
Audiometry - Had a job exposure to loud noise (%)
Audiometry - Had off-work exposure to loud noise (%)
Blood Pressure & Cholesterol - Has high blood pressure (%)
Blood Pressure & Cholesterol - Checking blood pressure at home (%)
Blood Pressure & Cholesterol - Frequently checking blood cholesterol (%)
Blood Pressure & Cholesterol - Has high cholesterol level (%)
Consumer Behavior - Money monthly spent on food at supermarket/grocery store
Consumer Behavior - Money monthly spent on food at other stores
Consumer Behavior - Money monthly spent on eating out
Consumer Behavior - Money monthly spent on carryout/delivered foods
Consumer Behavior - Income spent on food at supermarket/grocery store (%)
Consumer Behavior - Income spent on food at other stores (%)
Consumer Behavior - Income spent on eating out (%)
Consumer Behavior - Income spent on carryout/delivered foods (%)
Current Health Status - General health condition (%)
Current Health Status - Blood donors (%)
Current Health Status - Has blood ever tested for HIV virus (%)
Current Health Status - Left-handed people (%)
Dermatology - People using sunscreen (%)
Diabetes - Diabetics (%)
Diabetes - Had a blood test for high blood sugar (%)
Diabetes - People taking insulin (%)
Diet Behavior & Nutrition - Diet health (%)
Diet Behavior & Nutrition - Milk product consumption (# of products/month)
Diet Behavior & Nutrition - Meals not home prepared (#/week)
Diet Behavior & Nutrition - Meals from fast food or pizza place (#/week)
Diet Behavior & Nutrition - Ready-to-eat foods (#/month)
Diet Behavior & Nutrition - Frozen meals/pizza (#/month)
Drug Use - People that ever used marijuana or hashish (%)
Drug Use - Ever used hard drugs (%)
Drug Use - Ever used any form of cocaine (%)
Drug Use - Ever used heroin (%)
Drug Use - Ever used methamphetamine (%)
Health Insurance - People covered by health insurance (%)
Kidney Conditions-Urology - Avg. # of times urinating at night
Medical Conditions - People with asthma (%)
Medical Conditions - People with anemia (%)
Medical Conditions - People with psoriasis (%)
Medical Conditions - People with overweight (%)
Medical Conditions - Elderly people having difficulties in thinking or remembering (%)
Medical Conditions - People who ever received blood transfusion (%)
Medical Conditions - People having trouble seeing even with glass/contacts (%)
Medical Conditions - People with arthritis (%)
Medical Conditions - People with gout (%)
Medical Conditions - People with congestive heart failure (%)
Medical Conditions - People with coronary heart disease (%)
Medical Conditions - People with angina pectoris (%)
Medical Conditions - People who ever had heart attack (%)
Medical Conditions - People who ever had stroke (%)
Medical Conditions - People with emphysema (%)
Medical Conditions - People with thyroid problem (%)
Medical Conditions - People with chronic bronchitis (%)
Medical Conditions - People with any liver condition (%)
Medical Conditions - People who ever had cancer or malignancy (%)
Mental Health - People who have little interest in doing things (%)
Mental Health - People feeling down, depressed, or hopeless (%)
Mental Health - People who have trouble sleeping or sleeping too much (%)
Mental Health - People feeling tired or having little energy (%)
Mental Health - People with poor appetite or overeating (%)
Mental Health - People feeling bad about themself (%)
Mental Health - People who have trouble concentrating on things (%)
Mental Health - People moving or speaking slowly or too fast (%)
Mental Health - People having thoughts they would be better off dead (%)
Oral Health - Average years since last visit a dentist
Oral Health - People embarrassed because of mouth (%)
Oral Health - People with gum disease (%)
Oral Health - General health of teeth and gums (%)
Oral Health - Average days a week using dental floss/device
Oral Health - Average days a week using mouthwash for dental problem
Oral Health - Average number of teeth
Pesticide Use - Households using pesticides to control insects (%)
Pesticide Use - Households using pesticides to kill weeds (%)
Physical Activity - People doing vigorous-intensity work activities (%)
Physical Activity - People doing moderate-intensity work activities (%)
Physical Activity - People walking or bicycling (%)
Physical Activity - People doing vigorous-intensity recreational activities (%)
Physical Activity - People doing moderate-intensity recreational activities (%)
Physical Activity - Average hours a day doing sedentary activities
Physical Activity - Average hours a day watching TV or videos
Physical Activity - Average hours a day using computer
Physical Functioning - People having limitations keeping them from working (%)
Physical Functioning - People limited in amount of work they can do (%)
Physical Functioning - People that need special equipment to walk (%)
Physical Functioning - People experiencing confusion/memory problems (%)
Physical Functioning - People requiring special healthcare equipment (%)
Prescription Medications - Average number of prescription medicines taking
Preventive Aspirin Use - Adults 40+ taking low-dose aspirin (%)
Reproductive Health - Vaginal deliveries (%)
Reproductive Health - Cesarean deliveries (%)
Reproductive Health - Deliveries resulted in a live birth (%)
Reproductive Health - Pregnancies resulted in a delivery (%)
Reproductive Health - Women breastfeeding newborns (%)
Reproductive Health - Women that had a hysterectomy (%)
Reproductive Health - Women that had both ovaries removed (%)
Reproductive Health - Women that have ever taken birth control pills (%)
Reproductive Health - Women taking birth control pills (%)
Reproductive Health - Women that have ever used Depo-Provera or injectables (%)
Reproductive Health - Women that have ever used female hormones (%)
Sexual Behavior - People 18+ that ever had sex (vaginal, anal, or oral) (%)
Sexual Behavior - Males 18+ that ever had vaginal sex with a woman (%)
Sexual Behavior - Males 18+ that ever performed oral sex on a woman (%)
Sexual Behavior - Males 18+ that ever had anal sex with a woman (%)
Sexual Behavior - Males 18+ that ever had any sex with a man (%)
Sexual Behavior - Females 18+ that ever had vaginal sex with a man (%)
Sexual Behavior - Females 18+ that ever performed oral sex on a man (%)
Sexual Behavior - Females 18+ that ever had anal sex with a man (%)
Sexual Behavior - Females 18+ that ever had any kind of sex with a woman (%)
Sexual Behavior - Average age people first had sex
Sexual Behavior - Average number of female sex partners in lifetime (males 18+)
Sexual Behavior - Average number of female vaginal sex partners in lifetime (males 18+)
Sexual Behavior - Average age people first performed oral sex on a woman (18+)
Sexual Behavior - Average number of woman performed oral sex on in lifetime (18+)
Sexual Behavior - Average number of male sex partners in lifetime (males 18+)
Sexual Behavior - Average number of male anal sex partners in lifetime (males 18+)
Sexual Behavior - Average age people first performed oral sex on a man (18+)
Sexual Behavior - Average number of male oral sex partners in lifetime (18+)
Sexual Behavior - People using protection when performing oral sex (%)
Sexual Behavior - Average number of times people have vaginal or anal sex a year
Sexual Behavior - People having sex without condom (%)
Sexual Behavior - Average number of male sex partners in lifetime (females 18+)
Sexual Behavior - Average number of male vaginal sex partners in lifetime (females 18+)
Sexual Behavior - Average number of female sex partners in lifetime (females 18+)
Sexual Behavior - Circumcised males 18+ (%)
Sleep Disorders - Average hours sleeping at night
Sleep Disorders - People that has trouble sleeping (%)
Smoking-Cigarette Use - People smoking cigarettes (%)
Taste & Smell - People 40+ having problems with smell (%)
Taste & Smell - People 40+ having problems with taste (%)
Taste & Smell - People 40+ that ever had wisdom teeth removed (%)
Taste & Smell - People 40+ that ever had tonsils teeth removed (%)
Taste & Smell - People 40+ that ever had a loss of consciousness because of a head injury (%)
Taste & Smell - People 40+ that ever had a broken nose or other serious injury to face or skull (%)
Taste & Smell - People 40+ that ever had two or more sinus infections (%)
Weight - Average height (inches)
Weight - Average weight (pounds)
Weight - Average BMI
Weight - People that are obese (%)
Weight - People that ever were obese (%)
Weight - People trying to lose weight (%)
18,808 46.0% White alone 13,318 32.6% Asian alone 4,501 11.0% Hispanic 3,167 7.7% Two or more races 711 1.7% Black alone 288 0.7% Other race alone 32 0.08% Native Hawaiian and Other 29 0.07% American Indian alone
Officers per 1,000 residents here:
0.02California average:
1.98
Latest news from Rancho Palos Verdes, CA collected exclusively by city-data.com from local newspapers, TV, and radio stations
Ancestries: English (4.8%), American (3.7%), European (3.7%), Italian (3.7%), German (3.0%), Croatian (2.5%).
Current Local Time:
Land area: 13.7 square miles.
Population density: 2,966 people per square mile (average).
10,969 residents are foreign born (18.8% Asia , 4.1% Europe , 2.9% Latin America ).
This city:
26.8%California:
26.5%
Median real estate property taxes paid for housing units with mortgages in 2022: $10,281 (0.6%)Median real estate property taxes paid for housing units with no mortgage in 2022: $6,691 (0.5%)
Nearest city with pop. 50,000+: Palos Verdes, CA
Nearest city with pop. 200,000+: Long Beach, CA
Nearest city with pop. 1,000,000+: Los Angeles, CA
Nearest cities:
Latitude: 33.76 N, Longitude: 118.36 W
Daytime population change due to commuting: -7,713 (-18.9%)Workers who live and work in this city: 5,316 (29.8%)
Area code commonly used in this area: 310
Property values in Rancho Palos Verdes, CA
Rancho Palos Verdes tourist attractions:
Single-family new house construction building permits:
2022: 9 buildings , average cost: $1,417,8002021: 5 buildings , average cost: $1,178,0002020: 3 buildings , average cost: $837,8002019: 14 buildings , average cost: $941,5002018: 27 buildings , average cost: $432,3002017: 11 buildings , average cost: $34,0002016: 15 buildings , average cost: $139,8002015: 28 buildings , average cost: $220,6002014: 8 buildings , average cost: $401,2002013: 9 buildings , average cost: $450,9002012: 9 buildings , average cost: $243,3002011: 15 buildings , average cost: $209,9002010: 5 buildings , average cost: $223,8002009: 9 buildings , average cost: $563,6002008: 12 buildings , average cost: $548,9002007: 19 buildings , average cost: $465,5002006: 12 buildings , average cost: $604,4002005: 10 buildings , average cost: $668,8002004: 33 buildings , average cost: $576,3002003: 29 buildings , average cost: $578,3002002: 12 buildings , average cost: $530,9002001: 12 buildings , average cost: $453,0002000: 40 buildings , average cost: $647,2001999: 43 buildings , average cost: $536,7001998: 80 buildings , average cost: $422,3001997: 28 buildings , average cost: $382,800Unemployment in December 2023:
Most common industries in Rancho Palos Verdes, CA (%)
Both Males Females
Professional, scientific, technical services (13.4%)
Health care (10.5%)
Educational services (9.4%)
Transportation equipment (6.0%)
Finance & insurance (5.5%)
Public administration (4.9%)
Real estate & rental & leasing (4.0%)
Professional, scientific, technical services (14.4%)
Transportation equipment (8.9%)
Health care (8.0%)
Finance & insurance (6.0%)
Public administration (5.0%)
Educational services (4.0%)
Other transportation, support activities, couriers (3.7%)
Educational services (16.5%)
Health care (13.8%)
Professional, scientific, technical services (12.2%)
Finance & insurance (4.8%)
Public administration (4.7%)
Real estate & rental & leasing (4.4%)
Arts, entertainment, recreation (2.8%)
Most common occupations in Rancho Palos Verdes, CA (%)
Both Males Females
Other management occupations, except farmers and farm managers (7.9%)
Top executives (7.3%)
Other sales and related occupations, including supervisors (5.8%)
Engineers (5.0%)
Other office and administrative support workers, including supervisors (4.1%)
Sales representatives, services, wholesale and manufacturing (4.0%)
Physicians and surgeons (3.5%)
Top executives (11.2%)
Other management occupations, except farmers and farm managers (9.2%)
Engineers (7.7%)
Other sales and related occupations, including supervisors (6.2%)
Physicians and surgeons (4.7%)
Sales representatives, services, wholesale and manufacturing (4.6%)
Computer specialists (4.0%)
Other office and administrative support workers, including supervisors (7.3%)
Other management occupations, except farmers and farm managers (6.3%)
Preschool, kindergarten, elementary, and middle school teachers (5.7%)
Other sales and related occupations, including supervisors (5.3%)
Secretaries and administrative assistants (4.7%)
Accountants and auditors (3.6%)
Registered nurses (3.4%)
Earthquake activity:
Rancho Palos Verdes-area historical earthquake activity is significantly above California state average. It is 6610% greater than the overall U.S. average. On 7/21/1952 at 11:52:14, a magnitude 7.7 (7.7 UK, Class: Major, Intensity: VIII - XII) earthquake occurred 93.2 miles away from the city center, causing $50,000,000 total damage On 6/28/1992 at 11:57:34, a magnitude 7.6 (6.2 MB, 7.6 MS, 7.3 MW, Depth: 0.7 mi) earthquake occurred 109.1 miles away from the city center, causing 3 deaths ( 1 shaking deaths, 2 other deaths) and 400 injuries, causing $100,000,000 total damage and $40,000,000 insured lossesOn 10/16/1999 at 09:46:44, a magnitude 7.4 (6.3 MB, 7.4 MS, 7.2 MW, 7.3 ML) earthquake occurred 122.2 miles away from the city center On 11/4/1927 at 13:51:53, a magnitude 7.5 (7.5 UK) earthquake occurred 172.0 miles away from Rancho Palos Verdes center On 1/17/1994 at 12:30:55, a magnitude 6.8 (6.4 MB, 6.8 MS, 6.7 MW, Depth: 11.4 mi, Class: Strong, Intensity: VII - IX) earthquake occurred 30.1 miles away from the city center, causing 60 deaths ( 60 shaking deaths) and 7000 injuriesOn 4/21/1918 at 22:32:30, a magnitude 6.8 (6.8 UK) earthquake occurred 53.3 miles away from Rancho Palos Verdes center Magnitude types: body-wave magnitude (MB), local magnitude (ML), surface-wave magnitude (MS), moment magnitude (MW) Natural disasters: The number of natural disasters in Los Angeles County (57) is a lot greater than the US average (15).Major Disasters (Presidential) Declared: 27Emergencies Declared: 3Fires: 37, Floods: 16, Storms: 9, Winter Storms: 6, Landslides: 5, Mudslides: 5, Earthquakes: 3, Freeze: 1, Heavy Rain: 1, Hurricane: 1, Snow: 1, Tornado: 1, Wind: 1, Other: 1 (Note: some incidents may be assigned to more than one category). Hospitals and medical centers in Rancho Palos Verdes: CANTERBURY,THE (5801 WEST CRESTRIDGE ROAD)
Other hospitals and medical centers near Rancho Palos Verdes: PECK HOUSE (Hospital, about 3 miles away; TORRANCE, CA)
TRINITYCARE HOSPICE (Hospital, about 4 miles away; TORRANCE, CA)
LOS PALOS CONVALESCENT HOSP (Nursing Home, about 4 miles away; SAN PEDRO, CA)
SEACREST CONVALESCENT HOSPITAL (Nursing Home, about 4 miles away; SAN PEDRO, CA)
PALOS VERDES HEALTH CARE CENTE (Nursing Home, about 4 miles away; LOMITA, CA)
JUST RIGHT HELP, INC (Home Health Center, about 4 miles away; TORRANCE, CA)
PROVIDENCE LITTLE CO OF MARY MED CTR SAN PEDRO (about 4 miles away; SAN PEDRO, CA)
Amtrak stations near Rancho Palos Verdes: 6 miles: SAN PEDRO (CATALINA TERMINAL, BERTH 95) - Bus Station Services: partially wheelchair accessible, enclosed waiting area, public restrooms, public payphones, snack bar, paid short-term parking, paid long-term parking, call for taxi service.
11 miles: LONG BEACH (601 N. LONG BEACH BLVD.) - Bus Station Services: fully wheelchair accessible, public restrooms, public payphones, full-service food facilities, paid short-term parking, paid long-term parking, call for taxi service, public transit connection.
College/University in Rancho Palos Verdes: Marymount California University Full-time enrollment: 932; Location: 30800 Palos Verdes Drive East; Private, not-for-profit; Website: www.MarymountCalifornia.edu; Offers Master's degree )
Colleges/universities with over 2000 students nearest to Rancho Palos Verdes:
Los Angeles Harbor College (about 6 miles; Wilmington, CA ; Full-time enrollment: 5,285)
Wyotech-Long Beach (about 9 miles; Long Beach, CA ; FT enrollment: 2,453)
El Camino Community College District (about 10 miles; Torrance, CA ; FT enrollment: 13,952)
California State University-Dominguez Hills (about 10 miles; Carson, CA ; FT enrollment: 9,862)
El Camino College-Compton Center (about 13 miles; Compton, CA ; FT enrollment: 4,506)
Los Angeles Southwest College (about 13 miles; Los Angeles, CA ; FT enrollment: 3,247)
Long Beach City College (about 15 miles; Long Beach, CA ; FT enrollment: 15,602)
Biggest public elementary/middle schools in Rancho Palos Verdes: RUDECINDA SEPULVEDA DODSON MIDDLE Students: 1,831, Location: 28014 MONTEREINA DR., Grades: 6-8)RIDGECREST INTERMEDIATE Students: 921, Location: 28915 N.BAY RD., Grades: 6-8)MIRALESTE INTERMEDIATE Students: 916, Location: 29323 PALOS VERDES DR. E., Grades: 6-8)SILVER SPUR ELEMENTARY Students: 378, Location: 5500 IRONWOOD ST., Grades: KG-5)VISTA GRANDE ELEMENTARY Students: 368, Location: 7032 PURPLERIDGE DR., Grades: KG-5)SOLEADO ELEMENTARY Students: 303, Location: 27800 LONGHILL DR., Grades: KG-5)CRESTWOOD STREET ELEMENTARY Students: 294, Location: 1946 W. CRESTWOOD ST., Grades: KG-6)MIRA CATALINA ELEMENTARY Students: 267, Location: 30511 LUCANIA DR., Grades: KG-5)CORNERSTONE AT PEDREGAL ELEMENTARY Students: 253, Location: 6069 GROVEOAK PL., Grades: KG-5)POINT VICENTE ELEMENTARY Students: 251, Location: 30540 RUE DE LA PIERRE, Grades: KG-5)Private elementary/middle schools in Rancho Palos Verdes: ST JOHN FISHER SCHOOL Students: 291, Location: 5446 CREST RD, Grades: KG-8)
PENINSULA MONTESSORI SCHOOL Students: 231, Location: 31100 HAWTHORNE BLVD, Grades: PK-6)
See full list of schools located in Rancho Palos Verdes
Notable locations in Rancho Palos Verdes: (A) , Los Verdes Golf Course (B) , Point Vicente Lighthouse (C) , Point Vicente Fishing Access (D) , Los Angeles County Fire Department Station 83 (E) , Los Angeles County Fire Department Station 53 (F) . Display/hide their locations on the map
Shopping Centers: (1) , Westmont Plaza Shopping Center (2) , Terrace at South Bay Shopping Center (3) . Display/hide their locations on the map
Church in Rancho Palos Verdes: (A) . Display/hide its location on the map
Cemetery: (1) . Display/hide its location on the map
Parks in Rancho Palos Verdes include: (1) , Point Vicente County Park (2) , Palos Verdes Peninsular Park (3) , Abalone Cove Ecological Reserve (4) , Friendship Park (5) , Point Vicente Park (6) , Del Cerro Park (7) , Martingale Trailhead Park (8) , Hesse Park (9) . Display/hide their locations on the map
Beach: (A) . Display/hide its location on the map
Birthplace of: Robbie Rogers - Soccer player.
Los Angeles County has a predicted average indoor radon screening level between 2 and 4 pCi/L (pico curies per liter) - Moderate Potential Average household size: This city:
2.6 peopleCalifornia:
2.9 people
Percentage of family households: This city:
78.0%Whole state:
68.7%
Percentage of households with unmarried partners: This city:
2.5%Whole state:
7.2%
Likely homosexual households (counted as self-reported same-sex unmarried-partner households)
Lesbian couples: 0.3% of all households Gay men: 0.3% of all households
People in group quarters in Rancho Palos Verdes in 2010:
126 people in college/university student housing
112 people in workers' group living quarters and job corps centers
39 people in group homes intended for adults
28 people in other noninstitutional facilities
27 people in nursing facilities/skilled-nursing facilities
8 people in residential treatment centers for adults
People in group quarters in Rancho Palos Verdes in 2000:
185 people in other noninstitutional group quarters
166 people in nursing homes
90 people in college dormitories (includes college quarters off campus)
33 people in religious group quarters
23 people in other group homes
6 people in homes for the physically handicapped
6 people in other nonhousehold living situations
Banks with branches in Rancho Palos Verdes (2011 data):
U.S. Bank National Association: Rancho Palos Verdes at 29000 South Western Ave, branch established on 1954/05/07. Info updated 2012/01/30: Bank assets: $330,470.8 mil, Deposits: $236,091.5 mil, headquarters in Cincinnati, OH, positive income , 3121 total offices , Holding Company: U.S. Bancorp
Wells Fargo Bank, National Association: Rancho Palos Verdes Branch at 28350 South Western Avenue, branch established on 1885/01/01. Info updated 2011/04/05: Bank assets: $1,161,490.0 mil, Deposits: $905,653.0 mil, headquarters in Sioux Falls, SD, positive income , 6395 total offices , Holding Company: Wells Fargo & Company
Citibank, National Association: Rancho Palos Verdes- Golden Cove Bra at 31242 Palos Verdes Dr W, branch established on 2006/10/01. Info updated 2012/01/10: Bank assets: $1,288,658.0 mil, Deposits: $882,541.0 mil, headquarters in Sioux Falls, SD, positive income , International Specialization, 1048 total offices , Holding Company: Citigroup Inc.
Union Bank, National Association: Miraleste Plaza Branch at 20 Miraleste Plaza, branch established on 1968/01/01. Info updated 2011/09/01: Bank assets: $88,967.5 mil, Deposits: $65,286.4 mil, headquarters in San Francisco, CA, positive income , Commercial Lending Specialization, 403 total offices , Holding Company: Mitsubishi Ufj Financial Group, Inc.
OneWest Bank, FSB: 30019 Hawthorne Blvd. at 30019 Hawthorne Blvd., branch established on 2006/03/13. Info updated 2011/07/21: Bank assets: $26,181.3 mil, Deposits: $15,408.4 mil, headquarters in Pasadena, CA, positive income , 79 total offices
For population 15 years and over in Rancho Palos Verdes:
Never married: 23.1%Now married: 62.4%Separated: 1.0%Widowed: 6.7%Divorced: 6.8% For population 25 years and over in Rancho Palos Verdes:
High school or higher: 98.1%Bachelor's degree or higher: 68.9%Graduate or professional degree: 32.3%Unemployed: 2.6%Mean travel time to work (commute): 24.0 minutes
Education Gini index (Inequality in education) Here:
9.1California average:
15.5
Religion statistics for Rancho Palos Verdes, CA (based on Los Angeles County data)
Religion Adherents Congregations Catholic 3,542,994 275 Evangelical Protestant 814,611 3,249 Other 451,594 1,023 Mainline Protestant 229,056 860 Black Protestant 112,338 290 Orthodox 63,517 76 None 4,604,495 -
Source: Clifford Grammich, Kirk Hadaway, Richard Houseal, Dale E.Jones, Alexei Krindatch, Richie Stanley and Richard H.Taylor. 2012. 2010 U.S.Religion Census: Religious Congregations & Membership Study. Association of Statisticians of American Religious Bodies. Jones, Dale E., et al. 2002. Congregations and Membership in the United States 2000. Nashville, TN: Glenmary Research Center. Graphs represent county-level data
Food Environment Statistics: Number of grocery stores : 2,084Los Angeles County :
2.12 / 10,000 pop.California :
2.14 / 10,000 pop.
Number of supercenters and club stores : 32Here :
0.03 / 10,000 pop.California :
0.04 / 10,000 pop.
Number of convenience stores (no gas) : 567Los Angeles County :
0.58 / 10,000 pop.California :
0.62 / 10,000 pop.
Number of convenience stores (with gas) : 1,206This county :
1.23 / 10,000 pop.California :
1.49 / 10,000 pop.
Number of full-service restaurants : 7,008Los Angeles County :
7.15 / 10,000 pop.State :
7.42 / 10,000 pop.
Adult diabetes rate : Los Angeles County :
7.5%California :
7.3%
Adult obesity rate : Los Angeles County :
20.4%State :
21.3%
Low-income preschool obesity rate : This county :
18.6%State :
17.9%
Health and Nutrition: Healthy diet rate : Rancho Palos Verdes:
57.1%State:
49.4%
Average overall health of teeth and gums : This city:
54.2%State:
48.0%
Average BMI : Rancho Palos Verdes:
27.5California:
28.1
People feeling badly about themselves : This city:
16.5%State:
20.2%
People not drinking alcohol at all : Rancho Palos Verdes:
13.3%California:
11.2%
Average hours sleeping at night : This city:
6.9California:
6.8
Overweight people : Rancho Palos Verdes:
32.7%California:
31.5%
General health condition : Average condition of hearing : Rancho Palos Verdes:
79.4%California:
80.9%
More about Health and Nutrition of Rancho Palos Verdes, CA Residents
Local government employment and payroll (March 2022)
Function
Full-time employees
Monthly full-time payroll
Average yearly full-time wage
Part-time employees
Monthly part-time payroll
Other and Unallocable
23 $167,903 $87,602 1 $1,729 Streets and Highways
11 $83,895 $91,522 1 $1,889 Financial Administration
11 $76,701 $83,674 0 $0 Other Government Administration
10 $104,406 $125,287 0 $0 Parks and Recreation
10 $72,502 $87,002 52 $102,300 Solid Waste Management
1 $5,870 $70,440 0 $0
Totals for Government
66 $511,276 $92,959 54 $105,918
Rancho Palos Verdes government finances - Expenditure in 2017 (per resident):
Construction - Regular Highways: $2,744,000 ($67.71)
Parks and Recreation: $123,000 ($3.04)Current Operations - Central Staff Services: $11,481,000 ($283.29)
Police Protection: $5,814,000 ($143.46)Parks and Recreation: $4,202,000 ($103.68)Regular Highways: $2,473,000 ($61.02)Financial Administration: $1,481,000 ($36.54)Protective Inspection and Regulation - Other: $1,331,000 ($32.84)Natural Resources - Other: $662,000 ($16.33)Transit Utilities: $613,000 ($15.13)Housing and Community Development: $475,000 ($11.72)General - Other: $250,000 ($6.17)Solid Waste Management: $223,000 ($5.50)Health - Other: $100,000 ($2.47)General - Interest on Debt: $1,041,000 ($25.69)
Other Capital Outlay - Protective Inspection and Regulation - Other: $120,000 ($2.96)
Housing and Community Development: $56,000 ($1.38)
Rancho Palos Verdes government finances - Revenue in 2017 (per resident):
Charges - Other: $756,000 ($18.65)
Parks and Recreation: $276,000 ($6.81)Housing and Community Development: $221,000 ($5.45)Solid Waste Management: $187,000 ($4.61)Federal Intergovernmental - Other: $200,000 ($4.93)
Housing and Community Development: $142,000 ($3.50)Miscellaneous - General Revenue - Other: $1,894,000 ($46.73)
Rents: $460,000 ($11.35)Interest Earnings: $443,000 ($10.93)Fines and Forfeits: $153,000 ($3.78)Donations From Private Sources: $36,000 ($0.89)State Intergovernmental - Highways: $815,000 ($20.11)
Other: $488,000 ($12.04)General Local Government Support: $55,000 ($1.36)Tax - Property: $12,859,000 ($317.29)
Other Selective Sales: $5,601,000 ($138.20)General Sales and Gross Receipts: $3,986,000 ($98.35)Public Utilities Sales: $3,760,000 ($92.78)Other License: $1,401,000 ($34.57)Other: $995,000 ($24.55)Occupation and Business License - Other: $904,000 ($22.31)Documentary and Stock Transfer: $443,000 ($10.93)
Rancho Palos Verdes government finances - Debt in 2017 (per resident):
Long Term Debt - Beginning Outstanding - Unspecified Public Purpose: $26,031,000 ($642.31)
Outstanding Unspecified Public Purpose: $25,931,000 ($639.85)Retired Unspecified Public Purpose: $100,000 ($2.47)
Rancho Palos Verdes government finances - Cash and Securities in 2017 (per resident):
Bond Funds - Cash and Securities: $28,596,000 ($705.60)
Other Funds - Cash and Securities: $38,739,000 ($955.88)
2.98% of this county's 2021 resident taxpayers lived in other counties in 2020 ($81,235 average adjusted gross income )
Here:
2.98%California average:
5.19%
0.01% of residents moved from foreign countries ($155 average AGI )Los Angeles County:
0.01%California average:
0.03%
Top counties from which taxpayers relocated into this county between 2020 and 2021:
4.68% of this county's 2020 resident taxpayers moved to other counties in 2021 ($97,324 average adjusted gross income )
Here:
4.68%California average:
6.14%
0.01% of residents moved to foreign countries ($196 average AGI )Los Angeles County:
0.01%California average:
0.02%
Top counties to which taxpayers relocated from this county between 2020 and 2021:
Businesses in Rancho Palos Verdes, CA
Name Count Name Count
7-Eleven 2 H&R Block 1 Bally Total Fitness 1 IHOP 1 Baskin-Robbins 1 Kroger 1 Carl\s Jr. 1 LA Fitness 1 Dennys 1 Quiznos 1 Discount Tire 1 Starbucks 1 Domino's Pizza 2 Trader Joe's 2 El Pollo Loco 1 UPS 1 FedEx 3
Strongest AM radio stations in Rancho Palos Verdes:
KNX (1070 AM; 50 kW; LOS ANGELES, CA; Owner: INFINITY BROADCASTING OPERATIONS, INC.)
KFI (640 AM; 50 kW; LOS ANGELES, CA; Owner: CAPSTAR TX LIMITED PARTNERSHIP)
KFWB (980 AM; 50 kW; LOS ANGELES, CA; Owner: INFINITY BROADCASTING OPERATIONS, INC.)
KSPN (710 AM; 50 kW; LOS ANGELES, CA; Owner: KABC-AM RADIO, INC.)
KLAC (570 AM; 50 kW; LOS ANGELES, CA; Owner: AMFM RADIO LICENSES, L.L.C.)
KBLA (1580 AM; 50 kW; SANTA MONICA, CA)
KTNQ (1020 AM; 50 kW; LOS ANGELES, CA; Owner: KTNQ-AM LICENSE CORP.)
KMPC (1540 AM; 50 kW; LOS ANGELES, CA; Owner: ROSE CITY RADIO CORPORATION)
KXTA (1150 AM; 50 kW; LOS ANGELES, CA; Owner: CITICASTERS LICENSES, L.P.)
KDIS (1110 AM; 50 kW; PASADENA, CA; Owner: ABC,INC.)
KXMX (1190 AM; 25 kW; ANAHEIM, CA; Owner: NEW INSPIRATION BROADCASTING COMPANY)
KRLA (870 AM; 20 kW; GLENDALE, CA; Owner: NEW INSPIRATION BROADCASTING COMPANY)
KPLS (830 AM; 50 kW; ORANGE, CA; Owner: CRN LICENSES, LLC)
Strongest FM radio stations in Rancho Palos Verdes:
KZAB (93.5 FM; REDONDO BEACH, CA; Owner: KZAB LICENSING, INC.)
KKBT (100.3 FM; LOS ANGELES, CA; Owner: RADIO ONE LICENSES, LLC)
KZLA-FM (93.9 FM; LOS ANGELES, CA; Owner: EMMIS RADIO LICENSE CORPORATION)
KPWR (105.9 FM; LOS ANGELES, CA; Owner: EMMIS RADIO LICENSE CORPORATION)
KLSX (97.1 FM; LOS ANGELES, CA; Owner: INFINITY BROADCASTING OPERATIONS, INC.)
KRTH-FM (101.1 FM; LOS ANGELES, CA; Owner: INFINITY BROADCASTING OPERATIONS, INC.)
KUSC (91.5 FM; LOS ANGELES, CA; Owner: UNIVERSITY OF SOUTHERN CALIFORNIA)
KKLA-FM (99.5 FM; LOS ANGELES, CA; Owner: NEW INSPIRATION BROADCASTING CO., INC.)
KCBS-FM (93.1 FM; LOS ANGELES, CA; Owner: INFINITY BROADCASTING OPERATIONS, INC.)
KSCA (101.9 FM; GLENDALE, CA; Owner: HBC LICENSE CORPORATION)
KLOS (95.5 FM; LOS ANGELES, CA; Owner: KLOS-FM RADIO, INC.)
K212FA (90.3 FM; TEMPLE CITY, CA; Owner: EDUCATIONAL MEDIA FOUNDATION)
KOST (103.5 FM; LOS ANGELES, CA; Owner: CAPSTAR TX LIMITED PARTNERSHIP)
KLVE (107.5 FM; LOS ANGELES, CA; Owner: KLVE-FM LICENSE CORP.)
KIIS-FM (102.7 FM; LOS ANGELES, CA; Owner: CITICASTERS LICENSES, L.P.)
KPCC (89.3 FM; PASADENA, CA; Owner: PASADENA AREA COMMUNITY COLLEGE DISTRICT)
KHHT (92.3 FM; LOS ANGELES, CA; Owner: AMFM RADIO LICENSES, L.L.C.)
KBIG-FM (104.3 FM; LOS ANGELES, CA; Owner: AMFM RADIO LICENSES, L.L.C.)
KMZT-FM (105.1 FM; LOS ANGELES, CA; Owner: MOUNT WILSON FM BROADCASTERS, INC.)
KPFK (90.7 FM; LOS ANGELES, CA; Owner: PACIFICA FOUNDATION, INC)
TV broadcast stations around Rancho Palos Verdes:
KTRO-LP (Channel 50; LANCASTER, CA; Owner: ROBERT D. ADELMAN)
KCBS-TV (Channel 2; LOS ANGELES, CA; Owner: CBS BROADCASTING INC.)
Home Mortgage Disclosure Act Aggregated Statistics For Year 2009(Based on 5 full and 5 partial tracts) A) FHA, FSA/RHS & VA B) Conventional C) Refinancings D) Home Improvement Loans F) Non-occupant Loans on Number Average Value Number Average Value Number Average Value Number Average Value Number Average Value
LOANS ORIGINATED 24 $559,424 283 $571,677 1,634 $423,521 85 $329,173 71 $370,399 APPLICATIONS APPROVED, NOT ACCEPTED 0 $0 23 $552,923 185 $467,550 7 $488,023 6 $326,923 APPLICATIONS DENIED 1 $345,150 58 $611,487 392 $515,865 17 $342,741 26 $520,335 APPLICATIONS WITHDRAWN 4 $525,985 46 $624,243 299 $468,514 20 $326,577 21 $433,593 FILES CLOSED FOR INCOMPLETENESS 0 $0 12 $619,726 79 $496,024 8 $259,334 9 $544,650
Aggregated Statistics For Year 2008(Based on 5 full and 5 partial tracts) A) FHA, FSA/RHS & VA B) Conventional C) Refinancings D) Home Improvement Loans E) Loans on Dwellings For 5+ Families F) Non-occupant Loans on G) Loans On Manufactured Number Average Value Number Average Value Number Average Value Number Average Value Number Average Value Number Average Value Number Average Value
LOANS ORIGINATED 6 $666,418 273 $634,703 475 $533,731 46 $272,574 1 $1,865,000 46 $505,587 0 $0 APPLICATIONS APPROVED, NOT ACCEPTED 2 $548,990 79 $616,867 112 $492,411 3 $526,627 0 $0 9 $654,910 2 $185,460 APPLICATIONS DENIED 4 $649,622 111 $753,724 246 $624,617 28 $306,447 0 $0 20 $666,222 1 $553,390 APPLICATIONS WITHDRAWN 4 $401,948 63 $715,360 108 $538,450 8 $421,349 0 $0 10 $1,202,640 0 $0 FILES CLOSED FOR INCOMPLETENESS 0 $0 14 $589,223 50 $590,535 2 $304,950 0 $0 6 $360,987 0 $0
Aggregated Statistics For Year 2007(Based on 5 full and 5 partial tracts) A) FHA, FSA/RHS & VA B) Conventional C) Refinancings D) Home Improvement Loans E) Loans on Dwellings For 5+ Families F) Non-occupant Loans on Number Average Value Number Average Value Number Average Value Number Average Value Number Average Value Number Average Value
LOANS ORIGINATED 1 $157,060 424 $722,940 755 $611,338 85 $416,066 1 $44,807,000 80 $624,606 APPLICATIONS APPROVED, NOT ACCEPTED 0 $0 122 $684,999 196 $602,507 26 $418,718 0 $0 18 $582,760 APPLICATIONS DENIED 0 $0 116 $731,281 334 $722,337 46 $519,257 0 $0 28 $885,189 APPLICATIONS WITHDRAWN 0 $0 77 $816,299 157 $616,585 16 $613,479 0 $0 16 $533,880 FILES CLOSED FOR INCOMPLETENESS 0 $0 24 $775,869 67 $734,079 6 $260,360 0 $0 2 $924,000
Aggregated Statistics For Year 2006(Based on 5 full and 5 partial tracts) B) Conventional C) Refinancings D) Home Improvement Loans E) Loans on Dwellings For 5+ Families F) Non-occupant Loans on G) Loans On Manufactured Number Average Value Number Average Value Number Average Value Number Average Value Number Average Value Number Average Value
LOANS ORIGINATED 498 $663,125 878 $592,708 100 $376,836 2 $1,105,000 81 $510,277 0 $0 APPLICATIONS APPROVED, NOT ACCEPTED 100 $675,769 189 $577,614 24 $379,104 0 $0 13 $453,888 0 $0 APPLICATIONS DENIED 178 $672,252 309 $714,894 35 $393,560 0 $0 21 $576,780 1 $31,000 APPLICATIONS WITHDRAWN 88 $692,145 249 $627,669 19 $403,639 0 $0 17 $592,006 0 $0 FILES CLOSED FOR INCOMPLETENESS 18 $816,197 54 $629,491 5 $403,294 0 $0 1 $653,590 0 $0
Aggregated Statistics For Year 2005(Based on 5 full and 5 partial tracts) B) Conventional C) Refinancings D) Home Improvement Loans E) Loans on Dwellings For 5+ Families F) Non-occupant Loans on G) Loans On Manufactured Number Average Value Number Average Value Number Average Value Number Average Value Number Average Value Number Average Value
LOANS ORIGINATED 597 $707,638 1,169 $547,547 151 $432,624 2 $8,045,000 116 $490,537 1 $136,990 APPLICATIONS APPROVED, NOT ACCEPTED 117 $615,845 192 $570,109 16 $436,617 0 $0 15 $563,432 2 $58,270 APPLICATIONS DENIED 133 $772,906 309 $594,953 41 $391,360 0 $0 27 $536,002 2 $138,485 APPLICATIONS WITHDRAWN 117 $682,722 291 $522,109 28 $372,386 0 $0 20 $481,896 0 $0 FILES CLOSED FOR INCOMPLETENESS 37 $619,864 62 $603,804 10 $295,721 0 $0 6 $425,598 0 $0
Aggregated Statistics For Year 2004(Based on 5 full and 5 partial tracts) A) FHA, FSA/RHS & VA B) Conventional C) Refinancings D) Home Improvement Loans E) Loans on Dwellings For 5+ Families F) Non-occupant Loans on G) Loans On Manufactured Number Average Value Number Average Value Number Average Value Number Average Value Number Average Value Number Average Value Number Average Value
LOANS ORIGINATED 0 $0 724 $605,556 1,970 $461,115 140 $369,766 1 $980,000 140 $382,364 1 $100,270 APPLICATIONS APPROVED, NOT ACCEPTED 0 $0 151 $584,712 335 $465,311 17 $302,946 0 $0 24 $357,098 0 $0 APPLICATIONS DENIED 0 $0 138 $659,656 395 $553,788 45 $327,928 0 $0 31 $357,450 1 $106,050 APPLICATIONS WITHDRAWN 1 $164,220 98 $751,440 320 $487,801 22 $444,775 0 $0 13 $415,954 0 $0 FILES CLOSED FOR INCOMPLETENESS 0 $0 34 $571,390 90 $484,030 7 $408,054 0 $0 9 $390,102 0 $0
Aggregated Statistics For Year 2003(Based on 5 full and 5 partial tracts) A) FHA, FSA/RHS & VA B) Conventional C) Refinancings D) Home Improvement Loans E) Loans on Dwellings For 5+ Families F) Non-occupant Loans on Number Average Value Number Average Value Number Average Value Number Average Value Number Average Value Number Average Value
LOANS ORIGINATED 1 $246,810 855 $484,403 5,076 $377,691 46 $133,833 4 $17,377,258 202 $285,756 APPLICATIONS APPROVED, NOT ACCEPTED 2 $350,270 142 $464,679 711 $369,190 15 $152,568 0 $0 37 $291,339 APPLICATIONS DENIED 0 $0 137 $563,260 686 $442,417 20 $88,998 0 $0 50 $384,217 APPLICATIONS WITHDRAWN 0 $0 126 $496,219 618 $383,986 18 $151,383 0 $0 43 $301,605 FILES CLOSED FOR INCOMPLETENESS 0 $0 30 $536,784 188 $440,428 3 $102,803 0 $0 11 $368,357
Aggregated Statistics For Year 2002(Based on 2 full and 2 partial tracts) A) FHA, FSA/RHS & VA B) Conventional C) Refinancings D) Home Improvement Loans F) Non-occupant Loans on Number Average Value Number Average Value Number Average Value Number Average Value Number Average Value
LOANS ORIGINATED 4 $172,492 480 $424,070 2,032 $368,010 26 $95,474 62 $293,095 APPLICATIONS APPROVED, NOT ACCEPTED 1 $45,000 78 $485,978 349 $372,843 10 $105,302 9 $271,913 APPLICATIONS DENIED 0 $0 78 $392,959 300 $403,365 17 $44,549 7 $347,564 APPLICATIONS WITHDRAWN 1 $133,040 74 $379,335 259 $344,547 6 $106,200 8 $224,048 FILES CLOSED FOR INCOMPLETENESS 0 $0 25 $351,812 128 $411,362 1 $10,000 8 $270,961
Aggregated Statistics For Year 2001(Based on 2 full and 2 partial tracts) A) FHA, FSA/RHS & VA B) Conventional C) Refinancings D) Home Improvement Loans E) Loans on Dwellings For 5+ Families F) Non-occupant Loans on Number Average Value Number Average Value Number Average Value Number Average Value Number Average Value Number Average Value
LOANS ORIGINATED 6 $176,545 450 $335,531 1,203 $348,240 46 $71,979 1 $115,690 42 $269,549 APPLICATIONS APPROVED, NOT ACCEPTED 4 $185,400 81 $372,489 199 $334,936 19 $88,475 0 $0 10 $400,561 APPLICATIONS DENIED 3 $157,903 67 $395,765 243 $340,127 24 $79,327 0 $0 9 $208,344 APPLICATIONS WITHDRAWN 1 $199,980 66 $343,465 201 $335,979 18 $101,548 0 $0 11 $181,032 FILES CLOSED FOR INCOMPLETENESS 0 $0 15 $337,847 80 $362,257 4 $133,120 0 $0 2 $279,805
Aggregated Statistics For Year 2000(Based on 2 full and 2 partial tracts) A) FHA, FSA/RHS & VA B) Conventional C) Refinancings D) Home Improvement Loans E) Loans on Dwellings For 5+ Families F) Non-occupant Loans on Number Average Value Number Average Value Number Average Value Number Average Value Number Average Value Number Average Value
LOANS ORIGINATED 11 $113,428 491 $367,273 329 $281,145 64 $71,864 0 $0 29 $244,409 APPLICATIONS APPROVED, NOT ACCEPTED 1 $115,010 82 $374,288 77 $232,948 20 $54,033 0 $0 4 $200,268 APPLICATIONS DENIED 1 $112,440 100 $482,903 129 $293,003 20 $67,577 1 $739,930 7 $188,381 APPLICATIONS WITHDRAWN 3 $94,987 79 $340,706 84 $210,595 9 $43,177 0 $0 3 $177,740 FILES CLOSED FOR INCOMPLETENESS 0 $0 12 $536,869 31 $349,755 3 $82,783 0 $0 2 $352,955
Aggregated Statistics For Year 1999(Based on 1 full and 5 partial tracts) A) FHA, FSA/RHS & VA B) Conventional C) Refinancings D) Home Improvement Loans E) Loans on Dwellings For 5+ Families F) Non-occupant Loans on Number Average Value Number Average Value Number Average Value Number Average Value Number Average Value Number Average Value
LOANS ORIGINATED 16 $126,978 809 $366,256 1,060 $309,296 102 $60,433 0 $0 87 $216,140 APPLICATIONS APPROVED, NOT ACCEPTED 3 $149,883 143 $381,180 216 $319,664 20 $61,914 0 $0 14 $206,969 APPLICATIONS DENIED 4 $119,340 145 $387,949 304 $339,539 37 $48,755 1 $2,209,040 15 $260,315 APPLICATIONS WITHDRAWN 5 $113,580 123 $379,125 214 $279,528 9 $39,201 0 $0 17 $186,375 FILES CLOSED FOR INCOMPLETENESS 1 $77,290 29 $441,934 79 $330,979 3 $70,663 0 $0 4 $273,665
Detailed mortgage data for all 10 tracts in Rancho Palos Verdes, CA
Private Mortgage Insurance Companies Aggregated Statistics For Year 2009(Based on 3 full and 3 partial tracts) A) Conventional B) Refinancings Number Average Value Number Average Value
LOANS ORIGINATED 5 $300,184 0 $0 APPLICATIONS APPROVED, NOT ACCEPTED 4 $332,472 1 $581,700 APPLICATIONS DENIED 3 $551,093 1 $306,000 APPLICATIONS WITHDRAWN 0 $0 0 $0 FILES CLOSED FOR INCOMPLETENESS 1 $414,000 0 $0
Aggregated Statistics For Year 2008(Based on 4 full and 2 partial tracts) A) Conventional B) Refinancings Number Average Value Number Average Value
LOANS ORIGINATED 12 $468,380 2 $618,135 APPLICATIONS APPROVED, NOT ACCEPTED 4 $493,780 1 $332,000 APPLICATIONS DENIED 1 $649,800 2 $332,000 APPLICATIONS WITHDRAWN 0 $0 0 $0 FILES CLOSED FOR INCOMPLETENESS 0 $0 0 $0
Aggregated Statistics For Year 2007(Based on 3 full and 1 partial tracts) A) Conventional B) Refinancings C) Non-occupant Loans on Number Average Value Number Average Value Number Average Value
LOANS ORIGINATED 4 $434,338 1 $674,870 0 $0 APPLICATIONS APPROVED, NOT ACCEPTED 0 $0 0 $0 0 $0 APPLICATIONS DENIED 1 $394,320 3 $510,887 2 $401,065 APPLICATIONS WITHDRAWN 2 $398,175 0 $0 0 $0 FILES CLOSED FOR INCOMPLETENESS 0 $0 0 $0 0 $0
Aggregated Statistics For Year 2006(Based on 3 full tracts) A) Conventional B) Refinancings Number Average Value Number Average Value
LOANS ORIGINATED 2 $517,385 3 $485,597 APPLICATIONS APPROVED, NOT ACCEPTED 0 $0 1 $350,000 APPLICATIONS DENIED 0 $0 0 $0 APPLICATIONS WITHDRAWN 0 $0 1 $392,390 FILES CLOSED FOR INCOMPLETENESS 0 $0 0 $0
Aggregated Statistics For Year 2005(Based on 3 full and 1 partial tracts) A) Conventional B) Refinancings Number Average Value Number Average Value
LOANS ORIGINATED 6 $432,338 2 $414,450 APPLICATIONS APPROVED, NOT ACCEPTED 1 $320,000 0 $0 APPLICATIONS DENIED 1 $741,570 0 $0 APPLICATIONS WITHDRAWN 0 $0 0 $0 FILES CLOSED FOR INCOMPLETENESS 0 $0 0 $0
Aggregated Statistics For Year 2004(Based on 4 full tracts) A) Conventional B) Refinancings Number Average Value Number Average Value
LOANS ORIGINATED 2 $324,000 1 $261,000 APPLICATIONS APPROVED, NOT ACCEPTED 0 $0 3 $368,623 APPLICATIONS DENIED 0 $0 0 $0 APPLICATIONS WITHDRAWN 0 $0 1 $307,550 FILES CLOSED FOR INCOMPLETENESS 0 $0 0 $0
Aggregated Statistics For Year 2003(Based on 4 full and 4 partial tracts) A) Conventional B) Refinancings C) Non-occupant Loans on Number Average Value Number Average Value Number Average Value
LOANS ORIGINATED 16 $324,736 9 $401,167 1 $295,980 APPLICATIONS APPROVED, NOT ACCEPTED 6 $362,630 5 $560,888 1 $343,320 APPLICATIONS DENIED 0 $0 1 $1,157,000 0 $0 APPLICATIONS WITHDRAWN 0 $0 0 $0 0 $0 FILES CLOSED FOR INCOMPLETENESS 1 $399,140 0 $0 0 $0
Aggregated Statistics For Year 2002(Based on 2 full and 2 partial tracts) A) Conventional B) Refinancings C) Non-occupant Loans on Number Average Value Number Average Value Number Average Value
LOANS ORIGINATED 12 $391,029 4 $221,955 2 $295,015 APPLICATIONS APPROVED, NOT ACCEPTED 4 $287,542 7 $465,893 0 $0 APPLICATIONS DENIED 0 $0 0 $0 0 $0 APPLICATIONS WITHDRAWN 2 $282,000 0 $0 0 $0 FILES CLOSED FOR INCOMPLETENESS 1 $477,230 0 $0 0 $0
Aggregated Statistics For Year 2001(Based on 2 full and 1 partial tracts) A) Conventional B) Refinancings Number Average Value Number Average Value
LOANS ORIGINATED 18 $294,142 3 $305,827 APPLICATIONS APPROVED, NOT ACCEPTED 6 $267,270 1 $216,920 APPLICATIONS DENIED 0 $0 1 $334,540 APPLICATIONS WITHDRAWN 1 $311,400 0 $0 FILES CLOSED FOR INCOMPLETENESS 0 $0 0 $0
Aggregated Statistics For Year 2000(Based on 2 full and 2 partial tracts) A) Conventional B) Refinancings C) Non-occupant Loans on Number Average Value Number Average Value Number Average Value
LOANS ORIGINATED 35 $218,142 9 $317,984 2 $344,180 APPLICATIONS APPROVED, NOT ACCEPTED 9 $269,671 3 $298,410 0 $0 APPLICATIONS DENIED 6 $194,165 1 $369,250 0 $0 APPLICATIONS WITHDRAWN 2 $331,945 0 $0 0 $0 FILES CLOSED FOR INCOMPLETENESS 0 $0 0 $0 0 $0
Aggregated Statistics For Year 1999(Based on 1 full and 5 partial tracts) A) Conventional B) Refinancings C) Non-occupant Loans on Number Average Value Number Average Value Number Average Value
LOANS ORIGINATED 52 $246,462 21 $187,926 3 $113,500 APPLICATIONS APPROVED, NOT ACCEPTED 12 $349,352 11 $247,914 0 $0 APPLICATIONS DENIED 4 $296,622 5 $294,700 0 $0 APPLICATIONS WITHDRAWN 3 $245,380 2 $280,025 1 $203,010 FILES CLOSED FOR INCOMPLETENESS 1 $105,010 1 $465,460 0 $0
Most common first names in Rancho Palos Verdes, CA among deceased individuals Name Count Lived (average)
John 112 79.6 years Mary 91 84.0 years William 86 80.0 years Robert 85 75.6 years James 59 77.0 years Richard 46 78.0 years Charles 44 79.2 years Margaret 43 85.3 years Helen 42 85.3 years George 40 79.6 years
Most common last names in Rancho Palos Verdes, CA among deceased individuals Last name Count Lived (average)
Smith 26 83.3 years Lee 23 82.2 years Miller 19 80.3 years Johnson 18 83.7 years Brown 16 78.5 years Williams 15 73.3 years Anderson 13 82.5 years Jones 13 79.9 years Kim 12 80.4 years Peterson 12 83.0 years
Rancho Palos Verdes compared to California state average:
Median household income above state average. Median house value above state average. Unemployed percentage significantly below state average. Black race population percentage significantly below state average. Hispanic race population percentage significantly below state average. Median age significantly above state average. Renting percentage below state average. Length of stay since moving in above state average. Number of rooms per house above state average. Percentage of population with a bachelor's degree or higher significantly above state average. Rancho Palos Verdes on our top lists :
#13 on the list of "Top 101 cities where residents moved in more then 10 years ago (10,000+ households)"
#31 on the list of "Top 101 cities with the most residents born in Japan (population 500+)"
#36 on the list of "Top 101 cities with the most residents born in Taiwan (population 500+)"
#65 on the list of "Top 100 cities with highest median house value (pop. 5,000+)"
#66 on the list of "Top 101 cities with the most residents born in Eastern Asia (population 500+)"
#68 on the list of "Top 101 cities with largest percentage of males in occupations: architecture and engineering occupations (population 5,000+)"
#96 on the list of "Top 101 cities with the most residents born in China (population 500+)"
#1 on the list of "Top 101 counties with the most Evangelical Protestant congregations"
#1 on the list of "Top 101 counties with the most Mainline Protestant congregations"
#1 on the list of "Top 101 counties with the most Orthodox adherents"
#1 on the list of "Top 101 counties with the highest ground withdrawal of fresh water for public supply (pop. 50,000+)"
#1 on the list of "Top 101 counties with the most Catholic adherents (pop. 50,000+)"
Top Patent Applicants
Maryam Rofougaran (261)
Rajiv Shah (101)
Mehran Moshfeghi (94)
Frank Yang (57)
Benjamim Tang (42)
Murat Mese (37)
Xin Wang (30)
Andreas F. Kotowski (20)
Eddie J. Chen (18)
Brad J. Spellberg (15)
Total of 1711 patent applications in 2008-2024.

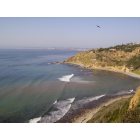
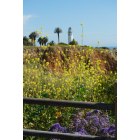
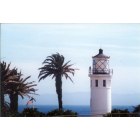

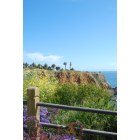
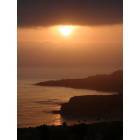


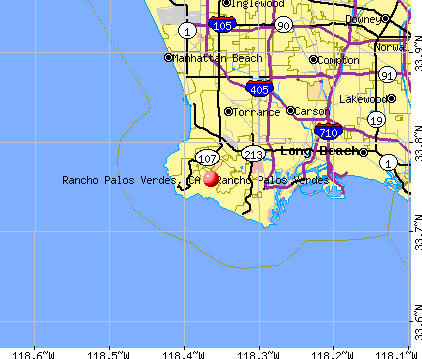


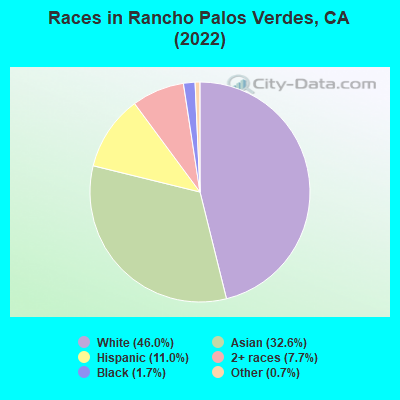
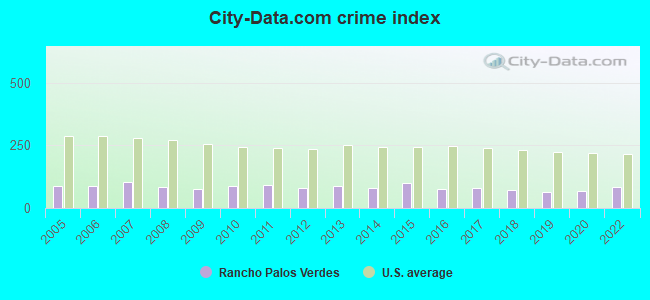
 Recent articles from our blog. Our writers, many of them Ph.D. graduates or candidates, create easy-to-read articles on a wide variety of topics.


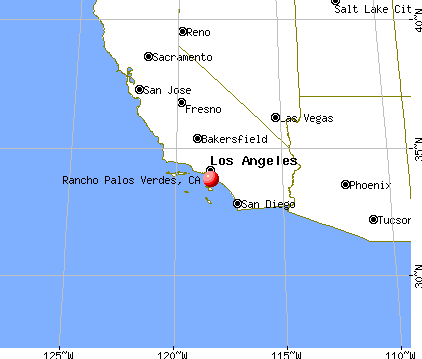
 (2.9 miles
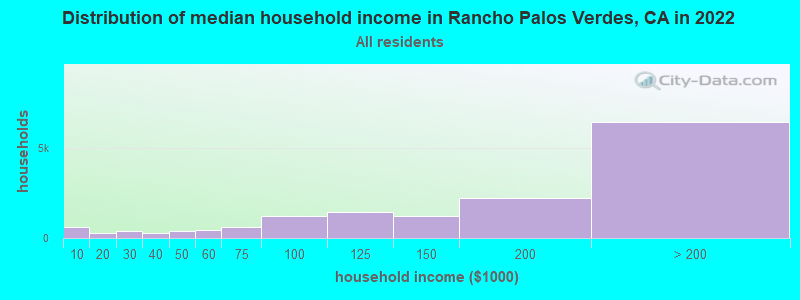
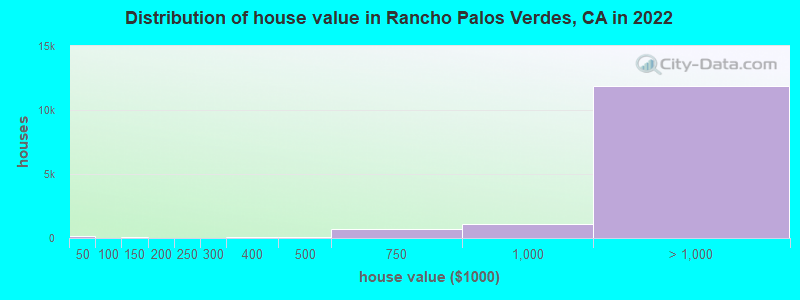
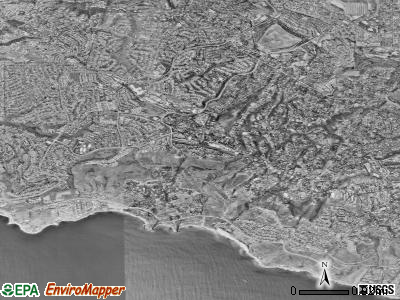
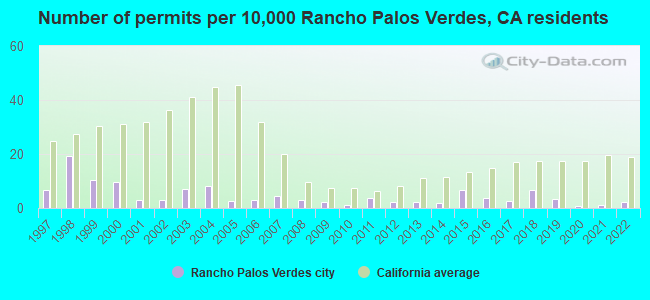
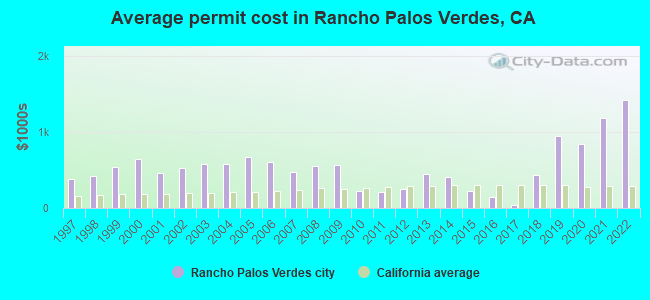

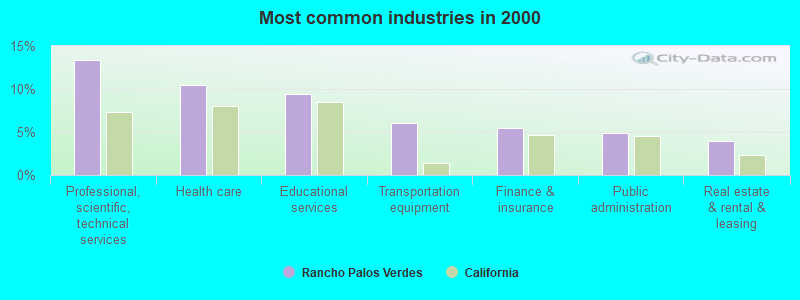
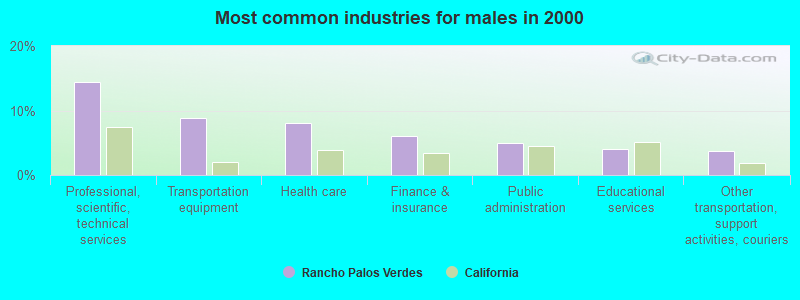
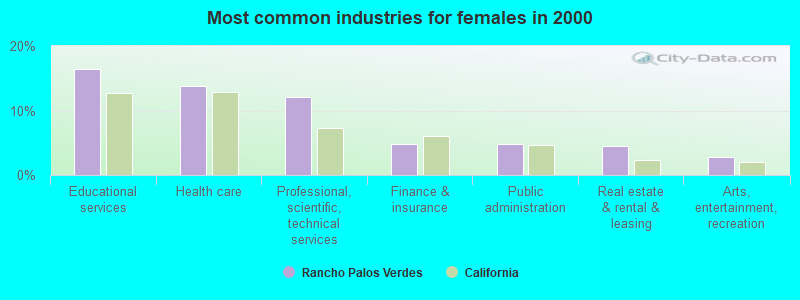
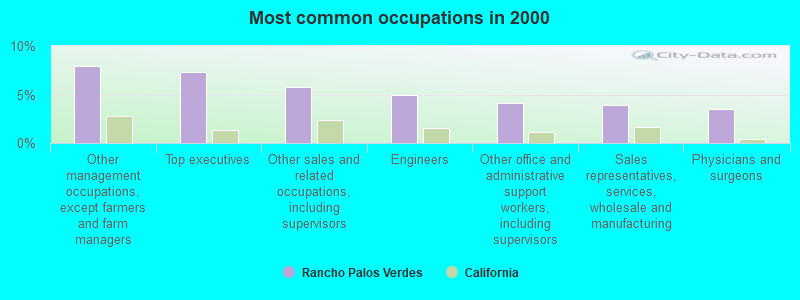
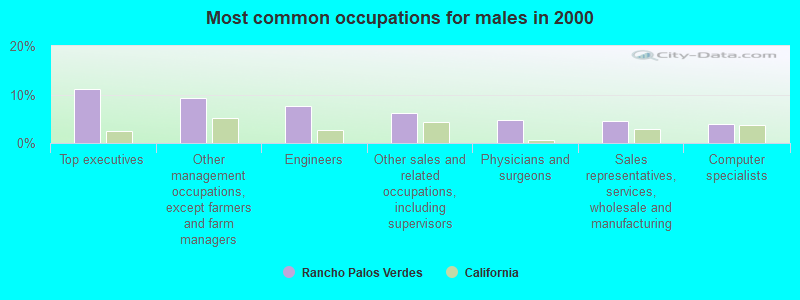
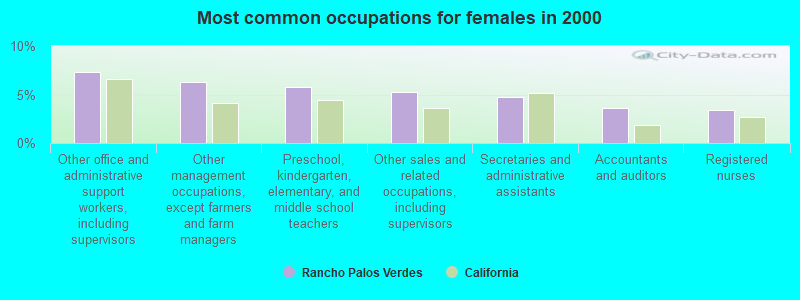
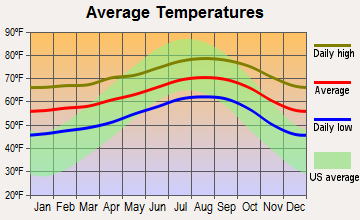
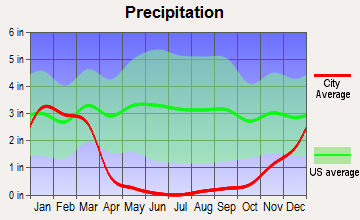
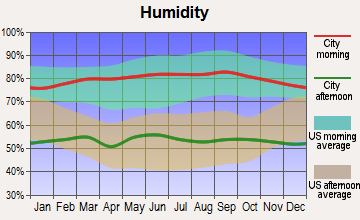
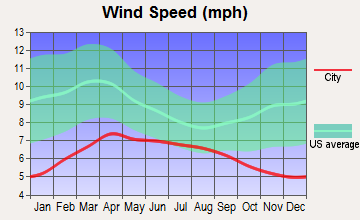
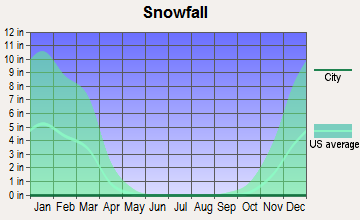
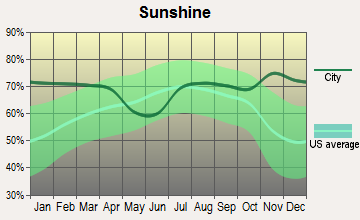
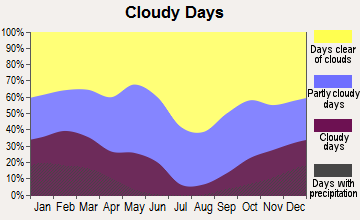
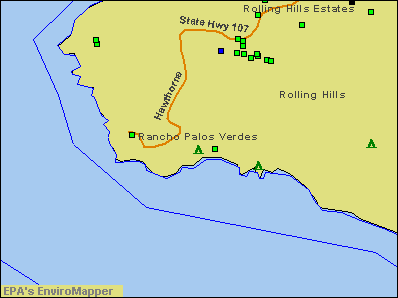

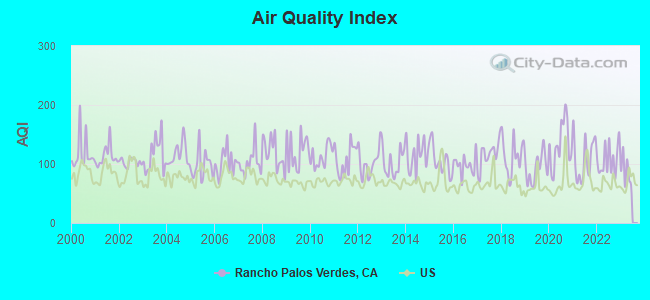
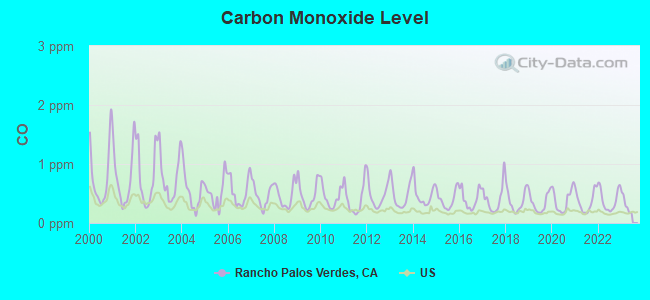
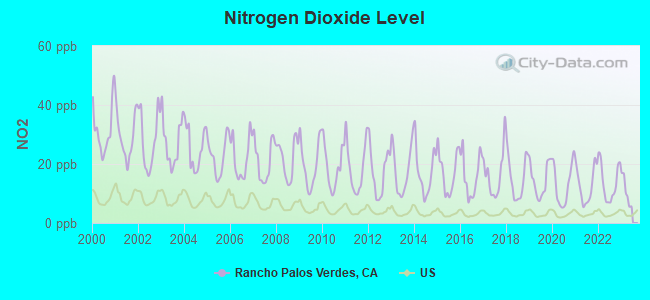
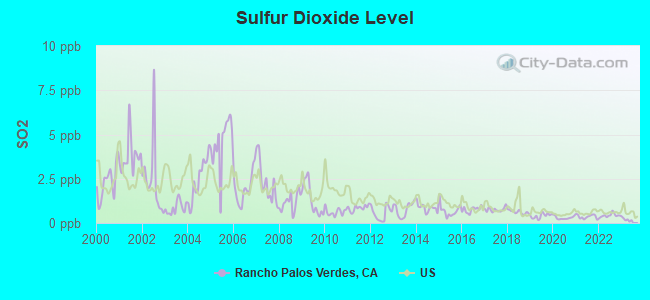
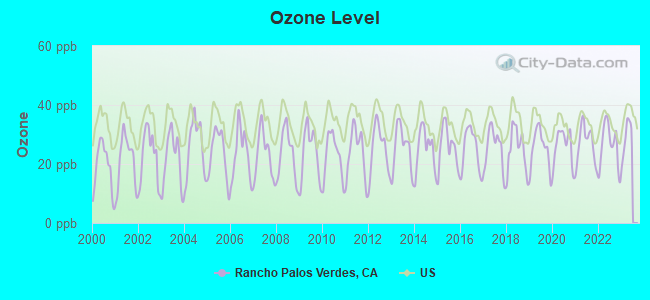

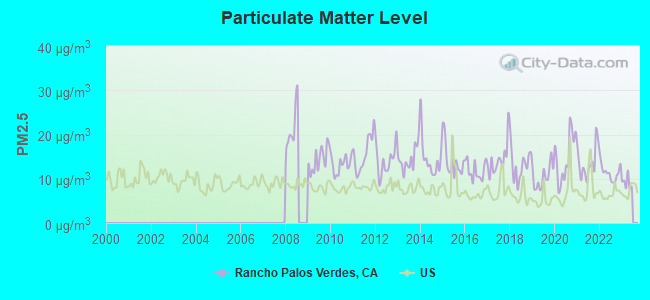
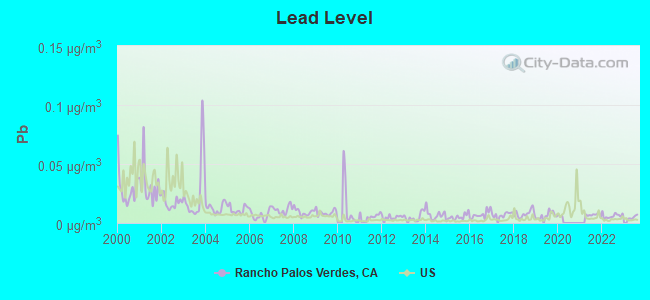
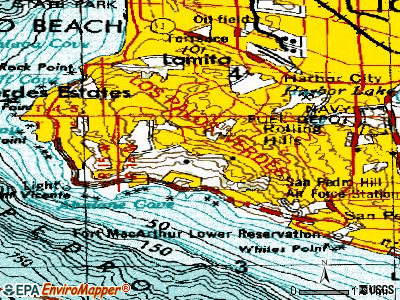
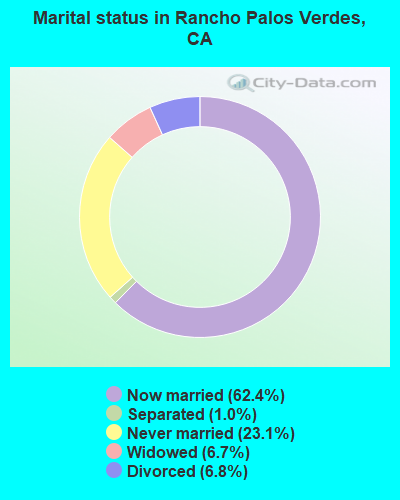
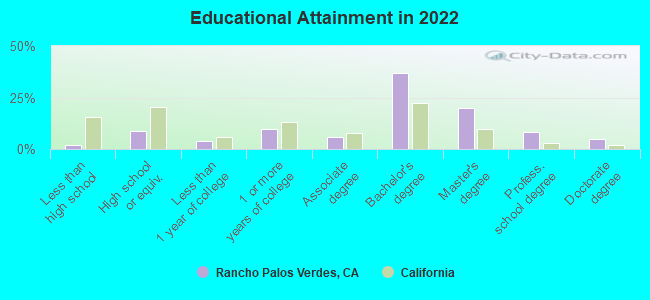
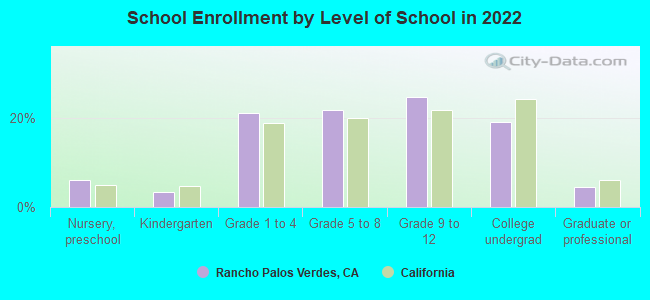
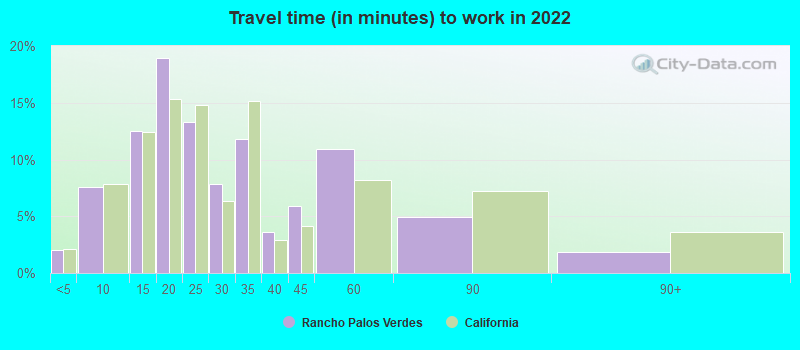
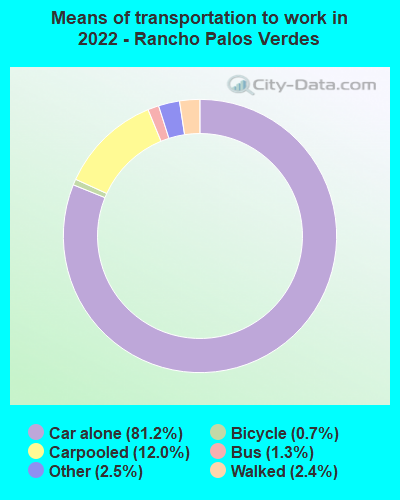


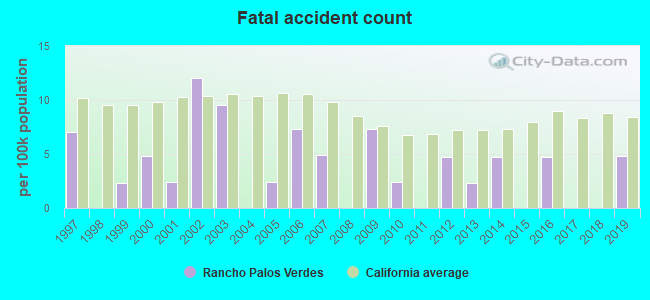
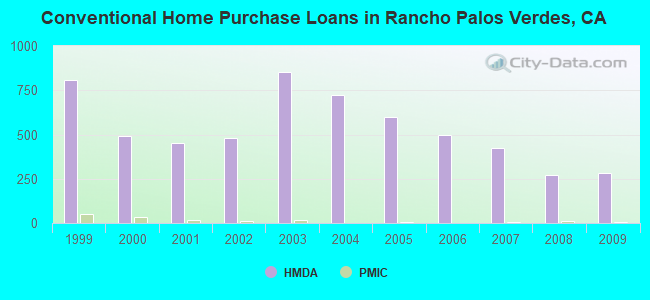
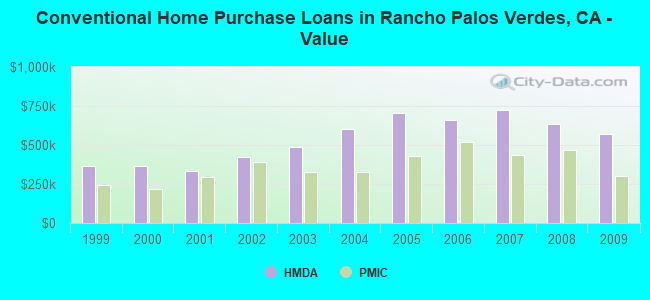
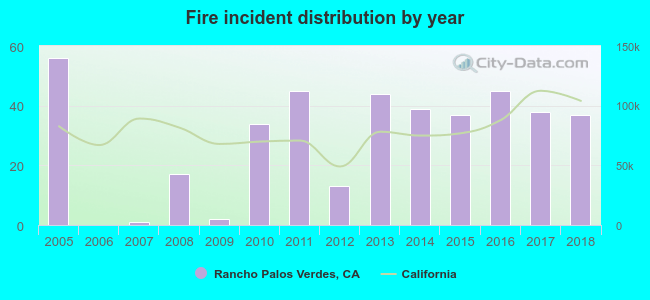 Based on the data from the years 2005 - 2018 the average number of fires per year is 29. The highest number of fire incidents - 56 took place in 2005, and the least - 0 in 2006. The data has a declining trend.
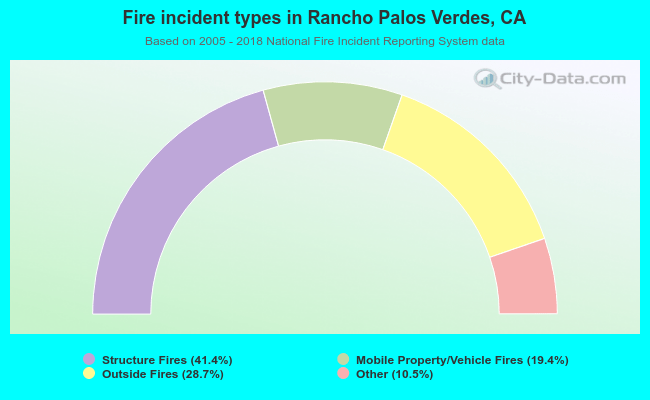 When looking into fire subcategories, the most reports belonged to: Structure Fires (41.4%), and Outside Fires (28.7%).