Ridgefield, Connecticut Submit your own pictures of this place and show them to the world
OSM Map
General Map
Google Map
MSN Map
OSM Map
General Map
Google Map
MSN Map
OSM Map
General Map
Google Map
MSN Map
OSM Map
General Map
Google Map
MSN Map
Please wait while loading the map...
Population in 2010: 7,645. Population change since 2000: +6.0%Males: 3,490 Females: 4,155
March 2022 cost of living index in Ridgefield: 133.7 (high, U.S. average is 100) Percentage of residents living in poverty in 2022: 1.9%for White Non-Hispanic residents , 0.3% for Hispanic or Latino residents , 3.7% for other race residents , 0.8% for two or more races residents )
Profiles of local businesses
Business Search - 14 Million verified businesses
Data:
Median household income ($)
Median household income (% change since 2000)
Household income diversity
Ratio of average income to average house value (%)
Ratio of average income to average rent
Median household income ($) - White
Median household income ($) - Black or African American
Median household income ($) - Asian
Median household income ($) - Hispanic or Latino
Median household income ($) - American Indian and Alaska Native
Median household income ($) - Multirace
Median household income ($) - Other Race
Median household income for houses/condos with a mortgage ($)
Median household income for apartments without a mortgage ($)
Races - White alone (%)
Races - White alone (% change since 2000)
Races - Black alone (%)
Races - Black alone (% change since 2000)
Races - American Indian alone (%)
Races - American Indian alone (% change since 2000)
Races - Asian alone (%)
Races - Asian alone (% change since 2000)
Races - Hispanic (%)
Races - Hispanic (% change since 2000)
Races - Native Hawaiian and Other Pacific Islander alone (%)
Races - Native Hawaiian and Other Pacific Islander alone (% change since 2000)
Races - Two or more races (%)
Races - Two or more races (% change since 2000)
Races - Other race alone (%)
Races - Other race alone (% change since 2000)
Racial diversity
Unemployment (%)
Unemployment (% change since 2000)
Unemployment (%) - White
Unemployment (%) - Black or African American
Unemployment (%) - Asian
Unemployment (%) - Hispanic or Latino
Unemployment (%) - American Indian and Alaska Native
Unemployment (%) - Multirace
Unemployment (%) - Other Race
Population density (people per square mile)
Population - Males (%)
Population - Females (%)
Population - Males (%) - White
Population - Males (%) - Black or African American
Population - Males (%) - Asian
Population - Males (%) - Hispanic or Latino
Population - Males (%) - American Indian and Alaska Native
Population - Males (%) - Multirace
Population - Males (%) - Other Race
Population - Females (%) - White
Population - Females (%) - Black or African American
Population - Females (%) - Asian
Population - Females (%) - Hispanic or Latino
Population - Females (%) - American Indian and Alaska Native
Population - Females (%) - Multirace
Population - Females (%) - Other Race
Coronavirus confirmed cases (Apr 17, 2024)
Deaths caused by coronavirus (Apr 17, 2024)
Coronavirus confirmed cases (per 100k population) (Apr 17, 2024)
Deaths caused by coronavirus (per 100k population) (Apr 17, 2024)
Daily increase in number of cases (Apr 17, 2024)
Weekly increase in number of cases (Apr 17, 2024)
Cases doubled (in days) (Apr 17, 2024)
Hospitalized patients (Apr 18, 2022)
Negative test results (Apr 18, 2022)
Total test results (Apr 18, 2022)
COVID Vaccine doses distributed (per 100k population) (Sep 19, 2023)
COVID Vaccine doses administered (per 100k population) (Sep 19, 2023)
COVID Vaccine doses distributed (Sep 19, 2023)
COVID Vaccine doses administered (Sep 19, 2023)
Likely homosexual households (%)
Likely homosexual households (% change since 2000)
Likely homosexual households - Lesbian couples (%)
Likely homosexual households - Lesbian couples (% change since 2000)
Likely homosexual households - Gay men (%)
Likely homosexual households - Gay men (% change since 2000)
Cost of living index
Median gross rent ($)
Median contract rent ($)
Median monthly housing costs ($)
Median house or condo value ($)
Median house or condo value ($ change since 2000)
Mean house or condo value by units in structure - 1, detached ($)
Mean house or condo value by units in structure - 1, attached ($)
Mean house or condo value by units in structure - 2 ($)
Mean house or condo value by units in structure by units in structure - 3 or 4 ($)
Mean house or condo value by units in structure - 5 or more ($)
Mean house or condo value by units in structure - Boat, RV, van, etc. ($)
Mean house or condo value by units in structure - Mobile home ($)
Median house or condo value ($) - White
Median house or condo value ($) - Black or African American
Median house or condo value ($) - Asian
Median house or condo value ($) - Hispanic or Latino
Median house or condo value ($) - American Indian and Alaska Native
Median house or condo value ($) - Multirace
Median house or condo value ($) - Other Race
Median resident age
Resident age diversity
Median resident age - Males
Median resident age - Females
Median resident age - White
Median resident age - Black or African American
Median resident age - Asian
Median resident age - Hispanic or Latino
Median resident age - American Indian and Alaska Native
Median resident age - Multirace
Median resident age - Other Race
Median resident age - Males - White
Median resident age - Males - Black or African American
Median resident age - Males - Asian
Median resident age - Males - Hispanic or Latino
Median resident age - Males - American Indian and Alaska Native
Median resident age - Males - Multirace
Median resident age - Males - Other Race
Median resident age - Females - White
Median resident age - Females - Black or African American
Median resident age - Females - Asian
Median resident age - Females - Hispanic or Latino
Median resident age - Females - American Indian and Alaska Native
Median resident age - Females - Multirace
Median resident age - Females - Other Race
Commute - mean travel time to work (minutes)
Travel time to work - Less than 5 minutes (%)
Travel time to work - Less than 5 minutes (% change since 2000)
Travel time to work - 5 to 9 minutes (%)
Travel time to work - 5 to 9 minutes (% change since 2000)
Travel time to work - 10 to 19 minutes (%)
Travel time to work - 10 to 19 minutes (% change since 2000)
Travel time to work - 20 to 29 minutes (%)
Travel time to work - 20 to 29 minutes (% change since 2000)
Travel time to work - 30 to 39 minutes (%)
Travel time to work - 30 to 39 minutes (% change since 2000)
Travel time to work - 40 to 59 minutes (%)
Travel time to work - 40 to 59 minutes (% change since 2000)
Travel time to work - 60 to 89 minutes (%)
Travel time to work - 60 to 89 minutes (% change since 2000)
Travel time to work - 90 or more minutes (%)
Travel time to work - 90 or more minutes (% change since 2000)
Marital status - Never married (%)
Marital status - Now married (%)
Marital status - Separated (%)
Marital status - Widowed (%)
Marital status - Divorced (%)
Median family income ($)
Median family income (% change since 2000)
Median non-family income ($)
Median non-family income (% change since 2000)
Median per capita income ($)
Median per capita income (% change since 2000)
Median family income ($) - White
Median family income ($) - Black or African American
Median family income ($) - Asian
Median family income ($) - Hispanic or Latino
Median family income ($) - American Indian and Alaska Native
Median family income ($) - Multirace
Median family income ($) - Other Race
Median year house/condo built
Median year apartment built
Year house built - Built 2005 or later (%)
Year house built - Built 2000 to 2004 (%)
Year house built - Built 1990 to 1999 (%)
Year house built - Built 1980 to 1989 (%)
Year house built - Built 1970 to 1979 (%)
Year house built - Built 1960 to 1969 (%)
Year house built - Built 1950 to 1959 (%)
Year house built - Built 1940 to 1949 (%)
Year house built - Built 1939 or earlier (%)
Average household size
Household density (households per square mile)
Average household size - White
Average household size - Black or African American
Average household size - Asian
Average household size - Hispanic or Latino
Average household size - American Indian and Alaska Native
Average household size - Multirace
Average household size - Other Race
Occupied housing units (%)
Vacant housing units (%)
Owner occupied housing units (%)
Renter occupied housing units (%)
Vacancy status - For rent (%)
Vacancy status - For sale only (%)
Vacancy status - Rented or sold, not occupied (%)
Vacancy status - For seasonal, recreational, or occasional use (%)
Vacancy status - For migrant workers (%)
Vacancy status - Other vacant (%)
Residents with income below the poverty level (%)
Residents with income below 50% of the poverty level (%)
Children below poverty level (%)
Poor families by family type - Married-couple family (%)
Poor families by family type - Male, no wife present (%)
Poor families by family type - Female, no husband present (%)
Poverty status for native-born residents (%)
Poverty status for foreign-born residents (%)
Poverty among high school graduates not in families (%)
Poverty among people who did not graduate high school not in families (%)
Residents with income below the poverty level (%) - White
Residents with income below the poverty level (%) - Black or African American
Residents with income below the poverty level (%) - Asian
Residents with income below the poverty level (%) - Hispanic or Latino
Residents with income below the poverty level (%) - American Indian and Alaska Native
Residents with income below the poverty level (%) - Multirace
Residents with income below the poverty level (%) - Other Race
Air pollution - Air Quality Index (AQI)
Air pollution - CO
Air pollution - NO2
Air pollution - SO2
Air pollution - Ozone
Air pollution - PM10
Air pollution - PM25
Air pollution - Pb
Crime - Murders per 100,000 population
Crime - Rapes per 100,000 population
Crime - Robberies per 100,000 population
Crime - Assaults per 100,000 population
Crime - Burglaries per 100,000 population
Crime - Thefts per 100,000 population
Crime - Auto thefts per 100,000 population
Crime - Arson per 100,000 population
Crime - City-data.com crime index
Crime - Violent crime index
Crime - Property crime index
Crime - Murders per 100,000 population (5 year average)
Crime - Rapes per 100,000 population (5 year average)
Crime - Robberies per 100,000 population (5 year average)
Crime - Assaults per 100,000 population (5 year average)
Crime - Burglaries per 100,000 population (5 year average)
Crime - Thefts per 100,000 population (5 year average)
Crime - Auto thefts per 100,000 population (5 year average)
Crime - Arson per 100,000 population (5 year average)
Crime - City-data.com crime index (5 year average)
Crime - Violent crime index (5 year average)
Crime - Property crime index (5 year average)
1996 Presidential Elections Results (%) - Democratic Party (Clinton)
1996 Presidential Elections Results (%) - Republican Party (Dole)
1996 Presidential Elections Results (%) - Other
2000 Presidential Elections Results (%) - Democratic Party (Gore)
2000 Presidential Elections Results (%) - Republican Party (Bush)
2000 Presidential Elections Results (%) - Other
2004 Presidential Elections Results (%) - Democratic Party (Kerry)
2004 Presidential Elections Results (%) - Republican Party (Bush)
2004 Presidential Elections Results (%) - Other
2008 Presidential Elections Results (%) - Democratic Party (Obama)
2008 Presidential Elections Results (%) - Republican Party (McCain)
2008 Presidential Elections Results (%) - Other
2012 Presidential Elections Results (%) - Democratic Party (Obama)
2012 Presidential Elections Results (%) - Republican Party (Romney)
2012 Presidential Elections Results (%) - Other
2016 Presidential Elections Results (%) - Democratic Party (Clinton)
2016 Presidential Elections Results (%) - Republican Party (Trump)
2016 Presidential Elections Results (%) - Other
2020 Presidential Elections Results (%) - Democratic Party (Biden)
2020 Presidential Elections Results (%) - Republican Party (Trump)
2020 Presidential Elections Results (%) - Other
Ancestries Reported - Arab (%)
Ancestries Reported - Czech (%)
Ancestries Reported - Danish (%)
Ancestries Reported - Dutch (%)
Ancestries Reported - English (%)
Ancestries Reported - French (%)
Ancestries Reported - French Canadian (%)
Ancestries Reported - German (%)
Ancestries Reported - Greek (%)
Ancestries Reported - Hungarian (%)
Ancestries Reported - Irish (%)
Ancestries Reported - Italian (%)
Ancestries Reported - Lithuanian (%)
Ancestries Reported - Norwegian (%)
Ancestries Reported - Polish (%)
Ancestries Reported - Portuguese (%)
Ancestries Reported - Russian (%)
Ancestries Reported - Scotch-Irish (%)
Ancestries Reported - Scottish (%)
Ancestries Reported - Slovak (%)
Ancestries Reported - Subsaharan African (%)
Ancestries Reported - Swedish (%)
Ancestries Reported - Swiss (%)
Ancestries Reported - Ukrainian (%)
Ancestries Reported - United States (%)
Ancestries Reported - Welsh (%)
Ancestries Reported - West Indian (%)
Ancestries Reported - Other (%)
Educational Attainment - No schooling completed (%)
Educational Attainment - Less than high school (%)
Educational Attainment - High school or equivalent (%)
Educational Attainment - Less than 1 year of college (%)
Educational Attainment - 1 or more years of college (%)
Educational Attainment - Associate degree (%)
Educational Attainment - Bachelor's degree (%)
Educational Attainment - Master's degree (%)
Educational Attainment - Professional school degree (%)
Educational Attainment - Doctorate degree (%)
School Enrollment - Nursery, preschool (%)
School Enrollment - Kindergarten (%)
School Enrollment - Grade 1 to 4 (%)
School Enrollment - Grade 5 to 8 (%)
School Enrollment - Grade 9 to 12 (%)
School Enrollment - College undergrad (%)
School Enrollment - Graduate or professional (%)
School Enrollment - Not enrolled in school (%)
School enrollment - Public schools (%)
School enrollment - Private schools (%)
School enrollment - Not enrolled (%)
Median number of rooms in houses and condos
Median number of rooms in apartments
Housing units lacking complete plumbing facilities (%)
Housing units lacking complete kitchen facilities (%)
Density of houses
Urban houses (%)
Rural houses (%)
Households with people 60 years and over (%)
Households with people 65 years and over (%)
Households with people 75 years and over (%)
Households with one or more nonrelatives (%)
Households with no nonrelatives (%)
Population in households (%)
Family households (%)
Nonfamily households (%)
Population in families (%)
Family households with own children (%)
Median number of bedrooms in owner occupied houses
Mean number of bedrooms in owner occupied houses
Median number of bedrooms in renter occupied houses
Mean number of bedrooms in renter occupied houses
Median number of vehichles in owner occupied houses
Mean number of vehichles in owner occupied houses
Median number of vehichles in renter occupied houses
Mean number of vehichles in renter occupied houses
Mortgage status - with mortgage (%)
Mortgage status - with second mortgage (%)
Mortgage status - with home equity loan (%)
Mortgage status - with both second mortgage and home equity loan (%)
Mortgage status - without a mortgage (%)
Average family size
Average family size - White
Average family size - Black or African American
Average family size - Asian
Average family size - Hispanic or Latino
Average family size - American Indian and Alaska Native
Average family size - Multirace
Average family size - Other Race
Geographical mobility - Same house 1 year ago (%)
Geographical mobility - Moved within same county (%)
Geographical mobility - Moved from different county within same state (%)
Geographical mobility - Moved from different state (%)
Geographical mobility - Moved from abroad (%)
Place of birth - Born in state of residence (%)
Place of birth - Born in other state (%)
Place of birth - Native, outside of US (%)
Place of birth - Foreign born (%)
Housing units in structures - 1, detached (%)
Housing units in structures - 1, attached (%)
Housing units in structures - 2 (%)
Housing units in structures - 3 or 4 (%)
Housing units in structures - 5 to 9 (%)
Housing units in structures - 10 to 19 (%)
Housing units in structures - 20 to 49 (%)
Housing units in structures - 50 or more (%)
Housing units in structures - Mobile home (%)
Housing units in structures - Boat, RV, van, etc. (%)
House/condo owner moved in on average (years ago)
Renter moved in on average (years ago)
Year householder moved into unit - Moved in 1999 to March 2000 (%)
Year householder moved into unit - Moved in 1995 to 1998 (%)
Year householder moved into unit - Moved in 1990 to 1994 (%)
Year householder moved into unit - Moved in 1980 to 1989 (%)
Year householder moved into unit - Moved in 1970 to 1979 (%)
Year householder moved into unit - Moved in 1969 or earlier (%)
Means of transportation to work - Drove car alone (%)
Means of transportation to work - Carpooled (%)
Means of transportation to work - Public transportation (%)
Means of transportation to work - Bus or trolley bus (%)
Means of transportation to work - Streetcar or trolley car (%)
Means of transportation to work - Subway or elevated (%)
Means of transportation to work - Railroad (%)
Means of transportation to work - Ferryboat (%)
Means of transportation to work - Taxicab (%)
Means of transportation to work - Motorcycle (%)
Means of transportation to work - Bicycle (%)
Means of transportation to work - Walked (%)
Means of transportation to work - Other means (%)
Working at home (%)
Industry diversity
Most Common Industries - Agriculture, forestry, fishing and hunting, and mining (%)
Most Common Industries - Agriculture, forestry, fishing and hunting (%)
Most Common Industries - Mining, quarrying, and oil and gas extraction (%)
Most Common Industries - Construction (%)
Most Common Industries - Manufacturing (%)
Most Common Industries - Wholesale trade (%)
Most Common Industries - Retail trade (%)
Most Common Industries - Transportation and warehousing, and utilities (%)
Most Common Industries - Transportation and warehousing (%)
Most Common Industries - Utilities (%)
Most Common Industries - Information (%)
Most Common Industries - Finance and insurance, and real estate and rental and leasing (%)
Most Common Industries - Finance and insurance (%)
Most Common Industries - Real estate and rental and leasing (%)
Most Common Industries - Professional, scientific, and management, and administrative and waste management services (%)
Most Common Industries - Professional, scientific, and technical services (%)
Most Common Industries - Management of companies and enterprises (%)
Most Common Industries - Administrative and support and waste management services (%)
Most Common Industries - Educational services, and health care and social assistance (%)
Most Common Industries - Educational services (%)
Most Common Industries - Health care and social assistance (%)
Most Common Industries - Arts, entertainment, and recreation, and accommodation and food services (%)
Most Common Industries - Arts, entertainment, and recreation (%)
Most Common Industries - Accommodation and food services (%)
Most Common Industries - Other services, except public administration (%)
Most Common Industries - Public administration (%)
Occupation diversity
Most Common Occupations - Management, business, science, and arts occupations (%)
Most Common Occupations - Management, business, and financial occupations (%)
Most Common Occupations - Management occupations (%)
Most Common Occupations - Business and financial operations occupations (%)
Most Common Occupations - Computer, engineering, and science occupations (%)
Most Common Occupations - Computer and mathematical occupations (%)
Most Common Occupations - Architecture and engineering occupations (%)
Most Common Occupations - Life, physical, and social science occupations (%)
Most Common Occupations - Education, legal, community service, arts, and media occupations (%)
Most Common Occupations - Community and social service occupations (%)
Most Common Occupations - Legal occupations (%)
Most Common Occupations - Education, training, and library occupations (%)
Most Common Occupations - Arts, design, entertainment, sports, and media occupations (%)
Most Common Occupations - Healthcare practitioners and technical occupations (%)
Most Common Occupations - Health diagnosing and treating practitioners and other technical occupations (%)
Most Common Occupations - Health technologists and technicians (%)
Most Common Occupations - Service occupations (%)
Most Common Occupations - Healthcare support occupations (%)
Most Common Occupations - Protective service occupations (%)
Most Common Occupations - Fire fighting and prevention, and other protective service workers including supervisors (%)
Most Common Occupations - Law enforcement workers including supervisors (%)
Most Common Occupations - Food preparation and serving related occupations (%)
Most Common Occupations - Building and grounds cleaning and maintenance occupations (%)
Most Common Occupations - Personal care and service occupations (%)
Most Common Occupations - Sales and office occupations (%)
Most Common Occupations - Sales and related occupations (%)
Most Common Occupations - Office and administrative support occupations (%)
Most Common Occupations - Natural resources, construction, and maintenance occupations (%)
Most Common Occupations - Farming, fishing, and forestry occupations (%)
Most Common Occupations - Construction and extraction occupations (%)
Most Common Occupations - Installation, maintenance, and repair occupations (%)
Most Common Occupations - Production, transportation, and material moving occupations (%)
Most Common Occupations - Production occupations (%)
Most Common Occupations - Transportation occupations (%)
Most Common Occupations - Material moving occupations (%)
People in Group quarters - Institutionalized population (%)
People in Group quarters - Correctional institutions (%)
People in Group quarters - Federal prisons and detention centers (%)
People in Group quarters - Halfway houses (%)
People in Group quarters - Local jails and other confinement facilities (including police lockups) (%)
People in Group quarters - Military disciplinary barracks (%)
People in Group quarters - State prisons (%)
People in Group quarters - Other types of correctional institutions (%)
People in Group quarters - Nursing homes (%)
People in Group quarters - Hospitals/wards, hospices, and schools for the handicapped (%)
People in Group quarters - Hospitals/wards and hospices for chronically ill (%)
People in Group quarters - Hospices or homes for chronically ill (%)
People in Group quarters - Military hospitals or wards for chronically ill (%)
People in Group quarters - Other hospitals or wards for chronically ill (%)
People in Group quarters - Hospitals or wards for drug/alcohol abuse (%)
People in Group quarters - Mental (Psychiatric) hospitals or wards (%)
People in Group quarters - Schools, hospitals, or wards for the mentally retarded (%)
People in Group quarters - Schools, hospitals, or wards for the physically handicapped (%)
People in Group quarters - Institutions for the deaf (%)
People in Group quarters - Institutions for the blind (%)
People in Group quarters - Orthopedic wards and institutions for the physically handicapped (%)
People in Group quarters - Wards in general hospitals for patients who have no usual home elsewhere (%)
People in Group quarters - Wards in military hospitals for patients who have no usual home elsewhere (%)
People in Group quarters - Juvenile institutions (%)
People in Group quarters - Long-term care (%)
People in Group quarters - Homes for abused, dependent, and neglected children (%)
People in Group quarters - Residential treatment centers for emotionally disturbed children (%)
People in Group quarters - Training schools for juvenile delinquents (%)
People in Group quarters - Short-term care, detention or diagnostic centers for delinquent children (%)
People in Group quarters - Type of juvenile institution unknown (%)
People in Group quarters - Noninstitutionalized population (%)
People in Group quarters - College dormitories (includes college quarters off campus) (%)
People in Group quarters - Military quarters (%)
People in Group quarters - On base (%)
People in Group quarters - Barracks, unaccompanied personnel housing (UPH), (Enlisted/Officer), ;and similar group living quarters for military personnel (%)
People in Group quarters - Transient quarters for temporary residents (%)
People in Group quarters - Military ships (%)
People in Group quarters - Group homes (%)
People in Group quarters - Homes or halfway houses for drug/alcohol abuse (%)
People in Group quarters - Homes for the mentally ill (%)
People in Group quarters - Homes for the mentally retarded (%)
People in Group quarters - Homes for the physically handicapped (%)
People in Group quarters - Other group homes (%)
People in Group quarters - Religious group quarters (%)
People in Group quarters - Dormitories (%)
People in Group quarters - Agriculture workers' dormitories on farms (%)
People in Group quarters - Job Corps and vocational training facilities (%)
People in Group quarters - Other workers' dormitories (%)
People in Group quarters - Crews of maritime vessels (%)
People in Group quarters - Other nonhousehold living situations (%)
People in Group quarters - Other noninstitutional group quarters (%)
Residents speaking English at home (%)
Residents speaking English at home - Born in the United States (%)
Residents speaking English at home - Native, born elsewhere (%)
Residents speaking English at home - Foreign born (%)
Residents speaking Spanish at home (%)
Residents speaking Spanish at home - Born in the United States (%)
Residents speaking Spanish at home - Native, born elsewhere (%)
Residents speaking Spanish at home - Foreign born (%)
Residents speaking other language at home (%)
Residents speaking other language at home - Born in the United States (%)
Residents speaking other language at home - Native, born elsewhere (%)
Residents speaking other language at home - Foreign born (%)
Class of Workers - Employee of private company (%)
Class of Workers - Self-employed in own incorporated business (%)
Class of Workers - Private not-for-profit wage and salary workers (%)
Class of Workers - Local government workers (%)
Class of Workers - State government workers (%)
Class of Workers - Federal government workers (%)
Class of Workers - Self-employed workers in own not incorporated business and Unpaid family workers (%)
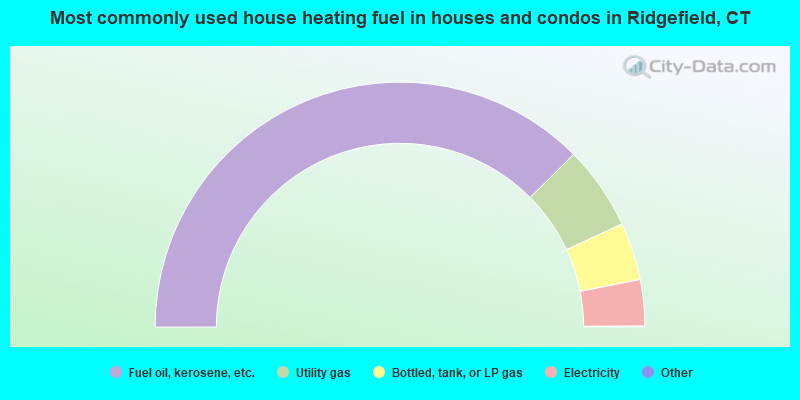
House heating fuel used in houses and condos - Utility gas (%)
House heating fuel used in houses and condos - Bottled, tank, or LP gas (%)
House heating fuel used in houses and condos - Electricity (%)
House heating fuel used in houses and condos - Fuel oil, kerosene, etc. (%)
House heating fuel used in houses and condos - Coal or coke (%)
House heating fuel used in houses and condos - Wood (%)
House heating fuel used in houses and condos - Solar energy (%)
House heating fuel used in houses and condos - Other fuel (%)
House heating fuel used in houses and condos - No fuel used (%)
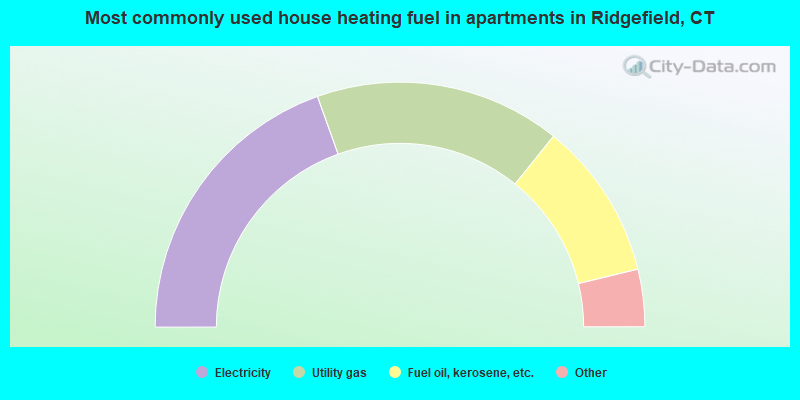
House heating fuel used in apartments - Utility gas (%)
House heating fuel used in apartments - Bottled, tank, or LP gas (%)
House heating fuel used in apartments - Electricity (%)
House heating fuel used in apartments - Fuel oil, kerosene, etc. (%)
House heating fuel used in apartments - Coal or coke (%)
House heating fuel used in apartments - Wood (%)
House heating fuel used in apartments - Solar energy (%)
House heating fuel used in apartments - Other fuel (%)
House heating fuel used in apartments - No fuel used (%)
Armed forces status - In Armed Forces (%)
Armed forces status - Civilian (%)
Armed forces status - Civilian - Veteran (%)
Armed forces status - Civilian - Nonveteran (%)
Fatal accidents locations in years 2005-2021
Fatal accidents locations in 2005
Fatal accidents locations in 2006
Fatal accidents locations in 2007
Fatal accidents locations in 2008
Fatal accidents locations in 2009
Fatal accidents locations in 2010
Fatal accidents locations in 2011
Fatal accidents locations in 2012
Fatal accidents locations in 2013
Fatal accidents locations in 2014
Fatal accidents locations in 2015
Fatal accidents locations in 2016
Fatal accidents locations in 2017
Fatal accidents locations in 2018
Fatal accidents locations in 2019
Fatal accidents locations in 2020
Fatal accidents locations in 2021
Alcohol use - People drinking some alcohol every month (%)
Alcohol use - People not drinking at all (%)
Alcohol use - Average days/month drinking alcohol
Alcohol use - Average drinks/week
Alcohol use - Average days/year people drink much
Audiometry - Average condition of hearing (%)
Audiometry - People that can hear a whisper from across a quiet room (%)
Audiometry - People that can hear normal voice from across a quiet room (%)
Audiometry - Ears ringing, roaring, buzzing (%)
Audiometry - Had a job exposure to loud noise (%)
Audiometry - Had off-work exposure to loud noise (%)
Blood Pressure & Cholesterol - Has high blood pressure (%)
Blood Pressure & Cholesterol - Checking blood pressure at home (%)
Blood Pressure & Cholesterol - Frequently checking blood cholesterol (%)
Blood Pressure & Cholesterol - Has high cholesterol level (%)
Consumer Behavior - Money monthly spent on food at supermarket/grocery store
Consumer Behavior - Money monthly spent on food at other stores
Consumer Behavior - Money monthly spent on eating out
Consumer Behavior - Money monthly spent on carryout/delivered foods
Consumer Behavior - Income spent on food at supermarket/grocery store (%)
Consumer Behavior - Income spent on food at other stores (%)
Consumer Behavior - Income spent on eating out (%)
Consumer Behavior - Income spent on carryout/delivered foods (%)
Current Health Status - General health condition (%)
Current Health Status - Blood donors (%)
Current Health Status - Has blood ever tested for HIV virus (%)
Current Health Status - Left-handed people (%)
Dermatology - People using sunscreen (%)
Diabetes - Diabetics (%)
Diabetes - Had a blood test for high blood sugar (%)
Diabetes - People taking insulin (%)
Diet Behavior & Nutrition - Diet health (%)
Diet Behavior & Nutrition - Milk product consumption (# of products/month)
Diet Behavior & Nutrition - Meals not home prepared (#/week)
Diet Behavior & Nutrition - Meals from fast food or pizza place (#/week)
Diet Behavior & Nutrition - Ready-to-eat foods (#/month)
Diet Behavior & Nutrition - Frozen meals/pizza (#/month)
Drug Use - People that ever used marijuana or hashish (%)
Drug Use - Ever used hard drugs (%)
Drug Use - Ever used any form of cocaine (%)
Drug Use - Ever used heroin (%)
Drug Use - Ever used methamphetamine (%)
Health Insurance - People covered by health insurance (%)
Kidney Conditions-Urology - Avg. # of times urinating at night
Medical Conditions - People with asthma (%)
Medical Conditions - People with anemia (%)
Medical Conditions - People with psoriasis (%)
Medical Conditions - People with overweight (%)
Medical Conditions - Elderly people having difficulties in thinking or remembering (%)
Medical Conditions - People who ever received blood transfusion (%)
Medical Conditions - People having trouble seeing even with glass/contacts (%)
Medical Conditions - People with arthritis (%)
Medical Conditions - People with gout (%)
Medical Conditions - People with congestive heart failure (%)
Medical Conditions - People with coronary heart disease (%)
Medical Conditions - People with angina pectoris (%)
Medical Conditions - People who ever had heart attack (%)
Medical Conditions - People who ever had stroke (%)
Medical Conditions - People with emphysema (%)
Medical Conditions - People with thyroid problem (%)
Medical Conditions - People with chronic bronchitis (%)
Medical Conditions - People with any liver condition (%)
Medical Conditions - People who ever had cancer or malignancy (%)
Mental Health - People who have little interest in doing things (%)
Mental Health - People feeling down, depressed, or hopeless (%)
Mental Health - People who have trouble sleeping or sleeping too much (%)
Mental Health - People feeling tired or having little energy (%)
Mental Health - People with poor appetite or overeating (%)
Mental Health - People feeling bad about themself (%)
Mental Health - People who have trouble concentrating on things (%)
Mental Health - People moving or speaking slowly or too fast (%)
Mental Health - People having thoughts they would be better off dead (%)
Oral Health - Average years since last visit a dentist
Oral Health - People embarrassed because of mouth (%)
Oral Health - People with gum disease (%)
Oral Health - General health of teeth and gums (%)
Oral Health - Average days a week using dental floss/device
Oral Health - Average days a week using mouthwash for dental problem
Oral Health - Average number of teeth
Pesticide Use - Households using pesticides to control insects (%)
Pesticide Use - Households using pesticides to kill weeds (%)
Physical Activity - People doing vigorous-intensity work activities (%)
Physical Activity - People doing moderate-intensity work activities (%)
Physical Activity - People walking or bicycling (%)
Physical Activity - People doing vigorous-intensity recreational activities (%)
Physical Activity - People doing moderate-intensity recreational activities (%)
Physical Activity - Average hours a day doing sedentary activities
Physical Activity - Average hours a day watching TV or videos
Physical Activity - Average hours a day using computer
Physical Functioning - People having limitations keeping them from working (%)
Physical Functioning - People limited in amount of work they can do (%)
Physical Functioning - People that need special equipment to walk (%)
Physical Functioning - People experiencing confusion/memory problems (%)
Physical Functioning - People requiring special healthcare equipment (%)
Prescription Medications - Average number of prescription medicines taking
Preventive Aspirin Use - Adults 40+ taking low-dose aspirin (%)
Reproductive Health - Vaginal deliveries (%)
Reproductive Health - Cesarean deliveries (%)
Reproductive Health - Deliveries resulted in a live birth (%)
Reproductive Health - Pregnancies resulted in a delivery (%)
Reproductive Health - Women breastfeeding newborns (%)
Reproductive Health - Women that had a hysterectomy (%)
Reproductive Health - Women that had both ovaries removed (%)
Reproductive Health - Women that have ever taken birth control pills (%)
Reproductive Health - Women taking birth control pills (%)
Reproductive Health - Women that have ever used Depo-Provera or injectables (%)
Reproductive Health - Women that have ever used female hormones (%)
Sexual Behavior - People 18+ that ever had sex (vaginal, anal, or oral) (%)
Sexual Behavior - Males 18+ that ever had vaginal sex with a woman (%)
Sexual Behavior - Males 18+ that ever performed oral sex on a woman (%)
Sexual Behavior - Males 18+ that ever had anal sex with a woman (%)
Sexual Behavior - Males 18+ that ever had any sex with a man (%)
Sexual Behavior - Females 18+ that ever had vaginal sex with a man (%)
Sexual Behavior - Females 18+ that ever performed oral sex on a man (%)
Sexual Behavior - Females 18+ that ever had anal sex with a man (%)
Sexual Behavior - Females 18+ that ever had any kind of sex with a woman (%)
Sexual Behavior - Average age people first had sex
Sexual Behavior - Average number of female sex partners in lifetime (males 18+)
Sexual Behavior - Average number of female vaginal sex partners in lifetime (males 18+)
Sexual Behavior - Average age people first performed oral sex on a woman (18+)
Sexual Behavior - Average number of woman performed oral sex on in lifetime (18+)
Sexual Behavior - Average number of male sex partners in lifetime (males 18+)
Sexual Behavior - Average number of male anal sex partners in lifetime (males 18+)
Sexual Behavior - Average age people first performed oral sex on a man (18+)
Sexual Behavior - Average number of male oral sex partners in lifetime (18+)
Sexual Behavior - People using protection when performing oral sex (%)
Sexual Behavior - Average number of times people have vaginal or anal sex a year
Sexual Behavior - People having sex without condom (%)
Sexual Behavior - Average number of male sex partners in lifetime (females 18+)
Sexual Behavior - Average number of male vaginal sex partners in lifetime (females 18+)
Sexual Behavior - Average number of female sex partners in lifetime (females 18+)
Sexual Behavior - Circumcised males 18+ (%)
Sleep Disorders - Average hours sleeping at night
Sleep Disorders - People that has trouble sleeping (%)
Smoking-Cigarette Use - People smoking cigarettes (%)
Taste & Smell - People 40+ having problems with smell (%)
Taste & Smell - People 40+ having problems with taste (%)
Taste & Smell - People 40+ that ever had wisdom teeth removed (%)
Taste & Smell - People 40+ that ever had tonsils teeth removed (%)
Taste & Smell - People 40+ that ever had a loss of consciousness because of a head injury (%)
Taste & Smell - People 40+ that ever had a broken nose or other serious injury to face or skull (%)
Taste & Smell - People 40+ that ever had two or more sinus infections (%)
Weight - Average height (inches)
Weight - Average weight (pounds)
Weight - Average BMI
Weight - People that are obese (%)
Weight - People that ever were obese (%)
Weight - People trying to lose weight (%)
According to our research of Connecticut and other state lists, there were 3 registered sex offenders living in Ridgefield, Connecticut as of April 17, 2024 . The ratio of all residents to sex offenders in Ridgefield is 2,524 to 1.The ratio of registered sex offenders to all residents in this city is much lower than the state average.
Officers per 1,000 residents here:
1.65Connecticut average:
2.10
Latest news from Ridgefield, CT collected exclusively by city-data.com from local newspapers, TV, and radio stations
Ridgefield, CT City Guides: Ancestries: Italian (18.9%), American (14.5%), Irish (12.0%), English (5.5%), Polish (3.6%), Greek (3.4%).
Current Local Time:
Land area: 6.41 square miles.
Population density: 1,193 people per square mile (low).
952 residents are foreign born (6.7% Europe , 1.8% Asia , 1.6% Latin America , 1.4% North America ).
This place:
12.4%Connecticut:
15.0%
Median real estate property taxes paid for housing units with mortgages in 2022: $9,526 (1.1%)Median real estate property taxes paid for housing units with no mortgage in 2022: $9,598 (1.3%)
Nearest city with pop. 50,000+: Danbury, CT
Nearest city with pop. 200,000+: North Hempstead, NY
Nearest city with pop. 1,000,000+: Bronx, NY
Nearest cities:
Cannondale, CT (2.3 miles),
Latitude: 41.27 N, Longitude: 73.49 W
Daytime population change due to commuting: +2,277 (+29.6%)Workers who live and work in this place: 1,534 (42.0%)
Single-family new house construction building permits:
2022: 9 buildings , average cost: $642,3002021: 16 buildings , average cost: $809,8002020: 20 buildings , average cost: $587,7002019: 8 buildings , average cost: $503,8002018: 9 buildings , average cost: $1,499,8002017: 11 buildings , average cost: $602,7002016: 9 buildings , average cost: $507,8002015: 16 buildings , average cost: $562,0002014: 22 buildings , average cost: $601,5002013: 21 buildings , average cost: $574,7002012: 11 buildings , average cost: $528,4002011: 12 buildings , average cost: $674,3002010: 18 buildings , average cost: $484,9002009: 15 buildings , average cost: $733,3002008: 38 buildings , average cost: $396,7002007: 57 buildings , average cost: $481,5002006: 54 buildings , average cost: $550,8002005: 34 buildings , average cost: $540,6002004: 46 buildings , average cost: $604,0002003: 44 buildings , average cost: $456,2002002: 52 buildings , average cost: $406,9002001: 66 buildings , average cost: $299,5002000: 68 buildings , average cost: $458,7001999: 83 buildings , average cost: $298,9001998: 115 buildings , average cost: $270,7001997: 130 buildings , average cost: $222,900Unemployment in December 2023: Here:
4.0%Connecticut:
3.9%
Most common occupations in Ridgefield, CT (%)
Both Males Females
Other management occupations, except farmers and farm managers (7.7%)
Top executives (6.2%)
Accountants and auditors (5.2%)
Sales representatives, services, wholesale and manufacturing (4.9%)
Advertising, marketing, promotions, public relations, and sales managers (4.3%)
Computer specialists (3.9%)
Preschool, kindergarten, elementary, and middle school teachers (3.6%)
Top executives (10.6%)
Other management occupations, except farmers and farm managers (7.7%)
Sales representatives, services, wholesale and manufacturing (6.1%)
Computer specialists (6.0%)
Accountants and auditors (5.4%)
Advertising, marketing, promotions, public relations, and sales managers (4.3%)
Other sales and related occupations, including supervisors (2.8%)
Other management occupations, except farmers and farm managers (7.7%)
Secretaries and administrative assistants (7.1%)
Preschool, kindergarten, elementary, and middle school teachers (6.0%)
Accountants and auditors (4.9%)
Registered nurses (4.5%)
Other sales and related occupations, including supervisors (4.5%)
Retail sales workers, except cashiers (4.3%)
Tornado activity:
Ridgefield-area historical tornado activity is near Connecticut state average. It is 35% smaller than the overall U.S. average.
On 7/10/1989, a category F4 (max. wind speeds 207-260 mph) tornado 29.9 miles away from the Ridgefield place center injured 40 people and caused between $50,000,000 and $500,000,000 in damages.
On 5/24/1962, a category F3 (max. wind speeds 158-206 mph) tornado 27.2 miles away from the place center killed one person and injured 50 people and caused between $500,000 and $5,000,000 in damages.
Earthquake activity:
Ridgefield-area historical earthquake activity is significantly above Connecticut state average. It is 69% smaller than the overall U.S. average. On 10/7/1983 at 10:18:46, a magnitude 5.3 (5.1 MB, 5.3 LG, 5.1 ML, Class: Moderate, Intensity: VI - VII) earthquake occurred 190.3 miles away from Ridgefield center On 4/20/2002 at 10:50:47, a magnitude 5.3 (5.3 ML, Depth: 3.0 mi) earthquake occurred 224.3 miles away from the city center On 8/23/2011 at 17:51:04, a magnitude 5.8 (5.8 MW, Depth: 3.7 mi) earthquake occurred 331.9 miles away from Ridgefield center On 4/20/2002 at 10:50:47, a magnitude 5.2 (5.2 MB, 4.2 MS, 5.2 MW, 5.0 MW) earthquake occurred 222.6 miles away from the city center On 1/16/1994 at 01:49:16, a magnitude 4.6 (4.6 MB, 4.6 LG, Depth: 3.1 mi, Class: Light, Intensity: IV - V) earthquake occurred 148.3 miles away from Ridgefield center On 1/19/1982 at 00:14:42, a magnitude 4.7 (4.5 MB, 4.7 MD, 4.5 LG) earthquake occurred 181.8 miles away from the city center Magnitude types: regional Lg-wave magnitude (LG), body-wave magnitude (MB), duration magnitude (MD), local magnitude (ML), surface-wave magnitude (MS), moment magnitude (MW) Natural disasters: The number of natural disasters in Fairfield County (24) is greater than the US average (15).Major Disasters (Presidential) Declared: 13Emergencies Declared: 11Storms: 6, Floods: 5, Hurricanes: 5, Snowstorms: 4, Blizzards: 3, Snows: 3, Winter Storms: 3, Tropical Storms: 2, Snowfall: 1, Wind: 1 (Note: some incidents may be assigned to more than one category). Hospitals and medical centers in Ridgefield: VNA OF RIDGEFIELD INC (90 EAST RIDGE)
LAUREL RIDGE HEALTH CARE CENTE (642 DANBURY ROAD)
Other hospitals and medical centers near Ridgefield: MEADOW RIDGE (Nursing Home, about 4 miles away; WEST REDDING, CT)
FOUR WINDS (Hospital, about 8 miles away; KATONAH, NY)
LOURDES HEALTH CARE CENTER, IN (Nursing Home, about 8 miles away; WILTON, CT)
SILVER HILL HOSPITAL INC (Hospital, about 8 miles away; NEW CANAAN, CT)
POPE JOHN PAUL I I CENTER (Nursing Home, about 8 miles away; DANBURY, CT)
ABILITY BEYOND DISABILITY MOUN (Hospital, about 8 miles away; DANBURY, CT)
COMMUNITY BASED SERVICES, INC (Hospital, about 9 miles away; POUND RIDGE, NY)
Amtrak stations near Ridgefield: 16 miles: STAMFORD (WASHINGTON BLVD. & E. STATE ST.) Services: ticket office, fully wheelchair accessible, enclosed waiting area, public restrooms, public payphones, snack bar, ATM, paid short-term parking, paid long-term parking, call for car rental service, taxi stand, public transit connection.
18 miles: BRIDGEPORT (525 WATER ST.) Services: fully wheelchair accessible, enclosed waiting area, public restrooms, public payphones, snack bar, paid short-term parking, paid long-term parking, call for car rental service, taxi stand, intercity bus service, public transit connection.
Colleges/universities with over 2000 students nearest to Ridgefield:
Western Connecticut State University (about 10 miles; Danbury, CT ; Full-time enrollment: 5,345)
Norwalk Community College (about 13 miles; Norwalk, CT ; FT enrollment: 4,085)
Sacred Heart University (about 14 miles; Fairfield, CT ; FT enrollment: 5,650)
Fairfield University (about 15 miles; Fairfield, CT ; FT enrollment: 4,640)
Housatonic Community College (about 18 miles; Bridgeport, CT ; FT enrollment: 3,677)
University of Bridgeport (about 18 miles; Bridgeport, CT ; FT enrollment: 3,708)
SUNY at Purchase College (about 20 miles; Purchase, NY ; FT enrollment: 4,415)
Public high schools in Ridgefield: RIDGEFIELD HIGH SCHOOL Students: 1,259, Location: 700 NORTH SALEM ROAD, Grades: 9-12)RIDGEFIELD TRANSITION PROGRAM Location: 8 GOVERNOR STREET, Grades: 12)
ALTERNATIVE HIGH SCHOOL Location: 25 GILBERT STREET, Grades: 9-12)
Public elementary/middle schools in Ridgefield: EAST RIDGE MIDDLE SCHOOL Students: 766, Location: 10 EAST RIDGE ROAD, Grades: 6-8)SCOTTS RIDGE MIDDLE SCHOOL Students: 616, Location: 750 NORTH SALEM ROAD, Grades: 6-8)RIDGEBURY ELEMENTARY SCHOOL Students: 568, Location: 112 BENNETT'S FARM ROAD, Grades: PK-5)BARLOW MOUNTAIN ELEMENTARY SCHOOL Students: 529, Location: 115 BARLOW MOUNTAIN ROAD, Grades: PK-5)BRANCHVILLE ELEMENTARY SCHOOL Students: 503, Location: 40 FLORIDA ROAD, Grades: KG-5)FARMINGVILLE ELEMENTARY SCHOOL Students: 484, Location: 324 FARMINGTONROAD, Grades: KG-5)SCOTLAND ELEMENTARY SCHOOL Students: 471, Location: 111 BARLOW MOUNTAIN ROAD, Grades: KG-5)VETERANS PARK ELEMENTARY SCHOOL Students: 413, Location: 8 GOVERNOR STREET, Grades: KG-5)Private elementary/middle schools in Ridgefield: RIDGEFIELD ACADEMY Students: 347, Location: 223 W MOUNTAIN RD, Grades: UG-8)
ST MARY SCHOOL Students: 255, Location: 183 HIGH RIDGE AVE, Grades: PK-8)
See full list of schools located in Ridgefield Library in Ridgefield: RIDGEFIELD LIBRARY Operating income: $2,101,429; Location: 472 MAIN ST.; 114,490 books ; 255 e-books ; 9,683 audio materials ; 7,742 video materials ; 9 local licensed databases ; 30 state licensed databases ; 8 other licensed databases ; 279 print serial subscriptions ; 2 electronic serial subscriptions )
User-submitted facts and corrections:
ridgefield population is around 22,000
Better check the size of Ridgefield... I think it\'s closer to 35 square miles.
Scott Ridge Middle School opened fall 2003 Barlow Mountain Elementary School opened fall 2003
Notable locations in Ridgefield: (A) , Aldrich Contemporary Art Museum (B) , Workshop Theatre Barn (C) , Ridgefield Town Hall (D) , Ridgefield Library and Historical Association (E) , Ridgefield Community Center (F) , Ridgefield Fire Department Headquarters (G) . Display/hide their locations on the map
Shopping Centers: (1) , Ridgefield Shopping Center (2) , Heritage Square Shopping Center (3) , Girolmetti Court Shopping Center (4) , Donnelly Plaza Shopping Center (5) , Copps Hill Plaza Shopping Center (6) , Addessi Center Shopping Center (7) . Display/hide their locations on the map
Churches in Ridgefield include: (A) , First Congregational Church (B) , Jesse Lee Memorial United Methodist Church (C) , Ridgefield Christian Center Church (D) , Saint Andrews Church (E) , Saint Marys Roman Catholic Church (F) , Saint Stephens Episcopal Church (G) , Temple Shearith Israel (H) . Display/hide their locations on the map
Cemetery: (1) . Display/hide its location on the map
Swamps: (A) . Display/hide its location on the map
Parks in Ridgefield include: (1) , Ballard Green (2) , Ballard Park (3) , Copps Hill Common (4) , East Ridge Recreation Area (5) , Ridgefield Center Historic District (6) , Veterans Park (7) . Display/hide their locations on the map
Tourist attractions:
Hotels:
Courts:
Birthplace of: Bill Lawrence (producer) - Television writer, Peggy Bacon - Artist, Samuel Griswold Goodrich - Politician, Silvio Bedini - Science historian, Abigail Goodrich Whittelsey - Editor, Brett Loscalzo - College basketball player (Columbia Lions), David McClure - College basketball player (Duke Blue Devils), Nehemiah Perry (congressman) - Politician, Todd Szegedy - Racing driver.
Fairfield County has a predicted average indoor radon screening level greater than 4 pCi/L (pico curies per liter) - Highest Potential Drinking water stations with addresses in Ridgefield and their reported violations in the past:
BROOKVIEW WATER COMPANY (Population served: 55, Groundwater):
Past monitoring violations:
Follow-up Or Routine LCR Tap M/R - In OCT-01-2010, Contaminant: Lead and Copper Rule. Follow-up actions: St Violation/Reminder Notice (MAR-30-2011), St Compliance achieved (APR-14-2011)
One routine major monitoring violation
One regular monitoring violation
Average household size: This place:
2.5 peopleConnecticut:
2.5 people
Percentage of family households: This place:
66.3%Whole state:
66.3%
Percentage of households with unmarried partners: This place:
2.9%Whole state:
6.6%
Likely homosexual households (counted as self-reported same-sex unmarried-partner households)
Lesbian couples: 0.1% of all households Gay men: 0.2% of all households
6 people in group homes intended for adults in 2010people in other nonhousehold living situations in 2000
Banks with most branches in Ridgefield (2011 data):
Fairfield County Bank: at 150 Danbury Road, Main Street & Governor Street, Anocnas Market Branch. Info updated 2012/01/12: Bank assets: $1,441.4 mil, Deposits: $1,172.5 mil, local headquarters , positive income , Commercial Lending Specialization, 22 total offices
Citibank, National Association: Ridgefield Branch at 621 Main Street, branch established on 2005/11/23. Info updated 2012/01/10: Bank assets: $1,288,658.0 mil, Deposits: $882,541.0 mil, headquarters in Sioux Falls, SD, positive income , International Specialization, 1048 total offices , Holding Company: Citigroup Inc.
Hudson City Savings Bank: Ridgefield Branch at 2 Prospect Street, branch established on 2008/08/16. Info updated 2012/01/09: Bank assets: $45,373.6 mil, Deposits: $25,645.6 mil, headquarters in Paramus, NJ, negative income in the last year , Mortgage Lending Specialization, 135 total offices
Wells Fargo Bank, National Association: Ridgefield Branch at 368 Main Street, branch established on 1959/05/11. Info updated 2011/04/05: Bank assets: $1,161,490.0 mil, Deposits: $905,653.0 mil, headquarters in Sioux Falls, SD, positive income , 6395 total offices , Holding Company: Wells Fargo & Company
JPMorgan Chase Bank, National Association: Ridgefield Branch at 92-98 Grove Street, branch established on 1971/11/13. Info updated 2011/11/10: Bank assets: $1,811,678.0 mil, Deposits: $1,190,738.0 mil, headquarters in Columbus, OH, positive income , International Specialization, 5577 total offices , Holding Company: Jpmorgan Chase & Co.
Bank of America, National Association: Ridgefield Branch at 90 Danbury Road, branch established on 1972/12/27. Info updated 2009/11/18: Bank assets: $1,451,969.3 mil, Deposits: $1,077,176.8 mil, headquarters in Charlotte, NC, positive income , 5782 total offices , Holding Company: Bank Of America Corporation
Webster Bank, National Association: Ridgefield Branch at 25 Prospect Street, branch established on 1974/11/12. Info updated 2008/12/23: Bank assets: $18,674.3 mil, Deposits: $13,861.5 mil, headquarters in Waterbury, CT, positive income , Commercial Lending Specialization, 167 total offices , Holding Company: Webster Financial Corporation
People's United Bank: Ridgefield Stop & Shop Branch at 125 Danbury Road, branch established on 2005/03/21. Info updated 2012/02/16: Bank assets: $27,319.3 mil, Deposits: $20,835.4 mil, headquarters in Bridgeport, CT, positive income , Commercial Lending Specialization, 374 total offices
HSBC Bank USA, National Association: Ridgefield Branch at 108 Danbury Rd, branch established on 2008/09/15. Info updated 2010/11/30: Bank assets: $206,009.7 mil, Deposits: $149,026.8 mil, headquarters in Mc Lean, VA, positive income , 474 total offices , Holding Company: Hsbc Holdings Plc
For population 15 years and over in Ridgefield:
Never married: 25.1%Now married: 59.9%Separated: 0.2%Widowed: 6.9%Divorced: 7.9% For population 25 years and over in Ridgefield:
High school or higher: 97.8%Bachelor's degree or higher: 76.5%Graduate or professional degree: 32.5%Unemployed: 2.6%Mean travel time to work (commute): 25.6 minutes
Education Gini index (Inequality in education) Here:
8.9Connecticut average:
12.6
Religion statistics for Ridgefield, CT (based on Fairfield County data)
Religion Adherents Congregations Catholic 404,341 94 Mainline Protestant 82,604 175 Evangelical Protestant 46,888 242 Other 32,501 95 Orthodox 9,215 21 Black Protestant 4,144 27 None 337,136 -
Source: Clifford Grammich, Kirk Hadaway, Richard Houseal, Dale E.Jones, Alexei Krindatch, Richie Stanley and Richard H.Taylor. 2012. 2010 U.S.Religion Census: Religious Congregations & Membership Study. Association of Statisticians of American Religious Bodies. Jones, Dale E., et al. 2002. Congregations and Membership in the United States 2000. Nashville, TN: Glenmary Research Center. Graphs represent county-level data
Food Environment Statistics: Number of grocery stores : 223Fairfield County :
2.50 / 10,000 pop.Connecticut :
2.21 / 10,000 pop.
Number of supercenters and club stores : 5Fairfield County :
0.06 / 10,000 pop.Connecticut :
0.07 / 10,000 pop.
Number of convenience stores (no gas) : 76Fairfield County :
0.85 / 10,000 pop.State :
1.02 / 10,000 pop.
Number of convenience stores (with gas) : 151This county :
1.70 / 10,000 pop.Connecticut :
2.27 / 10,000 pop.
Number of full-service restaurants : 861Fairfield County :
9.67 / 10,000 pop.State :
9.19 / 10,000 pop.
Adult diabetes rate : This county :
6.5%Connecticut :
7.3%
Adult obesity rate : Here :
17.9%Connecticut :
21.5%
Low-income preschool obesity rate : This county :
17.2%Connecticut :
15.8%
Health and Nutrition: Healthy diet rate : This city:
58.5%State:
50.0%
Average overall health of teeth and gums : This city:
59.0%State:
47.5%
Average BMI : Ridgefield:
27.8Connecticut:
28.7
People feeling badly about themselves : Ridgefield:
18.8%Connecticut:
20.9%
People not drinking alcohol at all : This city:
7.3%State:
10.5%
Average hours sleeping at night : Ridgefield:
7.0Connecticut:
6.8
Overweight people : This city:
34.5%Connecticut:
34.2%
General health condition : Ridgefield:
64.4%Connecticut:
56.4%
Average condition of hearing : Ridgefield:
81.5%Connecticut:
78.9%
More about Health and Nutrition of Ridgefield, CT Residents
5.92% of this county's 2021 resident taxpayers lived in other counties in 2020 ($194,373 average adjusted gross income )
Here:
5.92%Connecticut average:
5.79%
0.01% of residents moved from foreign countries ($50 average AGI )Fairfield County:
0.01%Connecticut average:
0.02%
Top counties from which taxpayers relocated into this county between 2020 and 2021:
6.13% of this county's 2020 resident taxpayers moved to other counties in 2021 ($174,109 average adjusted gross income )
Here:
6.13%Connecticut average:
5.82%
0.01% of residents moved to foreign countries ($428 average AGI )Fairfield County:
0.01%Connecticut average:
0.02%
Top counties to which taxpayers relocated from this county between 2020 and 2021:
Businesses in Ridgefield, CT
Name Count Name Count
BMW 1 Nike 4 Baskin-Robbins 1 RadioShack 1 Best Cellars 1 Rite Aid 1 Blockbuster 1 Starbucks 1 CVS 1 Stop & Shop 1 Days Inn 1 Subway 3 Dunkin Donuts 4 T-Mobile 1 FedEx 5 Talbots 1 GNC 1 U-Haul 1 Gap 1 UPS 5 Kohl's 1 Walgreens 1 MasterBrand Cabinets 1
Strongest AM radio stations in Ridgefield:
WREF (850 AM; 2 kW; RIDGEFIELD, CT; Owner: THE BERKSHIRE BROADCASTING CORP.)
WFAN (660 AM; 50 kW; NEW YORK, NY; Owner: INFINITY BROADCASTING OPERATIONS, INC.)
WCBS (880 AM; 50 kW; NEW YORK, NY; Owner: INFINITY BROADCASTING OPERATIONS, INC.)
WABC (770 AM; 50 kW; NEW YORK, NY; Owner: WABC-AM RADIO, INC.)
WGSM (740 AM; 25 kW; HUNTINGTON, NY; Owner: K RADIO LICENSEE, INC.)
WMCA (570 AM; 50 kW; NEW YORK, NY; Owner: SALEM MEDIA OF NEW YORK, LLC)
WOR (710 AM; 50 kW; NEW YORK, NY; Owner: BUCKLEY BROADCASTING CORPORATION)
WEPN (1050 AM; 50 kW; NEW YORK, NY; Owner: NEW YORK AM RADIO, LLC)
WBBR (1130 AM; 50 kW; NEW YORK, NY; Owner: BLOOMBERG COMMUNICATIONS INC.)
WINS (1010 AM; 50 kW; NEW YORK, NY; Owner: INFINITY BROADCASTING OPERATIONS, INC.)
WADO (1280 AM; 50 kW; NEW YORK, NY; Owner: WADO-AM LICENSE CORP.)
WVIP (1310 AM; 5 kW; MT. KISCO, NY; Owner: RADIO VISION CRISTIANA MANAGEMENT)
WTIC (1080 AM; 50 kW; HARTFORD, CT; Owner: INFINITY RADIO OPERATIONS INC.)
Strongest FM radio stations in Ridgefield:
WDAQ (98.3 FM; DANBURY, CT; Owner: BERKSHIRE BROADCASTING CORP.)
WFAF (106.3 FM; MOUNT KISCO, NY; Owner: CUMULUS LICENSING CORP.)
WSLX (91.9 FM; NEW CANAAN, CT; Owner: ST. LUKE'S FOUNDATION, INC.)
WEZN-FM (99.9 FM; BRIDGEPORT, CT; Owner: CXR HOLDINGS, INC.)
WRKI (95.1 FM; BROOKFIELD, CT; Owner: CUMULUS LICENSING CORP.)
WSHU-FM (91.1 FM; FAIRFIELD, CT; Owner: SACRED HEART UNIVERSITY, INC.)
WSPK (104.7 FM; POUGHKEEPSIE, NY; Owner: 6 JOHNSON ROAD LICENSES, INC.)
WPKN (89.5 FM; BRIDGEPORT, CT; Owner: WPKN, INC.)
WPLJ (95.5 FM; NEW YORK, NY; Owner: WPLJ-FM RADIO, INC.)
WMNR (88.1 FM; MONROE, CT; Owner: MONROE BOARD OF EDUCATION)
WXCI (91.7 FM; DANBURY, CT; Owner: WESTERN CONNECTICUT STATE UNIVERSITY)
WDBY (105.5 FM; PATTERSON, NY; Owner: CUMULUS LICENSING CORP.)
WEFX (95.9 FM; NORWALK, CT; Owner: COX RADIO, INC.)
WKCI-FM (101.3 FM; HAMDEN, CT; Owner: CLEAR CHANNEL BROADCASTING LICENSES, INC.)
WPDH (101.5 FM; POUGHKEEPSIE, NY; Owner: CUMULUS LICENSING CORP.)
WFAR (93.3 FM; DANBURY, CT; Owner: DANBURY COMMUNITY RADIO, INC.)
WKCR-FM (89.9 FM; NEW YORK, NY; Owner: TRUSTEES OF COLUMBIA UNIVERSITY IN NEW YORK)
WXPK (107.1 FM; BRIARCLIFF MANOR, NY; Owner: NASSAU BROADCASTING HOLDINGS, INC.)
WPLR (99.1 FM; NEW HAVEN, CT; Owner: COX RADIO, INC.)
WRNQ (92.1 FM; POUGHKEEPSIE, NY; Owner: CLEAR CHANNEL BROADCASTING LICENSES, INC.)
TV broadcast stations around Ridgefield:
WNYW (Channel 5; NEW YORK, NY; Owner: FOX TELEVISION STATIONS, INC.)
WCBS-TV (Channel 2; NEW YORK, NY; Owner: CBS BROADCASTING INC.)
WEDW (Channel 49; BRIDGEPORT, CT; Owner: CONNECTICUT PUBLIC BROADCASTING, INC.)
WABC-TV (Channel 7; NEW YORK, NY; Owner: AMERICAN BROADCASTING COMPANIES, INC)
WPIX (Channel 11; NEW YORK, NY; Owner: WPIX, INC.)
WWOR-TV (Channel 9; SECAUCUS, NJ; Owner: FOX TELEVISION STATIONS, INC.)
WTIC-TV (Channel 61; HARTFORD, CT; Owner: TRIBUNE TELEVISION COMPANY)
W11BJ (Channel 11; HARTFORD, CT; Owner: COMMUNICATIONS SITE MANAGEMENT LLC)
WTBY (Channel 54; POUGHKEEPSIE, NY; Owner: TRINITY BROADCASTING OF NEW YORK, INC.)
WNJU (Channel 47; LINDEN, NJ; Owner: WNJU LICENSE CORPORATION)
WTNH (Channel 8; NEW HAVEN, CT; Owner: WTNH BROADCASTING, INC.)
WXNY-LP (Channel 32; NEW YORK, NY; Owner: ISLAND BROADCASTING COMPANY)
WPXN-TV (Channel 31; NEW YORK, NY; Owner: PAXSON COMMUNICATIONS LICENSE COMPANY, LLC)
WFUT (Channel 68; NEWARK, NJ; Owner: UNIVISION NEW YORK LLC)
WNBC (Channel 4; NEW YORK, NY; Owner: NATIONAL BROADCASTING COMPANY, INC.)
WNET (Channel 13; NEWARK, NJ; Owner: EDUCATIONAL BROADCASTING CORPORATION)
WXTV (Channel 41; PATERSON, NJ; Owner: WXTV LICENSE PARTNERSHIP, G.P.)
WNYE-TV (Channel 25; NEW YORK, NY; Owner: NEW YORK CITY BOARD OF EDUCATION)
WEDY (Channel 65; NEW HAVEN, CT; Owner: CONNECTICUT PUBLIC BROADCASTING, INC.)
WCTX (Channel 59; NEW HAVEN, CT; Owner: WTNH BROADCASTING, INC.)
WTXX (Channel 20; WATERBURY, CT; Owner: WTXX INC.)
W68DN (Channel 68; CHERRY HILL, ETC., NJ; Owner: MARCIA COHEN)
WKOB-LP (Channel 53; NEW YORK, NY; Owner: WKOB COMMUNICATIONS, INC.)
WEBR-CA (Channel 17; MANHATTAN, NY; Owner: K LICENSEE INC.)
WRNN-LP (Channel 57; NYACK, NY; Owner: LP NYACK LIMITED PARTNERSHIP)
National Bridge Inventory (NBI) Statistics 5 Number of bridges46ft / 14.3m Total length88,500 Total average daily traffic5,994 Total average daily truck traffic131,503 Total future (year 2033) average daily traffic
FCC Registered Cell Phone Towers: 2 (
See the full list of FCC Registered Cell Phone Towers in Ridgefield )
FCC Registered Antenna Towers: 13 (
See the full list of FCC Registered Antenna Towers )
FCC Registered Broadcast Land Mobile Towers: 11 (
See the full list of FCC Registered Broadcast Land Mobile Towers in Ridgefield, CT )
FCC Registered Microwave Towers: 3
PD HQ, 76 E Ridge Rd (Lat: 41.280833 Lon: -73.492833), Type: Mtower, Structure height: 39.6 m, Overall height: 40.8 m, Call Sign: WQXZ222, Assigned Frequencies: 11225.0 MHz, 11305.0 MHz, 11365.0 MHz, 11365.0 MHz, 11365.0 MHz, 11365.0 MHz, 11365.0 MHz, 11365.0 MHz, 11365.0 MHz, 11365.0 MHz, 11365.0 MHz, 11365.0 MHz, Grant Date: 07/19/2016, Expiration Date: 07/19/2026, Certifier: John Roche, Registrant: Utility Communications Inc, 920 Sherman Ave, Hamden, CT 06514, Phone: (203) 287-1306, Fax: (203) 248-9167, Email:
Peaceable Water Tank, Peaceable Ridge Road (Lat: 41.283306 Lon: -73.524694), Type: Tank, Structure height: 25 m, Overall height: 26.2 m, Call Sign: WQXZ227, Assigned Frequencies: 10815.0 MHz, Grant Date: 07/19/2016, Expiration Date: 07/19/2026, Certifier: John Roche, Registrant: Utility Communications Inc, 920 Sherman Ave, Hamden, CT 06514, Phone: (203) 287-1306, Fax: (203) 248-9167, Email:
Ridgefield Ledges, 320 Old Stagecoach Road (Lat: 41.330306 Lon: -73.516833), Type: Pole, Structure height: 48.8 m, Overall height: 49.4 m, Call Sign: WQXZ228, Assigned Frequencies: 10735.0 MHz, Grant Date: 07/19/2016, Expiration Date: 07/19/2026, Certifier: John Roche, Registrant: Utility Communications Inc, 920 Sherman Ave, Hamden, CT 06514, Phone: (203) 287-1306, Fax: (203) 248-9167, Email:
FCC Registered Paging Towers: 2
Peaceable Ridge Rd (Lat: 41.283611 Lon: -73.524444), Type: Tank, Structure height: 34.7 m, Overall height: 38.1 m, Call Sign: KNKJ292, Licensee ID: L01422065, Assigned Frequencies: 454.450 MHz, Grant Date: 05/05/2009, Expiration Date: 04/01/2019, Cancellation Date: 01/28/2014, Certifier: Shawn E Endsley, Registrant: Usa Mobility Wireless, Inc., 3000 Technology Dr. #400, Plano, TX 75074, Phone: (972) 801-0000, Fax: (972) 801-1699, Email:
Peaceable Ridge Road (Lat: 41.283611 Lon: -73.524444), Type: Tank, Structure height: 34.7 m, Overall height: 38.1 m, Call Sign: KCC484, Assigned Frequencies: 454.175 MHz, Grant Date: 05/11/1999, Expiration Date: 04/01/2009, Cancellation Date: 03/12/2009, Certifier: Shawn E Endsley, Registrant: Usa Mobility Wireless, Inc., 300 Technology Drive #400, Plano, TX 75074, Phone: (972) 801-1626, Fax: (972) 801-1699, Email:
FCC Registered Amateur Radio Licenses: 137 (
See the full list of FCC Registered Amateur Radio Licenses in Ridgefield )
FAA Registered Aircraft: 20 (
See the full list of FAA Registered Aircraft in Ridgefield )
Home Mortgage Disclosure Act Aggregated Statistics For Year 2009(Based on 3 partial tracts) A) FHA, FSA/RHS & VA B) Conventional C) Refinancings D) Home Improvement Loans F) Non-occupant Loans on Number Average Value Number Average Value Number Average Value Number Average Value Number Average Value
LOANS ORIGINATED 5 $348,352 42 $554,943 204 $443,380 4 $395,850 6 $259,590 APPLICATIONS APPROVED, NOT ACCEPTED 1 $172,700 6 $440,465 13 $529,145 1 $200,450 0 $0 APPLICATIONS DENIED 0 $0 5 $426,592 48 $512,525 4 $432,435 4 $270,635 APPLICATIONS WITHDRAWN 0 $0 8 $321,706 22 $431,557 2 $189,845 0 $0 FILES CLOSED FOR INCOMPLETENESS 1 $346,520 2 $456,070 9 $477,223 0 $0 0 $0
Aggregated Statistics For Year 2008(Based on 3 partial tracts) A) FHA, FSA/RHS & VA B) Conventional C) Refinancings D) Home Improvement Loans F) Non-occupant Loans on Number Average Value Number Average Value Number Average Value Number Average Value Number Average Value
LOANS ORIGINATED 2 $583,175 61 $501,275 72 $479,960 5 $924,354 5 $452,072 APPLICATIONS APPROVED, NOT ACCEPTED 0 $0 9 $461,962 15 $501,783 0 $0 0 $0 APPLICATIONS DENIED 0 $0 6 $482,052 21 $511,557 3 $341,493 2 $345,760 APPLICATIONS WITHDRAWN 0 $0 6 $498,412 11 $453,025 0 $0 1 $384,870 FILES CLOSED FOR INCOMPLETENESS 0 $0 3 $411,527 7 $554,213 0 $0 0 $0
Aggregated Statistics For Year 2007(Based on 3 partial tracts) B) Conventional C) Refinancings D) Home Improvement Loans F) Non-occupant Loans on Number Average Value Number Average Value Number Average Value Number Average Value
LOANS ORIGINATED 86 $584,999 77 $538,044 8 $528,600 9 $466,170 APPLICATIONS APPROVED, NOT ACCEPTED 17 $667,258 19 $413,422 3 $241,317 2 $218,995 APPLICATIONS DENIED 10 $601,792 23 $630,227 3 $244,100 2 $503,040 APPLICATIONS WITHDRAWN 7 $747,699 17 $394,082 0 $0 1 $1,100,500 FILES CLOSED FOR INCOMPLETENESS 3 $540,953 7 $359,687 0 $0 1 $610,850
Aggregated Statistics For Year 2006(Based on 3 partial tracts) B) Conventional C) Refinancings D) Home Improvement Loans F) Non-occupant Loans on Number Average Value Number Average Value Number Average Value Number Average Value
LOANS ORIGINATED 95 $523,840 86 $438,141 16 $308,752 10 $327,411 APPLICATIONS APPROVED, NOT ACCEPTED 17 $444,698 13 $372,607 3 $73,707 2 $145,495 APPLICATIONS DENIED 8 $527,224 26 $507,960 6 $306,225 2 $317,215 APPLICATIONS WITHDRAWN 12 $350,823 28 $473,748 1 $463,270 1 $1,343,830 FILES CLOSED FOR INCOMPLETENESS 2 $362,955 6 $367,102 2 $472,990 0 $0
Aggregated Statistics For Year 2005(Based on 3 partial tracts) B) Conventional C) Refinancings D) Home Improvement Loans F) Non-occupant Loans on Number Average Value Number Average Value Number Average Value Number Average Value
LOANS ORIGINATED 120 $537,612 119 $488,757 17 $280,282 12 $525,012 APPLICATIONS APPROVED, NOT ACCEPTED 18 $549,672 11 $307,266 3 $128,357 1 $569,980 APPLICATIONS DENIED 11 $704,828 29 $439,194 6 $121,662 3 $485,603 APPLICATIONS WITHDRAWN 12 $620,598 28 $568,872 4 $249,942 1 $289,550 FILES CLOSED FOR INCOMPLETENESS 4 $426,362 16 $469,438 2 $259,640 2 $399,280
Aggregated Statistics For Year 2004(Based on 3 partial tracts) B) Conventional C) Refinancings D) Home Improvement Loans E) Loans on Dwellings For 5+ Families F) Non-occupant Loans on Number Average Value Number Average Value Number Average Value Number Average Value Number Average Value
LOANS ORIGINATED 137 $510,888 170 $412,097 18 $319,183 1 $424,620 18 $345,956 APPLICATIONS APPROVED, NOT ACCEPTED 20 $491,782 21 $328,033 2 $328,365 0 $0 1 $493,400 APPLICATIONS DENIED 6 $275,492 36 $384,938 4 $171,975 0 $0 4 $223,962 APPLICATIONS WITHDRAWN 14 $577,949 23 $414,320 3 $467,030 0 $0 1 $626,410 FILES CLOSED FOR INCOMPLETENESS 5 $631,078 14 $444,749 2 $64,745 0 $0 0 $0
Aggregated Statistics For Year 2003(Based on 3 partial tracts) A) FHA, FSA/RHS & VA B) Conventional C) Refinancings D) Home Improvement Loans F) Non-occupant Loans on Number Average Value Number Average Value Number Average Value Number Average Value Number Average Value
LOANS ORIGINATED 1 $129,330 121 $470,566 487 $340,419 5 $142,666 25 $282,324 APPLICATIONS APPROVED, NOT ACCEPTED 1 $38,420 16 $508,363 59 $358,110 2 $140,820 2 $332,245 APPLICATIONS DENIED 0 $0 10 $551,614 64 $328,890 4 $65,420 3 $169,970 APPLICATIONS WITHDRAWN 0 $0 9 $560,551 40 $344,952 0 $0 0 $0 FILES CLOSED FOR INCOMPLETENESS 0 $0 3 $369,443 9 $437,213 0 $0 1 $176,920
Aggregated Statistics For Year 2002(Based on 3 partial tracts) A) FHA, FSA/RHS & VA B) Conventional C) Refinancings D) Home Improvement Loans F) Non-occupant Loans on Number Average Value Number Average Value Number Average Value Number Average Value Number Average Value
LOANS ORIGINATED 1 $112,380 126 $417,167 354 $349,692 23 $88,587 21 $278,100 APPLICATIONS APPROVED, NOT ACCEPTED 0 $0 18 $498,075 37 $313,767 5 $87,934 2 $212,395 APPLICATIONS DENIED 0 $0 7 $274,891 35 $297,531 6 $104,275 3 $212,227 APPLICATIONS WITHDRAWN 0 $0 13 $422,815 35 $276,245 0 $0 1 $249,720 FILES CLOSED FOR INCOMPLETENESS 0 $0 1 $512,130 12 $277,686 0 $0 0 $0
Aggregated Statistics For Year 2001(Based on 3 partial tracts) A) FHA, FSA/RHS & VA B) Conventional C) Refinancings D) Home Improvement Loans F) Non-occupant Loans on Number Average Value Number Average Value Number Average Value Number Average Value Number Average Value
LOANS ORIGINATED 1 $103,310 108 $392,459 201 $342,698 12 $75,068 15 $244,800 APPLICATIONS APPROVED, NOT ACCEPTED 0 $0 11 $389,265 20 $250,160 4 $70,325 1 $233,480 APPLICATIONS DENIED 0 $0 7 $293,167 31 $234,880 2 $48,115 2 $286,190 APPLICATIONS WITHDRAWN 0 $0 11 $363,362 17 $307,002 3 $23,623 1 $228,360 FILES CLOSED FOR INCOMPLETENESS 0 $0 1 $958,000 5 $231,586 0 $0 0 $0
Aggregated Statistics For Year 2000(Based on 3 partial tracts) B) Conventional C) Refinancings D) Home Improvement Loans F) Non-occupant Loans on Number Average Value Number Average Value Number Average Value Number Average Value
LOANS ORIGINATED 107 $375,464 45 $308,968 15 $83,643 6 $174,407 APPLICATIONS APPROVED, NOT ACCEPTED 16 $424,185 9 $177,171 6 $60,680 0 $0 APPLICATIONS DENIED 6 $343,302 12 $264,184 4 $59,558 1 $211,550 APPLICATIONS WITHDRAWN 10 $286,935 10 $194,602 4 $104,192 1 $192,600 FILES CLOSED FOR INCOMPLETENESS 3 $272,140 4 $300,625 1 $72,330 0 $0
Aggregated Statistics For Year 1999(Based on 3 partial tracts) A) FHA, FSA/RHS & VA B) Conventional C) Refinancings D) Home Improvement Loans E) Loans on Dwellings For 5+ Families F) Non-occupant Loans on Number Average Value Number Average Value Number Average Value Number Average Value Number Average Value Number Average Value
LOANS ORIGINATED 3 $111,947 133 $341,654 139 $267,863 10 $54,502 1 $635,280 13 $301,528 APPLICATIONS APPROVED, NOT ACCEPTED 0 $0 15 $391,033 12 $265,610 2 $19,235 0 $0 1 $97,670 APPLICATIONS DENIED 1 $152,260 8 $511,100 16 $181,423 5 $107,248 0 $0 0 $0 APPLICATIONS WITHDRAWN 1 $157,320 8 $411,356 12 $246,237 4 $176,080 0 $0 1 $223,180 FILES CLOSED FOR INCOMPLETENESS 0 $0 3 $570,077 7 $312,753 1 $36,030 0 $0 0 $0
Detailed HMDA statistics for the following Tracts:
2453.00
, 2454.00 , 2455.00
Private Mortgage Insurance Companies Aggregated Statistics For Year 2009(Based on 3 partial tracts) A) Conventional Number Average Value
LOANS ORIGINATED 0 $0 APPLICATIONS APPROVED, NOT ACCEPTED 2 $251,630 APPLICATIONS DENIED 2 $431,575 APPLICATIONS WITHDRAWN 0 $0 FILES CLOSED FOR INCOMPLETENESS 0 $0
Aggregated Statistics For Year 2008(Based on 2 partial tracts) A) Conventional B) Refinancings Number Average Value Number Average Value
LOANS ORIGINATED 3 $277,367 1 $426,630 APPLICATIONS APPROVED, NOT ACCEPTED 1 $146,680 1 $209,770 APPLICATIONS DENIED 1 $587,880 0 $0 APPLICATIONS WITHDRAWN 0 $0 0 $0 FILES CLOSED FOR INCOMPLETENESS 0 $0 0 $0
Aggregated Statistics For Year 2007(Based on 3 partial tracts) A) Conventional B) Refinancings Number Average Value Number Average Value
LOANS ORIGINATED 2 $430,075 1 $300,060 APPLICATIONS APPROVED, NOT ACCEPTED 1 $502,600 0 $0 APPLICATIONS DENIED 0 $0 0 $0 APPLICATIONS WITHDRAWN 1 $235,790 0 $0 FILES CLOSED FOR INCOMPLETENESS 0 $0 0 $0
Aggregated Statistics For Year 2006(Based on 3 partial tracts) A) Conventional Number Average Value
LOANS ORIGINATED 4 $464,328 APPLICATIONS APPROVED, NOT ACCEPTED 1 $279,950 APPLICATIONS DENIED 2 $1,027,585 APPLICATIONS WITHDRAWN 2 $1,051,480 FILES CLOSED FOR INCOMPLETENESS 0 $0
Aggregated Statistics For Year 2005(Based on 2 partial tracts) A) Conventional Number Average Value
LOANS ORIGINATED 4 $255,385 APPLICATIONS APPROVED, NOT ACCEPTED 1 $345,800 APPLICATIONS DENIED 0 $0 APPLICATIONS WITHDRAWN 0 $0 FILES CLOSED FOR INCOMPLETENESS 0 $0
Aggregated Statistics For Year 2004(Based on 2 partial tracts) A) Conventional Number Average Value
LOANS ORIGINATED 3 $346,423 APPLICATIONS APPROVED, NOT ACCEPTED 1 $373,060 APPLICATIONS DENIED 0 $0 APPLICATIONS WITHDRAWN 0 $0 FILES CLOSED FOR INCOMPLETENESS 0 $0
Aggregated Statistics For Year 2003(Based on 3 partial tracts) A) Conventional B) Refinancings Number Average Value Number Average Value
LOANS ORIGINATED 5 $308,648 2 $127,950 APPLICATIONS APPROVED, NOT ACCEPTED 2 $278,260 1 $233,710 APPLICATIONS DENIED 0 $0 0 $0 APPLICATIONS WITHDRAWN 0 $0 1 $118,680 FILES CLOSED FOR INCOMPLETENESS 0 $0 0 $0
Aggregated Statistics For Year 2002(Based on 3 partial tracts) A) Conventional B) Refinancings C) Non-occupant Loans on Number Average Value Number Average Value Number Average Value
LOANS ORIGINATED 13 $279,397 1 $316,680 1 $135,240 APPLICATIONS APPROVED, NOT ACCEPTED 5 $223,166 2 $130,910 0 $0 APPLICATIONS DENIED 0 $0 0 $0 0 $0 APPLICATIONS WITHDRAWN 2 $97,000 0 $0 0 $0 FILES CLOSED FOR INCOMPLETENESS 0 $0 0 $0 0 $0
Aggregated Statistics For Year 2001(Based on 3 partial tracts) A) Conventional B) Refinancings C) Non-occupant Loans on Number Average Value Number Average Value Number Average Value
LOANS ORIGINATED 11 $231,768 1 $149,050 0 $0 APPLICATIONS APPROVED, NOT ACCEPTED 2 $351,490 0 $0 1 $176,420 APPLICATIONS DENIED 0 $0 0 $0 0 $0 APPLICATIONS WITHDRAWN 0 $0 0 $0 0 $0 FILES CLOSED FOR INCOMPLETENESS 0 $0 0 $0 0 $0
Aggregated Statistics For Year 2000(Based on 3 partial tracts) A) Conventional B) Refinancings C) Non-occupant Loans on Number Average Value Number Average Value Number Average Value
LOANS ORIGINATED 15 $232,565 2 $120,065 1 $100,150 APPLICATIONS APPROVED, NOT ACCEPTED 0 $0 0 $0 0 $0 APPLICATIONS DENIED 0 $0 0 $0 0 $0 APPLICATIONS WITHDRAWN 0 $0 0 $0 0 $0 FILES CLOSED FOR INCOMPLETENESS 0 $0 0 $0 0 $0
Aggregated Statistics For Year 1999(Based on 3 partial tracts) A) Conventional B) Refinancings C) Non-occupant Loans on Number Average Value Number Average Value Number Average Value
LOANS ORIGINATED 17 $207,379 3 $237,200 1 $172,130 APPLICATIONS APPROVED, NOT ACCEPTED 1 $249,500 2 $244,880 0 $0 APPLICATIONS DENIED 1 $181,850 0 $0 0 $0 APPLICATIONS WITHDRAWN 0 $0 0 $0 0 $0 FILES CLOSED FOR INCOMPLETENESS 0 $0 0 $0 0 $0
Detailed PMIC statistics for the following Tracts:
2453.00
, 2454.00 , 2455.00
Most common first names in Ridgefield, CT among deceased individuals Name Count Lived (average)
John 135 74.4 years Mary 133 81.9 years William 89 75.3 years Joseph 78 74.7 years Helen 76 82.6 years James 73 74.3 years Margaret 65 81.4 years Robert 64 74.1 years Elizabeth 57 80.2 years Charles 56 76.4 years
Most common last names in Ridgefield, CT among deceased individuals Last name Count Lived (average)
Smith 44 80.7 years Johnson 23 76.0 years Scott 18 79.2 years Carboni 16 79.9 years Thomas 15 71.8 years Martin 14 79.8 years Miller 14 80.1 years Jones 13 80.7 years Green 11 76.4 years Tulipani 11 81.1 years
Ridgefield compared to Connecticut state average:
Median household income above state average. Median house value significantly above state average. Unemployed percentage significantly below state average. Black race population percentage below state average. Hispanic race population percentage significantly below state average. Median age above state average. Length of stay since moving in significantly below state average. Number of rooms per house above state average. Percentage of population with a bachelor's degree or higher significantly above state average. Ridgefield on our top lists :
#32 on the list of "Top 101 cities with largest percentage of males in industries: finance and insurance (population 5,000+)"
#54 on the list of "Top 101 cities with largest percentage of males in occupations: business and financial operations occupations (population 5,000+)"
#75 on the list of "Top 101 cities with the most residents born in Argentina (population 500+)"
#90 on the list of "Top 101 cities with largest percentage of females in industries: professional, scientific, and technical services (population 5,000+)"
#99 on the list of "Top 101 cities with the most residents born in Romania (population 500+)"
#61 (06877) on the list of "Top 101 zip codes with the highest average reported salary/wage in 2012 (pop 5,000+)"
#89 (06877) on the list of "Top 101 zip codes with the largest percentage of taxpayers using charity contributions deductions in 2012 (pop 5,000+)"
#14 on the list of "Top 101 counties with the most Orthodox congregations"
#18 on the list of "Top 101 counties with the best general health status score of residents (1-5), 3 years of data"
#21 on the list of "Top 101 counties with the most Catholic congregations"
#21 on the list of "Top 101 counties with the most Catholic adherents"
#22 on the list of "Top 101 counties with the highest percentage of residents that visited a dentist within the past year"
Top Patent Applicants
Jay S. Walker (435)
Jeffrey W. Sleight (196)
Oliver C. Mullins (49)
Magdalena M. Fincham (42)
Steven M. Santisi (39)
Timothy J. Dalton (36)
Matthew John Campagna (35)
Robert L. Wisnieff (30)
Harry Sewell (27)
Pamela A. Nesbitt (24)
Total of 2020 patent applications in 2008-2024.


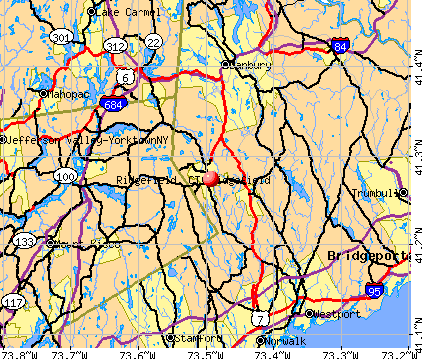


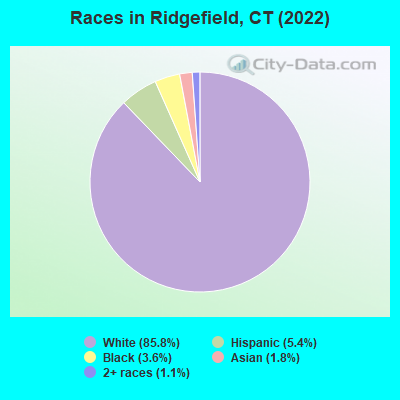
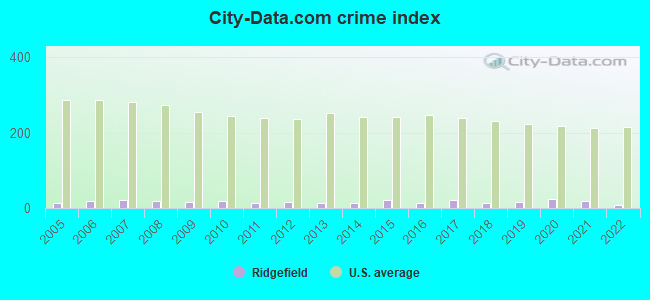
 Recent articles from our blog. Our writers, many of them Ph.D. graduates or candidates, create easy-to-read articles on a wide variety of topics.

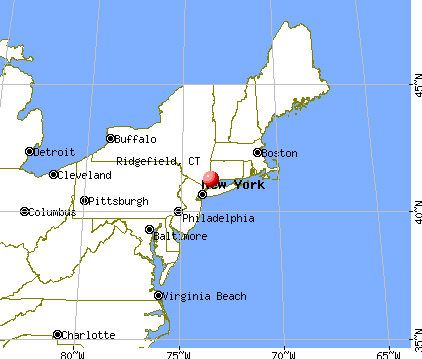
 (9.1 miles
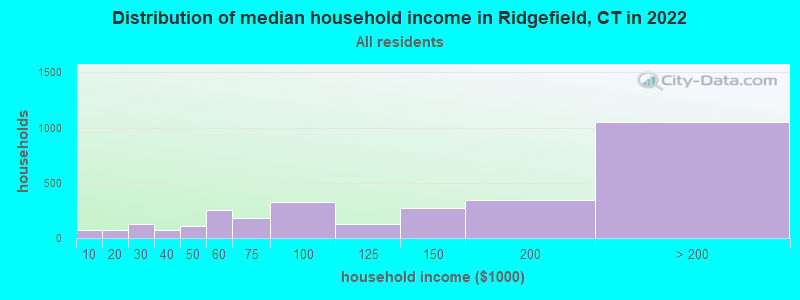
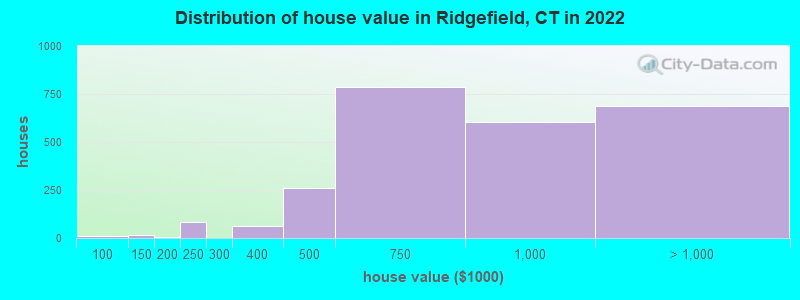

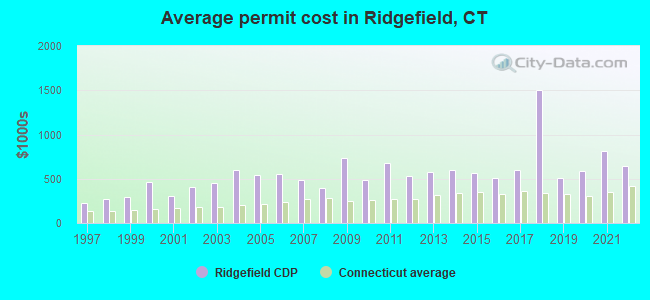
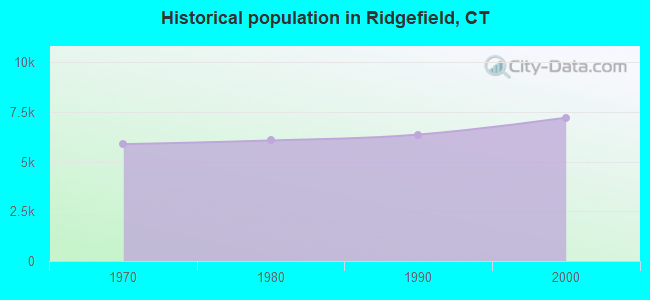
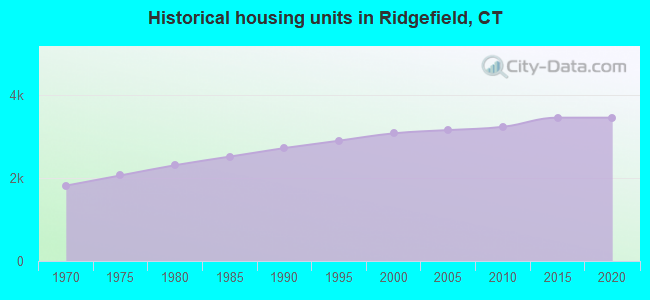
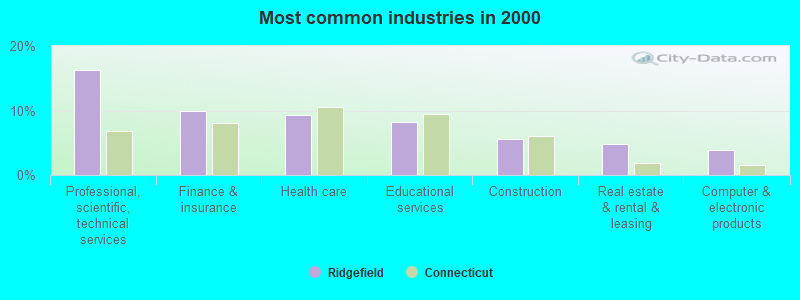
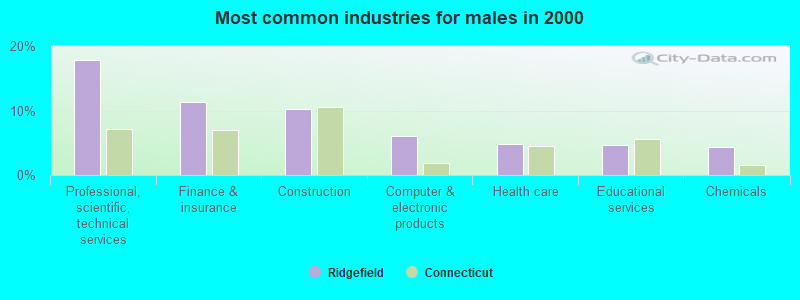
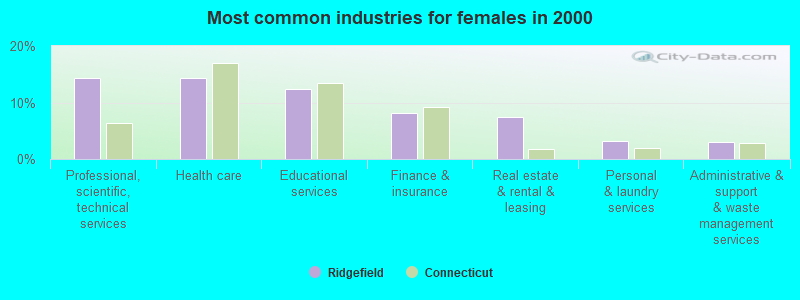
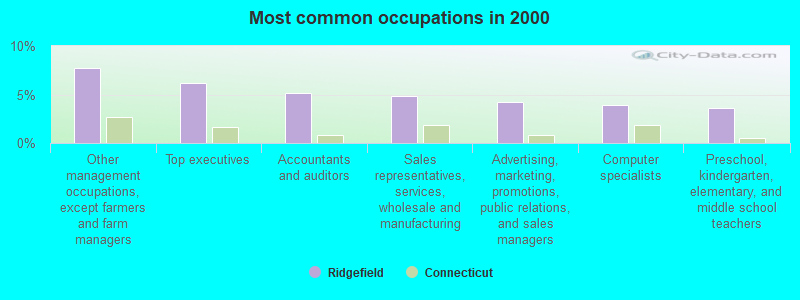
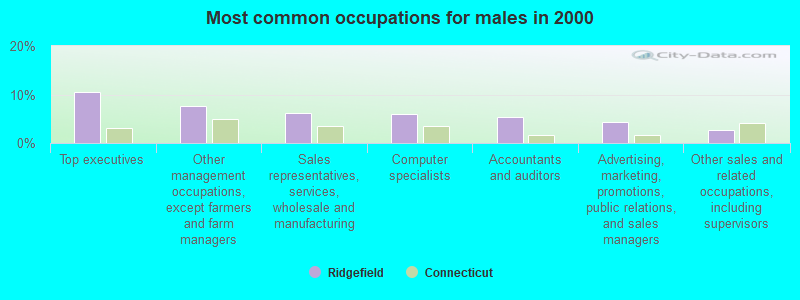
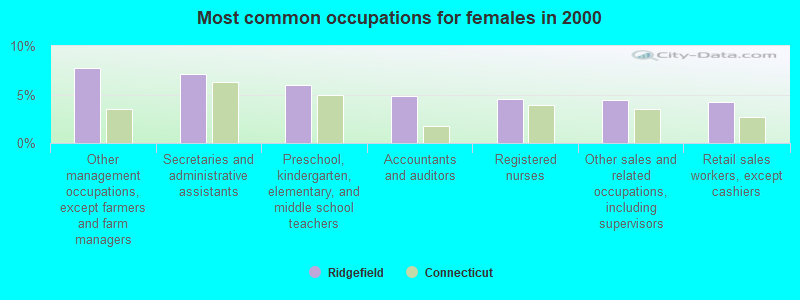
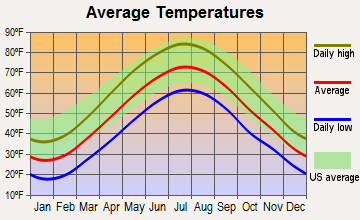
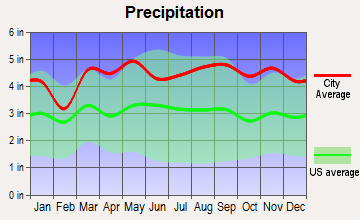
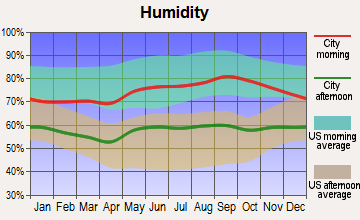
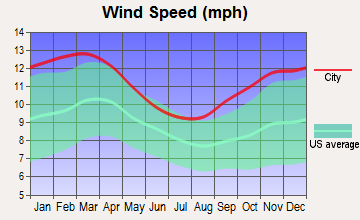
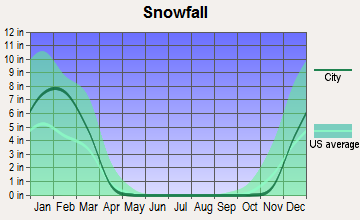
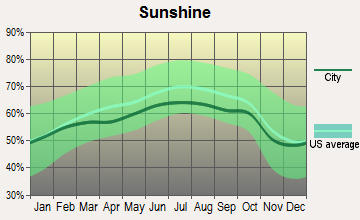
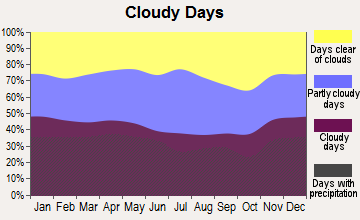
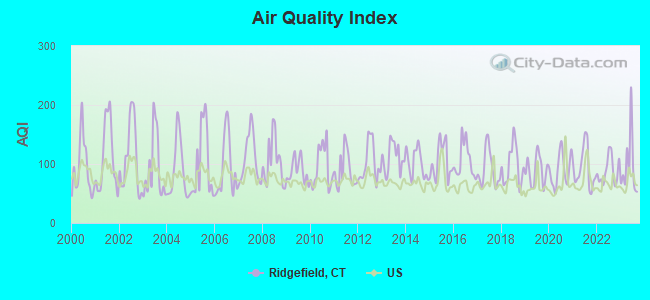
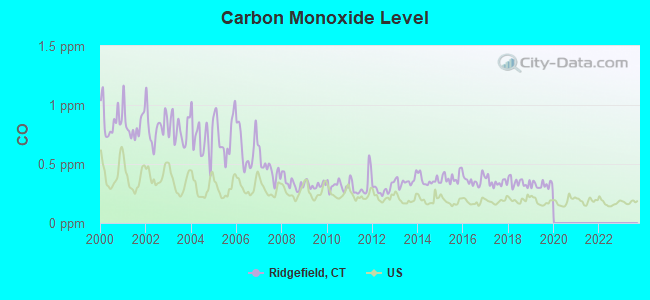
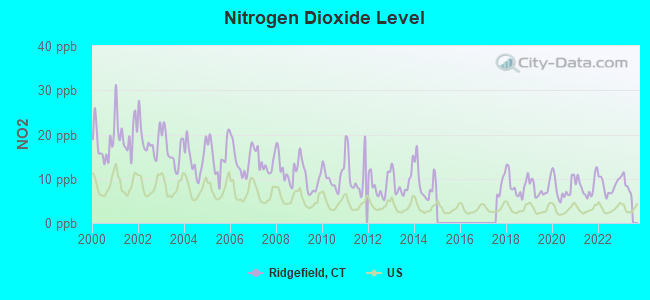
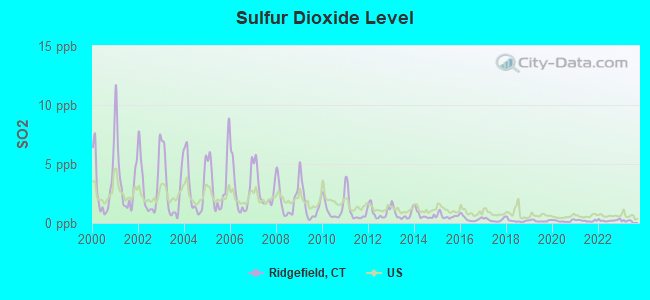
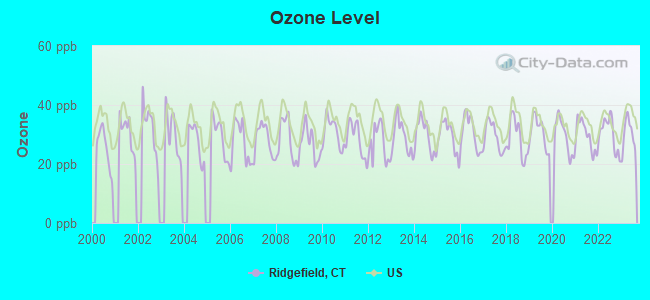
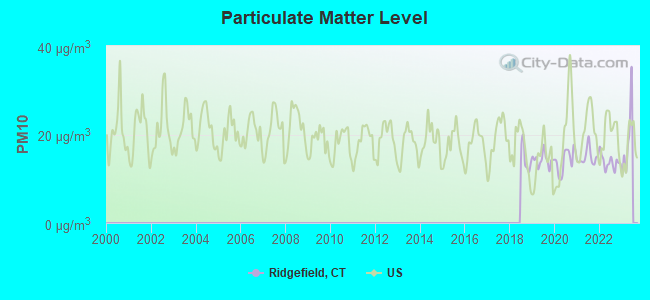

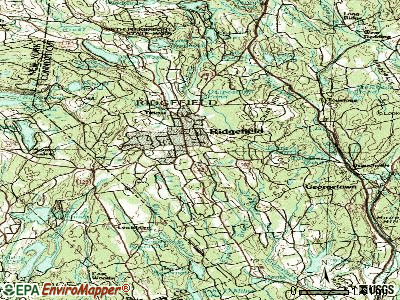
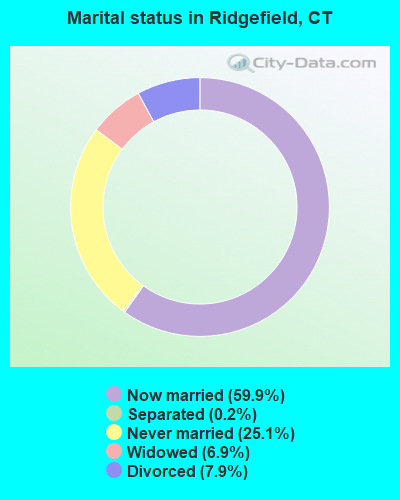
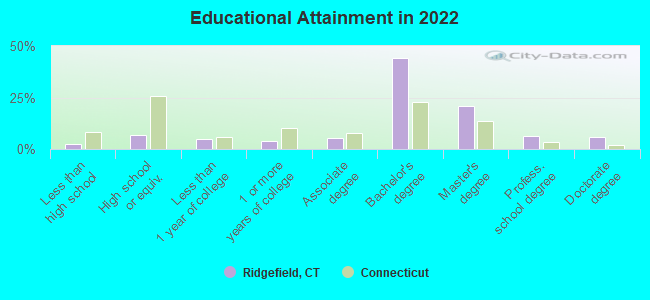
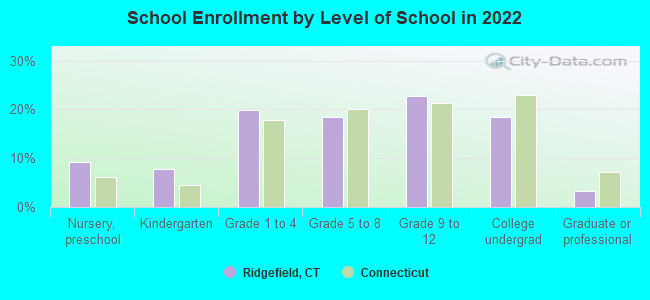
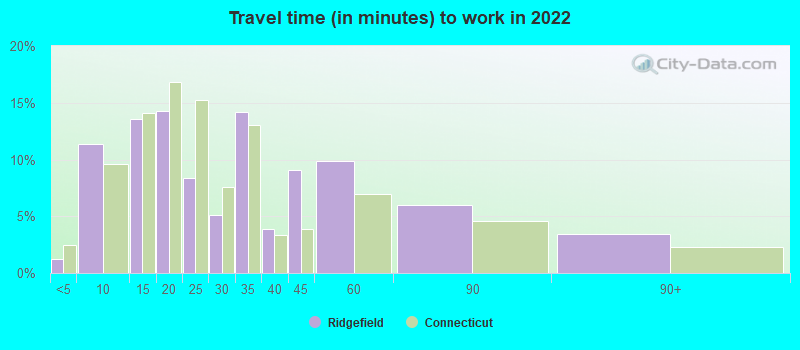
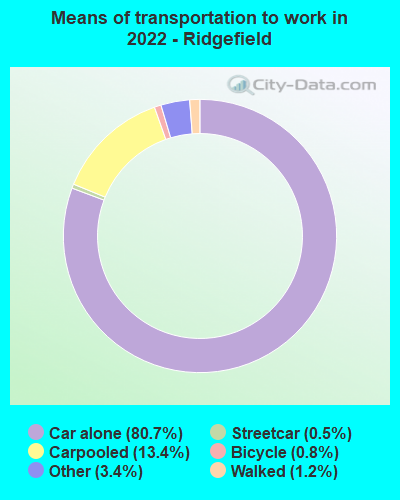
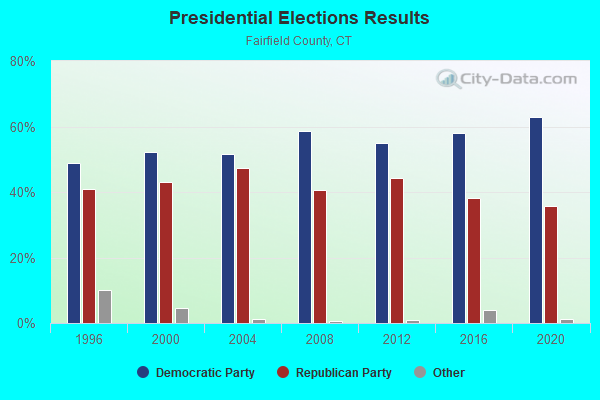
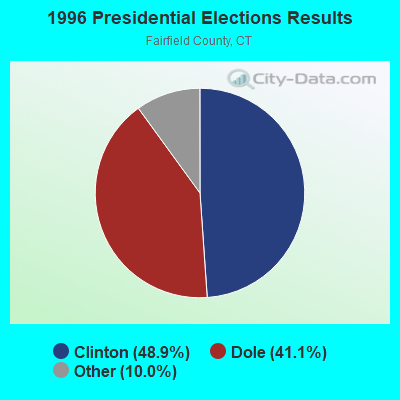
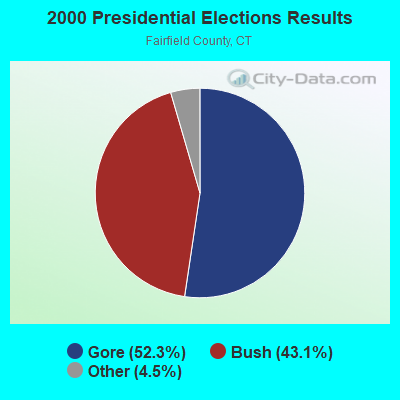
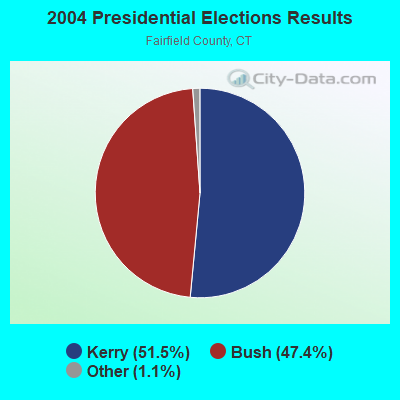
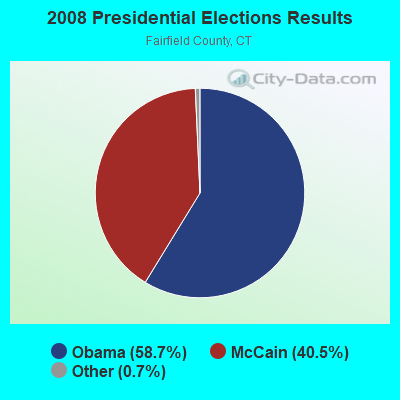
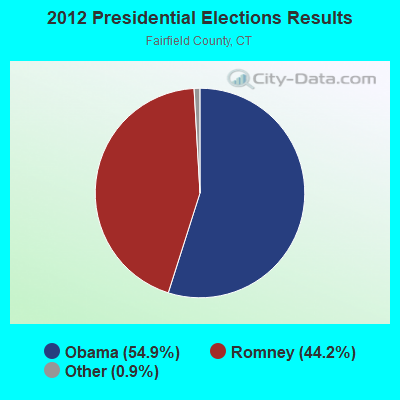
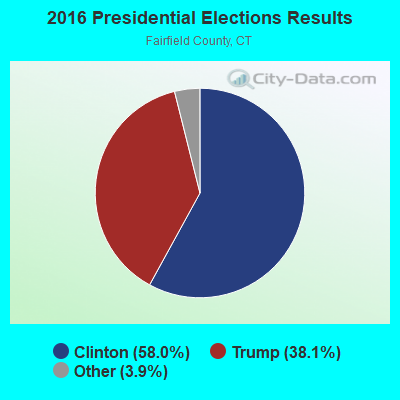
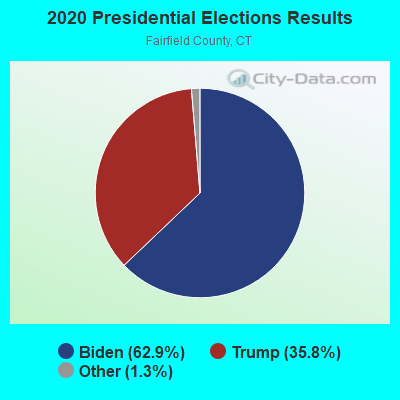
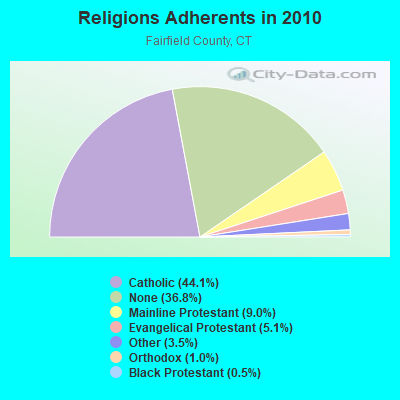
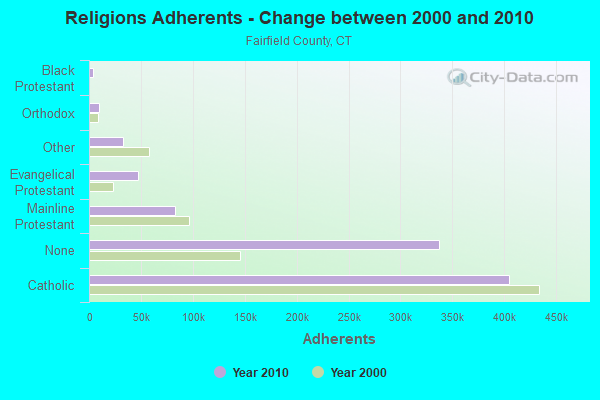
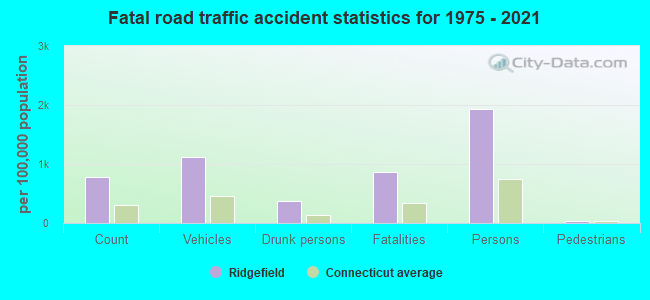
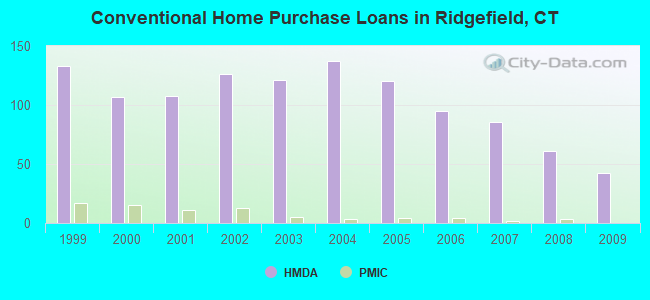
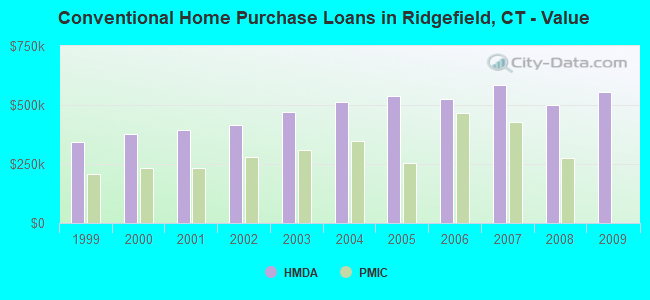
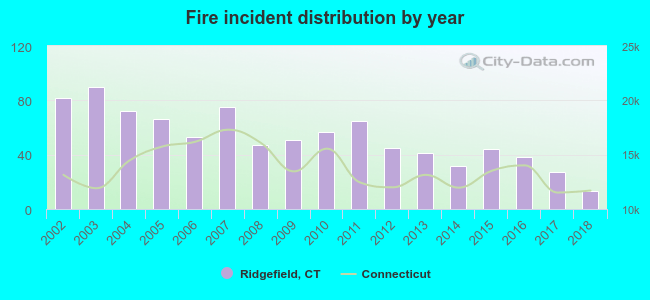 Based on the data from the years 2002 - 2018 the average number of fires per year is 53. The highest number of fires - 90 took place in 2003, and the least - 13 in 2018. The data has a dropping trend.
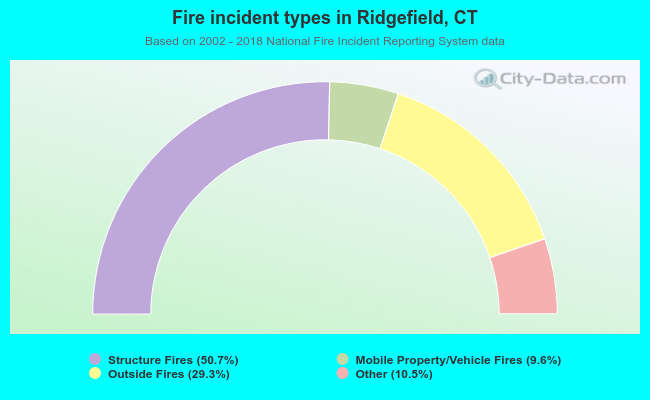 When looking into fire subcategories, the most reports belonged to: Structure Fires (50.7%), and Outside Fires (29.3%).