Rio Vista, California Submit your own pictures of this city and show them to the world
OSM Map
General Map
Google Map
MSN Map
OSM Map
General Map
Google Map
MSN Map
OSM Map
General Map
Google Map
MSN Map
OSM Map
General Map
Google Map
MSN Map
Please wait while loading the map...
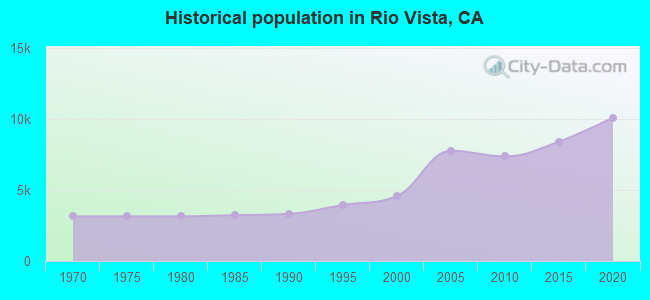
Population in 2022: 10,375 (96% urban, 4% rural). Population change since 2000: +127.0%Males: 4,762 Females: 5,613
March 2022 cost of living index in Rio Vista: 111.5 (more than average, U.S. average is 100) Percentage of residents living in poverty in 2022: 9.1%for White Non-Hispanic residents , 13.3% for Black residents , 14.2% for Hispanic or Latino residents , 3.1% for other race residents )Business Search - 14 Million verified businesses
Data:
Median household income ($)
Median household income (% change since 2000)
Household income diversity
Ratio of average income to average house value (%)
Ratio of average income to average rent
Median household income ($) - White
Median household income ($) - Black or African American
Median household income ($) - Asian
Median household income ($) - Hispanic or Latino
Median household income ($) - American Indian and Alaska Native
Median household income ($) - Multirace
Median household income ($) - Other Race
Median household income for houses/condos with a mortgage ($)
Median household income for apartments without a mortgage ($)
Races - White alone (%)
Races - White alone (% change since 2000)
Races - Black alone (%)
Races - Black alone (% change since 2000)
Races - American Indian alone (%)
Races - American Indian alone (% change since 2000)
Races - Asian alone (%)
Races - Asian alone (% change since 2000)
Races - Hispanic (%)
Races - Hispanic (% change since 2000)
Races - Native Hawaiian and Other Pacific Islander alone (%)
Races - Native Hawaiian and Other Pacific Islander alone (% change since 2000)
Races - Two or more races (%)
Races - Two or more races (% change since 2000)
Races - Other race alone (%)
Races - Other race alone (% change since 2000)
Racial diversity
Unemployment (%)
Unemployment (% change since 2000)
Unemployment (%) - White
Unemployment (%) - Black or African American
Unemployment (%) - Asian
Unemployment (%) - Hispanic or Latino
Unemployment (%) - American Indian and Alaska Native
Unemployment (%) - Multirace
Unemployment (%) - Other Race
Population density (people per square mile)
Population - Males (%)
Population - Females (%)
Population - Males (%) - White
Population - Males (%) - Black or African American
Population - Males (%) - Asian
Population - Males (%) - Hispanic or Latino
Population - Males (%) - American Indian and Alaska Native
Population - Males (%) - Multirace
Population - Males (%) - Other Race
Population - Females (%) - White
Population - Females (%) - Black or African American
Population - Females (%) - Asian
Population - Females (%) - Hispanic or Latino
Population - Females (%) - American Indian and Alaska Native
Population - Females (%) - Multirace
Population - Females (%) - Other Race
Coronavirus confirmed cases (Apr 18, 2024)
Deaths caused by coronavirus (Apr 18, 2024)
Coronavirus confirmed cases (per 100k population) (Apr 18, 2024)
Deaths caused by coronavirus (per 100k population) (Apr 18, 2024)
Daily increase in number of cases (Apr 18, 2024)
Weekly increase in number of cases (Apr 18, 2024)
Cases doubled (in days) (Apr 18, 2024)
Hospitalized patients (Apr 18, 2022)
Negative test results (Apr 18, 2022)
Total test results (Apr 18, 2022)
COVID Vaccine doses distributed (per 100k population) (Sep 19, 2023)
COVID Vaccine doses administered (per 100k population) (Sep 19, 2023)
COVID Vaccine doses distributed (Sep 19, 2023)
COVID Vaccine doses administered (Sep 19, 2023)
Likely homosexual households (%)
Likely homosexual households (% change since 2000)
Likely homosexual households - Lesbian couples (%)
Likely homosexual households - Lesbian couples (% change since 2000)
Likely homosexual households - Gay men (%)
Likely homosexual households - Gay men (% change since 2000)
Cost of living index
Median gross rent ($)
Median contract rent ($)
Median monthly housing costs ($)
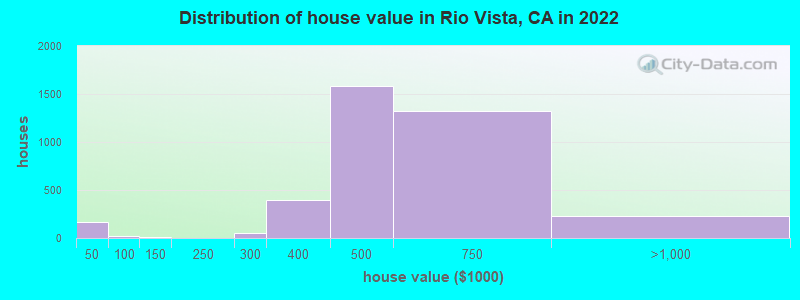
Median house or condo value ($)
Median house or condo value ($ change since 2000)
Mean house or condo value by units in structure - 1, detached ($)
Mean house or condo value by units in structure - 1, attached ($)
Mean house or condo value by units in structure - 2 ($)
Mean house or condo value by units in structure by units in structure - 3 or 4 ($)
Mean house or condo value by units in structure - 5 or more ($)
Mean house or condo value by units in structure - Boat, RV, van, etc. ($)
Mean house or condo value by units in structure - Mobile home ($)
Median house or condo value ($) - White
Median house or condo value ($) - Black or African American
Median house or condo value ($) - Asian
Median house or condo value ($) - Hispanic or Latino
Median house or condo value ($) - American Indian and Alaska Native
Median house or condo value ($) - Multirace
Median house or condo value ($) - Other Race
Median resident age
Resident age diversity
Median resident age - Males
Median resident age - Females
Median resident age - White
Median resident age - Black or African American
Median resident age - Asian
Median resident age - Hispanic or Latino
Median resident age - American Indian and Alaska Native
Median resident age - Multirace
Median resident age - Other Race
Median resident age - Males - White
Median resident age - Males - Black or African American
Median resident age - Males - Asian
Median resident age - Males - Hispanic or Latino
Median resident age - Males - American Indian and Alaska Native
Median resident age - Males - Multirace
Median resident age - Males - Other Race
Median resident age - Females - White
Median resident age - Females - Black or African American
Median resident age - Females - Asian
Median resident age - Females - Hispanic or Latino
Median resident age - Females - American Indian and Alaska Native
Median resident age - Females - Multirace
Median resident age - Females - Other Race
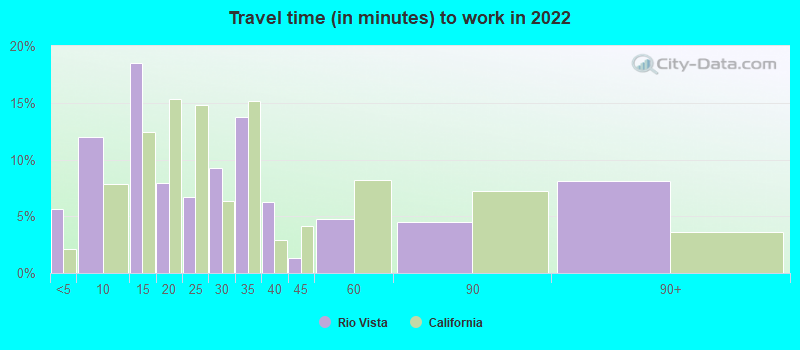
Commute - mean travel time to work (minutes)
Travel time to work - Less than 5 minutes (%)
Travel time to work - Less than 5 minutes (% change since 2000)
Travel time to work - 5 to 9 minutes (%)
Travel time to work - 5 to 9 minutes (% change since 2000)
Travel time to work - 10 to 19 minutes (%)
Travel time to work - 10 to 19 minutes (% change since 2000)
Travel time to work - 20 to 29 minutes (%)
Travel time to work - 20 to 29 minutes (% change since 2000)
Travel time to work - 30 to 39 minutes (%)
Travel time to work - 30 to 39 minutes (% change since 2000)
Travel time to work - 40 to 59 minutes (%)
Travel time to work - 40 to 59 minutes (% change since 2000)
Travel time to work - 60 to 89 minutes (%)
Travel time to work - 60 to 89 minutes (% change since 2000)
Travel time to work - 90 or more minutes (%)
Travel time to work - 90 or more minutes (% change since 2000)
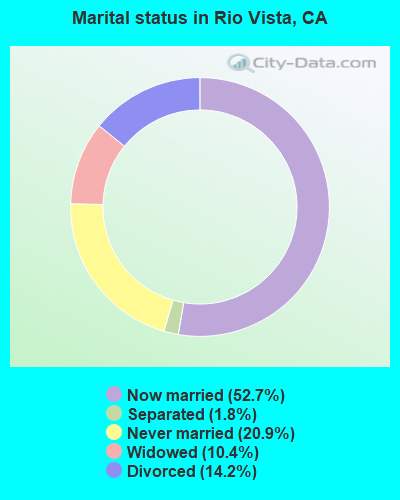
Marital status - Never married (%)
Marital status - Now married (%)
Marital status - Separated (%)
Marital status - Widowed (%)
Marital status - Divorced (%)
Median family income ($)
Median family income (% change since 2000)
Median non-family income ($)
Median non-family income (% change since 2000)
Median per capita income ($)
Median per capita income (% change since 2000)
Median family income ($) - White
Median family income ($) - Black or African American
Median family income ($) - Asian
Median family income ($) - Hispanic or Latino
Median family income ($) - American Indian and Alaska Native
Median family income ($) - Multirace
Median family income ($) - Other Race
Median year house/condo built
Median year apartment built
Year house built - Built 2005 or later (%)
Year house built - Built 2000 to 2004 (%)
Year house built - Built 1990 to 1999 (%)
Year house built - Built 1980 to 1989 (%)
Year house built - Built 1970 to 1979 (%)
Year house built - Built 1960 to 1969 (%)
Year house built - Built 1950 to 1959 (%)
Year house built - Built 1940 to 1949 (%)
Year house built - Built 1939 or earlier (%)
Average household size
Household density (households per square mile)
Average household size - White
Average household size - Black or African American
Average household size - Asian
Average household size - Hispanic or Latino
Average household size - American Indian and Alaska Native
Average household size - Multirace
Average household size - Other Race
Occupied housing units (%)
Vacant housing units (%)
Owner occupied housing units (%)
Renter occupied housing units (%)
Vacancy status - For rent (%)
Vacancy status - For sale only (%)
Vacancy status - Rented or sold, not occupied (%)
Vacancy status - For seasonal, recreational, or occasional use (%)
Vacancy status - For migrant workers (%)
Vacancy status - Other vacant (%)
Residents with income below the poverty level (%)
Residents with income below 50% of the poverty level (%)
Children below poverty level (%)
Poor families by family type - Married-couple family (%)
Poor families by family type - Male, no wife present (%)
Poor families by family type - Female, no husband present (%)
Poverty status for native-born residents (%)
Poverty status for foreign-born residents (%)
Poverty among high school graduates not in families (%)
Poverty among people who did not graduate high school not in families (%)
Residents with income below the poverty level (%) - White
Residents with income below the poverty level (%) - Black or African American
Residents with income below the poverty level (%) - Asian
Residents with income below the poverty level (%) - Hispanic or Latino
Residents with income below the poverty level (%) - American Indian and Alaska Native
Residents with income below the poverty level (%) - Multirace
Residents with income below the poverty level (%) - Other Race
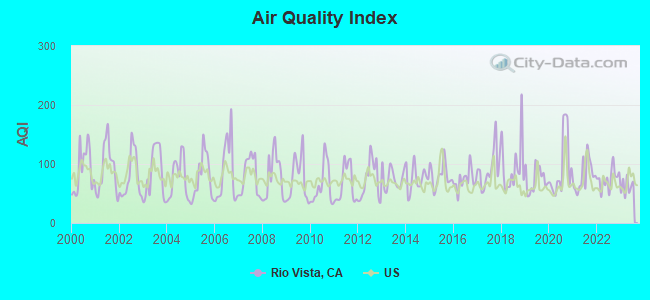
Air pollution - Air Quality Index (AQI)
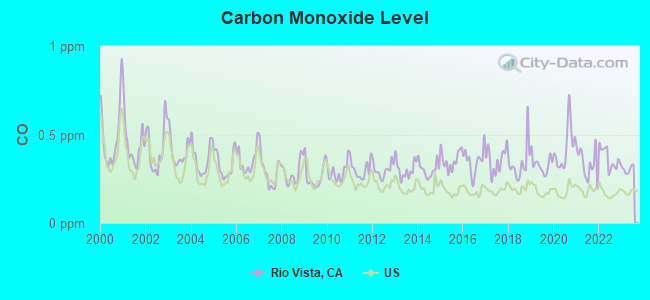
Air pollution - CO
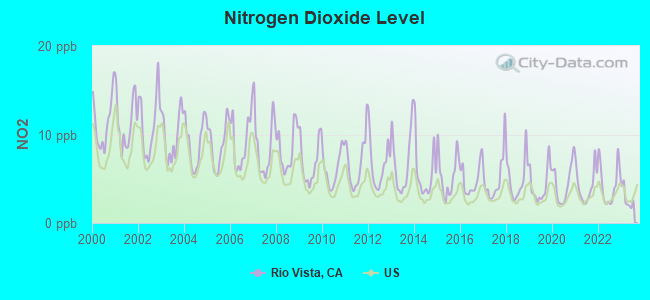
Air pollution - NO2
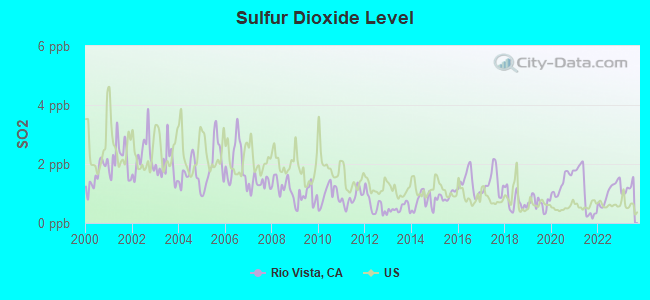
Air pollution - SO2
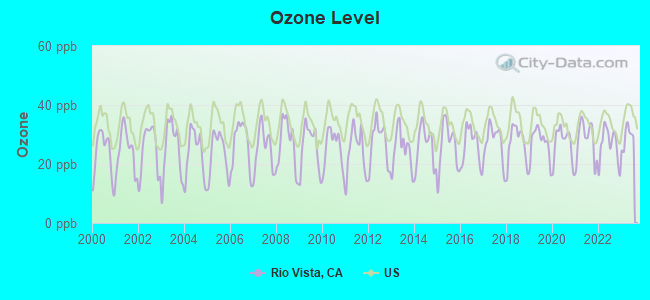
Air pollution - Ozone
Air pollution - PM10
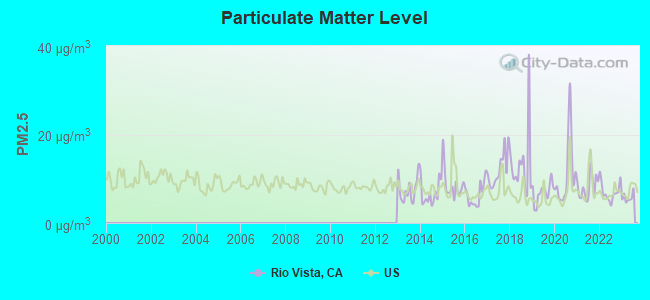
Air pollution - PM25
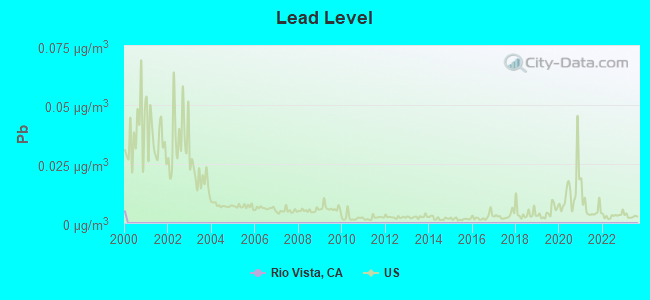
Air pollution - Pb
Crime - Murders per 100,000 population
Crime - Rapes per 100,000 population
Crime - Robberies per 100,000 population
Crime - Assaults per 100,000 population
Crime - Burglaries per 100,000 population
Crime - Thefts per 100,000 population
Crime - Auto thefts per 100,000 population
Crime - Arson per 100,000 population
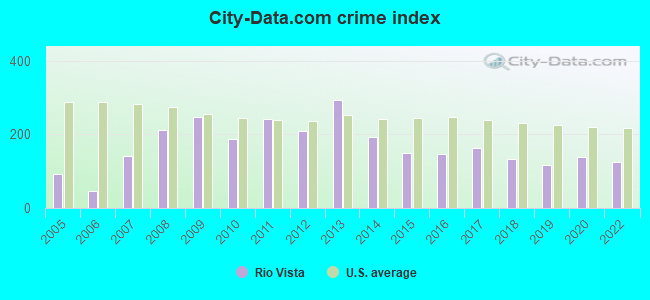
Crime - City-data.com crime index
Crime - Violent crime index
Crime - Property crime index
Crime - Murders per 100,000 population (5 year average)
Crime - Rapes per 100,000 population (5 year average)
Crime - Robberies per 100,000 population (5 year average)
Crime - Assaults per 100,000 population (5 year average)
Crime - Burglaries per 100,000 population (5 year average)
Crime - Thefts per 100,000 population (5 year average)
Crime - Auto thefts per 100,000 population (5 year average)
Crime - Arson per 100,000 population (5 year average)
Crime - City-data.com crime index (5 year average)
Crime - Violent crime index (5 year average)
Crime - Property crime index (5 year average)
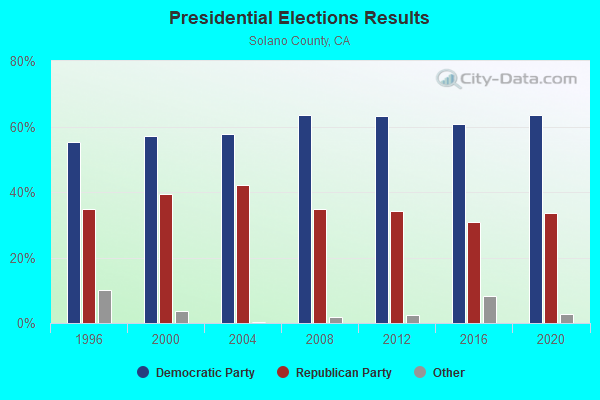
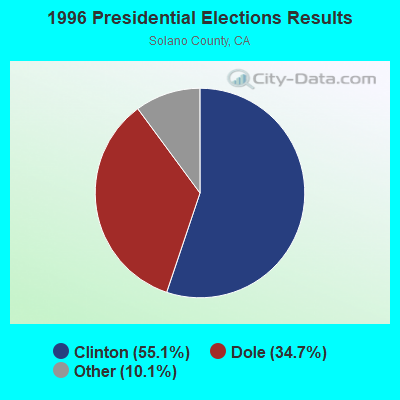
1996 Presidential Elections Results (%) - Democratic Party (Clinton)
1996 Presidential Elections Results (%) - Republican Party (Dole)
1996 Presidential Elections Results (%) - Other
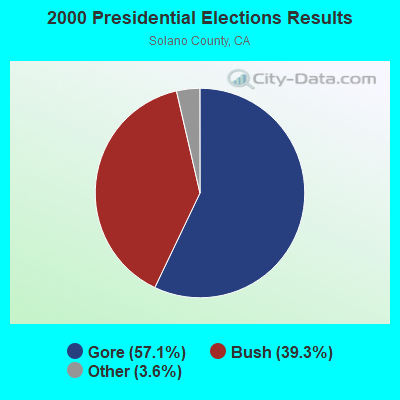
2000 Presidential Elections Results (%) - Democratic Party (Gore)
2000 Presidential Elections Results (%) - Republican Party (Bush)
2000 Presidential Elections Results (%) - Other
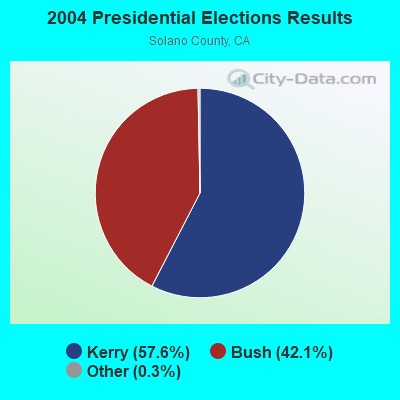
2004 Presidential Elections Results (%) - Democratic Party (Kerry)
2004 Presidential Elections Results (%) - Republican Party (Bush)
2004 Presidential Elections Results (%) - Other
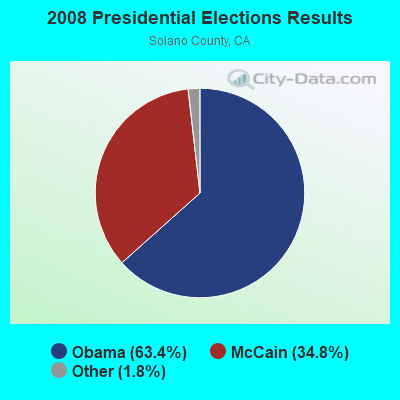
2008 Presidential Elections Results (%) - Democratic Party (Obama)
2008 Presidential Elections Results (%) - Republican Party (McCain)
2008 Presidential Elections Results (%) - Other
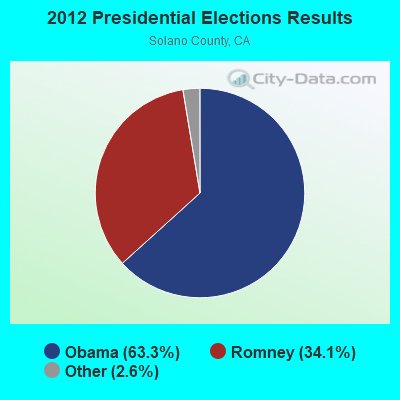
2012 Presidential Elections Results (%) - Democratic Party (Obama)
2012 Presidential Elections Results (%) - Republican Party (Romney)
2012 Presidential Elections Results (%) - Other
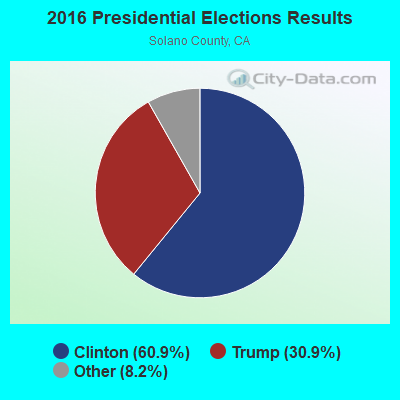
2016 Presidential Elections Results (%) - Democratic Party (Clinton)
2016 Presidential Elections Results (%) - Republican Party (Trump)
2016 Presidential Elections Results (%) - Other
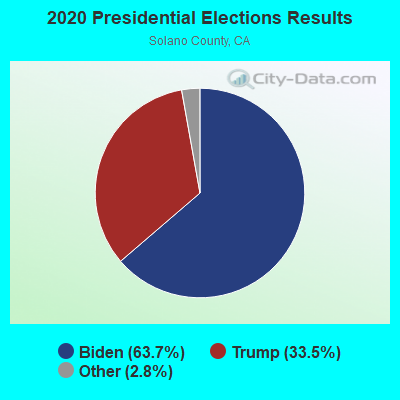
2020 Presidential Elections Results (%) - Democratic Party (Biden)
2020 Presidential Elections Results (%) - Republican Party (Trump)
2020 Presidential Elections Results (%) - Other
Ancestries Reported - Arab (%)
Ancestries Reported - Czech (%)
Ancestries Reported - Danish (%)
Ancestries Reported - Dutch (%)
Ancestries Reported - English (%)
Ancestries Reported - French (%)
Ancestries Reported - French Canadian (%)
Ancestries Reported - German (%)
Ancestries Reported - Greek (%)
Ancestries Reported - Hungarian (%)
Ancestries Reported - Irish (%)
Ancestries Reported - Italian (%)
Ancestries Reported - Lithuanian (%)
Ancestries Reported - Norwegian (%)
Ancestries Reported - Polish (%)
Ancestries Reported - Portuguese (%)
Ancestries Reported - Russian (%)
Ancestries Reported - Scotch-Irish (%)
Ancestries Reported - Scottish (%)
Ancestries Reported - Slovak (%)
Ancestries Reported - Subsaharan African (%)
Ancestries Reported - Swedish (%)
Ancestries Reported - Swiss (%)
Ancestries Reported - Ukrainian (%)
Ancestries Reported - United States (%)
Ancestries Reported - Welsh (%)
Ancestries Reported - West Indian (%)
Ancestries Reported - Other (%)
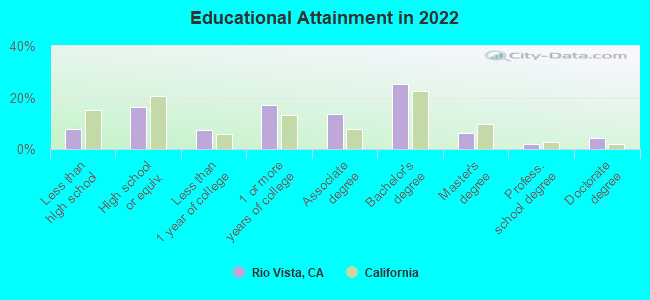
Educational Attainment - No schooling completed (%)
Educational Attainment - Less than high school (%)
Educational Attainment - High school or equivalent (%)
Educational Attainment - Less than 1 year of college (%)
Educational Attainment - 1 or more years of college (%)
Educational Attainment - Associate degree (%)
Educational Attainment - Bachelor's degree (%)
Educational Attainment - Master's degree (%)
Educational Attainment - Professional school degree (%)
Educational Attainment - Doctorate degree (%)
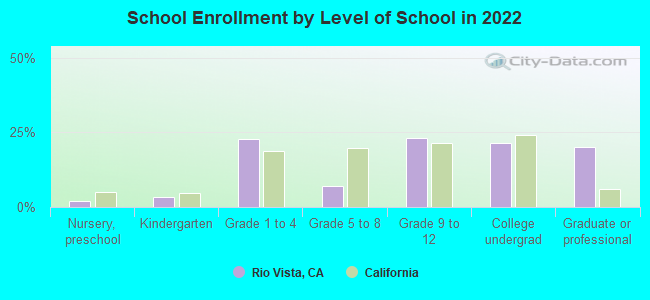
School Enrollment - Nursery, preschool (%)
School Enrollment - Kindergarten (%)
School Enrollment - Grade 1 to 4 (%)
School Enrollment - Grade 5 to 8 (%)
School Enrollment - Grade 9 to 12 (%)
School Enrollment - College undergrad (%)
School Enrollment - Graduate or professional (%)
School Enrollment - Not enrolled in school (%)
School enrollment - Public schools (%)
School enrollment - Private schools (%)
School enrollment - Not enrolled (%)
Median number of rooms in houses and condos
Median number of rooms in apartments
Housing units lacking complete plumbing facilities (%)
Housing units lacking complete kitchen facilities (%)
Density of houses
Urban houses (%)
Rural houses (%)
Households with people 60 years and over (%)
Households with people 65 years and over (%)
Households with people 75 years and over (%)
Households with one or more nonrelatives (%)
Households with no nonrelatives (%)
Population in households (%)
Family households (%)
Nonfamily households (%)
Population in families (%)
Family households with own children (%)
Median number of bedrooms in owner occupied houses
Mean number of bedrooms in owner occupied houses
Median number of bedrooms in renter occupied houses
Mean number of bedrooms in renter occupied houses
Median number of vehichles in owner occupied houses
Mean number of vehichles in owner occupied houses
Median number of vehichles in renter occupied houses
Mean number of vehichles in renter occupied houses
Mortgage status - with mortgage (%)
Mortgage status - with second mortgage (%)
Mortgage status - with home equity loan (%)
Mortgage status - with both second mortgage and home equity loan (%)
Mortgage status - without a mortgage (%)
Average family size
Average family size - White
Average family size - Black or African American
Average family size - Asian
Average family size - Hispanic or Latino
Average family size - American Indian and Alaska Native
Average family size - Multirace
Average family size - Other Race
Geographical mobility - Same house 1 year ago (%)
Geographical mobility - Moved within same county (%)
Geographical mobility - Moved from different county within same state (%)
Geographical mobility - Moved from different state (%)
Geographical mobility - Moved from abroad (%)
Place of birth - Born in state of residence (%)
Place of birth - Born in other state (%)
Place of birth - Native, outside of US (%)
Place of birth - Foreign born (%)
Housing units in structures - 1, detached (%)
Housing units in structures - 1, attached (%)
Housing units in structures - 2 (%)
Housing units in structures - 3 or 4 (%)
Housing units in structures - 5 to 9 (%)
Housing units in structures - 10 to 19 (%)
Housing units in structures - 20 to 49 (%)
Housing units in structures - 50 or more (%)
Housing units in structures - Mobile home (%)
Housing units in structures - Boat, RV, van, etc. (%)
House/condo owner moved in on average (years ago)
Renter moved in on average (years ago)
Year householder moved into unit - Moved in 1999 to March 2000 (%)
Year householder moved into unit - Moved in 1995 to 1998 (%)
Year householder moved into unit - Moved in 1990 to 1994 (%)
Year householder moved into unit - Moved in 1980 to 1989 (%)
Year householder moved into unit - Moved in 1970 to 1979 (%)
Year householder moved into unit - Moved in 1969 or earlier (%)
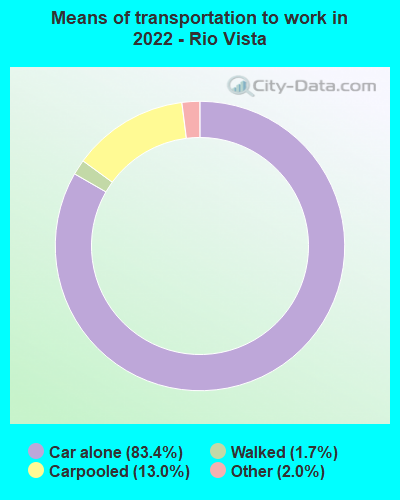
Means of transportation to work - Drove car alone (%)
Means of transportation to work - Carpooled (%)
Means of transportation to work - Public transportation (%)
Means of transportation to work - Bus or trolley bus (%)
Means of transportation to work - Streetcar or trolley car (%)
Means of transportation to work - Subway or elevated (%)
Means of transportation to work - Railroad (%)
Means of transportation to work - Ferryboat (%)
Means of transportation to work - Taxicab (%)
Means of transportation to work - Motorcycle (%)
Means of transportation to work - Bicycle (%)
Means of transportation to work - Walked (%)
Means of transportation to work - Other means (%)
Working at home (%)
Industry diversity
Most Common Industries - Agriculture, forestry, fishing and hunting, and mining (%)
Most Common Industries - Agriculture, forestry, fishing and hunting (%)
Most Common Industries - Mining, quarrying, and oil and gas extraction (%)
Most Common Industries - Construction (%)
Most Common Industries - Manufacturing (%)
Most Common Industries - Wholesale trade (%)
Most Common Industries - Retail trade (%)
Most Common Industries - Transportation and warehousing, and utilities (%)
Most Common Industries - Transportation and warehousing (%)
Most Common Industries - Utilities (%)
Most Common Industries - Information (%)
Most Common Industries - Finance and insurance, and real estate and rental and leasing (%)
Most Common Industries - Finance and insurance (%)
Most Common Industries - Real estate and rental and leasing (%)
Most Common Industries - Professional, scientific, and management, and administrative and waste management services (%)
Most Common Industries - Professional, scientific, and technical services (%)
Most Common Industries - Management of companies and enterprises (%)
Most Common Industries - Administrative and support and waste management services (%)
Most Common Industries - Educational services, and health care and social assistance (%)
Most Common Industries - Educational services (%)
Most Common Industries - Health care and social assistance (%)
Most Common Industries - Arts, entertainment, and recreation, and accommodation and food services (%)
Most Common Industries - Arts, entertainment, and recreation (%)
Most Common Industries - Accommodation and food services (%)
Most Common Industries - Other services, except public administration (%)
Most Common Industries - Public administration (%)
Occupation diversity
Most Common Occupations - Management, business, science, and arts occupations (%)
Most Common Occupations - Management, business, and financial occupations (%)
Most Common Occupations - Management occupations (%)
Most Common Occupations - Business and financial operations occupations (%)
Most Common Occupations - Computer, engineering, and science occupations (%)
Most Common Occupations - Computer and mathematical occupations (%)
Most Common Occupations - Architecture and engineering occupations (%)
Most Common Occupations - Life, physical, and social science occupations (%)
Most Common Occupations - Education, legal, community service, arts, and media occupations (%)
Most Common Occupations - Community and social service occupations (%)
Most Common Occupations - Legal occupations (%)
Most Common Occupations - Education, training, and library occupations (%)
Most Common Occupations - Arts, design, entertainment, sports, and media occupations (%)
Most Common Occupations - Healthcare practitioners and technical occupations (%)
Most Common Occupations - Health diagnosing and treating practitioners and other technical occupations (%)
Most Common Occupations - Health technologists and technicians (%)
Most Common Occupations - Service occupations (%)
Most Common Occupations - Healthcare support occupations (%)
Most Common Occupations - Protective service occupations (%)
Most Common Occupations - Fire fighting and prevention, and other protective service workers including supervisors (%)
Most Common Occupations - Law enforcement workers including supervisors (%)
Most Common Occupations - Food preparation and serving related occupations (%)
Most Common Occupations - Building and grounds cleaning and maintenance occupations (%)
Most Common Occupations - Personal care and service occupations (%)
Most Common Occupations - Sales and office occupations (%)
Most Common Occupations - Sales and related occupations (%)
Most Common Occupations - Office and administrative support occupations (%)
Most Common Occupations - Natural resources, construction, and maintenance occupations (%)
Most Common Occupations - Farming, fishing, and forestry occupations (%)
Most Common Occupations - Construction and extraction occupations (%)
Most Common Occupations - Installation, maintenance, and repair occupations (%)
Most Common Occupations - Production, transportation, and material moving occupations (%)
Most Common Occupations - Production occupations (%)
Most Common Occupations - Transportation occupations (%)
Most Common Occupations - Material moving occupations (%)
People in Group quarters - Institutionalized population (%)
People in Group quarters - Correctional institutions (%)
People in Group quarters - Federal prisons and detention centers (%)
People in Group quarters - Halfway houses (%)
People in Group quarters - Local jails and other confinement facilities (including police lockups) (%)
People in Group quarters - Military disciplinary barracks (%)
People in Group quarters - State prisons (%)
People in Group quarters - Other types of correctional institutions (%)
People in Group quarters - Nursing homes (%)
People in Group quarters - Hospitals/wards, hospices, and schools for the handicapped (%)
People in Group quarters - Hospitals/wards and hospices for chronically ill (%)
People in Group quarters - Hospices or homes for chronically ill (%)
People in Group quarters - Military hospitals or wards for chronically ill (%)
People in Group quarters - Other hospitals or wards for chronically ill (%)
People in Group quarters - Hospitals or wards for drug/alcohol abuse (%)
People in Group quarters - Mental (Psychiatric) hospitals or wards (%)
People in Group quarters - Schools, hospitals, or wards for the mentally retarded (%)
People in Group quarters - Schools, hospitals, or wards for the physically handicapped (%)
People in Group quarters - Institutions for the deaf (%)
People in Group quarters - Institutions for the blind (%)
People in Group quarters - Orthopedic wards and institutions for the physically handicapped (%)
People in Group quarters - Wards in general hospitals for patients who have no usual home elsewhere (%)
People in Group quarters - Wards in military hospitals for patients who have no usual home elsewhere (%)
People in Group quarters - Juvenile institutions (%)
People in Group quarters - Long-term care (%)
People in Group quarters - Homes for abused, dependent, and neglected children (%)
People in Group quarters - Residential treatment centers for emotionally disturbed children (%)
People in Group quarters - Training schools for juvenile delinquents (%)
People in Group quarters - Short-term care, detention or diagnostic centers for delinquent children (%)
People in Group quarters - Type of juvenile institution unknown (%)
People in Group quarters - Noninstitutionalized population (%)
People in Group quarters - College dormitories (includes college quarters off campus) (%)
People in Group quarters - Military quarters (%)
People in Group quarters - On base (%)
People in Group quarters - Barracks, unaccompanied personnel housing (UPH), (Enlisted/Officer), ;and similar group living quarters for military personnel (%)
People in Group quarters - Transient quarters for temporary residents (%)
People in Group quarters - Military ships (%)
People in Group quarters - Group homes (%)
People in Group quarters - Homes or halfway houses for drug/alcohol abuse (%)
People in Group quarters - Homes for the mentally ill (%)
People in Group quarters - Homes for the mentally retarded (%)
People in Group quarters - Homes for the physically handicapped (%)
People in Group quarters - Other group homes (%)
People in Group quarters - Religious group quarters (%)
People in Group quarters - Dormitories (%)
People in Group quarters - Agriculture workers' dormitories on farms (%)
People in Group quarters - Job Corps and vocational training facilities (%)
People in Group quarters - Other workers' dormitories (%)
People in Group quarters - Crews of maritime vessels (%)
People in Group quarters - Other nonhousehold living situations (%)
People in Group quarters - Other noninstitutional group quarters (%)
Residents speaking English at home (%)
Residents speaking English at home - Born in the United States (%)
Residents speaking English at home - Native, born elsewhere (%)
Residents speaking English at home - Foreign born (%)
Residents speaking Spanish at home (%)
Residents speaking Spanish at home - Born in the United States (%)
Residents speaking Spanish at home - Native, born elsewhere (%)
Residents speaking Spanish at home - Foreign born (%)
Residents speaking other language at home (%)
Residents speaking other language at home - Born in the United States (%)
Residents speaking other language at home - Native, born elsewhere (%)
Residents speaking other language at home - Foreign born (%)
Class of Workers - Employee of private company (%)
Class of Workers - Self-employed in own incorporated business (%)
Class of Workers - Private not-for-profit wage and salary workers (%)
Class of Workers - Local government workers (%)
Class of Workers - State government workers (%)
Class of Workers - Federal government workers (%)
Class of Workers - Self-employed workers in own not incorporated business and Unpaid family workers (%)
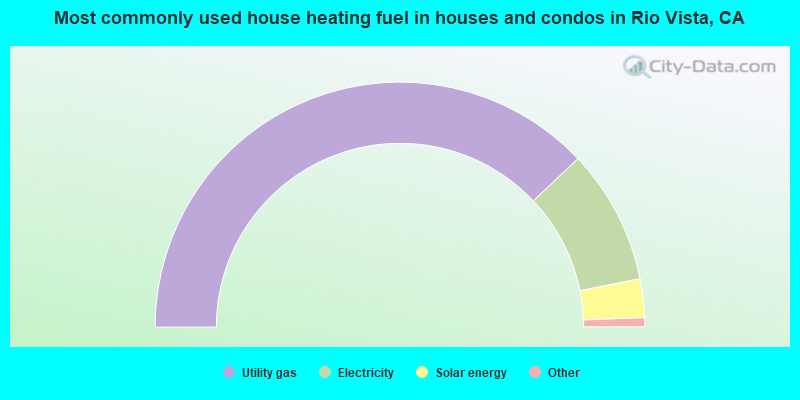
House heating fuel used in houses and condos - Utility gas (%)
House heating fuel used in houses and condos - Bottled, tank, or LP gas (%)
House heating fuel used in houses and condos - Electricity (%)
House heating fuel used in houses and condos - Fuel oil, kerosene, etc. (%)
House heating fuel used in houses and condos - Coal or coke (%)
House heating fuel used in houses and condos - Wood (%)
House heating fuel used in houses and condos - Solar energy (%)
House heating fuel used in houses and condos - Other fuel (%)
House heating fuel used in houses and condos - No fuel used (%)
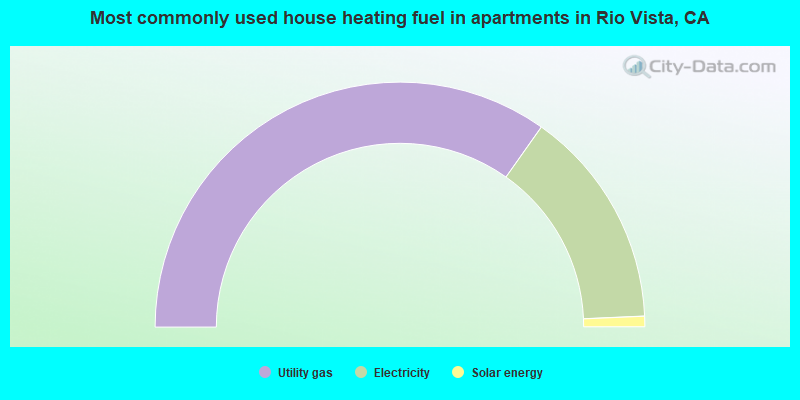
House heating fuel used in apartments - Utility gas (%)
House heating fuel used in apartments - Bottled, tank, or LP gas (%)
House heating fuel used in apartments - Electricity (%)
House heating fuel used in apartments - Fuel oil, kerosene, etc. (%)
House heating fuel used in apartments - Coal or coke (%)
House heating fuel used in apartments - Wood (%)
House heating fuel used in apartments - Solar energy (%)
House heating fuel used in apartments - Other fuel (%)
House heating fuel used in apartments - No fuel used (%)
Armed forces status - In Armed Forces (%)
Armed forces status - Civilian (%)
Armed forces status - Civilian - Veteran (%)
Armed forces status - Civilian - Nonveteran (%)
Fatal accidents locations in years 2005-2021
Fatal accidents locations in 2005
Fatal accidents locations in 2006
Fatal accidents locations in 2007
Fatal accidents locations in 2008
Fatal accidents locations in 2009
Fatal accidents locations in 2010
Fatal accidents locations in 2011
Fatal accidents locations in 2012
Fatal accidents locations in 2013
Fatal accidents locations in 2014
Fatal accidents locations in 2015
Fatal accidents locations in 2016
Fatal accidents locations in 2017
Fatal accidents locations in 2018
Fatal accidents locations in 2019
Fatal accidents locations in 2020
Fatal accidents locations in 2021
Alcohol use - People drinking some alcohol every month (%)
Alcohol use - People not drinking at all (%)
Alcohol use - Average days/month drinking alcohol
Alcohol use - Average drinks/week
Alcohol use - Average days/year people drink much
Audiometry - Average condition of hearing (%)
Audiometry - People that can hear a whisper from across a quiet room (%)
Audiometry - People that can hear normal voice from across a quiet room (%)
Audiometry - Ears ringing, roaring, buzzing (%)
Audiometry - Had a job exposure to loud noise (%)
Audiometry - Had off-work exposure to loud noise (%)
Blood Pressure & Cholesterol - Has high blood pressure (%)
Blood Pressure & Cholesterol - Checking blood pressure at home (%)
Blood Pressure & Cholesterol - Frequently checking blood cholesterol (%)
Blood Pressure & Cholesterol - Has high cholesterol level (%)
Consumer Behavior - Money monthly spent on food at supermarket/grocery store
Consumer Behavior - Money monthly spent on food at other stores
Consumer Behavior - Money monthly spent on eating out
Consumer Behavior - Money monthly spent on carryout/delivered foods
Consumer Behavior - Income spent on food at supermarket/grocery store (%)
Consumer Behavior - Income spent on food at other stores (%)
Consumer Behavior - Income spent on eating out (%)
Consumer Behavior - Income spent on carryout/delivered foods (%)
Current Health Status - General health condition (%)
Current Health Status - Blood donors (%)
Current Health Status - Has blood ever tested for HIV virus (%)
Current Health Status - Left-handed people (%)
Dermatology - People using sunscreen (%)
Diabetes - Diabetics (%)
Diabetes - Had a blood test for high blood sugar (%)
Diabetes - People taking insulin (%)
Diet Behavior & Nutrition - Diet health (%)
Diet Behavior & Nutrition - Milk product consumption (# of products/month)
Diet Behavior & Nutrition - Meals not home prepared (#/week)
Diet Behavior & Nutrition - Meals from fast food or pizza place (#/week)
Diet Behavior & Nutrition - Ready-to-eat foods (#/month)
Diet Behavior & Nutrition - Frozen meals/pizza (#/month)
Drug Use - People that ever used marijuana or hashish (%)
Drug Use - Ever used hard drugs (%)
Drug Use - Ever used any form of cocaine (%)
Drug Use - Ever used heroin (%)
Drug Use - Ever used methamphetamine (%)
Health Insurance - People covered by health insurance (%)
Kidney Conditions-Urology - Avg. # of times urinating at night
Medical Conditions - People with asthma (%)
Medical Conditions - People with anemia (%)
Medical Conditions - People with psoriasis (%)
Medical Conditions - People with overweight (%)
Medical Conditions - Elderly people having difficulties in thinking or remembering (%)
Medical Conditions - People who ever received blood transfusion (%)
Medical Conditions - People having trouble seeing even with glass/contacts (%)
Medical Conditions - People with arthritis (%)
Medical Conditions - People with gout (%)
Medical Conditions - People with congestive heart failure (%)
Medical Conditions - People with coronary heart disease (%)
Medical Conditions - People with angina pectoris (%)
Medical Conditions - People who ever had heart attack (%)
Medical Conditions - People who ever had stroke (%)
Medical Conditions - People with emphysema (%)
Medical Conditions - People with thyroid problem (%)
Medical Conditions - People with chronic bronchitis (%)
Medical Conditions - People with any liver condition (%)
Medical Conditions - People who ever had cancer or malignancy (%)
Mental Health - People who have little interest in doing things (%)
Mental Health - People feeling down, depressed, or hopeless (%)
Mental Health - People who have trouble sleeping or sleeping too much (%)
Mental Health - People feeling tired or having little energy (%)
Mental Health - People with poor appetite or overeating (%)
Mental Health - People feeling bad about themself (%)
Mental Health - People who have trouble concentrating on things (%)
Mental Health - People moving or speaking slowly or too fast (%)
Mental Health - People having thoughts they would be better off dead (%)
Oral Health - Average years since last visit a dentist
Oral Health - People embarrassed because of mouth (%)
Oral Health - People with gum disease (%)
Oral Health - General health of teeth and gums (%)
Oral Health - Average days a week using dental floss/device
Oral Health - Average days a week using mouthwash for dental problem
Oral Health - Average number of teeth
Pesticide Use - Households using pesticides to control insects (%)
Pesticide Use - Households using pesticides to kill weeds (%)
Physical Activity - People doing vigorous-intensity work activities (%)
Physical Activity - People doing moderate-intensity work activities (%)
Physical Activity - People walking or bicycling (%)
Physical Activity - People doing vigorous-intensity recreational activities (%)
Physical Activity - People doing moderate-intensity recreational activities (%)
Physical Activity - Average hours a day doing sedentary activities
Physical Activity - Average hours a day watching TV or videos
Physical Activity - Average hours a day using computer
Physical Functioning - People having limitations keeping them from working (%)
Physical Functioning - People limited in amount of work they can do (%)
Physical Functioning - People that need special equipment to walk (%)
Physical Functioning - People experiencing confusion/memory problems (%)
Physical Functioning - People requiring special healthcare equipment (%)
Prescription Medications - Average number of prescription medicines taking
Preventive Aspirin Use - Adults 40+ taking low-dose aspirin (%)
Reproductive Health - Vaginal deliveries (%)
Reproductive Health - Cesarean deliveries (%)
Reproductive Health - Deliveries resulted in a live birth (%)
Reproductive Health - Pregnancies resulted in a delivery (%)
Reproductive Health - Women breastfeeding newborns (%)
Reproductive Health - Women that had a hysterectomy (%)
Reproductive Health - Women that had both ovaries removed (%)
Reproductive Health - Women that have ever taken birth control pills (%)
Reproductive Health - Women taking birth control pills (%)
Reproductive Health - Women that have ever used Depo-Provera or injectables (%)
Reproductive Health - Women that have ever used female hormones (%)
Sexual Behavior - People 18+ that ever had sex (vaginal, anal, or oral) (%)
Sexual Behavior - Males 18+ that ever had vaginal sex with a woman (%)
Sexual Behavior - Males 18+ that ever performed oral sex on a woman (%)
Sexual Behavior - Males 18+ that ever had anal sex with a woman (%)
Sexual Behavior - Males 18+ that ever had any sex with a man (%)
Sexual Behavior - Females 18+ that ever had vaginal sex with a man (%)
Sexual Behavior - Females 18+ that ever performed oral sex on a man (%)
Sexual Behavior - Females 18+ that ever had anal sex with a man (%)
Sexual Behavior - Females 18+ that ever had any kind of sex with a woman (%)
Sexual Behavior - Average age people first had sex
Sexual Behavior - Average number of female sex partners in lifetime (males 18+)
Sexual Behavior - Average number of female vaginal sex partners in lifetime (males 18+)
Sexual Behavior - Average age people first performed oral sex on a woman (18+)
Sexual Behavior - Average number of woman performed oral sex on in lifetime (18+)
Sexual Behavior - Average number of male sex partners in lifetime (males 18+)
Sexual Behavior - Average number of male anal sex partners in lifetime (males 18+)
Sexual Behavior - Average age people first performed oral sex on a man (18+)
Sexual Behavior - Average number of male oral sex partners in lifetime (18+)
Sexual Behavior - People using protection when performing oral sex (%)
Sexual Behavior - Average number of times people have vaginal or anal sex a year
Sexual Behavior - People having sex without condom (%)
Sexual Behavior - Average number of male sex partners in lifetime (females 18+)
Sexual Behavior - Average number of male vaginal sex partners in lifetime (females 18+)
Sexual Behavior - Average number of female sex partners in lifetime (females 18+)
Sexual Behavior - Circumcised males 18+ (%)
Sleep Disorders - Average hours sleeping at night
Sleep Disorders - People that has trouble sleeping (%)
Smoking-Cigarette Use - People smoking cigarettes (%)
Taste & Smell - People 40+ having problems with smell (%)
Taste & Smell - People 40+ having problems with taste (%)
Taste & Smell - People 40+ that ever had wisdom teeth removed (%)
Taste & Smell - People 40+ that ever had tonsils teeth removed (%)
Taste & Smell - People 40+ that ever had a loss of consciousness because of a head injury (%)
Taste & Smell - People 40+ that ever had a broken nose or other serious injury to face or skull (%)
Taste & Smell - People 40+ that ever had two or more sinus infections (%)
Weight - Average height (inches)
Weight - Average weight (pounds)
Weight - Average BMI
Weight - People that are obese (%)
Weight - People that ever were obese (%)
Weight - People trying to lose weight (%)
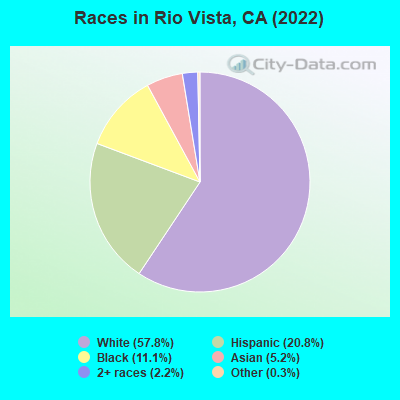
5,798 57.8% White alone 2,085 20.8% Hispanic 1,110 11.1% Black alone 521 5.2% Asian alone 220 2.2% Two or more races 27 0.3% Other race alone
According to our research of California and other state lists, there were 12 registered sex offenders living in Rio Vista, California as of April 18, 2024 . The ratio of all residents to sex offenders in Rio Vista is 688 to 1.The ratio of registered sex offenders to all residents in this city is near the state average.
Officers per 1,000 residents here:
1.17California average:
2.30
Latest news from Rio Vista, CA collected exclusively by city-data.com from local newspapers, TV, and radio stations
Ancestries: Irish (9.6%), English (8.8%), Portuguese (6.0%), German (5.4%), American (3.9%), European (3.8%).
Current Local Time:
Land area: 6.75 square miles.
Population density: 1,536 people per square mile (low).
1,020 residents are foreign born (6.4% Latin America , 2.9% Asia ).
This city:
10.2%California:
26.5%
Median real estate property taxes paid for housing units with mortgages in 2022: $4,505 (0.9%)Median real estate property taxes paid for housing units with no mortgage in 2022: $4,475 (0.9%)
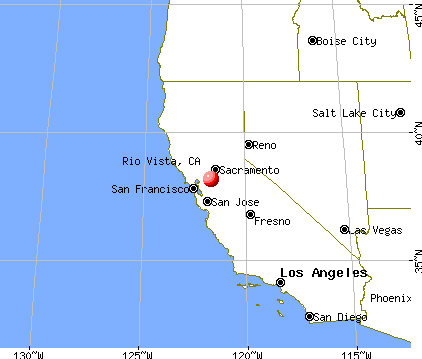
Nearest city with pop. 50,000+: Antioch, CA
Nearest city with pop. 200,000+: Stockton, CA
Nearest city with pop. 1,000,000+: Los Angeles, CA
Nearest cities:
Latitude: 38.16 N, Longitude: 121.70 W
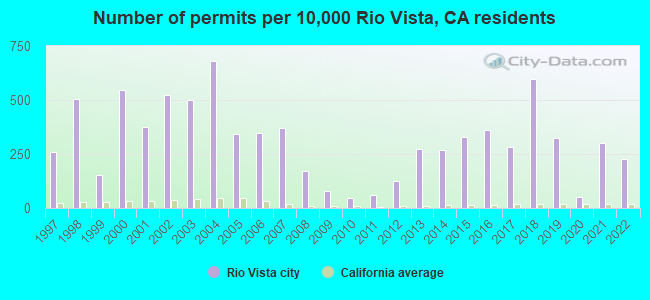
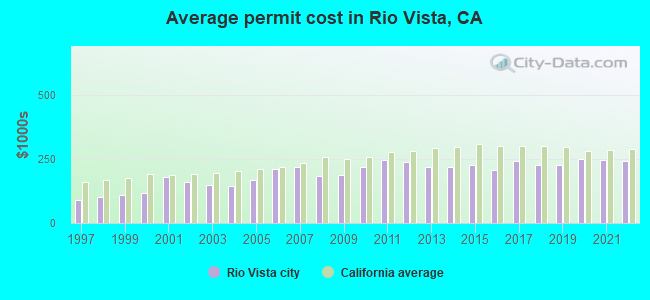
Single-family new house construction building permits:
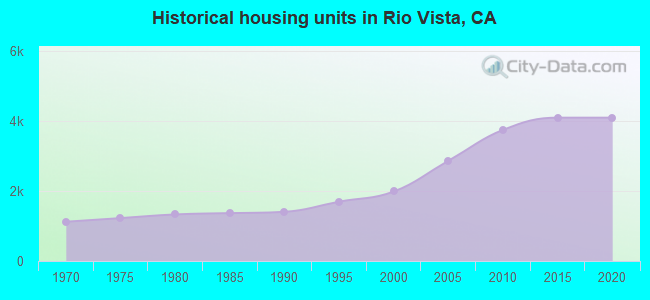
2022: 103 buildings , average cost: $240,9002021: 137 buildings , average cost: $248,1002020: 24 buildings , average cost: $248,9002019: 149 buildings , average cost: $227,1002018: 274 buildings , average cost: $228,9002017: 130 buildings , average cost: $240,6002016: 166 buildings , average cost: $206,9002015: 151 buildings , average cost: $225,7002014: 123 buildings , average cost: $218,8002013: 125 buildings , average cost: $218,6002012: 58 buildings , average cost: $237,4002011: 28 buildings , average cost: $246,8002010: 20 buildings , average cost: $218,7002009: 35 buildings , average cost: $189,4002008: 79 buildings , average cost: $184,1002007: 170 buildings , average cost: $217,9002006: 159 buildings , average cost: $212,8002005: 157 buildings , average cost: $166,8002004: 311 buildings , average cost: $146,0002003: 228 buildings , average cost: $149,0002002: 239 buildings , average cost: $159,4002001: 172 buildings , average cost: $181,8002000: 250 buildings , average cost: $118,7001999: 71 buildings , average cost: $108,1001998: 231 buildings , average cost: $101,2001997: 119 buildings , average cost: $89,300Unemployment in December 2023:
Population change in the 1990s: +1,040 (+29.5%).
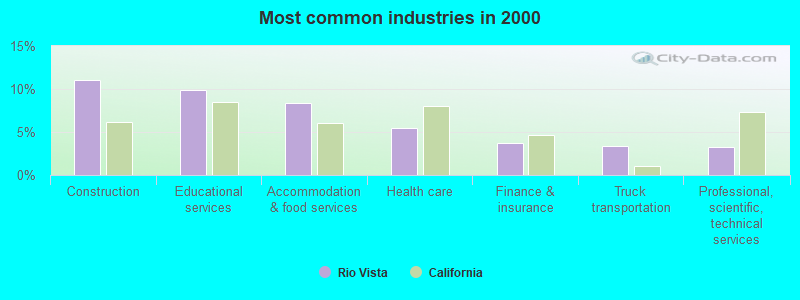
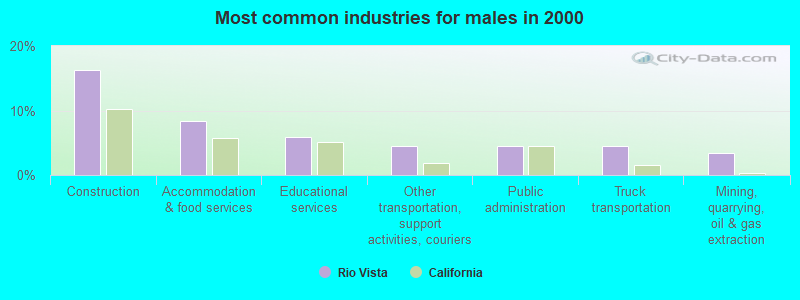
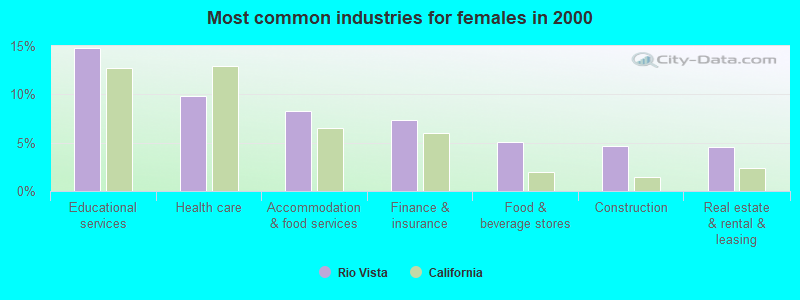
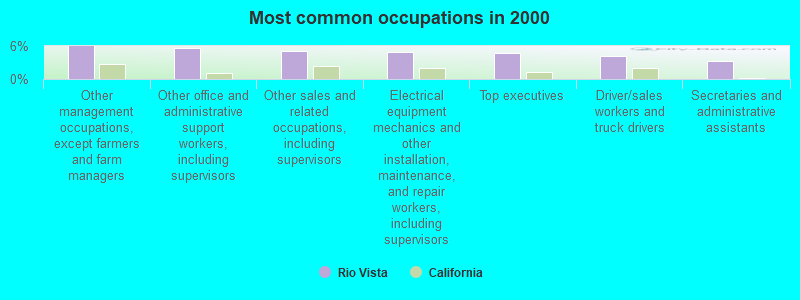
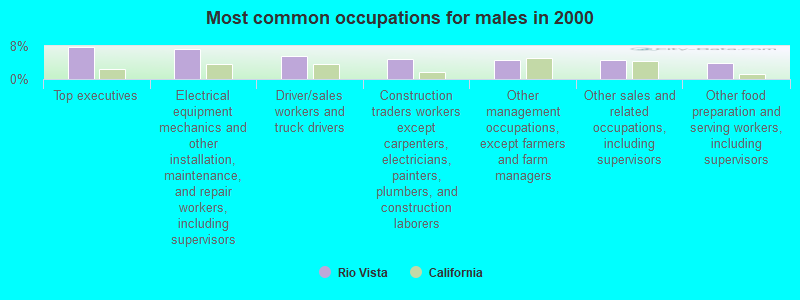
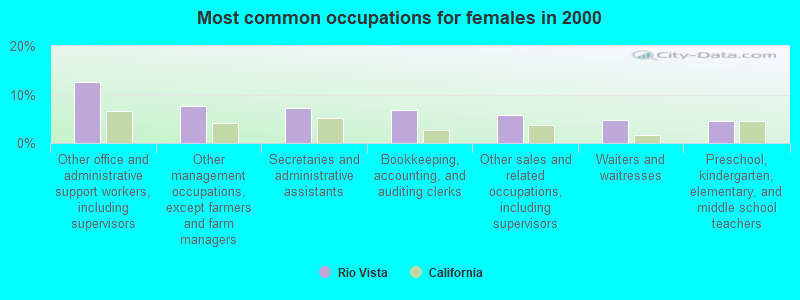
Most common occupations in Rio Vista, CA (%)
Both Males Females
Other management occupations, except farmers and farm managers (6.0%)
Other office and administrative support workers, including supervisors (5.7%)
Other sales and related occupations, including supervisors (5.0%)
Electrical equipment mechanics and other installation, maintenance, and repair workers, including supervisors (4.8%)
Top executives (4.7%)
Driver/sales workers and truck drivers (4.1%)
Secretaries and administrative assistants (3.2%)
Top executives (7.8%)
Electrical equipment mechanics and other installation, maintenance, and repair workers, including supervisors (7.3%)
Driver/sales workers and truck drivers (5.6%)
Construction traders workers except carpenters, electricians, painters, plumbers, and construction laborers (4.9%)
Other management occupations, except farmers and farm managers (4.7%)
Other sales and related occupations, including supervisors (4.5%)
Other food preparation and serving workers, including supervisors (3.9%)
Other office and administrative support workers, including supervisors (12.6%)
Other management occupations, except farmers and farm managers (7.6%)
Secretaries and administrative assistants (7.2%)
Bookkeeping, accounting, and auditing clerks (6.7%)
Other sales and related occupations, including supervisors (5.7%)
Waiters and waitresses (4.8%)
Preschool, kindergarten, elementary, and middle school teachers (4.4%)
Earthquake activity:
Rio Vista-area historical earthquake activity is significantly above California state average. It is 7808% greater than the overall U.S. average. On 4/18/1906 at 13:12:21, a magnitude 7.9 (7.9 UK, Class: Major, Intensity: VIII - XII) earthquake occurred 71.9 miles away from the city center, causing $524,000,000 total damage On 10/18/1989 at 00:04:15, a magnitude 7.1 (6.5 MB, 7.1 MS, 6.9 MW, 7.0 ML) earthquake occurred 73.0 miles away from the city center, causing 62 deaths ( 62 shaking deaths) and 3757 injuries, causing $1,305,032,704 total damage On 7/21/1952 at 11:52:14, a magnitude 7.7 (7.7 UK) earthquake occurred 265.1 miles away from Rio Vista center, causing $50,000,000 total damage On 11/4/1927 at 13:51:53, a magnitude 7.5 (7.5 UK) earthquake occurred 227.7 miles away from the city center On 1/31/1922 at 13:17:28, a magnitude 7.6 (7.6 UK) earthquake occurred 270.6 miles away from the city center On 10/3/1915 at 06:52:48, a magnitude 7.6 (7.6 UK) earthquake occurred 276.5 miles away from Rio Vista center Magnitude types: body-wave magnitude (MB), local magnitude (ML), surface-wave magnitude (MS), moment magnitude (MW) Natural disasters: The number of natural disasters in Solano County (23) is greater than the US average (15).Major Disasters (Presidential) Declared: 15Emergencies Declared: 2Floods: 13, Storms: 7, Winter Storms: 5, Fires: 4, Mudslides: 4, Landslides: 3, Earthquakes: 2, Drought: 1, Freeze: 1, Heavy Rain: 1, Hurricane: 1, Tornado: 1, Other: 1 (Note: some incidents may be assigned to more than one category). Hospitals and medical centers near Rio Vista: ANTIOCH CONVALESCENT HOSPITAL (Nursing Home, about 13 miles away; ANTIOCH, CA)
KC'S SUNSHINE HOMES, ANGELIC II (Hospital, about 14 miles away; OAKLEY, CA)
ANTIOCH DIALYSIS CENTER (Dialysis Facility, about 14 miles away; ANTIOCH, CA)
PUTNAM ICF (Hospital, about 14 miles away; ANTIOCH, CA)
PUTNAM WEST ICF (Hospital, about 14 miles away; ANTIOCH, CA)
BELLE ICF (Hospital, about 14 miles away; ANTIOCH, CA)
WINGS I (Hospital, about 14 miles away; ANTIOCH, CA)
Airports located in Rio Vista: Amtrak stations near Rio Vista: 12 miles: ANTIOCH-PITTSBURG (ANTIOCH, I ST. & SANTA FE TRACKS) Services: public payphones, full-service food facilities, free short-term parking, free long-term parking, call for taxi service, intercity bus service, public transit connection.
20 miles: SUISUN-FAIRFIELD (SUISUN, 177 MAIN ST. (UNDER HWY. 12)) Services: fully wheelchair accessible, public restrooms, free short-term parking, call for taxi service, intercity bus service.
Colleges/universities with over 2000 students nearest to Rio Vista:
Los Medanos College (about 15 miles; Pittsburg, CA ; Full-time enrollment: 5,289)
Solano Community College (about 24 miles; Fairfield, CA ; FT enrollment: 5,790)
San Joaquin Delta College (about 24 miles; Stockton, CA ; FT enrollment: 12,167)
Diablo Valley College (about 25 miles; Pleasant Hill, CA ; FT enrollment: 13,015)
University of the Pacific (about 25 miles; Stockton, CA ; FT enrollment: 4,999)
Cosumnes River College (about 25 miles; Sacramento, CA ; FT enrollment: 9,327)
University of California-Davis (about 27 miles; Davis, CA ; FT enrollment: 30,845)
Public high schools in Rio Vista: RIO VISTA HIGH Students: 249, Location: 410 S. FOURTH ST., Grades: 9-12)RIVER DELTA HIGH/ELEMENTARY (ALTERNATIVE) Location: 400 ELM WAY., Grades: KG-12)
Public elementary/middle schools in Rio Vista:
See full list of schools located in Rio Vista
Notable locations in Rio Vista: (A) , Rio Vista Public Library (B) , Rio Vista Museum (C) , Rio Vista City Hall (D) , Rio Vista Fire Department - Delta Fire Protection District Main Station (E) , Montezuma Fire Protection District Rio Vista Station (F) . Display/hide their locations on the map
Churches in Rio Vista include: (A) , The Church of Jesus Christ of Latter Day Saints (B) , Rio Vista Assembly of God Church (C) , Saint Joseph Catholic Church (D) , Union Baptist Church (E) . Display/hide their locations on the map
Parks in Rio Vista include: (1) , Bruning Park (2) . Display/hide their locations on the map
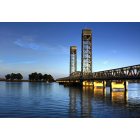
Tourist attraction:
Birthplace of: Bill Wight - Baseball player.
Solano County has a predicted average indoor radon screening level less than 2 pCi/L (pico curies per liter) - Low Potential Drinking water stations with addresses in Rio Vista and their reported violations in the past:
DUCK ISLAND RV PARK (Population served: 110, Groundwater):
Past monitoring violations:
One routine major monitoring violation
Population served: 75, Groundwater):
Past health violations:
MCL, Monthly (TCR) - In MAY-2010, Contaminant: Coliform. Follow-up actions: St AO (w/o penalty) issued (MAR-10-2010), St Compliance achieved (JUL-10-2010)
MCL, Monthly (TCR) - In APR-2010, Contaminant: Coliform. Follow-up actions: St AO (w/o penalty) issued (MAR-10-2010), St Compliance achieved (JUL-10-2010)
MCL, Monthly (TCR) - In MAR-2010, Contaminant: Coliform. Follow-up actions: St AO (w/o penalty) issued (MAR-10-2010), St Compliance achieved (JUL-10-2010)
MCL, Monthly (TCR) - In FEB-2010, Contaminant: Coliform. Follow-up actions: St AO (w/o penalty) issued (MAR-10-2010), St Compliance achieved (JUL-10-2010)
MCL, Monthly (TCR) - In JAN-2010, Contaminant: Coliform. Follow-up actions: St AO (w/o penalty) issued (MAR-10-2010), St Compliance achieved (JUL-10-2010)
MCL, Monthly (TCR) - In NOV-2009, Contaminant: Coliform. Follow-up actions: St Boil Water Order (OCT-23-2009), St Compliance achieved (JAN-10-2010), St AO (w/o penalty) issued (DEC-04-2010)
MCL, Acute (TCR) - In OCT-2009, Contaminant: Coliform. Follow-up actions: St Boil Water Order (OCT-23-2009), St Compliance achieved (JAN-10-2010), St AO (w/o penalty) issued (DEC-04-2010)
Drinking water stations with addresses in Rio Vista that have no violations reported:
RIO VIENTO RV CAMP [SWS] (Population served: 154, Primary Water Source Type: Groundwater)
HASTINGS ISLAND HUNTING PRESERVE (Population served: 100, Primary Water Source Type: Groundwater)
OUTRIGGER MARINA & CAFE LLC (Population served: 75, Primary Water Source Type: Groundwater)
Average household size: This city:
2.1 peopleCalifornia:
2.9 people
Percentage of family households: This city:
64.9%Whole state:
68.7%
Percentage of households with unmarried partners: This city:
4.9%Whole state:
7.2%
Likely homosexual households (counted as self-reported same-sex unmarried-partner households)
Lesbian couples: 0.3% of all households Gay men: 0.3% of all households
3 people in group homes intended for adults in 2010
Banks with branches in Rio Vista (2011 data):
Bank of Stockton: Rio Vista Branch at 230 Main Street, branch established on 1936/11/02. Info updated 2010/04/08: Bank assets: $2,047.8 mil, Deposits: $1,722.4 mil, headquarters in Stockton, CA, positive income , Commercial Lending Specialization, 16 total offices , Holding Company: 1867 Western Financial Corporation
Bank of Rio Vista: Bank Of Rio Vista at 101 Main Street, branch established on 1904/04/12. Info updated 2006/11/03: Bank assets: $180.1 mil, Deposits: $156.1 mil, local headquarters , positive income , Commercial Lending Specialization, 3 total offices
For population 15 years and over in Rio Vista:
Never married: 20.9%Now married: 52.7%Separated: 1.8%Widowed: 10.4%Divorced: 14.2% For population 25 years and over in Rio Vista:
High school or higher: 93.8%Bachelor's degree or higher: 37.9%Graduate or professional degree: 13.9%Unemployed: 4.4%Mean travel time to work (commute): 28.8 minutes
Education Gini index (Inequality in education) Here:
10.1California average:
15.5
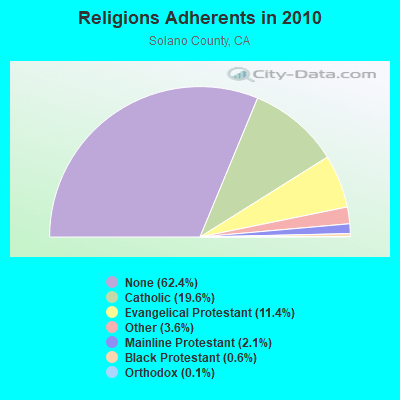
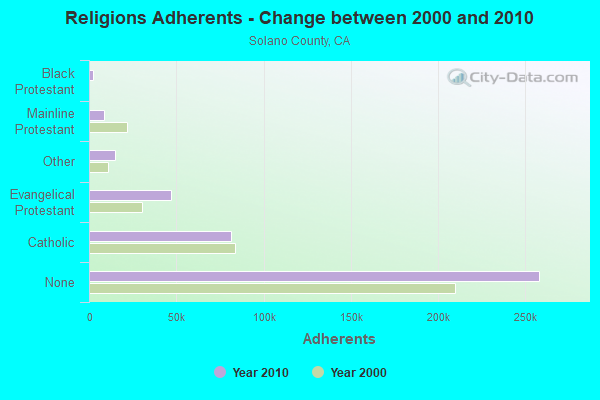
Religion statistics for Rio Vista, CA (based on Solano County data)
Religion Adherents Congregations Catholic 81,158 10 Evangelical Protestant 47,081 181 Other 15,086 45 Mainline Protestant 8,849 40 Black Protestant 2,567 16 Orthodox 566 2 None 258,037 -
Source: Clifford Grammich, Kirk Hadaway, Richard Houseal, Dale E.Jones, Alexei Krindatch, Richie Stanley and Richard H.Taylor. 2012. 2010 U.S.Religion Census: Religious Congregations & Membership Study. Association of Statisticians of American Religious Bodies. Jones, Dale E., et al. 2002. Congregations and Membership in the United States 2000. Nashville, TN: Glenmary Research Center. Graphs represent county-level data
Food Environment Statistics: Number of grocery stores : 78Here :
1.92 / 10,000 pop.State :
2.14 / 10,000 pop.
Number of supercenters and club stores : 4Here :
0.10 / 10,000 pop.California :
0.04 / 10,000 pop.
Number of convenience stores (no gas) : 21Solano County :
0.52 / 10,000 pop.State :
0.62 / 10,000 pop.
Number of convenience stores (with gas) : 91Here :
2.24 / 10,000 pop.California :
1.49 / 10,000 pop.
Number of full-service restaurants : 221Solano County :
5.43 / 10,000 pop.State :
7.42 / 10,000 pop.
Adult diabetes rate : Solano County :
9.8%California :
7.3%
Adult obesity rate : Solano County :
25.1%California :
21.3%
Low-income preschool obesity rate : Here :
17.4%California :
17.9%
Health and Nutrition: Healthy diet rate : This city:
50.6%State:
49.4%
Average overall health of teeth and gums : Rio Vista:
47.2%California:
48.0%
Average BMI : This city:
28.5California:
28.1
People feeling badly about themselves : Rio Vista:
20.9%California:
20.2%
People not drinking alcohol at all : Rio Vista:
10.6%California:
11.2%
Average hours sleeping at night : Rio Vista:
6.9California:
6.8
General health condition : Average condition of hearing : Rio Vista:
76.8%State:
80.9%
More about Health and Nutrition of Rio Vista, CA Residents
Local government employment and payroll (March 2022)
Function
Full-time employees
Monthly full-time payroll
Average yearly full-time wage
Part-time employees
Monthly part-time payroll
Firefighters
12 $85,580 $85,580 0 $0 Sewerage
10 $74,512 $89,414 0 $0 Financial Administration
5 $36,653 $87,967 0 $0 Other Government Administration
4 $18,563 $55,689 0 $0 Parks and Recreation
2 $9,727 $58,362 0 $0 Streets and Highways
2 $5,059 $30,354 0 $0 Police - Other
1 $7,744 $92,928 2 $4,075
Totals for Government
36 $237,837 $79,279 2 $4,075
Rio Vista government finances - Expenditure in 2017 (per resident):
Construction - Regular Highways: $317,000 ($30.55)
Local Fire Protection: $185,000 ($17.83)Transit Utilities: $139,000 ($13.40)Parks and Recreation: $115,000 ($11.08)Current Operations - Sewerage: $3,081,000 ($296.96)
Police Protection: $2,206,000 ($212.63)Local Fire Protection: $1,925,000 ($185.54)Water Utilities: $1,378,000 ($132.82)Central Staff Services: $1,203,000 ($115.95)Transit Utilities: $919,000 ($88.58)Regular Highways: $461,000 ($44.43)Parks and Recreation: $349,000 ($33.64)Air Transportation: $327,000 ($31.52)Protective Inspection and Regulation - Other: $238,000 ($22.94)Solid Waste Management: $133,000 ($12.82)Housing and Community Development: $78,000 ($7.52)General - Other: $51,000 ($4.92)Health - Other: $46,000 ($4.43)Libraries: $7,000 ($0.67)General - Interest on Debt: $51,000 ($4.92)
Intergovernmental to Local - Other - Regular Highways: $145,000 ($13.98)
Other - Police Protection: $130,000 ($12.53)Other Capital Outlay - Central Staff Services: $127,000 ($12.24)
Local Fire Protection: $107,000 ($10.31)Air Transportation: $8,000 ($0.77)Total Salaries and Wages: $10,000 ($0.96)
Water Utilities - Interest on Debt: $88,000 ($8.48)
Rio Vista government finances - Revenue in 2017 (per resident):
Charges - Sewerage: $4,578,000 ($441.25)
Other: $1,173,000 ($113.06)Solid Waste Management: $305,000 ($29.40)Air Transportation: $188,000 ($18.12)Parks and Recreation: $57,000 ($5.49)Federal Intergovernmental - Transit Utilities: $405,000 ($39.04)
Other: $302,000 ($29.11)Air Transportation: $151,000 ($14.55)Housing and Community Development: $23,000 ($2.22)Local Intergovernmental - Transit Utilities: $253,000 ($24.39)
Miscellaneous - Interest Earnings: $130,000 ($12.53)
Rents: $78,000 ($7.52)General Revenue - Other: $44,000 ($4.24)Royalties: $40,000 ($3.86)Fines and Forfeits: $38,000 ($3.66)Donations From Private Sources: $14,000 ($1.35)Revenue - Water Utilities: $2,737,000 ($263.81)
Transit Utilities: $52,000 ($5.01)State Intergovernmental - Other: $420,000 ($40.48)
Highways: $171,000 ($16.48)Transit Utilities: $65,000 ($6.27)General Local Government Support: $13,000 ($1.25)Tax - Property: $2,738,000 ($263.90)
General Sales and Gross Receipts: $2,249,000 ($216.77)Other License: $595,000 ($57.35)Public Utilities Sales: $130,000 ($12.53)Documentary and Stock Transfer: $89,000 ($8.58)Occupation and Business License - Other: $52,000 ($5.01)Other: $44,000 ($4.24)Other Selective Sales: $19,000 ($1.83)
Rio Vista government finances - Debt in 2017 (per resident):
Long Term Debt - Beginning Outstanding - Unspecified Public Purpose: $5,476,000 ($527.81)
Outstanding Unspecified Public Purpose: $5,059,000 ($487.61)Retired Unspecified Public Purpose: $417,000 ($40.19)
Rio Vista government finances - Cash and Securities in 2017 (per resident):
Bond Funds - Cash and Securities: $5,291,000 ($509.98)
Other Funds - Cash and Securities: $19,994,000 ($1927.13)
Sinking Funds - Cash and Securities: $64,000 ($6.17)
6.92% of this county's 2021 resident taxpayers lived in other counties in 2020 ($66,832 average adjusted gross income )
Here:
6.92%California average:
5.19%
0.10% of residents moved from foreign countries ($924 average AGI )Solano County:
0.10%California average:
0.03%
Top counties from which taxpayers relocated into this county between 2020 and 2021:
7.45% of this county's 2020 resident taxpayers moved to other counties in 2021 ($71,700 average adjusted gross income )
Here:
7.45%California average:
6.14%
0.08% of residents moved to foreign countries ($756 average AGI )Solano County:
0.08%California average:
0.02%
Top counties to which taxpayers relocated from this county between 2020 and 2021:
Businesses in Rio Vista, CA
Name Count Name Count
Ace Hardware 1 McDonald's 1 Chevrolet 1 RadioShack 1 FedEx 1 Taco Bell 1 Ford 1 U-Haul 1 KFC 1 UPS 1
Strongest AM radio stations in Rio Vista:
KATD (990 AM; 10 kW; PITTSBURG, CA; Owner: RADIO UNICA OF SACRAMENTO LICENSE CORP.)
KHTK (1140 AM; 50 kW; SACRAMENTO, CA; Owner: INFINITY RADIO SUBSIDIARY OPERATIONS INC.)
KSTE (650 AM; 25 kW; RANCHO CORDOVA, CA; Owner: AMFM RADIO LICENSES, L.L.C.)
KTRB (860 AM; 50 kW; MODESTO, CA; Owner: PAPPAS RADIO OF CALIFORNIA, A CALIFORNIA LIMITED PARTNERSHIP)
KCBS (740 AM; 50 kW; SAN FRANCISCO, CA; Owner: INFINITY BROADCASTING OPERATIONS, INC.)
KNBR (680 AM; 50 kW; SAN FRANCISCO, CA; Owner: KNBR LICO, INC.)
KTCT (1050 AM; 50 kW; SAN MATEO, CA; Owner: SUSQUEHANNA RADIO CORP.)
KGO (810 AM; 50 kW; SAN FRANCISCO, CA; Owner: KGO-AM RADIO, INC.)
KFAX (1100 AM; 50 kW; SAN FRANCISCO, CA; Owner: GOLDEN GATE BROADCASTING CO, INC.)
KCBC (770 AM; 50 kW; RIVERBANK, CA; Owner: KIERTRON, INC.)
KIQI (1010 AM; 35 kW; SAN FRANCISCO, CA; Owner: RADIO UNICA OF SAN FRANCISCO LICENSE CORP.)
KNEW (910 AM; 20 kW; OAKLAND, CA; Owner: AMFM RADIO LICENSES, L.L.C.)
KFBK (1530 AM; 50 kW; SACRAMENTO, CA; Owner: AMFM RADIO LICENSES, L.L.C.)
Strongest FM radio stations in Rio Vista:
KRVH (90.9 FM; RIO VISTA, CA; Owner: RIVER DELTA UNIFIED SCHOOL DISTRICT)
KKSF-FM1 (103.7 FM; PLEASANTON, ETC., CA; Owner: AMFM RADIO LICENSES, L.L.C.)
KBLX-FM2 (102.9 FM; PLEASANTON, CA; Owner: ICBC BROADCAST HOLDINGS -CA, INC.)
KSOL-FM3 (98.9 FM; PLEASANTON, CA; Owner: TMS LICENSE CALIFORNIA, INC)
KFRC-FM3 (99.7 FM; WALNUT CREEK, CA; Owner: INFINITY KFRC-FM, INC.)
KZBR-FM1 (95.7 FM; WALNUT CREEK, CA; Owner: BONNEVILLE HOLDING COMPANY)
KMEL-FM1 (106.1 FM; CONCORD, CA; Owner: AMFM RADIO LICENSES, L.L.C.)
KISQ-FM3 (98.1 FM; CONCORD, CA; Owner: AMFM RADIO LICENSES, L.L.C.)
KUIC (95.3 FM; VACAVILLE, CA; Owner: KUIC, INC.)
KJOY (99.3 FM; STOCKTON, CA; Owner: CITADEL BROADCASTING COMPANY)
KXJZ (88.9 FM; SACRAMENTO, CA; Owner: CALIFORNIA STATE UNIV., SACRAMENTO)
K238AC (95.5 FM; SALIDA, CA; Owner: FAMILY STATIONS, INC.)
KOSO (93.1 FM; PATTERSON, CA; Owner: CAPSTAR TX LIMITED PARTNERSHIP)
KFJO (92.1 FM; WALNUT CREEK, CA; Owner: CHASE RADIO PROPERTIES, L.L.C.)
KNDL (89.9 FM; ANGWIN, CA; Owner: HOWELL MOUNTAIN BROADCASTING COMPANY)
KLVR (91.9 FM; SANTA ROSA, CA; Owner: EDUCATIONAL MEDIA FOUNDATION)
KXTS (100.9 FM; CALISTOGA, CA; Owner: SINCLAIR TELECABLE, INC.)
KSFB-FM (100.7 FM; SAN RAFAEL, CA; Owner: GOLDEN GATE BROADCASTING COMPANY, INC.)
KZBR-FM2 (95.7 FM; LIVERMORE, ETC., CA; Owner: BONNEVILLE HOLDING COMPANY)
KBBF (89.1 FM; SANTA ROSA, CA; Owner: BILINGUAL B/CING. FOUNDATION, INC.)
TV broadcast stations around Rio Vista:
KOVR (Channel 13; STOCKTON, CA; Owner: SCI - SACRAMENTO LICENSEE, LLC)
KXTV (Channel 10; SACRAMENTO, CA; Owner: KXTV, INC.)
KCRA-TV (Channel 3; SACRAMENTO, CA; Owner: KCRA HEARST-ARGYLE TELEVISION, INC.)
KSPX (Channel 29; SACRAMENTO, CA; Owner: PAXSON SACRAMENTO LICENSE, INC.)
KTXL (Channel 40; SACRAMENTO, CA; Owner: CHANNEL 40, INC.)
KUVS (Channel 19; MODESTO, CA; Owner: KUVS LICENSE PARTNERSHIP, G.P.)
KVIE (Channel 6; SACRAMENTO, CA; Owner: KVIE, INC.)
KQCA (Channel 58; STOCKTON, CA; Owner: KCRA HEARST-ARGYLE TELEVISION, INC.)
KMAX-TV (Channel 31; SACRAMENTO, CA; Owner: UPN STATIONS GROUP INC.)
KMMK-LP (Channel 14; SACRAMENTO, CA; Owner: CABALLERO TELEVISION TEXAS, L.L.C.)
KQED (Channel 9; SAN FRANCISCO, CA; Owner: KQED, INC.)
KEZT-CA (Channel 23; SACRAMENTO, CA; Owner: TELEFUTURA SACRAMENTO LLC)
KTNC-TV (Channel 42; CONCORD, CA; Owner: KTNC LICENSE, LLC)
KDTS-CA (Channel 52; STOCKTON, CA; Owner: WORD OF GOD FELLOWSHIP, INC.)
National Bridge Inventory (NBI) Statistics 7 Number of bridges390ft / 119m Total length53,450 Total average daily traffic4,555 Total average daily truck traffic80,540 Total future (year 2038) average daily traffic
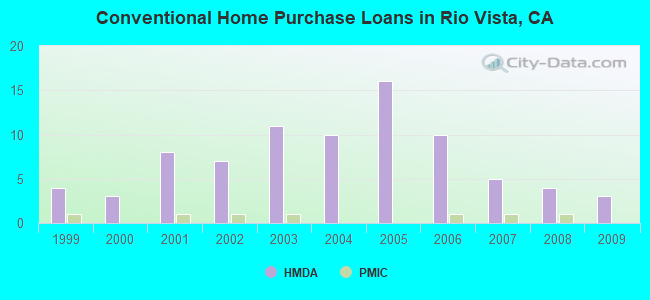
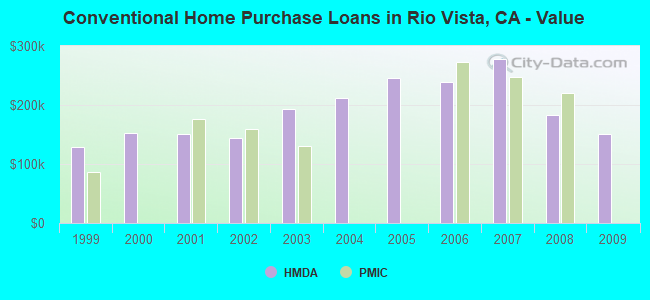
Home Mortgage Disclosure Act Aggregated Statistics For Year 2009(Based on 1 partial tract) A) FHA, FSA/RHS & VA B) Conventional C) Refinancings F) Non-occupant Loans on Number Average Value Number Average Value Number Average Value Number Average Value
LOANS ORIGINATED 2 $185,090 3 $150,207 5 $180,928 1 $189,060 APPLICATIONS APPROVED, NOT ACCEPTED 0 $0 0 $0 1 $134,030 0 $0 APPLICATIONS DENIED 0 $0 0 $0 3 $228,527 1 $111,660 APPLICATIONS WITHDRAWN 0 $0 0 $0 1 $295,700 0 $0 FILES CLOSED FOR INCOMPLETENESS 0 $0 0 $0 0 $0 0 $0
Aggregated Statistics For Year 2008(Based on 1 partial tract) A) FHA, FSA/RHS & VA B) Conventional C) Refinancings F) Non-occupant Loans on Number Average Value Number Average Value Number Average Value Number Average Value
LOANS ORIGINATED 1 $152,490 4 $183,008 3 $204,087 1 $286,610 APPLICATIONS APPROVED, NOT ACCEPTED 0 $0 1 $173,310 1 $156,100 0 $0 APPLICATIONS DENIED 0 $0 1 $150,750 3 $229,510 0 $0 APPLICATIONS WITHDRAWN 0 $0 1 $170,360 1 $326,980 0 $0 FILES CLOSED FOR INCOMPLETENESS 0 $0 0 $0 0 $0 0 $0
Aggregated Statistics For Year 2007(Based on 1 partial tract) B) Conventional C) Refinancings D) Home Improvement Loans F) Non-occupant Loans on Number Average Value Number Average Value Number Average Value Number Average Value
LOANS ORIGINATED 5 $278,464 7 $260,836 1 $114,240 2 $225,190 APPLICATIONS APPROVED, NOT ACCEPTED 1 $389,060 2 $257,460 0 $0 0 $0 APPLICATIONS DENIED 2 $251,105 5 $306,456 1 $163,280 1 $181,460 APPLICATIONS WITHDRAWN 1 $247,790 3 $244,357 0 $0 0 $0 FILES CLOSED FOR INCOMPLETENESS 0 $0 1 $212,160 0 $0 0 $0
Aggregated Statistics For Year 2006(Based on 1 partial tract) B) Conventional C) Refinancings D) Home Improvement Loans F) Non-occupant Loans on Number Average Value Number Average Value Number Average Value Number Average Value
LOANS ORIGINATED 10 $239,394 11 $250,839 1 $230,010 3 $219,133 APPLICATIONS APPROVED, NOT ACCEPTED 2 $298,330 2 $262,320 0 $0 0 $0 APPLICATIONS DENIED 1 $407,570 5 $303,180 1 $250,250 0 $0 APPLICATIONS WITHDRAWN 1 $255,480 4 $232,042 0 $0 0 $0 FILES CLOSED FOR INCOMPLETENESS 1 $232,010 1 $276,210 0 $0 0 $0
Aggregated Statistics For Year 2005(Based on 1 partial tract) B) Conventional C) Refinancings D) Home Improvement Loans F) Non-occupant Loans on Number Average Value Number Average Value Number Average Value Number Average Value
LOANS ORIGINATED 16 $246,206 13 $267,403 1 $293,540 5 $250,642 APPLICATIONS APPROVED, NOT ACCEPTED 2 $191,520 2 $226,405 0 $0 0 $0 APPLICATIONS DENIED 3 $252,543 5 $292,314 1 $124,610 1 $274,880 APPLICATIONS WITHDRAWN 2 $232,955 5 $278,068 1 $124,060 1 $173,100 FILES CLOSED FOR INCOMPLETENESS 1 $199,270 1 $339,840 0 $0 0 $0
Aggregated Statistics For Year 2004(Based on 1 partial tract) B) Conventional C) Refinancings D) Home Improvement Loans F) Non-occupant Loans on Number Average Value Number Average Value Number Average Value Number Average Value
LOANS ORIGINATED 10 $212,070 12 $216,975 1 $102,300 3 $196,730 APPLICATIONS APPROVED, NOT ACCEPTED 2 $195,045 2 $246,420 0 $0 0 $0 APPLICATIONS DENIED 2 $230,080 6 $212,760 1 $67,610 1 $131,720 APPLICATIONS WITHDRAWN 2 $169,755 5 $209,522 0 $0 0 $0 FILES CLOSED FOR INCOMPLETENESS 0 $0 1 $217,600 0 $0 0 $0
Aggregated Statistics For Year 2003(Based on 1 partial tract) B) Conventional C) Refinancings D) Home Improvement Loans F) Non-occupant Loans on Number Average Value Number Average Value Number Average Value Number Average Value
LOANS ORIGINATED 11 $192,938 17 $174,049 1 $30,160 2 $150,555 APPLICATIONS APPROVED, NOT ACCEPTED 1 $293,060 3 $148,617 0 $0 0 $0 APPLICATIONS DENIED 1 $224,020 5 $202,726 1 $24,050 0 $0 APPLICATIONS WITHDRAWN 2 $129,855 4 $186,695 0 $0 0 $0 FILES CLOSED FOR INCOMPLETENESS 1 $89,280 1 $108,470 0 $0 0 $0
Aggregated Statistics For Year 2002(Based on 1 partial tract) A) FHA, FSA/RHS & VA B) Conventional C) Refinancings F) Non-occupant Loans on Number Average Value Number Average Value Number Average Value Number Average Value
LOANS ORIGINATED 1 $161,730 7 $144,783 12 $157,077 2 $128,670 APPLICATIONS APPROVED, NOT ACCEPTED 0 $0 1 $160,510 1 $192,430 0 $0 APPLICATIONS DENIED 0 $0 1 $110,960 3 $181,297 0 $0 APPLICATIONS WITHDRAWN 0 $0 1 $96,160 3 $171,507 0 $0 FILES CLOSED FOR INCOMPLETENESS 0 $0 0 $0 1 $201,980 0 $0
Aggregated Statistics For Year 2001(Based on 1 partial tract) A) FHA, FSA/RHS & VA B) Conventional C) Refinancings F) Non-occupant Loans on Number Average Value Number Average Value Number Average Value Number Average Value
LOANS ORIGINATED 2 $225,080 8 $151,130 7 $136,200 1 $120,810 APPLICATIONS APPROVED, NOT ACCEPTED 0 $0 1 $192,430 1 $103,600 0 $0 APPLICATIONS DENIED 0 $0 1 $324,850 3 $122,480 0 $0 APPLICATIONS WITHDRAWN 0 $0 1 $173,460 2 $163,475 0 $0 FILES CLOSED FOR INCOMPLETENESS 0 $0 0 $0 0 $0 0 $0
Aggregated Statistics For Year 2000(Based on 1 partial tract) A) FHA, FSA/RHS & VA B) Conventional C) Refinancings D) Home Improvement Loans F) Non-occupant Loans on Number Average Value Number Average Value Number Average Value Number Average Value Number Average Value
LOANS ORIGINATED 1 $189,760 3 $152,670 2 $109,895 1 $9,610 1 $72,930 APPLICATIONS APPROVED, NOT ACCEPTED 0 $0 1 $128,350 0 $0 0 $0 0 $0 APPLICATIONS DENIED 0 $0 0 $0 1 $102,660 0 $0 0 $0 APPLICATIONS WITHDRAWN 0 $0 0 $0 1 $62,560 0 $0 0 $0 FILES CLOSED FOR INCOMPLETENESS 0 $0 0 $0 0 $0 0 $0 0 $0
Aggregated Statistics For Year 1999(Based on 1 partial tract) A) FHA, FSA/RHS & VA B) Conventional C) Refinancings D) Home Improvement Loans F) Non-occupant Loans on Number Average Value Number Average Value Number Average Value Number Average Value Number Average Value
LOANS ORIGINATED 2 $118,300 4 $129,077 2 $108,480 1 $16,140 1 $68,190 APPLICATIONS APPROVED, NOT ACCEPTED 0 $0 0 $0 1 $100,960 0 $0 0 $0 APPLICATIONS DENIED 0 $0 1 $101,350 2 $139,430 1 $13,410 0 $0 APPLICATIONS WITHDRAWN 0 $0 0 $0 1 $174,160 0 $0 0 $0 FILES CLOSED FOR INCOMPLETENESS 0 $0 0 $0 0 $0 0 $0 0 $0
Detailed HMDA statistics for the following Tracts:
2535.00
Private Mortgage Insurance Companies Aggregated Statistics For Year 2008(Based on 1 partial tract) A) Conventional Number Average Value
LOANS ORIGINATED 1 $219,700 APPLICATIONS APPROVED, NOT ACCEPTED 1 $173,610 APPLICATIONS DENIED 0 $0 APPLICATIONS WITHDRAWN 0 $0 FILES CLOSED FOR INCOMPLETENESS 0 $0
Aggregated Statistics For Year 2007(Based on 1 partial tract) A) Conventional Number Average Value
LOANS ORIGINATED 1 $247,700 APPLICATIONS APPROVED, NOT ACCEPTED 0 $0 APPLICATIONS DENIED 0 $0 APPLICATIONS WITHDRAWN 0 $0 FILES CLOSED FOR INCOMPLETENESS 0 $0
Aggregated Statistics For Year 2006(Based on 1 partial tract) A) Conventional Number Average Value
LOANS ORIGINATED 1 $272,440 APPLICATIONS APPROVED, NOT ACCEPTED 0 $0 APPLICATIONS DENIED 0 $0 APPLICATIONS WITHDRAWN 0 $0 FILES CLOSED FOR INCOMPLETENESS 0 $0
Aggregated Statistics For Year 2003(Based on 1 partial tract) A) Conventional B) Refinancings Number Average Value Number Average Value
LOANS ORIGINATED 1 $129,870 1 $226,180 APPLICATIONS APPROVED, NOT ACCEPTED 0 $0 0 $0 APPLICATIONS DENIED 0 $0 0 $0 APPLICATIONS WITHDRAWN 0 $0 0 $0 FILES CLOSED FOR INCOMPLETENESS 0 $0 0 $0
Aggregated Statistics For Year 2002(Based on 1 partial tract) A) Conventional B) Refinancings Number Average Value Number Average Value
LOANS ORIGINATED 1 $159,840 1 $125,070 APPLICATIONS APPROVED, NOT ACCEPTED 0 $0 0 $0 APPLICATIONS DENIED 0 $0 0 $0 APPLICATIONS WITHDRAWN 0 $0 0 $0 FILES CLOSED FOR INCOMPLETENESS 0 $0 0 $0
Aggregated Statistics For Year 2001(Based on 1 partial tract) A) Conventional Number Average Value
LOANS ORIGINATED 1 $175,680 APPLICATIONS APPROVED, NOT ACCEPTED 0 $0 APPLICATIONS DENIED 0 $0 APPLICATIONS WITHDRAWN 0 $0 FILES CLOSED FOR INCOMPLETENESS 0 $0
Aggregated Statistics For Year 1999(Based on 1 partial tract) A) Conventional Number Average Value
LOANS ORIGINATED 1 $86,730 APPLICATIONS APPROVED, NOT ACCEPTED 0 $0 APPLICATIONS DENIED 0 $0 APPLICATIONS WITHDRAWN 0 $0 FILES CLOSED FOR INCOMPLETENESS 0 $0
Detailed PMIC statistics for the following Tracts:
2535.00
Most common first names in Rio Vista, CA among deceased individuals Name Count Lived (average)
John 61 72.2 years James 38 72.7 years Mary 37 82.4 years Robert 37 70.1 years William 35 80.7 years George 35 75.0 years Charles 29 74.7 years Joseph 21 73.8 years Frank 20 77.6 years Richard 17 72.6 years
Most common last names in Rio Vista, CA among deceased individuals Last name Count Lived (average)
Brown 15 80.9 years Williams 14 77.5 years Anderson 12 76.7 years Hansen 11 75.7 years Smith 11 71.6 years Miller 11 77.3 years Azevedo 11 73.8 years Hamilton 11 79.9 years Gomez 9 82.0 years Wilson 9 75.6 years
Rio Vista compared to California state average:
Unemployed percentage significantly below state average. Black race population percentage significantly above state average. Median age significantly above state average. Renting percentage below state average. House age below state average.
#14 on the list of "Top 101 cities with largest percentage of females in industries: utilities (population 5,000+)"
#24 on the list of "Top 101 cities with largest percentage of females in occupations: management occupations (population 5,000+)"
#63 on the list of "Top 100 cities with oldest residents (pop. 5,000+)"
#86 (94571) on the list of "Top 101 zip codes with the smallest percentage of returns reporting salary or wage in 2012 (pop 5,000+)"
#1 on the list of "Top 101 counties with the largest increase in the number of infant deaths per 1000 residents 2000-2006 to 2007-2013 (pop. 50,000+)"
#21 on the list of "Top 101 counties with the highest Nitrogen Dioxide air pollution readings in 2012 (ppm)"
#31 on the list of "Top 101 counties with the lowest Particulate Matter (PM10 ) Annual air pollution readings in 2012 (µg/m3 )"
#36 on the list of "Top 101 counties with the highest carbon monoxide air pollution readings in 2012 (ppm)"
#78 on the list of "Top 101 counties with the highest percentage of residents relocating to foreign countries in 2011 (pop. 50,000+)"
Top Patent Applicants
Ferdinand Kogler (7)
Daniel J. Simpson (7)
Hans Peter Theodorus Ceelen (5)
Leon Guzenda (5)
Edmund J. Kelly (3)
Jason Lim (2)
Owen B. Drury (2)
Charlene Levering (1)
William Hiatt (1)
Walter A. Bogdanoff (1)
Total of 32 patent applications in 2008-2024.


 Recent articles from our blog. Our writers, many of them Ph.D. graduates or candidates, create easy-to-read articles on a wide variety of topics.


 (13.2 miles
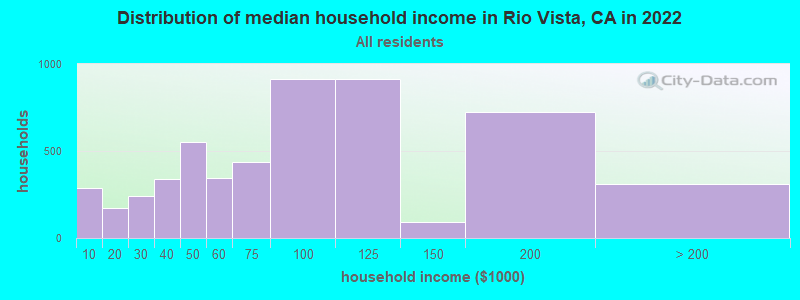

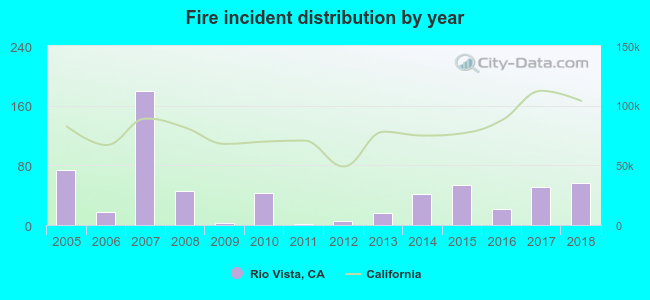 According to the data from the years 2005 - 2018 the average number of fire incidents per year is 44. The highest number of reported fires - 180 took place in 2007, and the least - 2 in 2011. The data has a declining trend.
 When looking into fire subcategories, the most reports belonged to: Outside Fires (66.0%), and Structure Fires (23.3%).