San Buenaventura (Ventura), California Submit your own pictures of this city and show them to the world
OSM Map
General Map
Google Map
MSN Map
OSM Map
General Map
Google Map
MSN Map
OSM Map
General Map
Google Map
MSN Map
OSM Map
General Map
Google Map
MSN Map
Please wait while loading the map...
Population in 2022: 109,527 (100% urban, 0% rural). Population change since 2000: +8.5%Males: 55,575 Females: 53,952
March 2022 cost of living index in San Buenaventura (Ventura): 93.7 (less than average, U.S. average is 100) Percentage of residents living in poverty in 2022: 9.1%for White Non-Hispanic residents , 22.3% for Black residents , 9.1% for Hispanic or Latino residents , 5.2% for American Indian residents , 35.6% for Native Hawaiian and other Pacific Islander residents , 11.7% for other race residents , 9.8% for two or more races residents )Business Search - 14 Million verified businesses
Data:
Median household income ($)
Median household income (% change since 2000)
Household income diversity
Ratio of average income to average house value (%)
Ratio of average income to average rent
Median household income ($) - White
Median household income ($) - Black or African American
Median household income ($) - Asian
Median household income ($) - Hispanic or Latino
Median household income ($) - American Indian and Alaska Native
Median household income ($) - Multirace
Median household income ($) - Other Race
Median household income for houses/condos with a mortgage ($)
Median household income for apartments without a mortgage ($)
Races - White alone (%)
Races - White alone (% change since 2000)
Races - Black alone (%)
Races - Black alone (% change since 2000)
Races - American Indian alone (%)
Races - American Indian alone (% change since 2000)
Races - Asian alone (%)
Races - Asian alone (% change since 2000)
Races - Hispanic (%)
Races - Hispanic (% change since 2000)
Races - Native Hawaiian and Other Pacific Islander alone (%)
Races - Native Hawaiian and Other Pacific Islander alone (% change since 2000)
Races - Two or more races (%)
Races - Two or more races (% change since 2000)
Races - Other race alone (%)
Races - Other race alone (% change since 2000)
Racial diversity
Unemployment (%)
Unemployment (% change since 2000)
Unemployment (%) - White
Unemployment (%) - Black or African American
Unemployment (%) - Asian
Unemployment (%) - Hispanic or Latino
Unemployment (%) - American Indian and Alaska Native
Unemployment (%) - Multirace
Unemployment (%) - Other Race
Population density (people per square mile)
Population - Males (%)
Population - Females (%)
Population - Males (%) - White
Population - Males (%) - Black or African American
Population - Males (%) - Asian
Population - Males (%) - Hispanic or Latino
Population - Males (%) - American Indian and Alaska Native
Population - Males (%) - Multirace
Population - Males (%) - Other Race
Population - Females (%) - White
Population - Females (%) - Black or African American
Population - Females (%) - Asian
Population - Females (%) - Hispanic or Latino
Population - Females (%) - American Indian and Alaska Native
Population - Females (%) - Multirace
Population - Females (%) - Other Race
Coronavirus confirmed cases (Apr 16, 2024)
Deaths caused by coronavirus (Apr 16, 2024)
Coronavirus confirmed cases (per 100k population) (Apr 16, 2024)
Deaths caused by coronavirus (per 100k population) (Apr 16, 2024)
Daily increase in number of cases (Apr 16, 2024)
Weekly increase in number of cases (Apr 16, 2024)
Cases doubled (in days) (Apr 16, 2024)
Hospitalized patients (Apr 18, 2022)
Negative test results (Apr 18, 2022)
Total test results (Apr 18, 2022)
COVID Vaccine doses distributed (per 100k population) (Sep 19, 2023)
COVID Vaccine doses administered (per 100k population) (Sep 19, 2023)
COVID Vaccine doses distributed (Sep 19, 2023)
COVID Vaccine doses administered (Sep 19, 2023)
Likely homosexual households (%)
Likely homosexual households (% change since 2000)
Likely homosexual households - Lesbian couples (%)
Likely homosexual households - Lesbian couples (% change since 2000)
Likely homosexual households - Gay men (%)
Likely homosexual households - Gay men (% change since 2000)
Cost of living index
Median gross rent ($)
Median contract rent ($)
Median monthly housing costs ($)
Median house or condo value ($)
Median house or condo value ($ change since 2000)
Mean house or condo value by units in structure - 1, detached ($)
Mean house or condo value by units in structure - 1, attached ($)
Mean house or condo value by units in structure - 2 ($)
Mean house or condo value by units in structure by units in structure - 3 or 4 ($)
Mean house or condo value by units in structure - 5 or more ($)
Mean house or condo value by units in structure - Boat, RV, van, etc. ($)
Mean house or condo value by units in structure - Mobile home ($)
Median house or condo value ($) - White
Median house or condo value ($) - Black or African American
Median house or condo value ($) - Asian
Median house or condo value ($) - Hispanic or Latino
Median house or condo value ($) - American Indian and Alaska Native
Median house or condo value ($) - Multirace
Median house or condo value ($) - Other Race
Median resident age
Resident age diversity
Median resident age - Males
Median resident age - Females
Median resident age - White
Median resident age - Black or African American
Median resident age - Asian
Median resident age - Hispanic or Latino
Median resident age - American Indian and Alaska Native
Median resident age - Multirace
Median resident age - Other Race
Median resident age - Males - White
Median resident age - Males - Black or African American
Median resident age - Males - Asian
Median resident age - Males - Hispanic or Latino
Median resident age - Males - American Indian and Alaska Native
Median resident age - Males - Multirace
Median resident age - Males - Other Race
Median resident age - Females - White
Median resident age - Females - Black or African American
Median resident age - Females - Asian
Median resident age - Females - Hispanic or Latino
Median resident age - Females - American Indian and Alaska Native
Median resident age - Females - Multirace
Median resident age - Females - Other Race
Commute - mean travel time to work (minutes)
Travel time to work - Less than 5 minutes (%)
Travel time to work - Less than 5 minutes (% change since 2000)
Travel time to work - 5 to 9 minutes (%)
Travel time to work - 5 to 9 minutes (% change since 2000)
Travel time to work - 10 to 19 minutes (%)
Travel time to work - 10 to 19 minutes (% change since 2000)
Travel time to work - 20 to 29 minutes (%)
Travel time to work - 20 to 29 minutes (% change since 2000)
Travel time to work - 30 to 39 minutes (%)
Travel time to work - 30 to 39 minutes (% change since 2000)
Travel time to work - 40 to 59 minutes (%)
Travel time to work - 40 to 59 minutes (% change since 2000)
Travel time to work - 60 to 89 minutes (%)
Travel time to work - 60 to 89 minutes (% change since 2000)
Travel time to work - 90 or more minutes (%)
Travel time to work - 90 or more minutes (% change since 2000)
Marital status - Never married (%)
Marital status - Now married (%)
Marital status - Separated (%)
Marital status - Widowed (%)
Marital status - Divorced (%)
Median family income ($)
Median family income (% change since 2000)
Median non-family income ($)
Median non-family income (% change since 2000)
Median per capita income ($)
Median per capita income (% change since 2000)
Median family income ($) - White
Median family income ($) - Black or African American
Median family income ($) - Asian
Median family income ($) - Hispanic or Latino
Median family income ($) - American Indian and Alaska Native
Median family income ($) - Multirace
Median family income ($) - Other Race
Median year house/condo built
Median year apartment built
Year house built - Built 2005 or later (%)
Year house built - Built 2000 to 2004 (%)
Year house built - Built 1990 to 1999 (%)
Year house built - Built 1980 to 1989 (%)
Year house built - Built 1970 to 1979 (%)
Year house built - Built 1960 to 1969 (%)
Year house built - Built 1950 to 1959 (%)
Year house built - Built 1940 to 1949 (%)
Year house built - Built 1939 or earlier (%)
Average household size
Household density (households per square mile)
Average household size - White
Average household size - Black or African American
Average household size - Asian
Average household size - Hispanic or Latino
Average household size - American Indian and Alaska Native
Average household size - Multirace
Average household size - Other Race
Occupied housing units (%)
Vacant housing units (%)
Owner occupied housing units (%)
Renter occupied housing units (%)
Vacancy status - For rent (%)
Vacancy status - For sale only (%)
Vacancy status - Rented or sold, not occupied (%)
Vacancy status - For seasonal, recreational, or occasional use (%)
Vacancy status - For migrant workers (%)
Vacancy status - Other vacant (%)
Residents with income below the poverty level (%)
Residents with income below 50% of the poverty level (%)
Children below poverty level (%)
Poor families by family type - Married-couple family (%)
Poor families by family type - Male, no wife present (%)
Poor families by family type - Female, no husband present (%)
Poverty status for native-born residents (%)
Poverty status for foreign-born residents (%)
Poverty among high school graduates not in families (%)
Poverty among people who did not graduate high school not in families (%)
Residents with income below the poverty level (%) - White
Residents with income below the poverty level (%) - Black or African American
Residents with income below the poverty level (%) - Asian
Residents with income below the poverty level (%) - Hispanic or Latino
Residents with income below the poverty level (%) - American Indian and Alaska Native
Residents with income below the poverty level (%) - Multirace
Residents with income below the poverty level (%) - Other Race
Air pollution - Air Quality Index (AQI)
Air pollution - CO
Air pollution - NO2
Air pollution - SO2
Air pollution - Ozone
Air pollution - PM10
Air pollution - PM25
Air pollution - Pb
Crime - Murders per 100,000 population
Crime - Rapes per 100,000 population
Crime - Robberies per 100,000 population
Crime - Assaults per 100,000 population
Crime - Burglaries per 100,000 population
Crime - Thefts per 100,000 population
Crime - Auto thefts per 100,000 population
Crime - Arson per 100,000 population
Crime - City-data.com crime index
Crime - Violent crime index
Crime - Property crime index
Crime - Murders per 100,000 population (5 year average)
Crime - Rapes per 100,000 population (5 year average)
Crime - Robberies per 100,000 population (5 year average)
Crime - Assaults per 100,000 population (5 year average)
Crime - Burglaries per 100,000 population (5 year average)
Crime - Thefts per 100,000 population (5 year average)
Crime - Auto thefts per 100,000 population (5 year average)
Crime - Arson per 100,000 population (5 year average)
Crime - City-data.com crime index (5 year average)
Crime - Violent crime index (5 year average)
Crime - Property crime index (5 year average)
1996 Presidential Elections Results (%) - Democratic Party (Clinton)
1996 Presidential Elections Results (%) - Republican Party (Dole)
1996 Presidential Elections Results (%) - Other
2000 Presidential Elections Results (%) - Democratic Party (Gore)
2000 Presidential Elections Results (%) - Republican Party (Bush)
2000 Presidential Elections Results (%) - Other
2004 Presidential Elections Results (%) - Democratic Party (Kerry)
2004 Presidential Elections Results (%) - Republican Party (Bush)
2004 Presidential Elections Results (%) - Other
2008 Presidential Elections Results (%) - Democratic Party (Obama)
2008 Presidential Elections Results (%) - Republican Party (McCain)
2008 Presidential Elections Results (%) - Other
2012 Presidential Elections Results (%) - Democratic Party (Obama)
2012 Presidential Elections Results (%) - Republican Party (Romney)
2012 Presidential Elections Results (%) - Other
2016 Presidential Elections Results (%) - Democratic Party (Clinton)
2016 Presidential Elections Results (%) - Republican Party (Trump)
2016 Presidential Elections Results (%) - Other
2020 Presidential Elections Results (%) - Democratic Party (Biden)
2020 Presidential Elections Results (%) - Republican Party (Trump)
2020 Presidential Elections Results (%) - Other
Ancestries Reported - Arab (%)
Ancestries Reported - Czech (%)
Ancestries Reported - Danish (%)
Ancestries Reported - Dutch (%)
Ancestries Reported - English (%)
Ancestries Reported - French (%)
Ancestries Reported - French Canadian (%)
Ancestries Reported - German (%)
Ancestries Reported - Greek (%)
Ancestries Reported - Hungarian (%)
Ancestries Reported - Irish (%)
Ancestries Reported - Italian (%)
Ancestries Reported - Lithuanian (%)
Ancestries Reported - Norwegian (%)
Ancestries Reported - Polish (%)
Ancestries Reported - Portuguese (%)
Ancestries Reported - Russian (%)
Ancestries Reported - Scotch-Irish (%)
Ancestries Reported - Scottish (%)
Ancestries Reported - Slovak (%)
Ancestries Reported - Subsaharan African (%)
Ancestries Reported - Swedish (%)
Ancestries Reported - Swiss (%)
Ancestries Reported - Ukrainian (%)
Ancestries Reported - United States (%)
Ancestries Reported - Welsh (%)
Ancestries Reported - West Indian (%)
Ancestries Reported - Other (%)
Educational Attainment - No schooling completed (%)
Educational Attainment - Less than high school (%)
Educational Attainment - High school or equivalent (%)
Educational Attainment - Less than 1 year of college (%)
Educational Attainment - 1 or more years of college (%)
Educational Attainment - Associate degree (%)
Educational Attainment - Bachelor's degree (%)
Educational Attainment - Master's degree (%)
Educational Attainment - Professional school degree (%)
Educational Attainment - Doctorate degree (%)
School Enrollment - Nursery, preschool (%)
School Enrollment - Kindergarten (%)
School Enrollment - Grade 1 to 4 (%)
School Enrollment - Grade 5 to 8 (%)
School Enrollment - Grade 9 to 12 (%)
School Enrollment - College undergrad (%)
School Enrollment - Graduate or professional (%)
School Enrollment - Not enrolled in school (%)
School enrollment - Public schools (%)
School enrollment - Private schools (%)
School enrollment - Not enrolled (%)
Median number of rooms in houses and condos
Median number of rooms in apartments
Housing units lacking complete plumbing facilities (%)
Housing units lacking complete kitchen facilities (%)
Density of houses
Urban houses (%)
Rural houses (%)
Households with people 60 years and over (%)
Households with people 65 years and over (%)
Households with people 75 years and over (%)
Households with one or more nonrelatives (%)
Households with no nonrelatives (%)
Population in households (%)
Family households (%)
Nonfamily households (%)
Population in families (%)
Family households with own children (%)
Median number of bedrooms in owner occupied houses
Mean number of bedrooms in owner occupied houses
Median number of bedrooms in renter occupied houses
Mean number of bedrooms in renter occupied houses
Median number of vehichles in owner occupied houses
Mean number of vehichles in owner occupied houses
Median number of vehichles in renter occupied houses
Mean number of vehichles in renter occupied houses
Mortgage status - with mortgage (%)
Mortgage status - with second mortgage (%)
Mortgage status - with home equity loan (%)
Mortgage status - with both second mortgage and home equity loan (%)
Mortgage status - without a mortgage (%)
Average family size
Average family size - White
Average family size - Black or African American
Average family size - Asian
Average family size - Hispanic or Latino
Average family size - American Indian and Alaska Native
Average family size - Multirace
Average family size - Other Race
Geographical mobility - Same house 1 year ago (%)
Geographical mobility - Moved within same county (%)
Geographical mobility - Moved from different county within same state (%)
Geographical mobility - Moved from different state (%)
Geographical mobility - Moved from abroad (%)
Place of birth - Born in state of residence (%)
Place of birth - Born in other state (%)
Place of birth - Native, outside of US (%)
Place of birth - Foreign born (%)
Housing units in structures - 1, detached (%)
Housing units in structures - 1, attached (%)
Housing units in structures - 2 (%)
Housing units in structures - 3 or 4 (%)
Housing units in structures - 5 to 9 (%)
Housing units in structures - 10 to 19 (%)
Housing units in structures - 20 to 49 (%)
Housing units in structures - 50 or more (%)
Housing units in structures - Mobile home (%)
Housing units in structures - Boat, RV, van, etc. (%)
House/condo owner moved in on average (years ago)
Renter moved in on average (years ago)
Year householder moved into unit - Moved in 1999 to March 2000 (%)
Year householder moved into unit - Moved in 1995 to 1998 (%)
Year householder moved into unit - Moved in 1990 to 1994 (%)
Year householder moved into unit - Moved in 1980 to 1989 (%)
Year householder moved into unit - Moved in 1970 to 1979 (%)
Year householder moved into unit - Moved in 1969 or earlier (%)
Means of transportation to work - Drove car alone (%)
Means of transportation to work - Carpooled (%)
Means of transportation to work - Public transportation (%)
Means of transportation to work - Bus or trolley bus (%)
Means of transportation to work - Streetcar or trolley car (%)
Means of transportation to work - Subway or elevated (%)
Means of transportation to work - Railroad (%)
Means of transportation to work - Ferryboat (%)
Means of transportation to work - Taxicab (%)
Means of transportation to work - Motorcycle (%)
Means of transportation to work - Bicycle (%)
Means of transportation to work - Walked (%)
Means of transportation to work - Other means (%)
Working at home (%)
Industry diversity
Most Common Industries - Agriculture, forestry, fishing and hunting, and mining (%)
Most Common Industries - Agriculture, forestry, fishing and hunting (%)
Most Common Industries - Mining, quarrying, and oil and gas extraction (%)
Most Common Industries - Construction (%)
Most Common Industries - Manufacturing (%)
Most Common Industries - Wholesale trade (%)
Most Common Industries - Retail trade (%)
Most Common Industries - Transportation and warehousing, and utilities (%)
Most Common Industries - Transportation and warehousing (%)
Most Common Industries - Utilities (%)
Most Common Industries - Information (%)
Most Common Industries - Finance and insurance, and real estate and rental and leasing (%)
Most Common Industries - Finance and insurance (%)
Most Common Industries - Real estate and rental and leasing (%)
Most Common Industries - Professional, scientific, and management, and administrative and waste management services (%)
Most Common Industries - Professional, scientific, and technical services (%)
Most Common Industries - Management of companies and enterprises (%)
Most Common Industries - Administrative and support and waste management services (%)
Most Common Industries - Educational services, and health care and social assistance (%)
Most Common Industries - Educational services (%)
Most Common Industries - Health care and social assistance (%)
Most Common Industries - Arts, entertainment, and recreation, and accommodation and food services (%)
Most Common Industries - Arts, entertainment, and recreation (%)
Most Common Industries - Accommodation and food services (%)
Most Common Industries - Other services, except public administration (%)
Most Common Industries - Public administration (%)
Occupation diversity
Most Common Occupations - Management, business, science, and arts occupations (%)
Most Common Occupations - Management, business, and financial occupations (%)
Most Common Occupations - Management occupations (%)
Most Common Occupations - Business and financial operations occupations (%)
Most Common Occupations - Computer, engineering, and science occupations (%)
Most Common Occupations - Computer and mathematical occupations (%)
Most Common Occupations - Architecture and engineering occupations (%)
Most Common Occupations - Life, physical, and social science occupations (%)
Most Common Occupations - Education, legal, community service, arts, and media occupations (%)
Most Common Occupations - Community and social service occupations (%)
Most Common Occupations - Legal occupations (%)
Most Common Occupations - Education, training, and library occupations (%)
Most Common Occupations - Arts, design, entertainment, sports, and media occupations (%)
Most Common Occupations - Healthcare practitioners and technical occupations (%)
Most Common Occupations - Health diagnosing and treating practitioners and other technical occupations (%)
Most Common Occupations - Health technologists and technicians (%)
Most Common Occupations - Service occupations (%)
Most Common Occupations - Healthcare support occupations (%)
Most Common Occupations - Protective service occupations (%)
Most Common Occupations - Fire fighting and prevention, and other protective service workers including supervisors (%)
Most Common Occupations - Law enforcement workers including supervisors (%)
Most Common Occupations - Food preparation and serving related occupations (%)
Most Common Occupations - Building and grounds cleaning and maintenance occupations (%)
Most Common Occupations - Personal care and service occupations (%)
Most Common Occupations - Sales and office occupations (%)
Most Common Occupations - Sales and related occupations (%)
Most Common Occupations - Office and administrative support occupations (%)
Most Common Occupations - Natural resources, construction, and maintenance occupations (%)
Most Common Occupations - Farming, fishing, and forestry occupations (%)
Most Common Occupations - Construction and extraction occupations (%)
Most Common Occupations - Installation, maintenance, and repair occupations (%)
Most Common Occupations - Production, transportation, and material moving occupations (%)
Most Common Occupations - Production occupations (%)
Most Common Occupations - Transportation occupations (%)
Most Common Occupations - Material moving occupations (%)
People in Group quarters - Institutionalized population (%)
People in Group quarters - Correctional institutions (%)
People in Group quarters - Federal prisons and detention centers (%)
People in Group quarters - Halfway houses (%)
People in Group quarters - Local jails and other confinement facilities (including police lockups) (%)
People in Group quarters - Military disciplinary barracks (%)
People in Group quarters - State prisons (%)
People in Group quarters - Other types of correctional institutions (%)
People in Group quarters - Nursing homes (%)
People in Group quarters - Hospitals/wards, hospices, and schools for the handicapped (%)
People in Group quarters - Hospitals/wards and hospices for chronically ill (%)
People in Group quarters - Hospices or homes for chronically ill (%)
People in Group quarters - Military hospitals or wards for chronically ill (%)
People in Group quarters - Other hospitals or wards for chronically ill (%)
People in Group quarters - Hospitals or wards for drug/alcohol abuse (%)
People in Group quarters - Mental (Psychiatric) hospitals or wards (%)
People in Group quarters - Schools, hospitals, or wards for the mentally retarded (%)
People in Group quarters - Schools, hospitals, or wards for the physically handicapped (%)
People in Group quarters - Institutions for the deaf (%)
People in Group quarters - Institutions for the blind (%)
People in Group quarters - Orthopedic wards and institutions for the physically handicapped (%)
People in Group quarters - Wards in general hospitals for patients who have no usual home elsewhere (%)
People in Group quarters - Wards in military hospitals for patients who have no usual home elsewhere (%)
People in Group quarters - Juvenile institutions (%)
People in Group quarters - Long-term care (%)
People in Group quarters - Homes for abused, dependent, and neglected children (%)
People in Group quarters - Residential treatment centers for emotionally disturbed children (%)
People in Group quarters - Training schools for juvenile delinquents (%)
People in Group quarters - Short-term care, detention or diagnostic centers for delinquent children (%)
People in Group quarters - Type of juvenile institution unknown (%)
People in Group quarters - Noninstitutionalized population (%)
People in Group quarters - College dormitories (includes college quarters off campus) (%)
People in Group quarters - Military quarters (%)
People in Group quarters - On base (%)
People in Group quarters - Barracks, unaccompanied personnel housing (UPH), (Enlisted/Officer), ;and similar group living quarters for military personnel (%)
People in Group quarters - Transient quarters for temporary residents (%)
People in Group quarters - Military ships (%)
People in Group quarters - Group homes (%)
People in Group quarters - Homes or halfway houses for drug/alcohol abuse (%)
People in Group quarters - Homes for the mentally ill (%)
People in Group quarters - Homes for the mentally retarded (%)
People in Group quarters - Homes for the physically handicapped (%)
People in Group quarters - Other group homes (%)
People in Group quarters - Religious group quarters (%)
People in Group quarters - Dormitories (%)
People in Group quarters - Agriculture workers' dormitories on farms (%)
People in Group quarters - Job Corps and vocational training facilities (%)
People in Group quarters - Other workers' dormitories (%)
People in Group quarters - Crews of maritime vessels (%)
People in Group quarters - Other nonhousehold living situations (%)
People in Group quarters - Other noninstitutional group quarters (%)
Residents speaking English at home (%)
Residents speaking English at home - Born in the United States (%)
Residents speaking English at home - Native, born elsewhere (%)
Residents speaking English at home - Foreign born (%)
Residents speaking Spanish at home (%)
Residents speaking Spanish at home - Born in the United States (%)
Residents speaking Spanish at home - Native, born elsewhere (%)
Residents speaking Spanish at home - Foreign born (%)
Residents speaking other language at home (%)
Residents speaking other language at home - Born in the United States (%)
Residents speaking other language at home - Native, born elsewhere (%)
Residents speaking other language at home - Foreign born (%)
Class of Workers - Employee of private company (%)
Class of Workers - Self-employed in own incorporated business (%)
Class of Workers - Private not-for-profit wage and salary workers (%)
Class of Workers - Local government workers (%)
Class of Workers - State government workers (%)
Class of Workers - Federal government workers (%)
Class of Workers - Self-employed workers in own not incorporated business and Unpaid family workers (%)
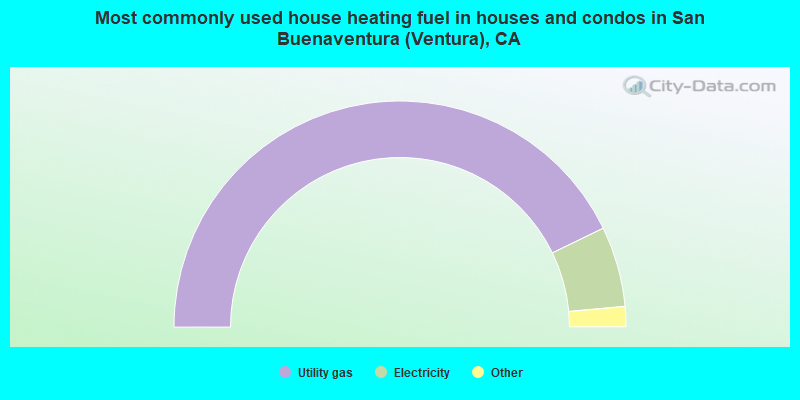
House heating fuel used in houses and condos - Utility gas (%)
House heating fuel used in houses and condos - Bottled, tank, or LP gas (%)
House heating fuel used in houses and condos - Electricity (%)
House heating fuel used in houses and condos - Fuel oil, kerosene, etc. (%)
House heating fuel used in houses and condos - Coal or coke (%)
House heating fuel used in houses and condos - Wood (%)
House heating fuel used in houses and condos - Solar energy (%)
House heating fuel used in houses and condos - Other fuel (%)
House heating fuel used in houses and condos - No fuel used (%)
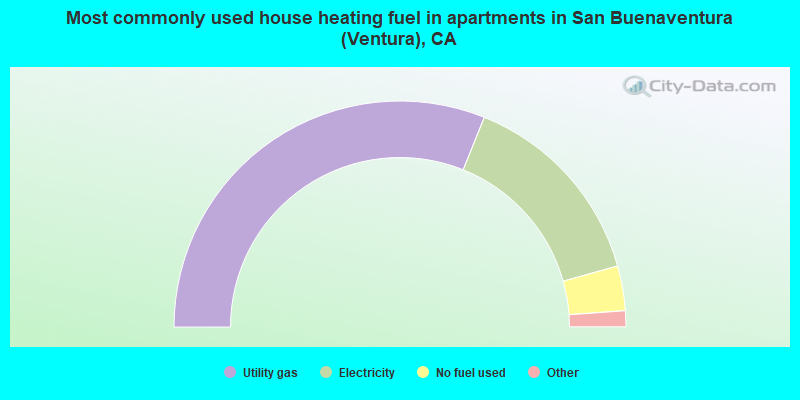
House heating fuel used in apartments - Utility gas (%)
House heating fuel used in apartments - Bottled, tank, or LP gas (%)
House heating fuel used in apartments - Electricity (%)
House heating fuel used in apartments - Fuel oil, kerosene, etc. (%)
House heating fuel used in apartments - Coal or coke (%)
House heating fuel used in apartments - Wood (%)
House heating fuel used in apartments - Solar energy (%)
House heating fuel used in apartments - Other fuel (%)
House heating fuel used in apartments - No fuel used (%)
Armed forces status - In Armed Forces (%)
Armed forces status - Civilian (%)
Armed forces status - Civilian - Veteran (%)
Armed forces status - Civilian - Nonveteran (%)
Fatal accidents locations in years 2005-2021
Fatal accidents locations in 2005
Fatal accidents locations in 2006
Fatal accidents locations in 2007
Fatal accidents locations in 2008
Fatal accidents locations in 2009
Fatal accidents locations in 2010
Fatal accidents locations in 2011
Fatal accidents locations in 2012
Fatal accidents locations in 2013
Fatal accidents locations in 2014
Fatal accidents locations in 2015
Fatal accidents locations in 2016
Fatal accidents locations in 2017
Fatal accidents locations in 2018
Fatal accidents locations in 2019
Fatal accidents locations in 2020
Fatal accidents locations in 2021
Alcohol use - People drinking some alcohol every month (%)
Alcohol use - People not drinking at all (%)
Alcohol use - Average days/month drinking alcohol
Alcohol use - Average drinks/week
Alcohol use - Average days/year people drink much
Audiometry - Average condition of hearing (%)
Audiometry - People that can hear a whisper from across a quiet room (%)
Audiometry - People that can hear normal voice from across a quiet room (%)
Audiometry - Ears ringing, roaring, buzzing (%)
Audiometry - Had a job exposure to loud noise (%)
Audiometry - Had off-work exposure to loud noise (%)
Blood Pressure & Cholesterol - Has high blood pressure (%)
Blood Pressure & Cholesterol - Checking blood pressure at home (%)
Blood Pressure & Cholesterol - Frequently checking blood cholesterol (%)
Blood Pressure & Cholesterol - Has high cholesterol level (%)
Consumer Behavior - Money monthly spent on food at supermarket/grocery store
Consumer Behavior - Money monthly spent on food at other stores
Consumer Behavior - Money monthly spent on eating out
Consumer Behavior - Money monthly spent on carryout/delivered foods
Consumer Behavior - Income spent on food at supermarket/grocery store (%)
Consumer Behavior - Income spent on food at other stores (%)
Consumer Behavior - Income spent on eating out (%)
Consumer Behavior - Income spent on carryout/delivered foods (%)
Current Health Status - General health condition (%)
Current Health Status - Blood donors (%)
Current Health Status - Has blood ever tested for HIV virus (%)
Current Health Status - Left-handed people (%)
Dermatology - People using sunscreen (%)
Diabetes - Diabetics (%)
Diabetes - Had a blood test for high blood sugar (%)
Diabetes - People taking insulin (%)
Diet Behavior & Nutrition - Diet health (%)
Diet Behavior & Nutrition - Milk product consumption (# of products/month)
Diet Behavior & Nutrition - Meals not home prepared (#/week)
Diet Behavior & Nutrition - Meals from fast food or pizza place (#/week)
Diet Behavior & Nutrition - Ready-to-eat foods (#/month)
Diet Behavior & Nutrition - Frozen meals/pizza (#/month)
Drug Use - People that ever used marijuana or hashish (%)
Drug Use - Ever used hard drugs (%)
Drug Use - Ever used any form of cocaine (%)
Drug Use - Ever used heroin (%)
Drug Use - Ever used methamphetamine (%)
Health Insurance - People covered by health insurance (%)
Kidney Conditions-Urology - Avg. # of times urinating at night
Medical Conditions - People with asthma (%)
Medical Conditions - People with anemia (%)
Medical Conditions - People with psoriasis (%)
Medical Conditions - People with overweight (%)
Medical Conditions - Elderly people having difficulties in thinking or remembering (%)
Medical Conditions - People who ever received blood transfusion (%)
Medical Conditions - People having trouble seeing even with glass/contacts (%)
Medical Conditions - People with arthritis (%)
Medical Conditions - People with gout (%)
Medical Conditions - People with congestive heart failure (%)
Medical Conditions - People with coronary heart disease (%)
Medical Conditions - People with angina pectoris (%)
Medical Conditions - People who ever had heart attack (%)
Medical Conditions - People who ever had stroke (%)
Medical Conditions - People with emphysema (%)
Medical Conditions - People with thyroid problem (%)
Medical Conditions - People with chronic bronchitis (%)
Medical Conditions - People with any liver condition (%)
Medical Conditions - People who ever had cancer or malignancy (%)
Mental Health - People who have little interest in doing things (%)
Mental Health - People feeling down, depressed, or hopeless (%)
Mental Health - People who have trouble sleeping or sleeping too much (%)
Mental Health - People feeling tired or having little energy (%)
Mental Health - People with poor appetite or overeating (%)
Mental Health - People feeling bad about themself (%)
Mental Health - People who have trouble concentrating on things (%)
Mental Health - People moving or speaking slowly or too fast (%)
Mental Health - People having thoughts they would be better off dead (%)
Oral Health - Average years since last visit a dentist
Oral Health - People embarrassed because of mouth (%)
Oral Health - People with gum disease (%)
Oral Health - General health of teeth and gums (%)
Oral Health - Average days a week using dental floss/device
Oral Health - Average days a week using mouthwash for dental problem
Oral Health - Average number of teeth
Pesticide Use - Households using pesticides to control insects (%)
Pesticide Use - Households using pesticides to kill weeds (%)
Physical Activity - People doing vigorous-intensity work activities (%)
Physical Activity - People doing moderate-intensity work activities (%)
Physical Activity - People walking or bicycling (%)
Physical Activity - People doing vigorous-intensity recreational activities (%)
Physical Activity - People doing moderate-intensity recreational activities (%)
Physical Activity - Average hours a day doing sedentary activities
Physical Activity - Average hours a day watching TV or videos
Physical Activity - Average hours a day using computer
Physical Functioning - People having limitations keeping them from working (%)
Physical Functioning - People limited in amount of work they can do (%)
Physical Functioning - People that need special equipment to walk (%)
Physical Functioning - People experiencing confusion/memory problems (%)
Physical Functioning - People requiring special healthcare equipment (%)
Prescription Medications - Average number of prescription medicines taking
Preventive Aspirin Use - Adults 40+ taking low-dose aspirin (%)
Reproductive Health - Vaginal deliveries (%)
Reproductive Health - Cesarean deliveries (%)
Reproductive Health - Deliveries resulted in a live birth (%)
Reproductive Health - Pregnancies resulted in a delivery (%)
Reproductive Health - Women breastfeeding newborns (%)
Reproductive Health - Women that had a hysterectomy (%)
Reproductive Health - Women that had both ovaries removed (%)
Reproductive Health - Women that have ever taken birth control pills (%)
Reproductive Health - Women taking birth control pills (%)
Reproductive Health - Women that have ever used Depo-Provera or injectables (%)
Reproductive Health - Women that have ever used female hormones (%)
Sexual Behavior - People 18+ that ever had sex (vaginal, anal, or oral) (%)
Sexual Behavior - Males 18+ that ever had vaginal sex with a woman (%)
Sexual Behavior - Males 18+ that ever performed oral sex on a woman (%)
Sexual Behavior - Males 18+ that ever had anal sex with a woman (%)
Sexual Behavior - Males 18+ that ever had any sex with a man (%)
Sexual Behavior - Females 18+ that ever had vaginal sex with a man (%)
Sexual Behavior - Females 18+ that ever performed oral sex on a man (%)
Sexual Behavior - Females 18+ that ever had anal sex with a man (%)
Sexual Behavior - Females 18+ that ever had any kind of sex with a woman (%)
Sexual Behavior - Average age people first had sex
Sexual Behavior - Average number of female sex partners in lifetime (males 18+)
Sexual Behavior - Average number of female vaginal sex partners in lifetime (males 18+)
Sexual Behavior - Average age people first performed oral sex on a woman (18+)
Sexual Behavior - Average number of woman performed oral sex on in lifetime (18+)
Sexual Behavior - Average number of male sex partners in lifetime (males 18+)
Sexual Behavior - Average number of male anal sex partners in lifetime (males 18+)
Sexual Behavior - Average age people first performed oral sex on a man (18+)
Sexual Behavior - Average number of male oral sex partners in lifetime (18+)
Sexual Behavior - People using protection when performing oral sex (%)
Sexual Behavior - Average number of times people have vaginal or anal sex a year
Sexual Behavior - People having sex without condom (%)
Sexual Behavior - Average number of male sex partners in lifetime (females 18+)
Sexual Behavior - Average number of male vaginal sex partners in lifetime (females 18+)
Sexual Behavior - Average number of female sex partners in lifetime (females 18+)
Sexual Behavior - Circumcised males 18+ (%)
Sleep Disorders - Average hours sleeping at night
Sleep Disorders - People that has trouble sleeping (%)
Smoking-Cigarette Use - People smoking cigarettes (%)
Taste & Smell - People 40+ having problems with smell (%)
Taste & Smell - People 40+ having problems with taste (%)
Taste & Smell - People 40+ that ever had wisdom teeth removed (%)
Taste & Smell - People 40+ that ever had tonsils teeth removed (%)
Taste & Smell - People 40+ that ever had a loss of consciousness because of a head injury (%)
Taste & Smell - People 40+ that ever had a broken nose or other serious injury to face or skull (%)
Taste & Smell - People 40+ that ever had two or more sinus infections (%)
Weight - Average height (inches)
Weight - Average weight (pounds)
Weight - Average BMI
Weight - People that are obese (%)
Weight - People that ever were obese (%)
Weight - People trying to lose weight (%)
60,051 54.8% White alone 34,342 31.4% Hispanic 7,837 7.2% Two or more races 5,491 5.0% Asian alone 1,103 1.0% Black alone 584 0.5% Other race alone 120 0.1% Native Hawaiian and Other
Ancestries: American (8.2%), German (5.9%), English (5.2%), Irish (4.8%), European (3.9%), Italian (3.3%).
Current Local Time:
Land area: 21.1 square miles.
Population density: 5,199 people per square mile (average).
14,794 residents are foreign born (7.8% Latin America , 3.4% Asia ).
This city:
13.6%California:
26.5%
Median real estate property taxes paid for housing units with mortgages in 2022: $4,830 (0.6%)Median real estate property taxes paid for housing units with no mortgage in 2022: $2,822 (0.4%)
Nearest city with pop. 200,000+: Los Angeles, CA
Nearest cities:
Latitude: 34.28 N, Longitude: 119.23 W
Daytime population change due to commuting: +7,061 (+6.4%)Workers who live and work in this city: 28,518 (50.0%)
Area code commonly used in this area: 805
Unemployment in December 2023:
Population change in the 1990s: +7,132 (+7.6%).
Most common occupations in San Buenaventura (Ventura), CA (%)
Both Males Females
Other management occupations, except farmers and farm managers (6.3%)
Cooks and food preparation workers (6.2%)
Retail sales workers, except cashiers (3.3%)
Computer specialists (2.7%)
Building and grounds cleaning and maintenance occupations (2.7%)
Supervisors and other personal care and service workers, except child care workers (2.3%)
Material recording, scheduling, dispatching, and distributing workers (2.1%)
Other management occupations, except farmers and farm managers (6.5%)
Computer specialists (5.0%)
Cooks and food preparation workers (4.4%)
Retail sales workers, except cashiers (4.0%)
Building and grounds cleaning and maintenance occupations (3.4%)
Driver/sales workers and truck drivers (3.2%)
Engineers (3.0%)
Cooks and food preparation workers (8.1%)
Other management occupations, except farmers and farm managers (6.1%)
Supervisors and other personal care and service workers, except child care workers (4.1%)
Secretaries and administrative assistants (3.9%)
Registered nurses (3.6%)
Other office and administrative support workers, including supervisors (3.6%)
Waiters and waitresses (3.3%)
Earthquake activity:
San Buenaventura (Ventura)-area historical earthquake activity is significantly above California state average. It is 6688% greater than the overall U.S. average. On 7/21/1952 at 11:52:14, a magnitude 7.7 (7.7 UK, Class: Major, Intensity: VIII - XII) earthquake occurred 51.8 miles away from San Buenaventura (Ventura) center, causing $50,000,000 total damage On 11/4/1927 at 13:51:53, a magnitude 7.5 (7.5 UK) earthquake occurred 111.8 miles away from the city center On 6/28/1992 at 11:57:34, a magnitude 7.6 (6.2 MB, 7.6 MS, 7.3 MW, Depth: 0.7 mi) earthquake occurred 154.3 miles away from the city center, causing 3 deaths ( 1 shaking deaths, 2 other deaths) and 400 injuries, causing $100,000,000 total damage and $40,000,000 insured lossesOn 10/16/1999 at 09:46:44, a magnitude 7.4 (6.3 MB, 7.4 MS, 7.2 MW, 7.3 ML) earthquake occurred 160.3 miles away from the city center On 1/17/1994 at 12:30:55, a magnitude 6.8 (6.4 MB, 6.8 MS, 6.7 MW, Depth: 11.4 mi, Class: Strong, Intensity: VII - IX) earthquake occurred 38.3 miles away from San Buenaventura (Ventura) center, causing 60 deaths ( 60 shaking deaths) and 7000 injuriesOn 4/18/1906 at 13:12:21, a magnitude 7.9 (7.9 UK) earthquake occurred 332.7 miles away from San Buenaventura (Ventura) center, causing $524,000,000 total damage Magnitude types: body-wave magnitude (MB), local magnitude (ML), surface-wave magnitude (MS), moment magnitude (MW) Natural disasters: The number of natural disasters in Ventura County (36) is a lot greater than the US average (15).Major Disasters (Presidential) Declared: 24Emergencies Declared: 2Fires: 17, Floods: 16, Storms: 10, Landslides: 5, Mudslides: 4, Winter Storms: 4, Freezes: 2, Heavy Rains: 2, Earthquake: 1, Hurricane: 1, Snow: 1, Tornado: 1, Wind: 1, Other: 1 (Note: some incidents may be assigned to more than one category). Hospitals and medical centers near San Buenaventura (Ventura): COASTAL VIEW HEALTHCARE CENTER (Nursing Home, about 1 miles away; VENTURA, CA)
VENTURA CONVALESCENT HOSPITAL (Nursing Home, about 1 miles away; VENTURA, CA)
FMC-VENTURA (Dialysis Facility, about 1 miles away; VENTURA, CA)
ODYSSEY HEALTHCARE OF VENTURA COUNTY (Hospital, about 1 miles away; VENTURA, CA)
MEDITECH HOME HEALTH INC (Home Health Center, about 2 miles away; VENTURA, CA)
ROZE ROOM HOSPICE OF VENTURA (Hospital, about 2 miles away; VENTURA, CA)
VENTURA COUNTY MEDICAL CENTER (about 2 miles away; VENTURA, CA)
Amtrak stations near San Buenaventura (Ventura): 4 miles: VENTURA (HARBOR BLVD. & FIGUEROA ST.) Services: public payphones, call for taxi service.
7 miles: OXNARD (201 E. 4TH ST.) Services: ticket office, fully wheelchair accessible, enclosed waiting area, public restrooms, public payphones, snack bar, free short-term parking, free long-term parking, call for car rental service, call for taxi service, intercity bus service, public transit connection.
11 miles: SANTA PAULA (245 S. PALM AVE.) - Bus Station Services: fully wheelchair accessible, public payphones, full-service food facilities, public transit connection.
Colleges/universities with over 2000 students nearest to San Buenaventura (Ventura):
Ventura College (about 1 miles; Ventura, CA ; Full-time enrollment: 8,460)
Oxnard College (about 9 miles; Oxnard, CA ; FT enrollment: 3,879)
California State University-Channel Islands (about 14 miles; Camarillo, CA ; FT enrollment: 4,163)
California Lutheran University (about 21 miles; Thousand Oaks, CA ; FT enrollment: 4,103)
Moorpark College (about 23 miles; Moorpark, CA ; FT enrollment: 9,338)
Santa Barbara City College (about 29 miles; Santa Barbara, CA ; FT enrollment: 12,568)
Pepperdine University (about 34 miles; Malibu, CA ; FT enrollment: 6,722)
Notable locations in San Buenaventura (Ventura): (A) , Ventura Yacht Club (B) , Pierpont Bay Yacht Club (C) , Olivas Park Golf Course (D) , Saticoy Regional Golf Course (E) , Southern Pacific Station (F) , Ventura Municipal Golf Course (G) , Ventura County Historical Museum (H) , Ventura City Hall (I) , Channel Islands National Park Headquarters and Visitors Center (J) , Albinger Archeological Museum (K) , Ventura Visitors Bureau (L) , Ventura County Pioneer Museum (M) , Ventura County Government Center (N) , Ventura Concert Theater (O) , The Livery Arts Center (P) , Surfing Museum (Q) , Ortega Adobe (R) , E P Foster Library (S) , A J Comstock Fire Museum (T) . Display/hide their locations on the map
Shopping Centers: (1) , Ventura Harbor Shopping Center (2) , Gateway Village Shopping Center (3) , College Square Shopping Center (4) , Victoria Plaza Shopping Center (5) , Telephone Road Plaza Shopping Center (6) , Plaza Shopping Center (7) , Mission Plaza Shopping Center (8) , Figueroa Street Mall Shopping Center (9) . Display/hide their locations on the map
Churches in San Buenaventura (Ventura) include: (A) , Bethel Baptist Church (B) , Calvary Assembly of God Church (C) , Church of Christ (D) , Community Presbyterian Church (E) , Faith Baptist Church (F) , First Church of Christ Scientist (G) , First Church of the Nazarene (H) , First Lutheran Church (I) . Display/hide their locations on the map
Cemetery: (1) . Display/hide its location on the map
Rivers: (A) , Santa Clara River (B) . Display/hide their locations on the map
Parks in San Buenaventura (Ventura) include: (1) , Ocean Avenue Park (2) , Reynolds Park (3) , Seaside Park (4) , West Park Playground (5) , Arundell Linear Park (6) , Barranca Vista Park (7) , Bristol Bay Linear Park (8) , Camino Real Park (9) . Display/hide their locations on the map
Beaches: (A) , South Jetty Beach (B) . Display/hide their locations on the map
Ventura County has a predicted average indoor radon screening level greater than 4 pCi/L (pico curies per liter) - Highest Potential Average household size: This city:
2.6 peopleCalifornia:
2.9 people
Percentage of family households: This city:
64.3%Whole state:
68.7%
Percentage of households with unmarried partners: This city:
7.4%Whole state:
7.2%
Likely homosexual households (counted as self-reported same-sex unmarried-partner households)
Lesbian couples: 0.6% of all households Gay men: 0.3% of all households
People in group quarters in San Buenaventura (Ventura) in 2010:
1,412 people in local jails and other municipal confinement facilities
293 people in nursing facilities/skilled-nursing facilities
252 people in group homes intended for adults
238 people in emergency and transitional shelters (with sleeping facilities) for people experiencing homelessness
187 people in other noninstitutional facilities
62 people in residential treatment centers for adults
20 people in group homes for juveniles (non-correctional)
16 people in workers' group living quarters and job corps centers
9 people in residential treatment centers for juveniles (non-correctional)
4 people in in-patient hospice facilities
People in group quarters in San Buenaventura (Ventura) in 2000:
695 people in local jails and other confinement facilities (including police lockups)
449 people in other group homes
426 people in nursing homes
357 people in other noninstitutional group quarters
112 people in short-term care, detention or diagnostic centers for delinquent children
88 people in homes for the mentally retarded
55 people in mental (psychiatric) hospitals or wards
47 people in homes or halfway houses for drug/alcohol abuse
46 people in training schools for juvenile delinquents
37 people in religious group quarters
18 people in hospitals or wards for drug/alcohol abuse
15 people in unknown juvenile institutions
9 people in other nonhousehold living situations
7 people in homes for the mentally ill
6 people in residential treatment centers for emotionally disturbed children
2 people in hospitals/wards and hospices for chronically ill
2 people in other hospitals or wards for chronically ill
For population 15 years and over in San Buenaventura (Ventura):
Never married: 33.7%Now married: 47.9%Separated: 0.6%Widowed: 5.2%Divorced: 12.5% For population 25 years and over in San Buenaventura (Ventura):
High school or higher: 92.4%Bachelor's degree or higher: 44.8%Graduate or professional degree: 15.2%Unemployed: 3.1%Mean travel time to work (commute): 20.3 minutes
Education Gini index (Inequality in education) Here:
11.7California average:
15.5
Religion statistics for San Buenaventura (Ventura), CA (based on Ventura County data)
Religion Adherents Congregations Catholic 232,571 20 Evangelical Protestant 73,341 268 Other 37,398 118 Mainline Protestant 22,006 65 Black Protestant 1,986 4 Orthodox 1,680 7 None 454,336 -
Source: Clifford Grammich, Kirk Hadaway, Richard Houseal, Dale E.Jones, Alexei Krindatch, Richie Stanley and Richard H.Taylor. 2012. 2010 U.S.Religion Census: Religious Congregations & Membership Study. Association of Statisticians of American Religious Bodies. Jones, Dale E., et al. 2002. Congregations and Membership in the United States 2000. Nashville, TN: Glenmary Research Center. Graphs represent county-level data
Food Environment Statistics: Number of grocery stores : 156Ventura County :
1.97 / 10,000 pop.California :
2.14 / 10,000 pop.
Number of supercenters and club stores : 4Ventura County :
0.05 / 10,000 pop.State :
0.04 / 10,000 pop.
Number of convenience stores (no gas) : 45Ventura County :
0.57 / 10,000 pop.State :
0.62 / 10,000 pop.
Number of convenience stores (with gas) : 134Ventura County :
1.69 / 10,000 pop.California :
1.49 / 10,000 pop.
Number of full-service restaurants : 577Ventura County :
7.28 / 10,000 pop.California :
7.42 / 10,000 pop.
Adult diabetes rate : Ventura County :
7.4%State :
7.3%
Adult obesity rate : Ventura County :
23.1%California :
21.3%
Low-income preschool obesity rate : This county :
19.0%State :
17.9%
Health and Nutrition: Healthy diet rate : San Buenaventura (Ventura):
50.1%California:
49.4%
Average overall health of teeth and gums : This city:
49.0%California:
48.0%
Average BMI : San Buenaventura (Ventura):
28.5State:
28.1
People feeling badly about themselves : People not drinking alcohol at all : San Buenaventura (Ventura):
9.7%California:
11.2%
Average hours sleeping at night : San Buenaventura (Ventura):
6.8State:
6.8
General health condition : San Buenaventura (Ventura):
57.5%California:
56.4%
Average condition of hearing : San Buenaventura (Ventura):
79.9%State:
80.9%
More about Health and Nutrition of San Buenaventura (Ventura), CA Residents
San Buenaventura (Ventura) government finances - Expenditure in 2017 (per resident):
Construction - Regular Highways: $5,072,000 ($46.31)
Water Utilities: $3,359,000 ($30.67)Sewerage: $2,828,000 ($25.82)Housing and Community Development: $683,000 ($6.24)Police Protection: $411,000 ($3.75)Protective Inspection and Regulation - Other: $265,000 ($2.42)Current Operations - Police Protection: $36,232,000 ($330.80)
Water Utilities: $20,739,000 ($189.35)Local Fire Protection: $20,042,000 ($182.99)Central Staff Services: $19,018,000 ($173.64)Parks and Recreation: $15,192,000 ($138.71)General - Other: $15,032,000 ($137.24)Sewerage: $11,980,000 ($109.38)Regular Highways: $10,474,000 ($95.63)Protective Inspection and Regulation - Other: $4,440,000 ($40.54)Housing and Community Development: $3,406,000 ($31.10)Financial Administration: $2,898,000 ($26.46)Solid Waste Management: $1,125,000 ($10.27)Parking Facilities: $831,000 ($7.59)Health - Other: $313,000 ($2.86)Transit Utilities: $199,000 ($1.82)Libraries: $70,000 ($0.64)General - Interest on Debt: $4,228,000 ($38.60)
Intergovernmental to Local - Other - General - Other: $6,405,000 ($58.48)
Other - Natural Resources - Other: $1,506,000 ($13.75)Other - Parks and Recreation: $898,000 ($8.20)Other - Solid Waste Management: $606,000 ($5.53)Other - Police Protection: $110,000 ($1.00)Other Capital Outlay - General - Other: $5,889,000 ($53.77)
Water Utilities: $2,251,000 ($20.55)Sewerage: $1,749,000 ($15.97)Health - Other: $118,000 ($1.08)Local Fire Protection: $82,000 ($0.75)Parks and Recreation: $58,000 ($0.53)Central Staff Services: $17,000 ($0.16)Regular Highways: $13,000 ($0.12)Parking Facilities: $2,000 ($0.02)Water Utilities - Interest on Debt: $2,825,000 ($25.79)
San Buenaventura (Ventura) government finances - Revenue in 2017 (per resident):
Charges - Sewerage: $24,548,000 ($224.13)
Other: $12,850,000 ($117.32)Parks and Recreation: $8,039,000 ($73.40)Regular Highways: $880,000 ($8.03)Parking Facilities: $613,000 ($5.60)Federal Intergovernmental - Other: $1,349,000 ($12.32)
Local Intergovernmental - Water Utilities: $194,000 ($1.77)
Other: $4,000 ($0.04)Miscellaneous - Interest Earnings: $4,235,000 ($38.67)
Special Assessments: $3,930,000 ($35.88)General Revenue - Other: $3,472,000 ($31.70)Fines and Forfeits: $2,090,000 ($19.08)Rents: $1,400,000 ($12.78)Donations From Private Sources: $489,000 ($4.46)Revenue - Water Utilities: $32,028,000 ($292.42)
State Intergovernmental - Other: $3,166,000 ($28.91)
Highways: $2,096,000 ($19.14)General Local Government Support: $187,000 ($1.71)Tax - Property: $36,469,000 ($332.97)
General Sales and Gross Receipts: $26,681,000 ($243.60)Public Utilities Sales: $11,671,000 ($106.56)Other License: $6,549,000 ($59.79)Other Selective Sales: $5,650,000 ($51.59)Other: $2,069,000 ($18.89)Occupation and Business License - Other: $1,678,000 ($15.32)Documentary and Stock Transfer: $581,000 ($5.30)
San Buenaventura (Ventura) government finances - Debt in 2017 (per resident):
Long Term Debt - Beginning Outstanding - Unspecified Public Purpose: $158,567,000 ($1447.74)
Outstanding Unspecified Public Purpose: $151,212,000 ($1380.59)Retired Unspecified Public Purpose: $7,355,000 ($67.15)
San Buenaventura (Ventura) government finances - Cash and Securities in 2017 (per resident):
Bond Funds - Cash and Securities: $45,497,000 ($415.40)
Other Funds - Cash and Securities: $222,150,000 ($2028.27)
Sinking Funds - Cash and Securities: $13,913,000 ($127.03)
4.96% of this county's 2021 resident taxpayers lived in other counties in 2020 ($110,211 average adjusted gross income )
Here:
4.96%California average:
5.19%
0.03% of residents moved from foreign countries ($345 average AGI )Ventura County:
0.03%California average:
0.03%
Top counties from which taxpayers relocated into this county between 2020 and 2021:
5.51% of this county's 2020 resident taxpayers moved to other counties in 2021 ($95,405 average adjusted gross income )
Here:
5.51%California average:
6.14%
0.02% of residents moved to foreign countries ($247 average AGI )Ventura County:
0.02%California average:
0.02%
Top counties to which taxpayers relocated from this county between 2020 and 2021: Strongest AM radio stations in San Buenaventura (Ventura):
KVEN (1450 AM; 1 kW; VENTURA, CA; Owner: CUMULUS LICENSING CORP.)
KUNX (1590 AM; 5 kW; VENTURA, CA; Owner: GOLD COAST BROADCASTING LLC)
KOXR (910 AM; 5 kW; OXNARD, CA; Owner: LAZER BROADCASTING CORPORATION)
KVTA (1520 AM; 10 kW; PORT HUENEME, CA; Owner: GOLD COAST BROADCASTING LLC)
KACD (850 AM; 25 kW; THOUSAND OAKS, CA; Owner: CITICASTERS LICENSES, L.P.)
KSPN (710 AM; 50 kW; LOS ANGELES, CA; Owner: KABC-AM RADIO, INC.)
KLAC (570 AM; 50 kW; LOS ANGELES, CA; Owner: AMFM RADIO LICENSES, L.L.C.)
KNX (1070 AM; 50 kW; LOS ANGELES, CA; Owner: INFINITY BROADCASTING OPERATIONS, INC.)
KFWB (980 AM; 50 kW; LOS ANGELES, CA; Owner: INFINITY BROADCASTING OPERATIONS, INC.)
KIRN (670 AM; 35 kW; SIMI VALLEY, CA; Owner: LOTUS OXNARD CORP.)
KFI (640 AM; 50 kW; LOS ANGELES, CA; Owner: CAPSTAR TX LIMITED PARTNERSHIP)
KGDP (660 AM; 50 kW; ORCUTT, CA; Owner: RADIO REPRESENTATIVES, INC.)
KSUR (1260 AM; 25 kW; BEVERLY HILLS, CA)
Strongest FM radio stations in San Buenaventura (Ventura):
KSSC (107.1 FM; VENTURA, CA; Owner: ENTRAVISION HOLDINGS, LLC)
KMLA (103.7 FM; EL RIO, CA; Owner: GOLD COAST RADIO, L.L.C.)
KDAR (98.3 FM; OXNARD, CA; Owner: ATEP RADIO, INC.)
KCAQ (104.7 FM; OXNARD, CA; Owner: GOLD COAST BROADCASTING LLC)
KOCP (95.9 FM; CAMARILLO, CA; Owner: GOLD COAST BROADCASTING LLC)
KFYV (105.5 FM; OJAI, CA; Owner: GOLD COAST BROADCASTING LLC)
K271AC (102.1 FM; OJAI, CA; Owner: SANTA MONICA COMMUNITY COLLEGE DIST.)
KHAY (100.7 FM; VENTURA, CA; Owner: CUMULUS LICENSING CORP.)
KFYV-FM2 (105.5 FM; VENTURA, CA; Owner: BUENA VENTURA, INC.)
KLFH (89.5 FM; OJAI, CA; Owner: SHEPHERD COMMUNICATIONS, INC.)
KMRO (90.3 FM; CAMARILLO, CA; Owner: THE ASSOCIATION FOR COMMUNITY EDUCATION, INC.)
KCPB (91.1 FM; THOUSAND OAKS, CA; Owner: UNIVERSITY OF SOUTHERN CALIFORNIA)
KCZN (96.7 FM; SANTA PAULA, CA; Owner: LAZER BROADCASTING CORPORATION)
K272DI (102.3 FM; FILLMORE, CA; Owner: SANTA MONICA COMMUNITY COLLEGE DIST.)
K210CH (89.9 FM; OAK VIEW, CA; Owner: LIFE ON THE WAY COMMUNICATIONS, INC.)
K254AH (98.7 FM; ISLA VISTA, CA; Owner: PACIFICA FOUNDATION, INC.)
KXLM (102.9 FM; OXNARD, CA; Owner: KEXT BROADCASTERS, INC.)
K293AG (106.5 FM; TAFT, CA; Owner: CENTRO CRISTIANO DE FE, INC.)
KBBY-FM (95.1 FM; VENTURA, CA; Owner: CUMULUS LICENSING CORP.)
KCRU (89.1 FM; OXNARD, CA; Owner: SANTA MONICA COMMUNITY COLLEGE DISTRICT)
TV broadcast stations around San Buenaventura (Ventura):
KJLA (Channel 57; VENTURA, CA; Owner: KJLA, LLC)
KTRO-LP (Channel 50; LANCASTER, CA; Owner: ROBERT D. ADELMAN)
KADY-TV (Channel 63; OXNARD, CA; Owner: BILTMORE BROADCASTING, L.L.C.)
K25GV (Channel 25; OXNARD, CA; Owner: CAPITAL BROADCASTING CORP.)
K45DU (Channel 45; VENTURA, CA; Owner: TRINITY BROADCASTING NETWORK)
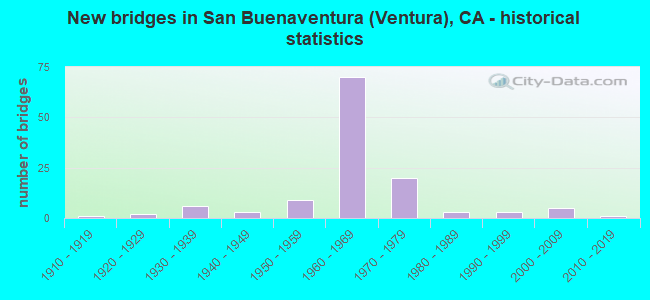
National Bridge Inventory (NBI) Statistics 123 Number of bridges1,791ft / 546m Total length $2,320,000 Total costs4,051,093 Total average daily traffic297,601 Total average daily truck traffic
New bridges - historical statistics
1 1910-1919 2 1920-1929 6 1930-1939 3 1940-1949 9 1950-1959 70 1960-1969 20 1970-1979 3 1980-1989 3 1990-1999 5 2000-2009 1 2010-2019
See full National Bridge Inventory statistics for San Buenaventura (Ventura), CA
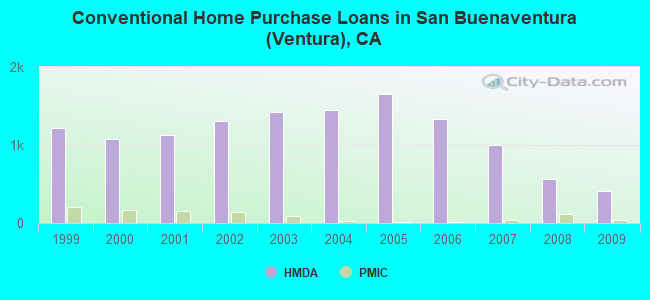
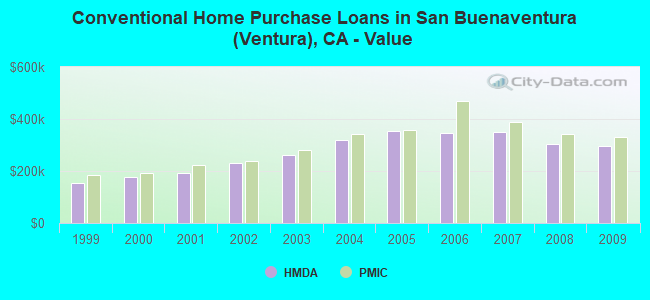
Home Mortgage Disclosure Act Aggregated Statistics For Year 2009(Based on 12 full and 14 partial tracts) A) FHA, FSA/RHS & VA B) Conventional C) Refinancings D) Home Improvement Loans E) Loans on Dwellings For 5+ Families F) Non-occupant Loans on G) Loans On Manufactured Number Average Value Number Average Value Number Average Value Number Average Value Number Average Value Number Average Value Number Average Value
LOANS ORIGINATED 178 $340,379 407 $296,327 1,620 $292,773 82 $254,362 4 $5,249,442 215 $280,156 27 $110,696 APPLICATIONS APPROVED, NOT ACCEPTED 22 $306,748 45 $244,688 145 $311,539 8 $197,135 0 $0 23 $253,284 13 $93,375 APPLICATIONS DENIED 31 $282,916 101 $253,220 435 $334,509 21 $136,501 0 $0 81 $295,777 29 $122,233 APPLICATIONS WITHDRAWN 22 $354,743 78 $311,993 297 $331,034 12 $229,418 0 $0 38 $262,397 3 $164,370 FILES CLOSED FOR INCOMPLETENESS 9 $287,187 9 $242,373 76 $325,082 4 $202,410 0 $0 7 $254,270 2 $92,620
Aggregated Statistics For Year 2008(Based on 12 full and 14 partial tracts) A) FHA, FSA/RHS & VA B) Conventional C) Refinancings D) Home Improvement Loans E) Loans on Dwellings For 5+ Families F) Non-occupant Loans on G) Loans On Manufactured Number Average Value Number Average Value Number Average Value Number Average Value Number Average Value Number Average Value Number Average Value
LOANS ORIGINATED 112 $337,784 562 $303,034 711 $297,330 49 $231,443 10 $1,001,531 179 $281,629 37 $116,633 APPLICATIONS APPROVED, NOT ACCEPTED 12 $405,929 118 $274,392 123 $308,026 10 $180,484 1 $1,059,790 20 $360,046 34 $153,766 APPLICATIONS DENIED 33 $355,627 175 $298,682 445 $371,025 49 $211,951 0 $0 74 $305,691 37 $136,208 APPLICATIONS WITHDRAWN 24 $323,008 118 $299,108 181 $330,949 28 $229,200 3 $754,577 40 $274,714 2 $133,500 FILES CLOSED FOR INCOMPLETENESS 6 $318,368 29 $370,467 60 $374,733 4 $86,592 1 $850,030 7 $318,007 1 $429,010
Aggregated Statistics For Year 2007(Based on 12 full and 14 partial tracts) A) FHA, FSA/RHS & VA B) Conventional C) Refinancings D) Home Improvement Loans E) Loans on Dwellings For 5+ Families F) Non-occupant Loans on G) Loans On Manufactured Number Average Value Number Average Value Number Average Value Number Average Value Number Average Value Number Average Value Number Average Value
LOANS ORIGINATED 1 $204,000 995 $349,976 1,317 $336,589 180 $202,780 18 $1,661,798 306 $381,910 47 $93,067 APPLICATIONS APPROVED, NOT ACCEPTED 0 $0 244 $316,766 334 $351,138 45 $215,896 1 $553,730 59 $347,138 24 $115,110 APPLICATIONS DENIED 1 $368,000 314 $332,963 940 $380,366 81 $241,720 1 $1,441,710 133 $389,505 37 $121,207 APPLICATIONS WITHDRAWN 1 $105,800 159 $338,469 379 $375,519 39 $281,065 2 $867,160 51 $386,564 10 $165,184 FILES CLOSED FOR INCOMPLETENESS 0 $0 38 $383,836 130 $389,232 7 $283,506 0 $0 14 $368,880 0 $0
Aggregated Statistics For Year 2006(Based on 12 full and 14 partial tracts) A) FHA, FSA/RHS & VA B) Conventional C) Refinancings D) Home Improvement Loans E) Loans on Dwellings For 5+ Families F) Non-occupant Loans on G) Loans On Manufactured Number Average Value Number Average Value Number Average Value Number Average Value Number Average Value Number Average Value Number Average Value
LOANS ORIGINATED 1 $321,000 1,335 $344,356 1,941 $351,781 291 $243,031 14 $2,701,253 373 $381,242 51 $115,538 APPLICATIONS APPROVED, NOT ACCEPTED 0 $0 260 $344,914 393 $356,900 45 $243,066 0 $0 52 $345,611 23 $91,349 APPLICATIONS DENIED 0 $0 404 $340,007 831 $383,459 142 $219,358 0 $0 101 $373,109 36 $142,799 APPLICATIONS WITHDRAWN 0 $0 388 $309,456 592 $380,782 64 $234,618 0 $0 101 $345,032 13 $123,122 FILES CLOSED FOR INCOMPLETENESS 0 $0 35 $382,267 146 $368,857 10 $222,656 0 $0 12 $517,748 8 $182,095
Aggregated Statistics For Year 2005(Based on 12 full and 14 partial tracts) A) FHA, FSA/RHS & VA B) Conventional C) Refinancings D) Home Improvement Loans E) Loans on Dwellings For 5+ Families F) Non-occupant Loans on G) Loans On Manufactured Number Average Value Number Average Value Number Average Value Number Average Value Number Average Value Number Average Value Number Average Value
LOANS ORIGINATED 2 $230,415 1,655 $355,067 2,416 $335,444 307 $241,062 18 $1,553,002 422 $361,099 57 $115,324 APPLICATIONS APPROVED, NOT ACCEPTED 0 $0 242 $338,608 335 $319,153 38 $243,308 0 $0 44 $272,817 21 $119,571 APPLICATIONS DENIED 1 $232,000 445 $348,776 745 $348,686 102 $216,241 2 $2,112,500 98 $360,679 51 $141,771 APPLICATIONS WITHDRAWN 2 $202,380 329 $331,155 655 $318,619 91 $277,414 3 $718,080 72 $359,498 34 $133,498 FILES CLOSED FOR INCOMPLETENESS 0 $0 55 $340,202 230 $362,533 10 $209,750 0 $0 14 $327,869 2 $64,000
Aggregated Statistics For Year 2004(Based on 12 full and 14 partial tracts) A) FHA, FSA/RHS & VA B) Conventional C) Refinancings D) Home Improvement Loans E) Loans on Dwellings For 5+ Families F) Non-occupant Loans on G) Loans On Manufactured Number Average Value Number Average Value Number Average Value Number Average Value Number Average Value Number Average Value Number Average Value
LOANS ORIGINATED 6 $230,740 1,447 $318,613 3,110 $279,857 269 $202,576 15 $1,761,730 500 $302,072 57 $96,152 APPLICATIONS APPROVED, NOT ACCEPTED 0 $0 224 $307,787 488 $274,452 37 $143,611 2 $622,155 63 $262,458 30 $103,631 APPLICATIONS DENIED 0 $0 323 $292,678 729 $286,652 104 $112,036 1 $11,472,710 109 $266,652 38 $105,307 APPLICATIONS WITHDRAWN 2 $138,310 238 $287,168 784 $277,342 75 $142,546 1 $1,321,210 53 $337,108 53 $93,800 FILES CLOSED FOR INCOMPLETENESS 0 $0 45 $828,550 165 $299,848 17 $113,466 0 $0 11 $278,426 2 $146,090
Aggregated Statistics For Year 2003(Based on 12 full and 14 partial tracts) A) FHA, FSA/RHS & VA B) Conventional C) Refinancings D) Home Improvement Loans E) Loans on Dwellings For 5+ Families F) Non-occupant Loans on Number Average Value Number Average Value Number Average Value Number Average Value Number Average Value Number Average Value
LOANS ORIGINATED 23 $199,392 1,429 $260,484 6,666 $223,721 107 $73,360 27 $1,150,649 787 $214,177 APPLICATIONS APPROVED, NOT ACCEPTED 1 $92,300 198 $261,550 766 $233,117 30 $77,709 0 $0 91 $240,069 APPLICATIONS DENIED 1 $184,000 234 $243,105 869 $222,945 74 $46,641 1 $549,890 96 $228,929 APPLICATIONS WITHDRAWN 4 $217,835 228 $216,151 1,103 $225,562 30 $95,094 1 $1,476,640 95 $226,252 FILES CLOSED FOR INCOMPLETENESS 0 $0 34 $284,424 199 $244,099 8 $119,028 1 $7,298,640 20 $206,880
Aggregated Statistics For Year 2002(Based on 10 full and 9 partial tracts) A) FHA, FSA/RHS & VA B) Conventional C) Refinancings D) Home Improvement Loans E) Loans on Dwellings For 5+ Families F) Non-occupant Loans on Number Average Value Number Average Value Number Average Value Number Average Value Number Average Value Number Average Value
LOANS ORIGINATED 61 $175,905 1,307 $231,337 3,218 $213,068 99 $69,278 18 $1,012,849 424 $214,833 APPLICATIONS APPROVED, NOT ACCEPTED 4 $184,228 152 $228,072 386 $218,478 21 $45,630 0 $0 47 $205,801 APPLICATIONS DENIED 4 $191,018 190 $197,140 470 $190,637 62 $43,539 2 $652,150 70 $230,329 APPLICATIONS WITHDRAWN 11 $185,578 201 $184,641 501 $206,124 22 $36,953 2 $1,008,320 49 $204,005 FILES CLOSED FOR INCOMPLETENESS 0 $0 41 $217,652 142 $207,677 3 $49,610 1 $1,274,750 22 $193,016
Aggregated Statistics For Year 2001(Based on 10 full and 9 partial tracts) A) FHA, FSA/RHS & VA B) Conventional C) Refinancings D) Home Improvement Loans E) Loans on Dwellings For 5+ Families F) Non-occupant Loans on Number Average Value Number Average Value Number Average Value Number Average Value Number Average Value Number Average Value
LOANS ORIGINATED 154 $170,241 1,130 $193,587 2,355 $194,149 112 $50,336 11 $1,021,624 341 $177,246 APPLICATIONS APPROVED, NOT ACCEPTED 13 $181,284 136 $191,063 285 $194,663 25 $56,278 1 $20,500,000 43 $165,673 APPLICATIONS DENIED 13 $159,707 135 $174,777 443 $182,736 53 $36,612 1 $655,160 32 $182,838 APPLICATIONS WITHDRAWN 14 $194,476 175 $180,654 478 $168,961 32 $67,336 3 $756,510 49 $176,370 FILES CLOSED FOR INCOMPLETENESS 5 $153,014 30 $215,945 121 $187,119 2 $29,000 4 $3,709,662 11 $201,077
Aggregated Statistics For Year 2000(Based on 10 full and 9 partial tracts) A) FHA, FSA/RHS & VA B) Conventional C) Refinancings D) Home Improvement Loans E) Loans on Dwellings For 5+ Families F) Non-occupant Loans on Number Average Value Number Average Value Number Average Value Number Average Value Number Average Value Number Average Value
LOANS ORIGINATED 192 $146,481 1,074 $178,148 558 $147,758 96 $37,090 12 $544,057 158 $163,823 APPLICATIONS APPROVED, NOT ACCEPTED 10 $201,353 119 $193,154 89 $168,479 44 $34,427 0 $0 8 $204,109 APPLICATIONS DENIED 10 $125,510 205 $166,119 258 $141,178 61 $27,175 4 $608,202 31 $158,380 APPLICATIONS WITHDRAWN 33 $154,844 145 $172,039 182 $137,168 13 $53,890 0 $0 17 $185,479 FILES CLOSED FOR INCOMPLETENESS 6 $146,545 46 $165,240 46 $171,080 5 $25,624 2 $1,350,260 8 $133,962
Aggregated Statistics For Year 1999(Based on 7 full and 18 partial tracts) A) FHA, FSA/RHS & VA B) Conventional C) Refinancings D) Home Improvement Loans E) Loans on Dwellings For 5+ Families F) Non-occupant Loans on Number Average Value Number Average Value Number Average Value Number Average Value Number Average Value Number Average Value
LOANS ORIGINATED 231 $143,406 1,223 $155,658 1,433 $148,897 147 $27,525 10 $1,628,839 241 $143,983 APPLICATIONS APPROVED, NOT ACCEPTED 7 $150,236 139 $142,648 254 $151,191 39 $26,262 0 $0 40 $129,279 APPLICATIONS DENIED 25 $144,768 202 $149,585 413 $128,266 56 $30,003 3 $478,723 41 $153,325 APPLICATIONS WITHDRAWN 26 $138,520 200 $160,380 365 $128,612 19 $27,600 2 $531,105 49 $137,191 FILES CLOSED FOR INCOMPLETENESS 1 $274,350 37 $160,552 87 $153,244 2 $20,850 2 $2,314,165 10 $137,935
Detailed mortgage data for all 25 tracts in San Buenaventura Ventura, CA
Private Mortgage Insurance Companies Aggregated Statistics For Year 2009(Based on 9 full and 13 partial tracts) A) Conventional B) Refinancings C) Non-occupant Loans on Number Average Value Number Average Value Number Average Value
LOANS ORIGINATED 41 $331,556 7 $357,630 1 $417,000 APPLICATIONS APPROVED, NOT ACCEPTED 16 $307,482 2 $428,000 1 $376,000 APPLICATIONS DENIED 6 $305,330 2 $355,700 1 $301,000 APPLICATIONS WITHDRAWN 3 $289,187 3 $317,010 0 $0 FILES CLOSED FOR INCOMPLETENESS 2 $428,540 0 $0 0 $0
Aggregated Statistics For Year 2008(Based on 11 full and 13 partial tracts) A) Conventional B) Refinancings C) Non-occupant Loans on Number Average Value Number Average Value Number Average Value
LOANS ORIGINATED 109 $343,367 19 $332,917 4 $260,288 APPLICATIONS APPROVED, NOT ACCEPTED 29 $334,812 17 $436,137 2 $368,000 APPLICATIONS DENIED 19 $316,956 2 $410,500 3 $263,043 APPLICATIONS WITHDRAWN 6 $296,247 3 $347,667 0 $0 FILES CLOSED FOR INCOMPLETENESS 5 $384,472 0 $0 0 $0
Aggregated Statistics For Year 2007(Based on 9 full and 12 partial tracts) A) Conventional B) Refinancings C) Non-occupant Loans on Number Average Value Number Average Value Number Average Value
LOANS ORIGINATED 36 $387,293 32 $396,835 5 $387,600 APPLICATIONS APPROVED, NOT ACCEPTED 7 $423,103 11 $426,871 0 $0 APPLICATIONS DENIED 2 $552,245 2 $398,410 1 $306,000 APPLICATIONS WITHDRAWN 3 $471,333 7 $428,343 1 $538,680 FILES CLOSED FOR INCOMPLETENESS 0 $0 1 $210,540 0 $0
Aggregated Statistics For Year 2006(Based on 6 full and 11 partial tracts) A) Conventional B) Refinancings C) Non-occupant Loans on D) Loans On Manufactured Number Average Value Number Average Value Number Average Value Number Average Value
LOANS ORIGINATED 19 $467,353 13 $442,778 1 $333,000 0 $0 APPLICATIONS APPROVED, NOT ACCEPTED 8 $397,352 13 $472,179 2 $368,000 0 $0 APPLICATIONS DENIED 1 $535,710 7 $342,000 1 $285,000 1 $268,510 APPLICATIONS WITHDRAWN 4 $427,022 4 $490,898 1 $598,880 0 $0 FILES CLOSED FOR INCOMPLETENESS 0 $0 1 $521,850 0 $0 0 $0
Aggregated Statistics For Year 2005(Based on 7 full and 7 partial tracts) A) Conventional B) Refinancings C) Non-occupant Loans on D) Loans On Manufactured Number Average Value Number Average Value Number Average Value Number Average Value
LOANS ORIGINATED 18 $359,615 13 $370,006 3 $359,360 1 $185,680 APPLICATIONS APPROVED, NOT ACCEPTED 2 $549,150 3 $364,963 0 $0 0 $0 APPLICATIONS DENIED 1 $428,000 1 $695,000 1 $428,000 0 $0 APPLICATIONS WITHDRAWN 1 $437,250 3 $440,143 0 $0 0 $0 FILES CLOSED FOR INCOMPLETENESS 0 $0 0 $0 0 $0 0 $0
Aggregated Statistics For Year 2004(Based on 10 full and 11 partial tracts) A) Conventional B) Refinancings C) Non-occupant Loans on D) Loans On Manufactured Number Average Value Number Average Value Number Average Value Number Average Value
LOANS ORIGINATED 30 $340,754 14 $339,587 5 $264,504 1 $172,090 APPLICATIONS APPROVED, NOT ACCEPTED 14 $278,056 9 $270,068 1 $383,000 0 $0 APPLICATIONS DENIED 0 $0 2 $281,430 1 $383,000 0 $0 APPLICATIONS WITHDRAWN 6 $325,960 2 $338,225 0 $0 0 $0 FILES CLOSED FOR INCOMPLETENESS 1 $415,000 0 $0 0 $0 0 $0
Aggregated Statistics For Year 2003(Based on 11 full and 14 partial tracts) A) Conventional B) Refinancings C) Non-occupant Loans on Number Average Value Number Average Value Number Average Value
LOANS ORIGINATED 86 $282,387 45 $265,834 4 $268,482 APPLICATIONS APPROVED, NOT ACCEPTED 22 $301,174 22 $254,013 2 $373,725 APPLICATIONS DENIED 1 $350,330 2 $276,020 0 $0 APPLICATIONS WITHDRAWN 6 $247,275 3 $244,593 0 $0 FILES CLOSED FOR INCOMPLETENESS 0 $0 1 $287,040 0 $0
Aggregated Statistics For Year 2002(Based on 10 full and 9 partial tracts) A) Conventional B) Refinancings C) Non-occupant Loans on Number Average Value Number Average Value Number Average Value
LOANS ORIGINATED 135 $238,529 42 $245,460 9 $192,406 APPLICATIONS APPROVED, NOT ACCEPTED 22 $250,820 12 $220,697 2 $161,525 APPLICATIONS DENIED 4 $186,020 4 $243,108 3 $262,163 APPLICATIONS WITHDRAWN 4 $238,865 2 $235,720 0 $0 FILES CLOSED FOR INCOMPLETENESS 1 $124,000 1 $108,220 0 $0
Aggregated Statistics For Year 2001(Based on 10 full and 9 partial tracts) A) Conventional B) Refinancings C) Non-occupant Loans on Number Average Value Number Average Value Number Average Value
LOANS ORIGINATED 158 $223,292 61 $219,393 6 $257,070 APPLICATIONS APPROVED, NOT ACCEPTED 34 $213,196 25 $211,692 1 $104,000 APPLICATIONS DENIED 3 $160,823 6 $224,873 0 $0 APPLICATIONS WITHDRAWN 7 $225,397 3 $213,950 1 $200,000 FILES CLOSED FOR INCOMPLETENESS 0 $0 0 $0 0 $0
Aggregated Statistics For Year 2000(Based on 10 full and 9 partial tracts) A) Conventional B) Refinancings C) Non-occupant Loans on Number Average Value Number Average Value Number Average Value
LOANS ORIGINATED 166 $192,288 35 $192,594 13 $157,188 APPLICATIONS APPROVED, NOT ACCEPTED 28 $206,959 14 $182,806 5 $179,402 APPLICATIONS DENIED 11 $208,875 3 $149,917 2 $161,950 APPLICATIONS WITHDRAWN 7 $187,496 0 $0 1 $114,000 FILES CLOSED FOR INCOMPLETENESS 3 $128,377 0 $0 0 $0
Aggregated Statistics For Year 1999(Based on 7 full and 17 partial tracts) A) Conventional B) Refinancings C) Non-occupant Loans on Number Average Value Number Average Value Number Average Value
LOANS ORIGINATED 203 $184,430 107 $169,803 7 $128,527 APPLICATIONS APPROVED, NOT ACCEPTED 28 $167,202 35 $177,424 4 $143,910 APPLICATIONS DENIED 19 $162,185 8 $191,505 2 $122,780 APPLICATIONS WITHDRAWN 13 $157,782 8 $179,136 1 $138,880 FILES CLOSED FOR INCOMPLETENESS 4 $154,285 3 $170,013 1 $139,000
San Buenaventura (Ventura) compared to California state average:
Unemployed percentage significantly below state average. Black race population percentage significantly below state average. Median age above state average. Foreign-born population percentage below state average. Percentage of population with a bachelor's degree or higher above state average. San Buenaventura (Ventura) on our top lists :
#16 on the list of "Top 101 cities with largest percentage of males in industries: utilities (population 50,000+)"
#33 on the list of "Top 101 cities with largest percentage of females in occupations: personal care and service occupations (population 50,000+)"
#36 on the list of "Top 101 cities with the most residents born in Other South Eastern Asia (population 500+)"
#37 on the list of "Top 101 cities with largest percentage of males in occupations: fire fighting and prevention workers including supervisors (population 50,000+)"
#52 on the list of "Top 101 cities with largest percentage of males in occupations: arts, design, entertainment, sports, and media occupations (population 50,000+)"
#57 on the list of "Top 101 cities with the lowest average snowfall in a year (population 50,000+)"
#61 on the list of "Top 101 cities with largest percentage of females in occupations: community and social service occupations (population 50,000+)"
#65 on the list of "Top 101 cities with largest percentage of males in industries: agriculture, forestry, fishing and hunting (population 50,000+)"
#69 on the list of "Top 101 cities with largest percentage of females in industries: arts, entertainment, and recreation (population 50,000+)"
#73 on the list of "Top 101 cities with largest percentage of females in industries: agriculture, forestry, fishing and hunting (population 50,000+)"
#74 on the list of "Top 101 cities with the lowest average wind speeds (population 50,000+)"
#83 on the list of "Top 101 cities with the largest percentage of likely lesbian couples (counted as self-reported female-female unmarried-partner households) (population 50,000+)"
#84 on the list of "Top 101 cities with largest percentage of females in occupations: arts, design, entertainment, sports, and media occupations (population 50,000+)"
#86 on the list of "Top 101 cities with the largest differences between daily high and daily low temperatures (population 50,000+)"
#88 on the list of "Top 101 cities with the smallest temperature differences during a year (population 50,000+)"
#16 on the list of "Top 101 counties with the highest lead air pollution readings in 2012 (µg/m3 )"
#18 on the list of "Top 101 counties with the lowest lead air pollution readings in 2012 (µg/m3 )"
#38 on the list of "Top 101 counties with the highest Particulate Matter (PM10 ) Annual air pollution readings in 2012 (µg/m3 )"
#44 on the list of "Top 101 counties with the highest surface withdrawal of fresh water for public supply (pop. 50,000+)"
#44 on the list of "Top 101 counties with the most Other congregations (pop. 50,000+)"
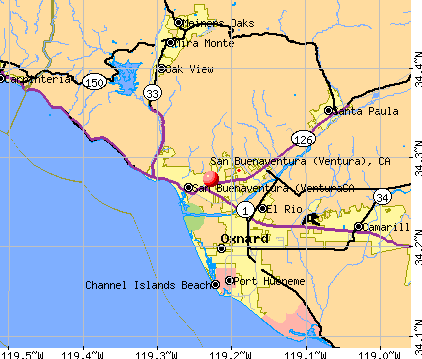


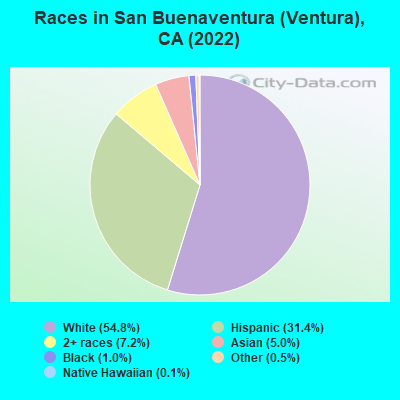
 Recent articles from our blog. Our writers, many of them Ph.D. graduates or candidates, create easy-to-read articles on a wide variety of topics.
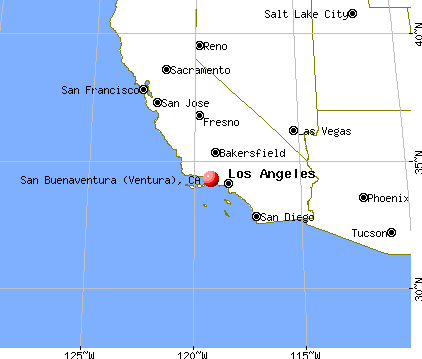
 (50.5 miles
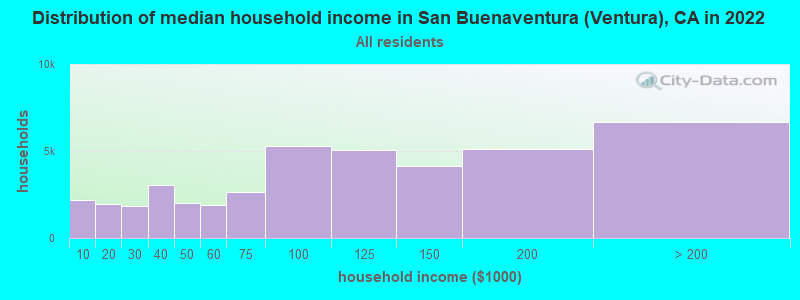
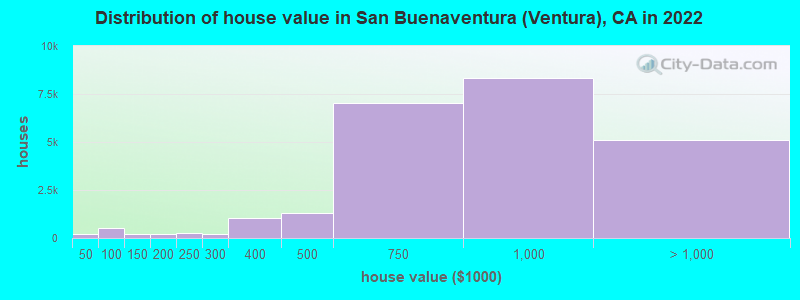
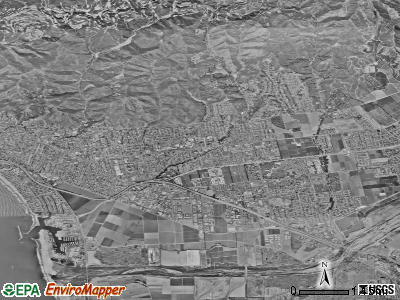
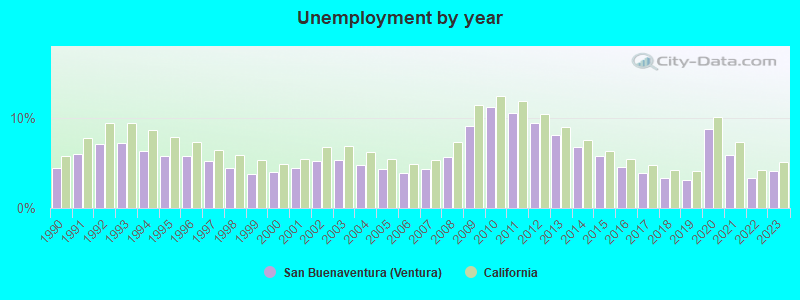
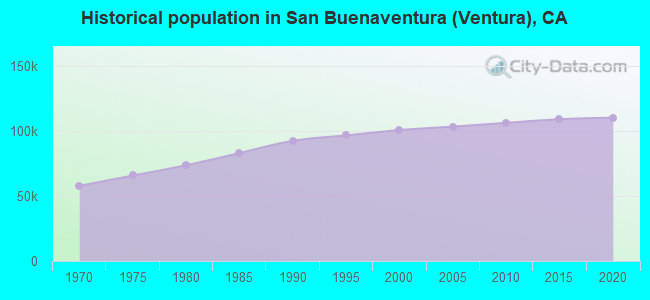
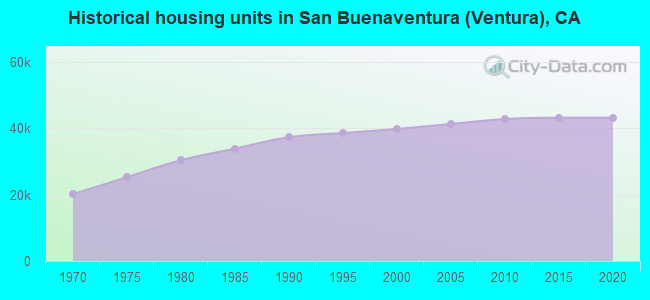
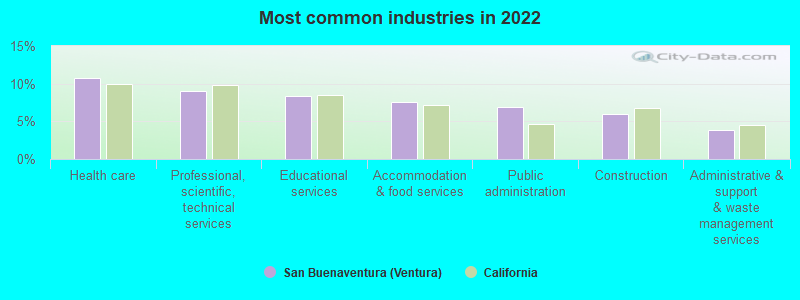
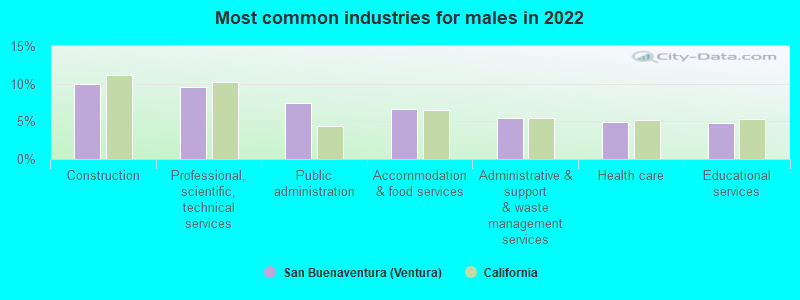
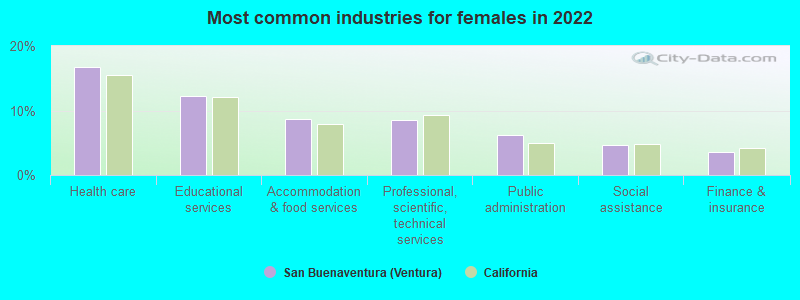
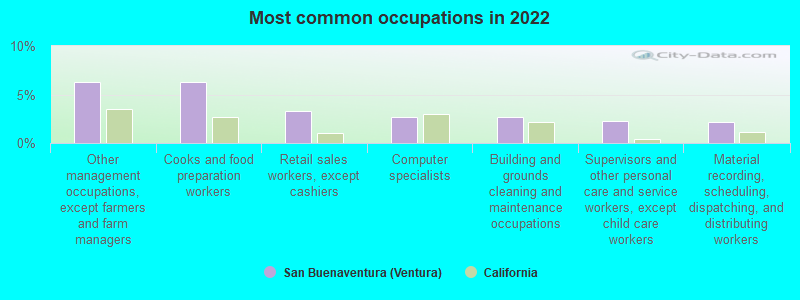
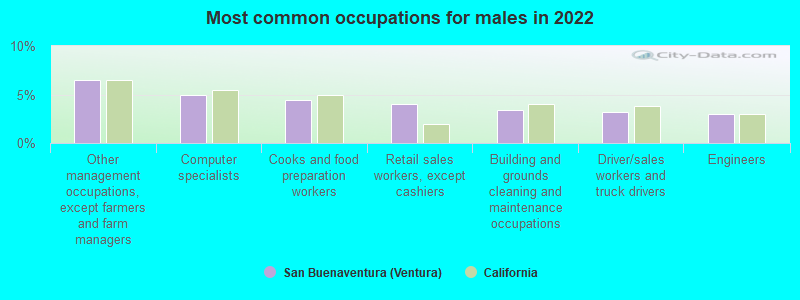
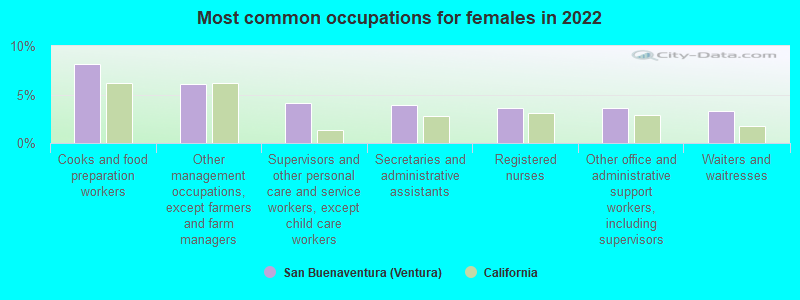
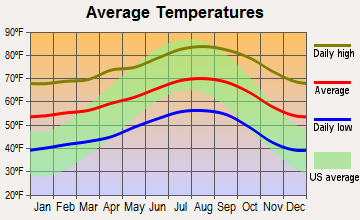
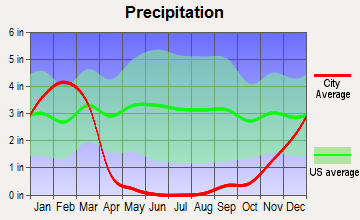
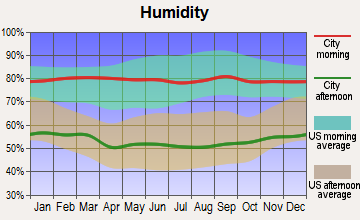
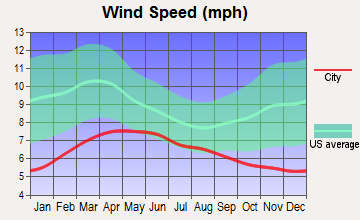
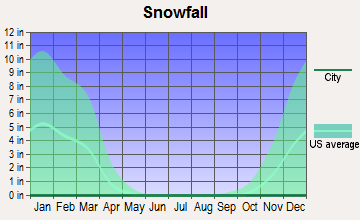
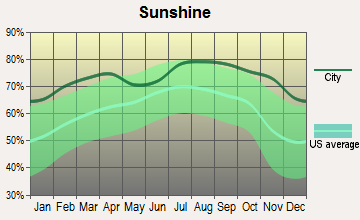
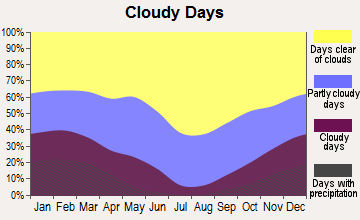
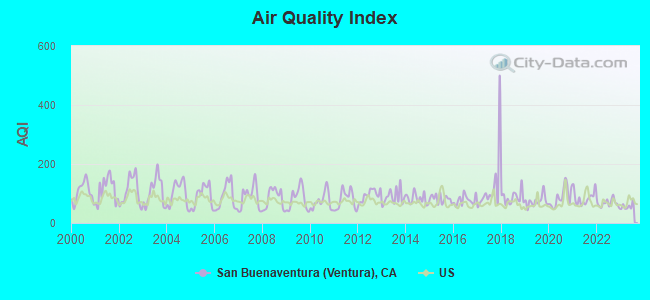
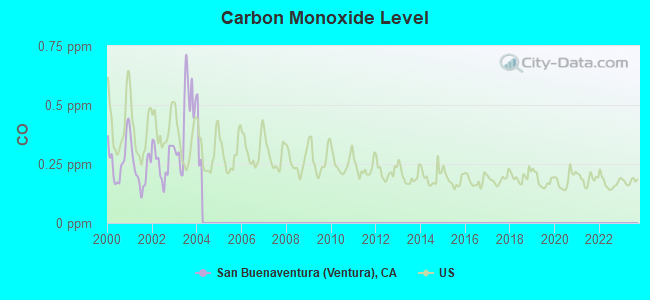
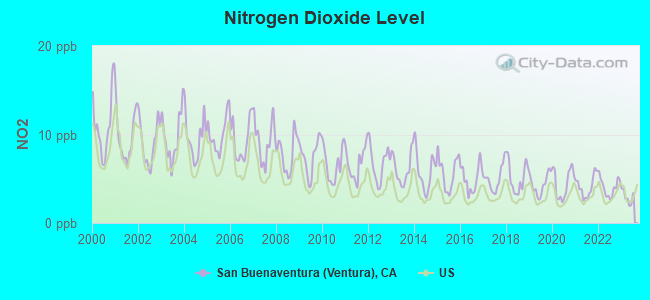
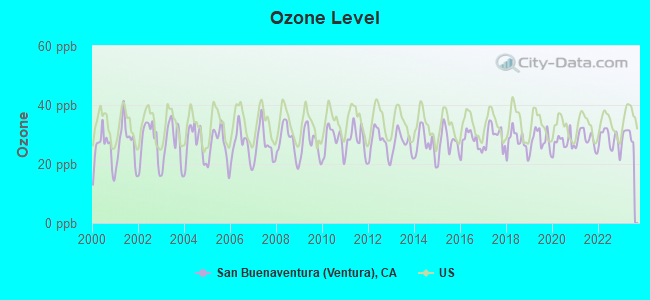
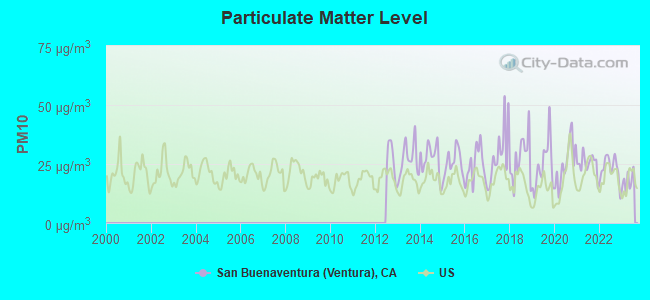
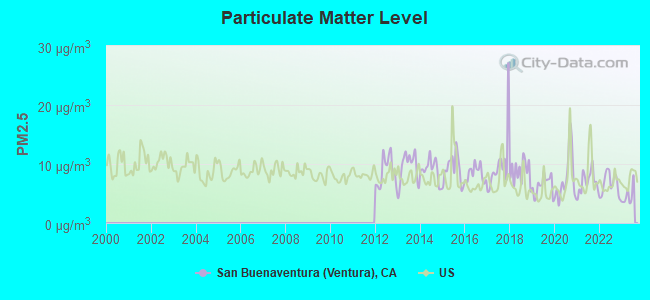
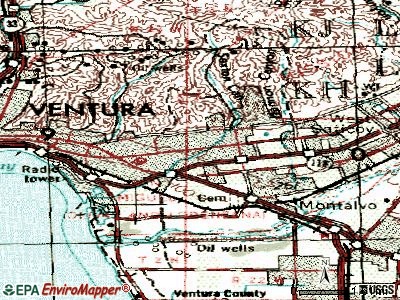
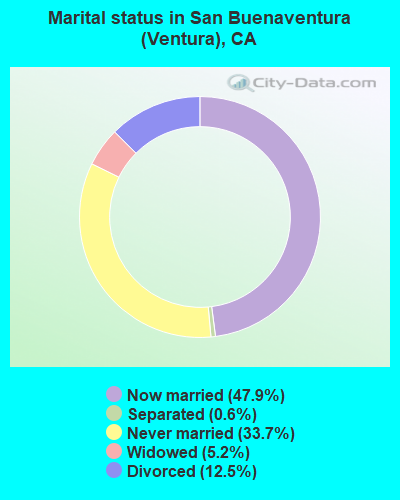
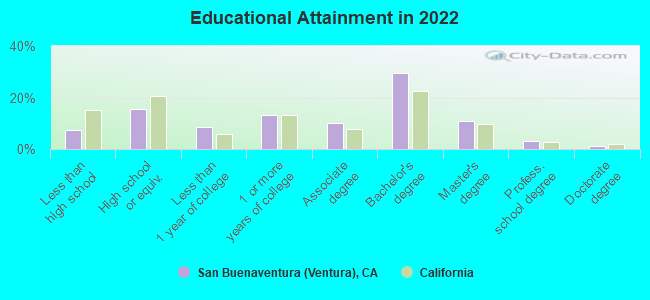
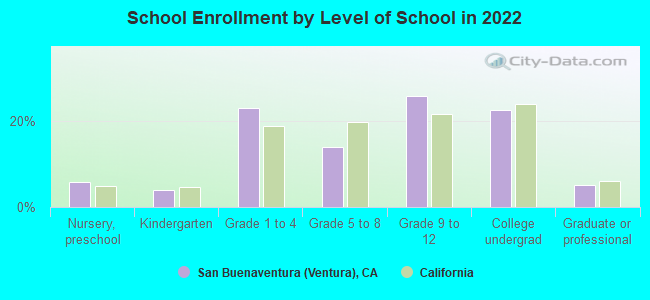
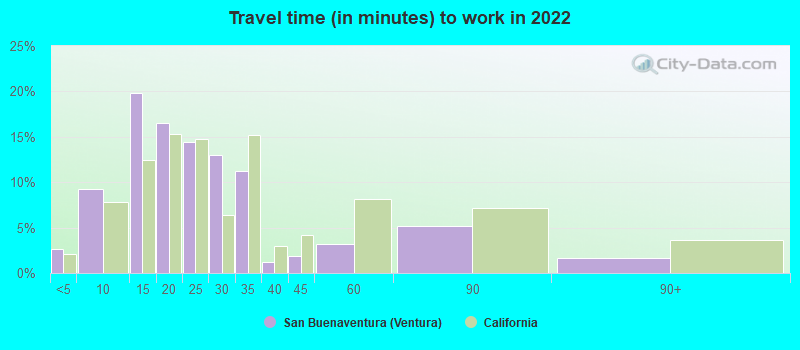
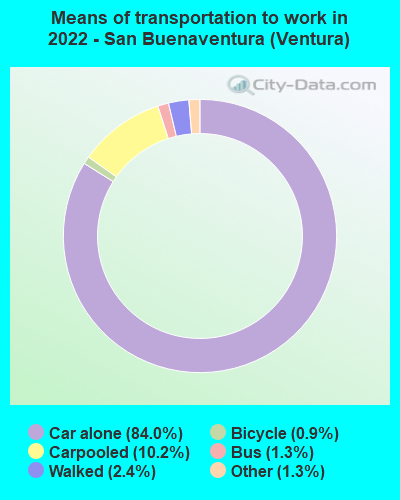
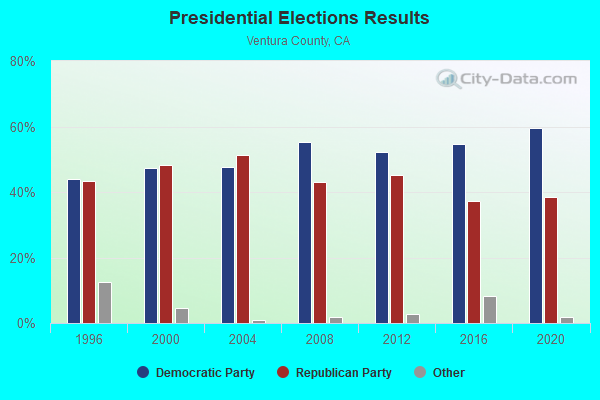
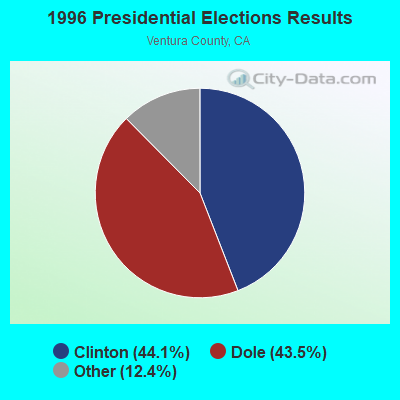
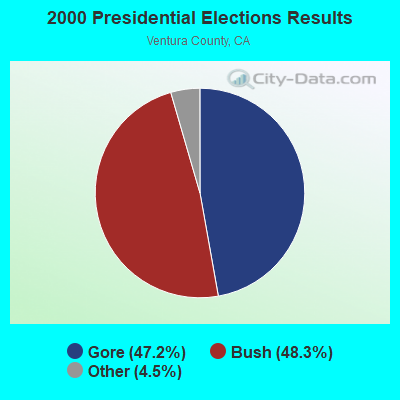
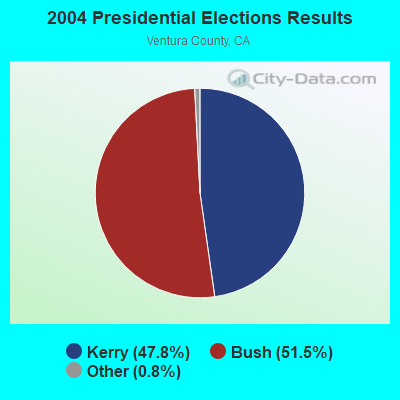
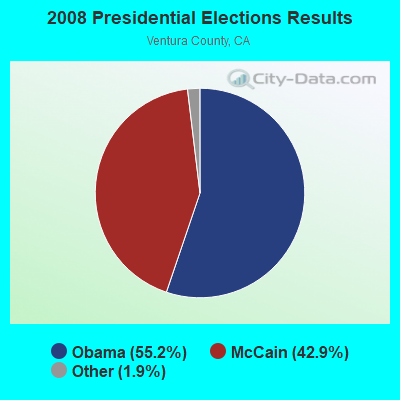
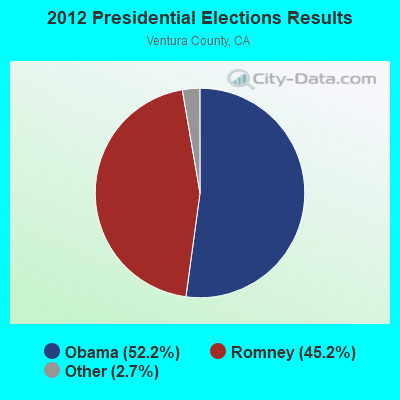
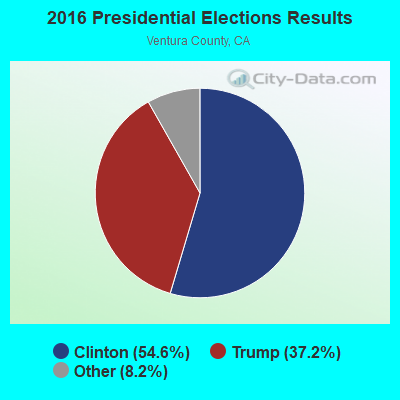
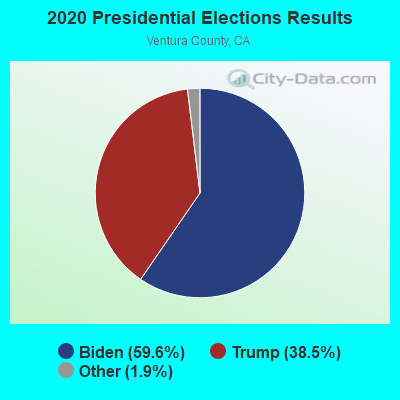
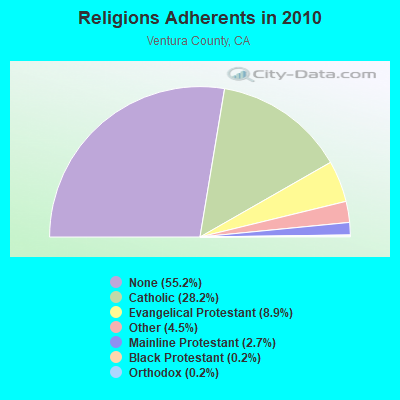
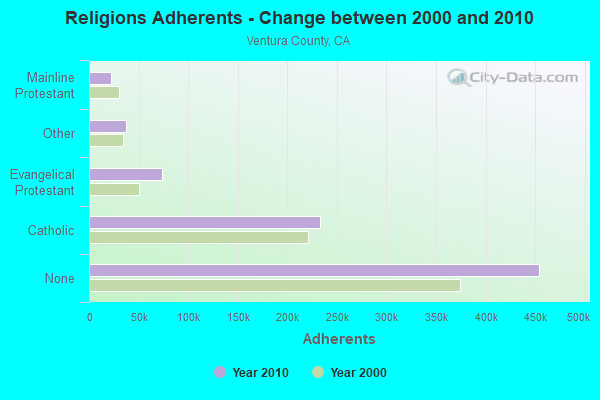
-CA.png)