Santa Maria, California Submit your own pictures of this city and show them to the world
OSM Map
General Map
Google Map
MSN Map
OSM Map
General Map
Google Map
MSN Map
OSM Map
General Map
Google Map
MSN Map
OSM Map
General Map
Google Map
MSN Map
Please wait while loading the map...
Population in 2022: 110,125 (100% urban, 0% rural). Population change since 2000: +42.2%Males: 53,120 Females: 57,005
March 2022 cost of living index in Santa Maria: 111.4 (more than average, U.S. average is 100) Percentage of residents living in poverty in 2022: 17.1%for White Non-Hispanic residents , 10.9% for Black residents , 18.9% for Hispanic or Latino residents , 35.2% for American Indian residents , 11.7% for other race residents , 18.1% for two or more races residents )
Profiles of local businesses
Business Search - 14 Million verified businesses
Data:
Median household income ($)
Median household income (% change since 2000)
Household income diversity
Ratio of average income to average house value (%)
Ratio of average income to average rent
Median household income ($) - White
Median household income ($) - Black or African American
Median household income ($) - Asian
Median household income ($) - Hispanic or Latino
Median household income ($) - American Indian and Alaska Native
Median household income ($) - Multirace
Median household income ($) - Other Race
Median household income for houses/condos with a mortgage ($)
Median household income for apartments without a mortgage ($)
Races - White alone (%)
Races - White alone (% change since 2000)
Races - Black alone (%)
Races - Black alone (% change since 2000)
Races - American Indian alone (%)
Races - American Indian alone (% change since 2000)
Races - Asian alone (%)
Races - Asian alone (% change since 2000)
Races - Hispanic (%)
Races - Hispanic (% change since 2000)
Races - Native Hawaiian and Other Pacific Islander alone (%)
Races - Native Hawaiian and Other Pacific Islander alone (% change since 2000)
Races - Two or more races (%)
Races - Two or more races (% change since 2000)
Races - Other race alone (%)
Races - Other race alone (% change since 2000)
Racial diversity
Unemployment (%)
Unemployment (% change since 2000)
Unemployment (%) - White
Unemployment (%) - Black or African American
Unemployment (%) - Asian
Unemployment (%) - Hispanic or Latino
Unemployment (%) - American Indian and Alaska Native
Unemployment (%) - Multirace
Unemployment (%) - Other Race
Population density (people per square mile)
Population - Males (%)
Population - Females (%)
Population - Males (%) - White
Population - Males (%) - Black or African American
Population - Males (%) - Asian
Population - Males (%) - Hispanic or Latino
Population - Males (%) - American Indian and Alaska Native
Population - Males (%) - Multirace
Population - Males (%) - Other Race
Population - Females (%) - White
Population - Females (%) - Black or African American
Population - Females (%) - Asian
Population - Females (%) - Hispanic or Latino
Population - Females (%) - American Indian and Alaska Native
Population - Females (%) - Multirace
Population - Females (%) - Other Race
Coronavirus confirmed cases (Apr 23, 2024)
Deaths caused by coronavirus (Apr 23, 2024)
Coronavirus confirmed cases (per 100k population) (Apr 23, 2024)
Deaths caused by coronavirus (per 100k population) (Apr 23, 2024)
Daily increase in number of cases (Apr 23, 2024)
Weekly increase in number of cases (Apr 23, 2024)
Cases doubled (in days) (Apr 23, 2024)
Hospitalized patients (Apr 18, 2022)
Negative test results (Apr 18, 2022)
Total test results (Apr 18, 2022)
COVID Vaccine doses distributed (per 100k population) (Sep 19, 2023)
COVID Vaccine doses administered (per 100k population) (Sep 19, 2023)
COVID Vaccine doses distributed (Sep 19, 2023)
COVID Vaccine doses administered (Sep 19, 2023)
Likely homosexual households (%)
Likely homosexual households (% change since 2000)
Likely homosexual households - Lesbian couples (%)
Likely homosexual households - Lesbian couples (% change since 2000)
Likely homosexual households - Gay men (%)
Likely homosexual households - Gay men (% change since 2000)
Cost of living index
Median gross rent ($)
Median contract rent ($)
Median monthly housing costs ($)
Median house or condo value ($)
Median house or condo value ($ change since 2000)
Mean house or condo value by units in structure - 1, detached ($)
Mean house or condo value by units in structure - 1, attached ($)
Mean house or condo value by units in structure - 2 ($)
Mean house or condo value by units in structure by units in structure - 3 or 4 ($)
Mean house or condo value by units in structure - 5 or more ($)
Mean house or condo value by units in structure - Boat, RV, van, etc. ($)
Mean house or condo value by units in structure - Mobile home ($)
Median house or condo value ($) - White
Median house or condo value ($) - Black or African American
Median house or condo value ($) - Asian
Median house or condo value ($) - Hispanic or Latino
Median house or condo value ($) - American Indian and Alaska Native
Median house or condo value ($) - Multirace
Median house or condo value ($) - Other Race
Median resident age
Resident age diversity
Median resident age - Males
Median resident age - Females
Median resident age - White
Median resident age - Black or African American
Median resident age - Asian
Median resident age - Hispanic or Latino
Median resident age - American Indian and Alaska Native
Median resident age - Multirace
Median resident age - Other Race
Median resident age - Males - White
Median resident age - Males - Black or African American
Median resident age - Males - Asian
Median resident age - Males - Hispanic or Latino
Median resident age - Males - American Indian and Alaska Native
Median resident age - Males - Multirace
Median resident age - Males - Other Race
Median resident age - Females - White
Median resident age - Females - Black or African American
Median resident age - Females - Asian
Median resident age - Females - Hispanic or Latino
Median resident age - Females - American Indian and Alaska Native
Median resident age - Females - Multirace
Median resident age - Females - Other Race
Commute - mean travel time to work (minutes)
Travel time to work - Less than 5 minutes (%)
Travel time to work - Less than 5 minutes (% change since 2000)
Travel time to work - 5 to 9 minutes (%)
Travel time to work - 5 to 9 minutes (% change since 2000)
Travel time to work - 10 to 19 minutes (%)
Travel time to work - 10 to 19 minutes (% change since 2000)
Travel time to work - 20 to 29 minutes (%)
Travel time to work - 20 to 29 minutes (% change since 2000)
Travel time to work - 30 to 39 minutes (%)
Travel time to work - 30 to 39 minutes (% change since 2000)
Travel time to work - 40 to 59 minutes (%)
Travel time to work - 40 to 59 minutes (% change since 2000)
Travel time to work - 60 to 89 minutes (%)
Travel time to work - 60 to 89 minutes (% change since 2000)
Travel time to work - 90 or more minutes (%)
Travel time to work - 90 or more minutes (% change since 2000)
Marital status - Never married (%)
Marital status - Now married (%)
Marital status - Separated (%)
Marital status - Widowed (%)
Marital status - Divorced (%)
Median family income ($)
Median family income (% change since 2000)
Median non-family income ($)
Median non-family income (% change since 2000)
Median per capita income ($)
Median per capita income (% change since 2000)
Median family income ($) - White
Median family income ($) - Black or African American
Median family income ($) - Asian
Median family income ($) - Hispanic or Latino
Median family income ($) - American Indian and Alaska Native
Median family income ($) - Multirace
Median family income ($) - Other Race
Median year house/condo built
Median year apartment built
Year house built - Built 2005 or later (%)
Year house built - Built 2000 to 2004 (%)
Year house built - Built 1990 to 1999 (%)
Year house built - Built 1980 to 1989 (%)
Year house built - Built 1970 to 1979 (%)
Year house built - Built 1960 to 1969 (%)
Year house built - Built 1950 to 1959 (%)
Year house built - Built 1940 to 1949 (%)
Year house built - Built 1939 or earlier (%)
Average household size
Household density (households per square mile)
Average household size - White
Average household size - Black or African American
Average household size - Asian
Average household size - Hispanic or Latino
Average household size - American Indian and Alaska Native
Average household size - Multirace
Average household size - Other Race
Occupied housing units (%)
Vacant housing units (%)
Owner occupied housing units (%)
Renter occupied housing units (%)
Vacancy status - For rent (%)
Vacancy status - For sale only (%)
Vacancy status - Rented or sold, not occupied (%)
Vacancy status - For seasonal, recreational, or occasional use (%)
Vacancy status - For migrant workers (%)
Vacancy status - Other vacant (%)
Residents with income below the poverty level (%)
Residents with income below 50% of the poverty level (%)
Children below poverty level (%)
Poor families by family type - Married-couple family (%)
Poor families by family type - Male, no wife present (%)
Poor families by family type - Female, no husband present (%)
Poverty status for native-born residents (%)
Poverty status for foreign-born residents (%)
Poverty among high school graduates not in families (%)
Poverty among people who did not graduate high school not in families (%)
Residents with income below the poverty level (%) - White
Residents with income below the poverty level (%) - Black or African American
Residents with income below the poverty level (%) - Asian
Residents with income below the poverty level (%) - Hispanic or Latino
Residents with income below the poverty level (%) - American Indian and Alaska Native
Residents with income below the poverty level (%) - Multirace
Residents with income below the poverty level (%) - Other Race
Air pollution - Air Quality Index (AQI)
Air pollution - CO
Air pollution - NO2
Air pollution - SO2
Air pollution - Ozone
Air pollution - PM10
Air pollution - PM25
Air pollution - Pb
Crime - Murders per 100,000 population
Crime - Rapes per 100,000 population
Crime - Robberies per 100,000 population
Crime - Assaults per 100,000 population
Crime - Burglaries per 100,000 population
Crime - Thefts per 100,000 population
Crime - Auto thefts per 100,000 population
Crime - Arson per 100,000 population
Crime - City-data.com crime index
Crime - Violent crime index
Crime - Property crime index
Crime - Murders per 100,000 population (5 year average)
Crime - Rapes per 100,000 population (5 year average)
Crime - Robberies per 100,000 population (5 year average)
Crime - Assaults per 100,000 population (5 year average)
Crime - Burglaries per 100,000 population (5 year average)
Crime - Thefts per 100,000 population (5 year average)
Crime - Auto thefts per 100,000 population (5 year average)
Crime - Arson per 100,000 population (5 year average)
Crime - City-data.com crime index (5 year average)
Crime - Violent crime index (5 year average)
Crime - Property crime index (5 year average)
1996 Presidential Elections Results (%) - Democratic Party (Clinton)
1996 Presidential Elections Results (%) - Republican Party (Dole)
1996 Presidential Elections Results (%) - Other
2000 Presidential Elections Results (%) - Democratic Party (Gore)
2000 Presidential Elections Results (%) - Republican Party (Bush)
2000 Presidential Elections Results (%) - Other
2004 Presidential Elections Results (%) - Democratic Party (Kerry)
2004 Presidential Elections Results (%) - Republican Party (Bush)
2004 Presidential Elections Results (%) - Other
2008 Presidential Elections Results (%) - Democratic Party (Obama)
2008 Presidential Elections Results (%) - Republican Party (McCain)
2008 Presidential Elections Results (%) - Other
2012 Presidential Elections Results (%) - Democratic Party (Obama)
2012 Presidential Elections Results (%) - Republican Party (Romney)
2012 Presidential Elections Results (%) - Other
2016 Presidential Elections Results (%) - Democratic Party (Clinton)
2016 Presidential Elections Results (%) - Republican Party (Trump)
2016 Presidential Elections Results (%) - Other
2020 Presidential Elections Results (%) - Democratic Party (Biden)
2020 Presidential Elections Results (%) - Republican Party (Trump)
2020 Presidential Elections Results (%) - Other
Ancestries Reported - Arab (%)
Ancestries Reported - Czech (%)
Ancestries Reported - Danish (%)
Ancestries Reported - Dutch (%)
Ancestries Reported - English (%)
Ancestries Reported - French (%)
Ancestries Reported - French Canadian (%)
Ancestries Reported - German (%)
Ancestries Reported - Greek (%)
Ancestries Reported - Hungarian (%)
Ancestries Reported - Irish (%)
Ancestries Reported - Italian (%)
Ancestries Reported - Lithuanian (%)
Ancestries Reported - Norwegian (%)
Ancestries Reported - Polish (%)
Ancestries Reported - Portuguese (%)
Ancestries Reported - Russian (%)
Ancestries Reported - Scotch-Irish (%)
Ancestries Reported - Scottish (%)
Ancestries Reported - Slovak (%)
Ancestries Reported - Subsaharan African (%)
Ancestries Reported - Swedish (%)
Ancestries Reported - Swiss (%)
Ancestries Reported - Ukrainian (%)
Ancestries Reported - United States (%)
Ancestries Reported - Welsh (%)
Ancestries Reported - West Indian (%)
Ancestries Reported - Other (%)
Educational Attainment - No schooling completed (%)
Educational Attainment - Less than high school (%)
Educational Attainment - High school or equivalent (%)
Educational Attainment - Less than 1 year of college (%)
Educational Attainment - 1 or more years of college (%)
Educational Attainment - Associate degree (%)
Educational Attainment - Bachelor's degree (%)
Educational Attainment - Master's degree (%)
Educational Attainment - Professional school degree (%)
Educational Attainment - Doctorate degree (%)
School Enrollment - Nursery, preschool (%)
School Enrollment - Kindergarten (%)
School Enrollment - Grade 1 to 4 (%)
School Enrollment - Grade 5 to 8 (%)
School Enrollment - Grade 9 to 12 (%)
School Enrollment - College undergrad (%)
School Enrollment - Graduate or professional (%)
School Enrollment - Not enrolled in school (%)
School enrollment - Public schools (%)
School enrollment - Private schools (%)
School enrollment - Not enrolled (%)
Median number of rooms in houses and condos
Median number of rooms in apartments
Housing units lacking complete plumbing facilities (%)
Housing units lacking complete kitchen facilities (%)
Density of houses
Urban houses (%)
Rural houses (%)
Households with people 60 years and over (%)
Households with people 65 years and over (%)
Households with people 75 years and over (%)
Households with one or more nonrelatives (%)
Households with no nonrelatives (%)
Population in households (%)
Family households (%)
Nonfamily households (%)
Population in families (%)
Family households with own children (%)
Median number of bedrooms in owner occupied houses
Mean number of bedrooms in owner occupied houses
Median number of bedrooms in renter occupied houses
Mean number of bedrooms in renter occupied houses
Median number of vehichles in owner occupied houses
Mean number of vehichles in owner occupied houses
Median number of vehichles in renter occupied houses
Mean number of vehichles in renter occupied houses
Mortgage status - with mortgage (%)
Mortgage status - with second mortgage (%)
Mortgage status - with home equity loan (%)
Mortgage status - with both second mortgage and home equity loan (%)
Mortgage status - without a mortgage (%)
Average family size
Average family size - White
Average family size - Black or African American
Average family size - Asian
Average family size - Hispanic or Latino
Average family size - American Indian and Alaska Native
Average family size - Multirace
Average family size - Other Race
Geographical mobility - Same house 1 year ago (%)
Geographical mobility - Moved within same county (%)
Geographical mobility - Moved from different county within same state (%)
Geographical mobility - Moved from different state (%)
Geographical mobility - Moved from abroad (%)
Place of birth - Born in state of residence (%)
Place of birth - Born in other state (%)
Place of birth - Native, outside of US (%)
Place of birth - Foreign born (%)
Housing units in structures - 1, detached (%)
Housing units in structures - 1, attached (%)
Housing units in structures - 2 (%)
Housing units in structures - 3 or 4 (%)
Housing units in structures - 5 to 9 (%)
Housing units in structures - 10 to 19 (%)
Housing units in structures - 20 to 49 (%)
Housing units in structures - 50 or more (%)
Housing units in structures - Mobile home (%)
Housing units in structures - Boat, RV, van, etc. (%)
House/condo owner moved in on average (years ago)
Renter moved in on average (years ago)
Year householder moved into unit - Moved in 1999 to March 2000 (%)
Year householder moved into unit - Moved in 1995 to 1998 (%)
Year householder moved into unit - Moved in 1990 to 1994 (%)
Year householder moved into unit - Moved in 1980 to 1989 (%)
Year householder moved into unit - Moved in 1970 to 1979 (%)
Year householder moved into unit - Moved in 1969 or earlier (%)
Means of transportation to work - Drove car alone (%)
Means of transportation to work - Carpooled (%)
Means of transportation to work - Public transportation (%)
Means of transportation to work - Bus or trolley bus (%)
Means of transportation to work - Streetcar or trolley car (%)
Means of transportation to work - Subway or elevated (%)
Means of transportation to work - Railroad (%)
Means of transportation to work - Ferryboat (%)
Means of transportation to work - Taxicab (%)
Means of transportation to work - Motorcycle (%)
Means of transportation to work - Bicycle (%)
Means of transportation to work - Walked (%)
Means of transportation to work - Other means (%)
Working at home (%)
Industry diversity
Most Common Industries - Agriculture, forestry, fishing and hunting, and mining (%)
Most Common Industries - Agriculture, forestry, fishing and hunting (%)
Most Common Industries - Mining, quarrying, and oil and gas extraction (%)
Most Common Industries - Construction (%)
Most Common Industries - Manufacturing (%)
Most Common Industries - Wholesale trade (%)
Most Common Industries - Retail trade (%)
Most Common Industries - Transportation and warehousing, and utilities (%)
Most Common Industries - Transportation and warehousing (%)
Most Common Industries - Utilities (%)
Most Common Industries - Information (%)
Most Common Industries - Finance and insurance, and real estate and rental and leasing (%)
Most Common Industries - Finance and insurance (%)
Most Common Industries - Real estate and rental and leasing (%)
Most Common Industries - Professional, scientific, and management, and administrative and waste management services (%)
Most Common Industries - Professional, scientific, and technical services (%)
Most Common Industries - Management of companies and enterprises (%)
Most Common Industries - Administrative and support and waste management services (%)
Most Common Industries - Educational services, and health care and social assistance (%)
Most Common Industries - Educational services (%)
Most Common Industries - Health care and social assistance (%)
Most Common Industries - Arts, entertainment, and recreation, and accommodation and food services (%)
Most Common Industries - Arts, entertainment, and recreation (%)
Most Common Industries - Accommodation and food services (%)
Most Common Industries - Other services, except public administration (%)
Most Common Industries - Public administration (%)
Occupation diversity
Most Common Occupations - Management, business, science, and arts occupations (%)
Most Common Occupations - Management, business, and financial occupations (%)
Most Common Occupations - Management occupations (%)
Most Common Occupations - Business and financial operations occupations (%)
Most Common Occupations - Computer, engineering, and science occupations (%)
Most Common Occupations - Computer and mathematical occupations (%)
Most Common Occupations - Architecture and engineering occupations (%)
Most Common Occupations - Life, physical, and social science occupations (%)
Most Common Occupations - Education, legal, community service, arts, and media occupations (%)
Most Common Occupations - Community and social service occupations (%)
Most Common Occupations - Legal occupations (%)
Most Common Occupations - Education, training, and library occupations (%)
Most Common Occupations - Arts, design, entertainment, sports, and media occupations (%)
Most Common Occupations - Healthcare practitioners and technical occupations (%)
Most Common Occupations - Health diagnosing and treating practitioners and other technical occupations (%)
Most Common Occupations - Health technologists and technicians (%)
Most Common Occupations - Service occupations (%)
Most Common Occupations - Healthcare support occupations (%)
Most Common Occupations - Protective service occupations (%)
Most Common Occupations - Fire fighting and prevention, and other protective service workers including supervisors (%)
Most Common Occupations - Law enforcement workers including supervisors (%)
Most Common Occupations - Food preparation and serving related occupations (%)
Most Common Occupations - Building and grounds cleaning and maintenance occupations (%)
Most Common Occupations - Personal care and service occupations (%)
Most Common Occupations - Sales and office occupations (%)
Most Common Occupations - Sales and related occupations (%)
Most Common Occupations - Office and administrative support occupations (%)
Most Common Occupations - Natural resources, construction, and maintenance occupations (%)
Most Common Occupations - Farming, fishing, and forestry occupations (%)
Most Common Occupations - Construction and extraction occupations (%)
Most Common Occupations - Installation, maintenance, and repair occupations (%)
Most Common Occupations - Production, transportation, and material moving occupations (%)
Most Common Occupations - Production occupations (%)
Most Common Occupations - Transportation occupations (%)
Most Common Occupations - Material moving occupations (%)
People in Group quarters - Institutionalized population (%)
People in Group quarters - Correctional institutions (%)
People in Group quarters - Federal prisons and detention centers (%)
People in Group quarters - Halfway houses (%)
People in Group quarters - Local jails and other confinement facilities (including police lockups) (%)
People in Group quarters - Military disciplinary barracks (%)
People in Group quarters - State prisons (%)
People in Group quarters - Other types of correctional institutions (%)
People in Group quarters - Nursing homes (%)
People in Group quarters - Hospitals/wards, hospices, and schools for the handicapped (%)
People in Group quarters - Hospitals/wards and hospices for chronically ill (%)
People in Group quarters - Hospices or homes for chronically ill (%)
People in Group quarters - Military hospitals or wards for chronically ill (%)
People in Group quarters - Other hospitals or wards for chronically ill (%)
People in Group quarters - Hospitals or wards for drug/alcohol abuse (%)
People in Group quarters - Mental (Psychiatric) hospitals or wards (%)
People in Group quarters - Schools, hospitals, or wards for the mentally retarded (%)
People in Group quarters - Schools, hospitals, or wards for the physically handicapped (%)
People in Group quarters - Institutions for the deaf (%)
People in Group quarters - Institutions for the blind (%)
People in Group quarters - Orthopedic wards and institutions for the physically handicapped (%)
People in Group quarters - Wards in general hospitals for patients who have no usual home elsewhere (%)
People in Group quarters - Wards in military hospitals for patients who have no usual home elsewhere (%)
People in Group quarters - Juvenile institutions (%)
People in Group quarters - Long-term care (%)
People in Group quarters - Homes for abused, dependent, and neglected children (%)
People in Group quarters - Residential treatment centers for emotionally disturbed children (%)
People in Group quarters - Training schools for juvenile delinquents (%)
People in Group quarters - Short-term care, detention or diagnostic centers for delinquent children (%)
People in Group quarters - Type of juvenile institution unknown (%)
People in Group quarters - Noninstitutionalized population (%)
People in Group quarters - College dormitories (includes college quarters off campus) (%)
People in Group quarters - Military quarters (%)
People in Group quarters - On base (%)
People in Group quarters - Barracks, unaccompanied personnel housing (UPH), (Enlisted/Officer), ;and similar group living quarters for military personnel (%)
People in Group quarters - Transient quarters for temporary residents (%)
People in Group quarters - Military ships (%)
People in Group quarters - Group homes (%)
People in Group quarters - Homes or halfway houses for drug/alcohol abuse (%)
People in Group quarters - Homes for the mentally ill (%)
People in Group quarters - Homes for the mentally retarded (%)
People in Group quarters - Homes for the physically handicapped (%)
People in Group quarters - Other group homes (%)
People in Group quarters - Religious group quarters (%)
People in Group quarters - Dormitories (%)
People in Group quarters - Agriculture workers' dormitories on farms (%)
People in Group quarters - Job Corps and vocational training facilities (%)
People in Group quarters - Other workers' dormitories (%)
People in Group quarters - Crews of maritime vessels (%)
People in Group quarters - Other nonhousehold living situations (%)
People in Group quarters - Other noninstitutional group quarters (%)
Residents speaking English at home (%)
Residents speaking English at home - Born in the United States (%)
Residents speaking English at home - Native, born elsewhere (%)
Residents speaking English at home - Foreign born (%)
Residents speaking Spanish at home (%)
Residents speaking Spanish at home - Born in the United States (%)
Residents speaking Spanish at home - Native, born elsewhere (%)
Residents speaking Spanish at home - Foreign born (%)
Residents speaking other language at home (%)
Residents speaking other language at home - Born in the United States (%)
Residents speaking other language at home - Native, born elsewhere (%)
Residents speaking other language at home - Foreign born (%)
Class of Workers - Employee of private company (%)
Class of Workers - Self-employed in own incorporated business (%)
Class of Workers - Private not-for-profit wage and salary workers (%)
Class of Workers - Local government workers (%)
Class of Workers - State government workers (%)
Class of Workers - Federal government workers (%)
Class of Workers - Self-employed workers in own not incorporated business and Unpaid family workers (%)
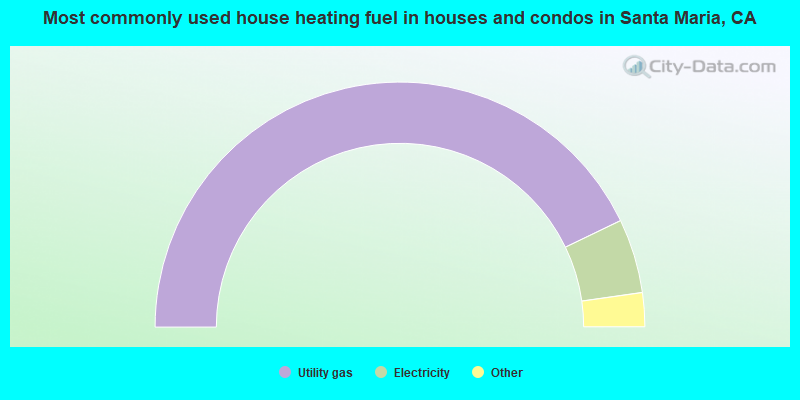
House heating fuel used in houses and condos - Utility gas (%)
House heating fuel used in houses and condos - Bottled, tank, or LP gas (%)
House heating fuel used in houses and condos - Electricity (%)
House heating fuel used in houses and condos - Fuel oil, kerosene, etc. (%)
House heating fuel used in houses and condos - Coal or coke (%)
House heating fuel used in houses and condos - Wood (%)
House heating fuel used in houses and condos - Solar energy (%)
House heating fuel used in houses and condos - Other fuel (%)
House heating fuel used in houses and condos - No fuel used (%)
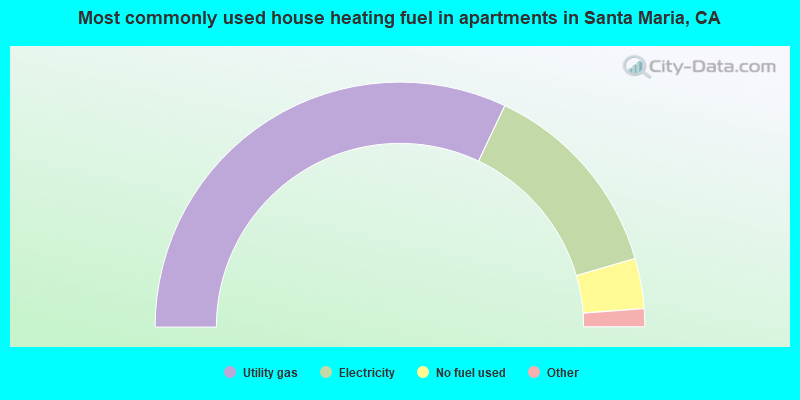
House heating fuel used in apartments - Utility gas (%)
House heating fuel used in apartments - Bottled, tank, or LP gas (%)
House heating fuel used in apartments - Electricity (%)
House heating fuel used in apartments - Fuel oil, kerosene, etc. (%)
House heating fuel used in apartments - Coal or coke (%)
House heating fuel used in apartments - Wood (%)
House heating fuel used in apartments - Solar energy (%)
House heating fuel used in apartments - Other fuel (%)
House heating fuel used in apartments - No fuel used (%)
Armed forces status - In Armed Forces (%)
Armed forces status - Civilian (%)
Armed forces status - Civilian - Veteran (%)
Armed forces status - Civilian - Nonveteran (%)
Fatal accidents locations in years 2005-2021
Fatal accidents locations in 2005
Fatal accidents locations in 2006
Fatal accidents locations in 2007
Fatal accidents locations in 2008
Fatal accidents locations in 2009
Fatal accidents locations in 2010
Fatal accidents locations in 2011
Fatal accidents locations in 2012
Fatal accidents locations in 2013
Fatal accidents locations in 2014
Fatal accidents locations in 2015
Fatal accidents locations in 2016
Fatal accidents locations in 2017
Fatal accidents locations in 2018
Fatal accidents locations in 2019
Fatal accidents locations in 2020
Fatal accidents locations in 2021
Alcohol use - People drinking some alcohol every month (%)
Alcohol use - People not drinking at all (%)
Alcohol use - Average days/month drinking alcohol
Alcohol use - Average drinks/week
Alcohol use - Average days/year people drink much
Audiometry - Average condition of hearing (%)
Audiometry - People that can hear a whisper from across a quiet room (%)
Audiometry - People that can hear normal voice from across a quiet room (%)
Audiometry - Ears ringing, roaring, buzzing (%)
Audiometry - Had a job exposure to loud noise (%)
Audiometry - Had off-work exposure to loud noise (%)
Blood Pressure & Cholesterol - Has high blood pressure (%)
Blood Pressure & Cholesterol - Checking blood pressure at home (%)
Blood Pressure & Cholesterol - Frequently checking blood cholesterol (%)
Blood Pressure & Cholesterol - Has high cholesterol level (%)
Consumer Behavior - Money monthly spent on food at supermarket/grocery store
Consumer Behavior - Money monthly spent on food at other stores
Consumer Behavior - Money monthly spent on eating out
Consumer Behavior - Money monthly spent on carryout/delivered foods
Consumer Behavior - Income spent on food at supermarket/grocery store (%)
Consumer Behavior - Income spent on food at other stores (%)
Consumer Behavior - Income spent on eating out (%)
Consumer Behavior - Income spent on carryout/delivered foods (%)
Current Health Status - General health condition (%)
Current Health Status - Blood donors (%)
Current Health Status - Has blood ever tested for HIV virus (%)
Current Health Status - Left-handed people (%)
Dermatology - People using sunscreen (%)
Diabetes - Diabetics (%)
Diabetes - Had a blood test for high blood sugar (%)
Diabetes - People taking insulin (%)
Diet Behavior & Nutrition - Diet health (%)
Diet Behavior & Nutrition - Milk product consumption (# of products/month)
Diet Behavior & Nutrition - Meals not home prepared (#/week)
Diet Behavior & Nutrition - Meals from fast food or pizza place (#/week)
Diet Behavior & Nutrition - Ready-to-eat foods (#/month)
Diet Behavior & Nutrition - Frozen meals/pizza (#/month)
Drug Use - People that ever used marijuana or hashish (%)
Drug Use - Ever used hard drugs (%)
Drug Use - Ever used any form of cocaine (%)
Drug Use - Ever used heroin (%)
Drug Use - Ever used methamphetamine (%)
Health Insurance - People covered by health insurance (%)
Kidney Conditions-Urology - Avg. # of times urinating at night
Medical Conditions - People with asthma (%)
Medical Conditions - People with anemia (%)
Medical Conditions - People with psoriasis (%)
Medical Conditions - People with overweight (%)
Medical Conditions - Elderly people having difficulties in thinking or remembering (%)
Medical Conditions - People who ever received blood transfusion (%)
Medical Conditions - People having trouble seeing even with glass/contacts (%)
Medical Conditions - People with arthritis (%)
Medical Conditions - People with gout (%)
Medical Conditions - People with congestive heart failure (%)
Medical Conditions - People with coronary heart disease (%)
Medical Conditions - People with angina pectoris (%)
Medical Conditions - People who ever had heart attack (%)
Medical Conditions - People who ever had stroke (%)
Medical Conditions - People with emphysema (%)
Medical Conditions - People with thyroid problem (%)
Medical Conditions - People with chronic bronchitis (%)
Medical Conditions - People with any liver condition (%)
Medical Conditions - People who ever had cancer or malignancy (%)
Mental Health - People who have little interest in doing things (%)
Mental Health - People feeling down, depressed, or hopeless (%)
Mental Health - People who have trouble sleeping or sleeping too much (%)
Mental Health - People feeling tired or having little energy (%)
Mental Health - People with poor appetite or overeating (%)
Mental Health - People feeling bad about themself (%)
Mental Health - People who have trouble concentrating on things (%)
Mental Health - People moving or speaking slowly or too fast (%)
Mental Health - People having thoughts they would be better off dead (%)
Oral Health - Average years since last visit a dentist
Oral Health - People embarrassed because of mouth (%)
Oral Health - People with gum disease (%)
Oral Health - General health of teeth and gums (%)
Oral Health - Average days a week using dental floss/device
Oral Health - Average days a week using mouthwash for dental problem
Oral Health - Average number of teeth
Pesticide Use - Households using pesticides to control insects (%)
Pesticide Use - Households using pesticides to kill weeds (%)
Physical Activity - People doing vigorous-intensity work activities (%)
Physical Activity - People doing moderate-intensity work activities (%)
Physical Activity - People walking or bicycling (%)
Physical Activity - People doing vigorous-intensity recreational activities (%)
Physical Activity - People doing moderate-intensity recreational activities (%)
Physical Activity - Average hours a day doing sedentary activities
Physical Activity - Average hours a day watching TV or videos
Physical Activity - Average hours a day using computer
Physical Functioning - People having limitations keeping them from working (%)
Physical Functioning - People limited in amount of work they can do (%)
Physical Functioning - People that need special equipment to walk (%)
Physical Functioning - People experiencing confusion/memory problems (%)
Physical Functioning - People requiring special healthcare equipment (%)
Prescription Medications - Average number of prescription medicines taking
Preventive Aspirin Use - Adults 40+ taking low-dose aspirin (%)
Reproductive Health - Vaginal deliveries (%)
Reproductive Health - Cesarean deliveries (%)
Reproductive Health - Deliveries resulted in a live birth (%)
Reproductive Health - Pregnancies resulted in a delivery (%)
Reproductive Health - Women breastfeeding newborns (%)
Reproductive Health - Women that had a hysterectomy (%)
Reproductive Health - Women that had both ovaries removed (%)
Reproductive Health - Women that have ever taken birth control pills (%)
Reproductive Health - Women taking birth control pills (%)
Reproductive Health - Women that have ever used Depo-Provera or injectables (%)
Reproductive Health - Women that have ever used female hormones (%)
Sexual Behavior - People 18+ that ever had sex (vaginal, anal, or oral) (%)
Sexual Behavior - Males 18+ that ever had vaginal sex with a woman (%)
Sexual Behavior - Males 18+ that ever performed oral sex on a woman (%)
Sexual Behavior - Males 18+ that ever had anal sex with a woman (%)
Sexual Behavior - Males 18+ that ever had any sex with a man (%)
Sexual Behavior - Females 18+ that ever had vaginal sex with a man (%)
Sexual Behavior - Females 18+ that ever performed oral sex on a man (%)
Sexual Behavior - Females 18+ that ever had anal sex with a man (%)
Sexual Behavior - Females 18+ that ever had any kind of sex with a woman (%)
Sexual Behavior - Average age people first had sex
Sexual Behavior - Average number of female sex partners in lifetime (males 18+)
Sexual Behavior - Average number of female vaginal sex partners in lifetime (males 18+)
Sexual Behavior - Average age people first performed oral sex on a woman (18+)
Sexual Behavior - Average number of woman performed oral sex on in lifetime (18+)
Sexual Behavior - Average number of male sex partners in lifetime (males 18+)
Sexual Behavior - Average number of male anal sex partners in lifetime (males 18+)
Sexual Behavior - Average age people first performed oral sex on a man (18+)
Sexual Behavior - Average number of male oral sex partners in lifetime (18+)
Sexual Behavior - People using protection when performing oral sex (%)
Sexual Behavior - Average number of times people have vaginal or anal sex a year
Sexual Behavior - People having sex without condom (%)
Sexual Behavior - Average number of male sex partners in lifetime (females 18+)
Sexual Behavior - Average number of male vaginal sex partners in lifetime (females 18+)
Sexual Behavior - Average number of female sex partners in lifetime (females 18+)
Sexual Behavior - Circumcised males 18+ (%)
Sleep Disorders - Average hours sleeping at night
Sleep Disorders - People that has trouble sleeping (%)
Smoking-Cigarette Use - People smoking cigarettes (%)
Taste & Smell - People 40+ having problems with smell (%)
Taste & Smell - People 40+ having problems with taste (%)
Taste & Smell - People 40+ that ever had wisdom teeth removed (%)
Taste & Smell - People 40+ that ever had tonsils teeth removed (%)
Taste & Smell - People 40+ that ever had a loss of consciousness because of a head injury (%)
Taste & Smell - People 40+ that ever had a broken nose or other serious injury to face or skull (%)
Taste & Smell - People 40+ that ever had two or more sinus infections (%)
Weight - Average height (inches)
Weight - Average weight (pounds)
Weight - Average BMI
Weight - People that are obese (%)
Weight - People that ever were obese (%)
Weight - People trying to lose weight (%)
87,150 79.1% Hispanic 16,195 14.7% White alone 5,049 4.6% Asian alone 773 0.7% Black alone 760 0.7% Two or more races 163 0.1% American Indian alone 34 0.03% Other race alone
The City-Data.com crime index weighs serious crimes and violent crimes more heavily. Higher means more crime, U.S. average is 246.1. It adjusts for the number of visitors and daily workers commuting into cities.
- means the value is smaller than the state average.
- means the value is about the same as the state average.
- means the value is bigger than the state average.
- means the value is much bigger than the state average.
Crime rate in Santa Maria detailed stats: murders, rapes, robberies, assaults, burglaries, thefts, arson Officers per 1,000 residents here:
1.13California average:
2.30
Latest news from Santa Maria, CA collected exclusively by city-data.com from local newspapers, TV, and radio stations
Ancestries: American (1.9%), English (1.3%).
Current Local Time:
Land area: 19.3 square miles.
Population density: 5,698 people per square mile (average).
36,224 residents are foreign born (29.1% Latin America , 3.4% Asia ).
This city:
33.2%California:
26.5%
Median real estate property taxes paid for housing units with mortgages in 2022: $3,430 (0.6%)Median real estate property taxes paid for housing units with no mortgage in 2022: $2,995 (0.6%)
Nearest city with pop. 200,000+: Bakersfield, CA
Nearest city with pop. 1,000,000+: Los Angeles, CA
Nearest cities:
Garey, CA (2.8 miles),
Casmalia, CA (3.1 miles),
Sisquoc, CA (3.2 miles)
Latitude: 34.95 N, Longitude: 120.43 W
Daytime population change due to commuting: -202 (-0.2%)Workers who live and work in this city: 26,863 (55.8%)
Property values in Santa Maria, CA
Santa Maria tourist attractions:
Single-family new house construction building permits:
2022: 129 buildings , average cost: $93,6002021: 132 buildings , average cost: $48,0002020: 120 buildings , average cost: $48,0002019: 110 buildings , average cost: $48,0002018: 158 buildings , average cost: $176,8002017: 320 buildings , average cost: $224,5002016: 202 buildings , average cost: $294,9002015: 155 buildings , average cost: $540,2002014: 130 buildings , average cost: $264,6002013: 59 buildings , average cost: $225,6002012: 36 buildings , average cost: $224,4002011: 22 buildings , average cost: $224,0002010: 15 buildings , average cost: $152,9002009: 8 buildings , average cost: $181,1002008: 22 buildings , average cost: $205,1002007: 146 buildings , average cost: $179,1002006: 180 buildings , average cost: $197,2002005: 300 buildings , average cost: $174,4002004: 642 buildings , average cost: $175,9002003: 672 buildings , average cost: $173,1002002: 627 buildings , average cost: $169,7002001: 592 buildings , average cost: $162,1002000: 333 buildings , average cost: $154,8001999: 205 buildings , average cost: $168,2001998: 226 buildings , average cost: $144,8001997: 184 buildings , average cost: $130,600Unemployment in December 2023:
Population change in the 1990s: +15,376 (+24.8%).
Most common occupations in Santa Maria, CA (%)
Both Males Females
Agricultural workers, including supervisors (18.6%)
Building and grounds cleaning and maintenance occupations (4.5%)
Other production occupations, including supervisors (3.8%)
Other sales and related occupations, including supervisors (3.3%)
Driver/sales workers and truck drivers (3.2%)
Other office and administrative support workers, including supervisors (3.2%)
Retail sales workers, except cashiers (2.9%)
Agricultural workers, including supervisors (22.8%)
Driver/sales workers and truck drivers (5.2%)
Building and grounds cleaning and maintenance occupations (4.7%)
Other production occupations, including supervisors (4.1%)
Other sales and related occupations, including supervisors (3.3%)
Laborers and material movers, hand (3.3%)
Vehicle and mobile equipment mechanics, installers, and repairers (3.1%)
Agricultural workers, including supervisors (13.0%)
Other office and administrative support workers, including supervisors (5.5%)
Cashiers (4.3%)
Information and record clerks, except customer service representatives (4.3%)
Building and grounds cleaning and maintenance occupations (4.3%)
Retail sales workers, except cashiers (4.0%)
Secretaries and administrative assistants (3.9%)
Earthquake activity:
Santa Maria-area historical earthquake activity is significantly above California state average. It is 6630% greater than the overall U.S. average. On 7/21/1952 at 11:52:14, a magnitude 7.7 (7.7 UK, Class: Major, Intensity: VIII - XII) earthquake occurred 81.3 miles away from Santa Maria center, causing $50,000,000 total damage On 11/4/1927 at 13:51:53, a magnitude 7.5 (7.5 UK) earthquake occurred 34.0 miles away from Santa Maria center On 4/18/1906 at 13:12:21, a magnitude 7.9 (7.9 UK) earthquake occurred 254.6 miles away from the city center, causing $524,000,000 total damage On 6/28/1992 at 11:57:34, a magnitude 7.6 (6.2 MB, 7.6 MS, 7.3 MW, Depth: 0.7 mi) earthquake occurred 228.4 miles away from Santa Maria center, causing 3 deaths ( 1 shaking deaths, 2 other deaths) and 400 injuries, causing $100,000,000 total damage and $40,000,000 insured lossesOn 10/16/1999 at 09:46:44, a magnitude 7.4 (6.3 MB, 7.4 MS, 7.2 MW, 7.3 ML) earthquake occurred 229.3 miles away from the city center On 10/18/1989 at 00:04:15, a magnitude 7.1 (6.5 MB, 7.1 MS, 6.9 MW, 7.0 ML) earthquake occurred 167.0 miles away from Santa Maria center, causing 62 deaths ( 62 shaking deaths) and 3757 injuries, causing $1,305,032,704 total damage Magnitude types: body-wave magnitude (MB), local magnitude (ML), surface-wave magnitude (MS), moment magnitude (MW) Natural disasters: The number of natural disasters in Santa Barbara County (31) is a lot greater than the US average (15).Major Disasters (Presidential) Declared: 19Emergencies Declared: 3Floods: 17, Fires: 10, Storms: 8, Winter Storms: 8, Mudslides: 7, Landslides: 4, Drought: 1, Earthquake: 1, Freeze: 1, Hurricane: 1, Tornado: 1, Wind: 1, Other: 1 (Note: some incidents may be assigned to more than one category). Hospitals in Santa Maria: ENDOSCOPY SURGERY CENTER OF SANTA MARIA (116 S PALISADE DR) GENESIS DEVELOPMENTAL SERVICES - MOONCREST (273 MOONCREST LN) MARIAN REGIONAL MEDICAL CENTER (Voluntary non-profit - Church, provides emergency services, 1400 E CHURCH ST) VNS HOSPICE (521 EAST CHAPEL STREET) Nursing Homes in Santa Maria: COUNTRY OAKS CARE CENTER (830 E CHAPEL ST) MARIAN MEDICAL CENTER D/P SNF (1530 E CYPRESS WY) SANTA MARIA CARE CENTER (820 W COOK ST) VALLEY COMMUNITY HOSPITAL D/P SNF (505 EAST PLAZA DRIVE) VILLA MARIA HEALTHCARE CENTER (425 E BARCELLUS AVE) Dialysis Facilities in Santa Maria: CENTRAL COAST KIDNEY DISEASE CENTER (2263 S. DEPOT STREET) Home Health Centers in Santa Maria: MARIAN HOSPITAL HOMECARE AND HOSPICE (504 E PLAZA DR) Amtrak stations:
SANTA MARIA (CYPRESS ST. & NICHOLSON AVE.) - Bus Station Services: fully wheelchair accessible, public payphones, free short-term parking, call for taxi service, public transit connection.
GUADALUPE/SANTA MARIA (330 GUADELUPE ST.)
Colleges/Universities in Santa Maria: Allan Hancock College Full-time enrollment: 6,639; Location: 800 South College Drive; Public; Website: www.hancockcollege.edu/)
Santa Barbara Business College-Santa Maria Full-time enrollment: 216; Location: 303 E Plaza Dr Ste 1; Private, for-profit; Website: sbbcollege.edu)
CET-Santa Maria Full-time enrollment: 163; Location: 509 W Morrison Ave; Private, not-for-profit; Website: www.cetweb.org)
Other colleges/universities with over 2000 students near Santa Maria:
California Polytechnic State University-San Luis Obispo (about 28 miles; San Luis Obispo, CA ; Full-time enrollment: 17,345)
Cuesta College (about 32 miles; San Luis Obispo, CA ; FT enrollment: 6,518)
University of California-Santa Barbara (about 50 miles; Santa Barbara, CA ; FT enrollment: 22,806)
Santa Barbara City College (about 57 miles; Santa Barbara, CA ; FT enrollment: 12,568)
Taft College (about 57 miles; Taft, CA ; FT enrollment: 2,121)
California State University-Bakersfield (about 81 miles; Bakersfield, CA ; FT enrollment: 7,564)
Ventura College (about 83 miles; Ventura, CA ; FT enrollment: 8,460)
Public high schools in Santa Maria: PIONEER VALLEY HIGH Students: 1,857, Location: 675 PANTHER DR., Grades: 9-12)SANTA MARIA HIGH Students: 1,671, Location: 901 S. BRD.WAY, Grades: 9-12)ERNEST RIGHETTI HIGH Students: 1,530, Location: 941 E. FOSTER RD., Grades: 9-12)FAMILY PARTNERSHIP HOME STUDY CHARTER Students: 239, Location: 625 S. MCCLELLAND, Grades: KG-12, Charter school )TRIVIUM CHARTER Location: 4949 FOXEN CANYON RD., Grades: KG-12, Charter school )
DELTA HIGH Location: 4893 BETHANY LN., Grades: 9-12)
Private high schools in Santa Maria: ST JOSEPH HIGH SCHOOL Students: 474, Location: 4120 S BRADLEY RD, Grades: 9-12)
VALLEY CHRISTIAN ACADEMY Students: 378, Location: 2970 SANTA MARIA WAY, Grades: UG-12)
Biggest public elementary/middle schools in Santa Maria: FESLER (ISAAC) JUNIOR HIGH Students: 662, Location: 1100 E. FESLER ST., Grades: 7-8)EL CAMINO JUNIOR HIGH Students: 621, Location: 219 W. EL CAMINO, Grades: 7-8)TAYLOR (IDA REDMOND) ELEMENTARY Students: 598, Location: 1921 N. CARLOTTI DR., Grades: KG-6)ONTIVEROS (JUAN PACIFICO) ELEMENTARY Students: 567, Location: 930 W. RANCHO VERDE, Grades: KG-6)BRUCE (ROBERT) ELEMENTARY Students: 540, Location: 601 W. ALVIN AVE., Grades: KG-6)RICE (WILLIAM) ELEMENTARY Students: 520, Location: 700 E. VICKIE AVE., Grades: KG-6)TUNNELL (MARTIN LUTHER) ELEMENTARY Students: 494, Location: 1248 E. DENA WAY, Grades: KG-6)ARELLANES JUNIOR HIGH Students: 462, Location: 1890 SANDALWOOD DR., Grades: 7-8)MILLER (ISAAC) ELEMENTARY Students: 457, Location: 410 E. CAMINO COLEGIO, Grades: KG-6)ADAM (WILLIAM LAIRD) ELEMENTARY Students: 449, Location: 500 W. WINDSOR, Grades: KG-6)Private elementary/middle schools in Santa Maria: PACIFIC CHRISTIAN SCHOOL Students: 314, Location: 3435 SANTA MARIA WAY, Grades: KG-8)
ST MARY OF THE ASSUMPTION SCHOOL Students: 246, Location: 424 E CYPRESS ST, Grades: PK-8)
See full list of schools located in Santa Maria Library in Santa Maria: SANTA MARIA PUBLIC LIBRARY Operating income: $2,344,383; Location: 421 S. MCCLELLAND ST.; 187,704 books ; 2,039 e-books ; 13,991 audio materials ; 14,128 video materials ; 3 local licensed databases ; 32 other licensed databases ; 436 print serial subscriptions )
User-submitted facts and corrections:
TV Station operating in Santa Maria: KCOY (Channel 12) CBS Affiliate. KKFX (Channel 11) FOX Affiliate. Address for both: 1211 McCoy Lane, Santa Maria, CA 93455 (805) 925-1200 added by Randall White
Notable locations in Santa Maria: (A) , Sunset Ridge Golf Course (B) , Santa Maria Country Club (C) , Airbase (D) , Allan Hancock College - Learning Resources Center (E) , Veterans Memorial Hall (F) , Santa Maria Valley Chamber of Commerce and Museum (G) , Santa Maria Public Library (H) , Santa Maria Branch Santa Barbara County Law Library (I) , Edwin Mussell Senior Center (J) , Santa Barbara County Technical Services Building (K) , American Medical Response Station 9 (L) , Calstar 7 Air Ambulance (M) , Santa Maria Fire Department Station 3 (N) , Santa Maria Fire Department Station 2 (O) , Los Padres National Forest - Santa Lucia Ranger District (P) , Santa Maria Fire Department Station 1 (Q) . Display/hide their locations on the map
Shopping Centers: (1) , Town and Country Shopping Center (2) , Santa Maria Town Center Shopping Center (3) , La Joya Plaza Shopping Center (4) , Western Village Shopping Center (5) , Stowell Shopping Center (6) , Santa Maria Shopping Center (7) , Pepper Tree Plaza Shopping Center (8) , North Broadway Plaza Shopping Center (9) . Display/hide their locations on the map
Churches in Santa Maria include: (A) , Church of Christ (B) , The Church of Jesus Christ of Latter Day Saints (C) , Church of the Nazarene (D) , El Camino Park Four Square Church (E) , First Baptist Church (F) , First Christian Church (G) , First Church of Christ (H) , First Church of God (I) . Display/hide their locations on the map
Cemetery: (1) . Display/hide its location on the map
Parks in Santa Maria include: (1) , Miramonte Park South (2) , Adam Park (3) , Alice Threfts Park (4) , Armstrong Park (5) , Atkinson Park (6) , Buena Vista Park (7) , Grogan Park (8) , Memorial Park (9) . Display/hide their locations on the map
Hotels: (1) , Best Western Big America Hotel (1725 North Broadway) (2) , Best Value Inn (839 East Main Street) (3) , Best Western Big America (1725 North Broadway) (4) , 801 Expresso at the Santa Maria Inn (801 South Broadway) (5) , Budget Inn & Suites (1415 South Broadway) (6) , Budget Inn (839 East Main) (7) , Broadway Motel (1114 North Broadway) (8) , Buckboard Motor Lodge (1620 S Broadway) (9) . Display/hide their approximate locations on the map
Birthplace of: Robin Ventura - Baseball player, Sheila Varian - Horse trainer and breeder, Abel Maldonado - Politician, David G. Armstrong - Physician, Blaine Johnson - Racing driver, Jim Lonborg - Baseball player, John Glines - Dramatists and playwright, John Rudometkin - Basketball player, Mark Velasquez - Photographer, Donald S. Runels - Soilder.
Santa Barbara County has a predicted average indoor radon screening level greater than 4 pCi/L (pico curies per liter) - Highest Potential Drinking water stations with addresses in Santa Maria and their reported violations in the past:
FLOOD RANCH CO/RANCHO SISQUOC (Population served: 100, Groundwater):
Past health violations:
MCL, Monthly (TCR) - Between OCT-2010 and NOV-2010, Contaminant: Coliform. Follow-up actions: St Public Notif requested (OCT-01-2010), St Compliance achieved (OCT-25-2010)
MCL, Monthly (TCR) - In JUL-2010, Contaminant: Coliform. Follow-up actions: St Public Notif requested (JUL-01-2010), St Compliance achieved (JUL-01-2010)
MCL, Monthly (TCR) - Between APR-01-2010 and MAY-01-2010, Contaminant: Coliform
Population served: 25, Groundwater):
Past health violations:
MCL, Monthly (TCR) - In NOV-2005, Contaminant: Coliform. Follow-up actions: St Public Notif requested (NOV-01-2005)
MCL, Monthly (TCR) - In NOV-2005, Contaminant: Coliform. Follow-up actions: St Public Notif requested (NOV-01-2005)
MCL, Monthly (TCR) - In AUG-2005, Contaminant: Coliform. Follow-up actions: St Public Notif requested (AUG-01-2005)
MCL, Monthly (TCR) - In AUG-2005, Contaminant: Coliform. Follow-up actions: St Public Notif requested (AUG-01-2005)
Drinking water stations with addresses in Santa Maria that have no violations reported:
RANCHO MARIA GOLF CLUB INC (Population served: 9,000, Primary Water Source Type: Groundwater)
JALAMA BEACH PARK (Population served: 3,500, Primary Water Source Type: Groundwater)
NOJOQUI FALLS COUNTY PARK (Population served: 1,500, Primary Water Source Type: Groundwater)
VALLEY PACIFIC PETROLEUM SERVICES (Population served: 500, Primary Water Source Type: Groundwater)
RIVERBENCH WINERY (Population served: 50, Primary Water Source Type: Groundwater)
Average household size: This city:
3.7 peopleCalifornia:
2.9 people
Percentage of family households: This city:
76.1%Whole state:
68.7%
Percentage of households with unmarried partners: This city:
7.2%Whole state:
7.2%
Likely homosexual households (counted as self-reported same-sex unmarried-partner households)
Lesbian couples: 0.4% of all households Gay men: 0.3% of all households
People in group quarters in Santa Maria in 2010:
263 people in nursing facilities/skilled-nursing facilities
178 people in group homes intended for adults
148 people in other noninstitutional facilities
120 people in correctional facilities intended for juveniles
116 people in emergency and transitional shelters (with sleeping facilities) for people experiencing homelessness
99 people in workers' group living quarters and job corps centers
47 people in residential treatment centers for adults
27 people in local jails and other municipal confinement facilities
5 people in group homes for juveniles (non-correctional)
4 people in correctional residential facilities
People in group quarters in Santa Maria in 2000:
923 people in local jails and other confinement facilities (including police lockups)
570 people in other noninstitutional group quarters
380 people in nursing homes
84 people in orthopedic wards and institutions for the physically handicapped
65 people in other nonhousehold living situations
56 people in homes or halfway houses for drug/alcohol abuse
42 people in short-term care, detention or diagnostic centers for delinquent children
17 people in other group homes
9 people in hospitals/wards and hospices for chronically ill
9 people in hospices or homes for chronically ill
9 people in homes for the mentally ill
5 people in homes for the mentally retarded
2 people in religious group quarters
Banks with most branches in Santa Maria (2011 data):
Rabobank, National Association: Santa Maria Way Branch, Santa Maria Branch, Santa Maria-South Broadway Branch, North Broadway Branch. Info updated 2011/01/27: Bank assets: $11,745.0 mil, Deposits: $8,446.0 mil, headquarters in Roseville, CA, positive income , Agricultural Specialization, 124 total offices , Holding Company: Cooperatieve Centrale Raiffeisen-Boerenleenbank B.A., "rabobank Nederland
Heritage Oaks Bank: - So. Broadway Br, - Town Center Wes, - Oak Knolls Br. Info updated 2012/01/06: Bank assets: $982.9 mil, Deposits: $786.8 mil, headquarters in Paso Robles, CA, positive income , Commercial Lending Specialization, 14 total offices , Holding Company: Heritage Oaks Bancorp
JPMorgan Chase Bank, National Association: 2200 South Broadway Branch, 401 S Broadway Branch, Grant Street & Broadway Banking Cent. Info updated 2011/11/10: Bank assets: $1,811,678.0 mil, Deposits: $1,190,738.0 mil, headquarters in Columbus, OH, positive income , International Specialization, 5577 total offices , Holding Company: Jpmorgan Chase & Co.
Wells Fargo Bank, National Association: South Broadway Branch, Broadway And Mccoy Branch, Santa Maria Branch. Info updated 2011/04/05: Bank assets: $1,161,490.0 mil, Deposits: $905,653.0 mil, headquarters in Sioux Falls, SD, positive income , 6395 total offices , Holding Company: Wells Fargo & Company
Bank of America, National Association: Santa Maria Branch at 300 Town Center East, branch established on 1927/02/19; South Broadway Branch at 2060 South Broadway, branch established on 1976/10/18. Info updated 2009/11/18: Bank assets: $1,451,969.3 mil, Deposits: $1,077,176.8 mil, headquarters in Charlotte, NC, positive income , 5782 total offices , Holding Company: Bank Of America Corporation
Community Bank of Santa Maria: Community Bank Of Santa Maria at 1421 South Broadway, branch established on 2001/03/01; Oak Knolls Branch at 4869 S. Bradley Rd., branch established on 2007/04/02. Info updated 2006/11/03: Bank assets: $162.3 mil, Deposits: $143.7 mil, local headquarters , positive income , Commercial Lending Specialization, 3 total offices
Mission Community Bank: Santa Maria Branch at 1825 South Broadway, branch established on 2001/12/12. Info updated 2011/12/05: Bank assets: $454.8 mil, Deposits: $413.1 mil, headquarters in San Luis Obispo, CA, negative income in the last year , Commercial Lending Specialization, 9 total offices , Holding Company: Scj, Inc.
Pacific Western Bank: Santa Maria Branch at 402 East Main Street, branch established on 1992/07/01. Info updated 2011/03/14: Bank assets: $5,513.1 mil, Deposits: $4,614.5 mil, headquarters in Los Angeles, CA, positive income , Commercial Lending Specialization, 78 total offices , Holding Company: Capgen Capital Group Ii Lp
Union Bank, National Association: Santa Maria Branch at 2340 South Broadway, branch established on 1996/04/08. Info updated 2011/09/01: Bank assets: $88,967.5 mil, Deposits: $65,286.4 mil, headquarters in San Francisco, CA, positive income , Commercial Lending Specialization, 403 total offices , Holding Company: Mitsubishi Ufj Financial Group, Inc.
5 other banks with 5 local branches
For population 15 years and over in Santa Maria:
Never married: 41.2%Now married: 42.6%Separated: 3.8%Widowed: 4.6%Divorced: 7.8% For population 25 years and over in Santa Maria:
High school or higher: 62.8%Bachelor's degree or higher: 15.0%Graduate or professional degree: 3.8%Unemployed: 5.5%Mean travel time to work (commute): 19.3 minutes
Education Gini index (Inequality in education) Here:
23.5California average:
15.5
Religion statistics for Santa Maria, CA (based on Santa Barbara County data)
Religion Adherents Congregations Catholic 146,940 17 Evangelical Protestant 24,775 161 Other 15,951 58 Mainline Protestant 10,610 43 Black Protestant 1,979 13 Orthodox 1,536 7 None 222,104 -
Source: Clifford Grammich, Kirk Hadaway, Richard Houseal, Dale E.Jones, Alexei Krindatch, Richie Stanley and Richard H.Taylor. 2012. 2010 U.S.Religion Census: Religious Congregations & Membership Study. Association of Statisticians of American Religious Bodies. Jones, Dale E., et al. 2002. Congregations and Membership in the United States 2000. Nashville, TN: Glenmary Research Center. Graphs represent county-level data
Food Environment Statistics: Number of grocery stores : 105Santa Barbara County :
2.61 / 10,000 pop.State :
2.14 / 10,000 pop.
Number of supercenters and club stores : 2Santa Barbara County :
0.05 / 10,000 pop.California :
0.04 / 10,000 pop.
Number of convenience stores (no gas) : 30Santa Barbara County :
0.75 / 10,000 pop.California :
0.62 / 10,000 pop.
Number of convenience stores (with gas) : 74Here :
1.84 / 10,000 pop.California :
1.49 / 10,000 pop.
Number of full-service restaurants : 388Santa Barbara County :
9.65 / 10,000 pop.California :
7.42 / 10,000 pop.
Adult diabetes rate : This county :
7.3%California :
7.3%
Adult obesity rate : This county :
22.2%California :
21.3%
Low-income preschool obesity rate : This county :
18.3%California :
17.9%
Health and Nutrition: Healthy diet rate : This city:
47.4%State:
49.4%
Average overall health of teeth and gums : Santa Maria:
46.9%California:
48.0%
Average BMI : Santa Maria:
28.0California:
28.1
People feeling badly about themselves : Santa Maria:
21.7%State:
20.2%
People not drinking alcohol at all : This city:
10.7%California:
11.2%
Average hours sleeping at night : Overweight people : This city:
31.1%California:
31.5%
General health condition : This city:
55.0%California:
56.4%
Average condition of hearing : More about Health and Nutrition of Santa Maria, CA Residents
Local government employment and payroll (March 2022)
Function
Full-time employees
Monthly full-time payroll
Average yearly full-time wage
Part-time employees
Monthly part-time payroll
Police Protection - Officers
110 $1,243,541 $135,659 0 $0 Firefighters
57 $810,338 $170,597 1 $5,630 Solid Waste Management
48 $293,165 $73,291 0 $0 Streets and Highways
42 $261,574 $74,735 3 $6,917 Parks and Recreation
40 $219,037 $65,711 121 $210,348 Police - Other
38 $314,062 $99,177 2 $1,535 Financial Administration
30 $258,116 $103,246 1 $499 Housing and Community Development (Local)
19 $155,327 $98,101 7 $7,095 Other Government Administration
18 $180,777 $120,518 11 $3,869 Water Supply
17 $111,134 $78,448 0 $0 Local Libraries
15 $91,457 $73,166 26 $48,738 Sewerage
14 $115,430 $98,940 1 $1,560 Judicial and Legal
9 $85,304 $113,739 0 $0 Other and Unallocable
8 $47,822 $71,733 0 $0 Transit
4 $29,022 $87,066 0 $0 Fire - Other
2 $14,383 $86,298 0 $0 Airports
1 $11,406 $136,872 0 $0
Totals for Government
472 $4,241,894 $107,845 173 $286,190
Santa Maria government finances - Expenditure in 2017 (per resident):
Construction - Solid Waste Management: $11,949,000 ($108.50)
Water Utilities: $6,941,000 ($63.03)Local Fire Protection: $5,878,000 ($53.38)Regular Highways: $5,416,000 ($49.18)Sewerage: $834,000 ($7.57)Parks and Recreation: $546,000 ($4.96)Police Protection: $209,000 ($1.90)Transit Utilities: $165,000 ($1.50)Libraries: $150,000 ($1.36)Current Operations - Police Protection: $29,158,000 ($264.77)
Water Utilities: $24,575,000 ($223.16)Solid Waste Management: $22,863,000 ($207.61)Parks and Recreation: $12,952,000 ($117.61)Local Fire Protection: $12,499,000 ($113.50)Central Staff Services: $10,433,000 ($94.74)Transit Utilities: $8,207,000 ($74.52)Sewerage: $7,967,000 ($72.35)Financial Administration: $5,119,000 ($46.48)Protective Inspection and Regulation - Other: $4,745,000 ($43.09)Regular Highways: $3,050,000 ($27.70)Libraries: $2,853,000 ($25.91)Judicial and Legal Services: $1,174,000 ($10.66)Housing and Community Development: $592,000 ($5.38)General - Interest on Debt: $1,306,000 ($11.86)
Other Capital Outlay - Water Utilities: $3,228,000 ($29.31)
Transit Utilities: $246,000 ($2.23)Central Staff Services: $146,000 ($1.33)Financial Administration: $135,000 ($1.23)Protective Inspection and Regulation - Other: $91,000 ($0.83)Total Salaries and Wages: $911,000 ($8.27)
Transit Utilities - Interest on Debt: $1,000 ($0.01)
Water Utilities - Interest on Debt: $3,401,000 ($30.88)
Santa Maria government finances - Revenue in 2017 (per resident):
Charges - Other: $22,907,000 ($208.01)
Solid Waste Management: $22,299,000 ($202.49)Sewerage: $10,443,000 ($94.83)Parks and Recreation: $1,312,000 ($11.91)Federal Intergovernmental - Transit Utilities: $9,606,000 ($87.23)
Housing and Community Development: $934,000 ($8.48)Other: $689,000 ($6.26)General Local Government Support: $89,000 ($0.81)Local Intergovernmental - Transit Utilities: $2,946,000 ($26.75)
Other: $1,251,000 ($11.36)Miscellaneous - General Revenue - Other: $1,002,000 ($9.10)
Interest Earnings: $705,000 ($6.40)Rents: $494,000 ($4.49)Fines and Forfeits: $291,000 ($2.64)Revenue - Water Utilities: $37,915,000 ($344.29)
Transit Utilities: $2,456,000 ($22.30)State Intergovernmental - Transit Utilities: $1,889,000 ($17.15)
Other: $1,848,000 ($16.78)Highways: $1,654,000 ($15.02)General Local Government Support: $49,000 ($0.44)Water Utilities: $27,000 ($0.25)Tax - General Sales and Gross Receipts: $21,735,000 ($197.37)
Property: $17,522,000 ($159.11)Other: $9,400,000 ($85.36)Other License: $5,966,000 ($54.17)Public Utilities Sales: $4,504,000 ($40.90)Other Selective Sales: $3,462,000 ($31.44)Occupation and Business License - Other: $623,000 ($5.66)Documentary and Stock Transfer: $338,000 ($3.07)
Santa Maria government finances - Debt in 2017 (per resident):
Long Term Debt - Beginning Outstanding - Unspecified Public Purpose: $55,801,000 ($506.71)
Outstanding Unspecified Public Purpose: $53,689,000 ($487.53)Retired Unspecified Public Purpose: $2,112,000 ($19.18)
Santa Maria government finances - Cash and Securities in 2017 (per resident):
Bond Funds - Cash and Securities: $16,859,000 ($153.09)
Other Funds - Cash and Securities: $232,486,000 ($2111.11)
Sinking Funds - Cash and Securities: $278,000 ($2.52)
4.93% of this county's 2021 resident taxpayers lived in other counties in 2020 ($102,533 average adjusted gross income )
Here:
4.93%California average:
5.19%
0.04% of residents moved from foreign countries ($459 average AGI )Santa Barbara County:
0.04%California average:
0.03%
Top counties from which taxpayers relocated into this county between 2020 and 2021:
6.09% of this county's 2020 resident taxpayers moved to other counties in 2021 ($82,188 average adjusted gross income )
Here:
6.09%California average:
6.14%
0.03% of residents moved to foreign countries ($259 average AGI )Santa Barbara County:
0.03%California average:
0.02%
Top counties to which taxpayers relocated from this county between 2020 and 2021:
Businesses in Santa Maria, CA
Name Count Name Count
7-Eleven 6 Marriott 1 99 Cents Only Stores 2 MasterBrand Cabinets 6 AT&T 3 Mazda 1 Albertsons 1 McDonald's 5 Applebee's 1 Motel 6 1 Arby's 1 Motherhood Maternity 1 AutoZone 2 New Balance 1 Avenue 1 Nike 13 BMW 1 Nissan 1 Baskin-Robbins 1 Office Depot 1 Bath & Body Works 1 Pac Sun 1 Best Western 1 Panda Express 1 Budget Car Rental 2 Panera Bread 1 Burger King 3 Papa John's Pizza 1 CVS 4 Payless 3 Carl\s Jr. 2 Penske 1 Chevrolet 1 PetSmart 1 Chuck E. Cheese's 1 Pier 1 Imports 1 Costco 1 Pizza Hut 1 Curves 1 Quality 1 Dairy Queen 1 Quiznos 1 Decora Cabinetry 1 RadioShack 1 Dennys 1 Red Lobster 1 Discount Tire 1 Red Robin 1 Domino's Pizza 1 Rite Aid 2 El Pollo Loco 1 SAS Shoes 2 Famous Footwear 1 Sears 3 FedEx 11 Spencer Gifts 1 Foot Locker 1 Sprint Nextel 1 Ford 1 Staples 1 GNC 2 Starbucks 5 GameStop 1 Subway 8 Goodwill 2 T-Mobile 4 H&R Block 3 T.J.Maxx 1 Holiday Inn 2 Taco Bell 3 Home Depot 1 Target 1 HomeTown Buffet 1 Toyota 1 Honda 1 Toys"R"Us 1 IHOP 1 Trader Joe's 1 JCPenney 1 Travelodge 1 Jamba Juice 1 U-Haul 3 Jones New York 1 UPS 10 KFC 2 Vans 2 Kmart 1 Verizon Wireless 2 Kohl's 1 Volkswagen 1 Kroger 2 Vons 2 La-Z-Boy 1 Walgreens 2 LensCrafters 1 Walmart 1 Little Caesars Pizza 2 Wendy's 1 Macy's 1 YMCA 1
Strongest AM radio stations in Santa Maria:
KGDP (660 AM; 50 kW; ORCUTT, CA; Owner: RADIO REPRESENTATIVES, INC.)
KUHL (1440 AM; 5 kW; SANTA MARIA, CA; Owner: MAPLETON COMMUNICATIONS, LLC)
KSMA (1240 AM; 1 kW; SANTA MARIA, CA; Owner: CLEAR CHANNEL BROADCASTING LICENSES, INC.)
KSBQ (1480 AM; 1 kW; SANTA MARIA, CA; Owner: LAZER BROADCASTING CORP.)
KTAP (1600 AM; daytime; 0 kW; SANTA MARIA, CA; Owner: EMERALD WAVE MEDIA)
KXTK (1280 AM; 10 kW; ARROYO GRANDE, CA; Owner: PAMPLIN BROADCASTING, INC.)
KLFF (890 AM; 5 kW; ARROYO GRANDE, CA; Owner: JERRY J. COLLINS)
KERI (1180 AM; 50 kW; WASCO-GREENACRES, CA; Owner: KWSO, INC.)
KMJ (580 AM; 50 kW; FRESNO, CA; Owner: INFINITY RADIO OPERATIONS INC.)
KSPN (710 AM; 50 kW; LOS ANGELES, CA; Owner: KABC-AM RADIO, INC.)
KLAC (570 AM; 50 kW; LOS ANGELES, CA; Owner: AMFM RADIO LICENSES, L.L.C.)
KWRU (940 AM; 50 kW; FRESNO, CA)
KIRN (670 AM; 35 kW; SIMI VALLEY, CA; Owner: LOTUS OXNARD CORP.)
Strongest FM radio stations in Santa Maria:
KIDI-FM (105.5 FM; GUADALUPE, CA; Owner: EMERALD WAVE MEDIA)
KXFM (99.1 FM; SANTA MARIA, CA; Owner: CLEAR CHANNEL BROADCASTING LICENSES, INC.)
KSNI-FM (102.5 FM; SANTA MARIA, CA; Owner: CLEAR CHANNEL BROADCASTING LICENSES, INC.)
K216FQ (90.9 FM; SANTA MARIA, CA; Owner: CALVARY CHAPEL OF TWIN FALLS, INC.)
KURQ (107.3 FM; GROVER BEACH, CA; Owner: CLEAR CHANNEL BROADCASTING LICENSES, INC.)
KPAT (95.7 FM; ORCUTT, CA; Owner: AGM-BIRMINGHAM, LLC)
KRQK (100.3 FM; LOMPOC, CA; Owner: AGM-BIRMINGHAM, L.L.C.)
KGDP-FM (90.7 FM; SANTA MARIA, CA; Owner: PEOPLE OF ACTION)
KRAZ (105.9 FM; SANTA YNEZ, CA; Owner: KNIGHT BROADCASTING, INC.)
KSYV (96.7 FM; SOLVANG, CA; Owner: KNIGHT BROADCASTING, INC.)
KWSZ (105.1 FM; LOMPOC, CA; Owner: MAPLETON COMMUNICATIONS, LLC)
KBOX (104.1 FM; LOMPOC, CA; Owner: AGM-BIRMINGHAM, L.L.C.)
KRUZ (103.3 FM; SANTA BARBARA, CA; Owner: CUMULUS LICENSING CORP.)
KSPE-FM (94.5 FM; ELLWOOD, CA; Owner: CITICASTERS LICENSES, L.P.)
KMGQ (97.5 FM; SANTA BARBARA, CA; Owner: CUMULUS LICENSING CORP.)
KCSB-FM (91.9 FM; SANTA BARBARA, CA; Owner: UNIVERSITY OF CALIFORNIA)
KSMY (106.7 FM; LOMPOC, CA; Owner: CLEAR CHANNEL BROADCASTING LICENSES, INC.)
KSTT-FM (101.3 FM; LOS OSOS-BAYWOOD PAR, CA; Owner: CLEAR CHANNEL BROADCASTING LICENSES, INC.)
KSLY-FM (96.1 FM; SAN LUIS OBISPO, CA; Owner: CLEAR CHANNEL BROADCASTING LICENSES, INC.)
KKAL (99.7 FM; MORRO BAY, CA; Owner: SALISBURY BROADCASTING CORP.)
TV broadcast stations around Santa Maria:
KFUL-LP (Channel 44; SAN LUIS OBISPO, CA; Owner: KJLA, LLC)
KSSY-LP (Channel 66; ARROYO GRANDE, CA; Owner: CHERIE ERWIN)
KAGP-LP (Channel 8; ARROYO GRANDE, CA; Owner: GARY M. COCOLA FAMILY TRUST, GARY M. COCOLA TRUSTEE)
KCOY-TV (Channel 12; SANTA MARIA, CA; Owner: ACKERLEY MEDIA GROUP, INC.)
KWSM-LP (Channel 40; SANTA MARIA, CA; Owner: GARY M. COCOLA FAMILY TRUST, GARY M. COCOLA TRUSTEE)
National Bridge Inventory (NBI) Statistics 33 Number of bridges502ft / 153m Total length596,208 Total average daily traffic36,133 Total average daily truck traffic
New bridges - historical statistics
1 1940-1949 9 1960-1969 6 1970-1979 8 1990-1999 8 2000-2009 1 2010-2019
See full National Bridge Inventory statistics for Santa Maria, CA
Home Mortgage Disclosure Act Aggregated Statistics For Year 2009(Based on 11 full and 8 partial tracts) A) FHA, FSA/RHS & VA B) Conventional C) Refinancings D) Home Improvement Loans F) Non-occupant Loans on G) Loans On Manufactured Number Average Value Number Average Value Number Average Value Number Average Value Number Average Value Number Average Value
LOANS ORIGINATED 454 $213,774 235 $162,150 465 $196,373 20 $102,458 146 $138,523 8 $67,018 APPLICATIONS APPROVED, NOT ACCEPTED 45 $212,587 29 $147,372 47 $211,812 0 $0 17 $150,642 2 $100,205 APPLICATIONS DENIED 74 $203,018 60 $149,580 247 $212,662 15 $99,965 64 $150,222 2 $134,845 APPLICATIONS WITHDRAWN 58 $206,753 34 $158,381 203 $215,101 6 $160,002 31 $168,810 1 $96,420 FILES CLOSED FOR INCOMPLETENESS 9 $178,719 8 $174,482 37 $237,346 0 $0 4 $164,012 0 $0
Aggregated Statistics For Year 2008(Based on 11 full and 8 partial tracts) A) FHA, FSA/RHS & VA B) Conventional C) Refinancings D) Home Improvement Loans E) Loans on Dwellings For 5+ Families F) Non-occupant Loans on G) Loans On Manufactured Number Average Value Number Average Value Number Average Value Number Average Value Number Average Value Number Average Value Number Average Value
LOANS ORIGINATED 257 $237,626 452 $192,420 334 $212,803 46 $127,432 4 $3,414,825 202 $172,720 15 $66,699 APPLICATIONS APPROVED, NOT ACCEPTED 24 $224,318 97 $208,821 100 $238,522 5 $153,504 0 $0 34 $209,991 9 $81,128 APPLICATIONS DENIED 81 $234,856 172 $208,501 416 $269,848 50 $106,761 3 $262,333 76 $173,840 16 $59,582 APPLICATIONS WITHDRAWN 81 $217,272 96 $183,108 208 $255,457 14 $112,786 2 $2,444,500 62 $197,160 4 $77,298 FILES CLOSED FOR INCOMPLETENESS 7 $236,329 18 $212,577 33 $241,407 1 $14,580 0 $0 9 $135,873 0 $0
Aggregated Statistics For Year 2007(Based on 11 full and 8 partial tracts) A) FHA, FSA/RHS & VA B) Conventional C) Refinancings D) Home Improvement Loans E) Loans on Dwellings For 5+ Families F) Non-occupant Loans on G) Loans On Manufactured Number Average Value Number Average Value Number Average Value Number Average Value Number Average Value Number Average Value Number Average Value
LOANS ORIGINATED 9 $305,789 516 $245,888 1,040 $240,024 150 $173,887 7 $2,668,166 248 $244,530 16 $66,064 APPLICATIONS APPROVED, NOT ACCEPTED 0 $0 125 $243,025 339 $275,913 22 $136,793 1 $550,000 64 $263,620 5 $111,762 APPLICATIONS DENIED 2 $308,740 266 $262,221 1,108 $291,874 92 $176,819 0 $0 129 $282,652 11 $74,440 APPLICATIONS WITHDRAWN 2 $304,000 93 $225,476 411 $294,897 30 $190,982 2 $1,578,500 61 $286,571 1 $269,340 FILES CLOSED FOR INCOMPLETENESS 0 $0 31 $260,614 122 $321,708 7 $181,519 0 $0 13 $267,516 1 $71,080
Aggregated Statistics For Year 2006(Based on 11 full and 8 partial tracts) A) FHA, FSA/RHS & VA B) Conventional C) Refinancings D) Home Improvement Loans E) Loans on Dwellings For 5+ Families F) Non-occupant Loans on G) Loans On Manufactured Number Average Value Number Average Value Number Average Value Number Average Value Number Average Value Number Average Value Number Average Value
LOANS ORIGINATED 1 $494,350 955 $245,442 1,997 $267,309 249 $179,119 18 $1,280,471 346 $274,419 19 $78,115 APPLICATIONS APPROVED, NOT ACCEPTED 0 $0 221 $230,349 456 $285,203 39 $198,050 1 $1,000,000 69 $296,604 8 $78,750 APPLICATIONS DENIED 0 $0 409 $247,677 1,069 $286,082 161 $176,941 3 $909,000 142 $278,290 12 $105,441 APPLICATIONS WITHDRAWN 0 $0 233 $250,933 741 $294,349 35 $221,412 5 $404,808 89 $303,633 3 $120,910 FILES CLOSED FOR INCOMPLETENESS 0 $0 36 $237,192 159 $303,499 10 $232,779 1 $50,000 17 $305,498 2 $87,030
Aggregated Statistics For Year 2005(Based on 11 full and 8 partial tracts) A) FHA, FSA/RHS & VA B) Conventional C) Refinancings D) Home Improvement Loans E) Loans on Dwellings For 5+ Families F) Non-occupant Loans on G) Loans On Manufactured Number Average Value Number Average Value Number Average Value Number Average Value Number Average Value Number Average Value Number Average Value
LOANS ORIGINATED 1 $305,500 1,710 $253,066 2,380 $269,229 327 $228,454 13 $2,873,935 532 $261,319 20 $66,221 APPLICATIONS APPROVED, NOT ACCEPTED 0 $0 246 $241,304 360 $276,550 36 $188,043 0 $0 54 $261,659 6 $58,872 APPLICATIONS DENIED 0 $0 403 $249,981 906 $275,137 191 $181,382 1 $825,000 133 $273,254 28 $106,633 APPLICATIONS WITHDRAWN 1 $340,000 422 $247,370 720 $259,676 86 $217,667 3 $984,490 100 $260,938 4 $111,158 FILES CLOSED FOR INCOMPLETENESS 0 $0 77 $270,285 341 $273,500 17 $257,985 0 $0 31 $258,480 0 $0
Aggregated Statistics For Year 2004(Based on 11 full and 8 partial tracts) A) FHA, FSA/RHS & VA B) Conventional C) Refinancings D) Home Improvement Loans E) Loans on Dwellings For 5+ Families F) Non-occupant Loans on G) Loans On Manufactured Number Average Value Number Average Value Number Average Value Number Average Value Number Average Value Number Average Value Number Average Value
LOANS ORIGINATED 33 $259,670 1,785 $224,733 2,500 $217,777 368 $137,699 15 $1,829,447 561 $217,059 23 $79,606 APPLICATIONS APPROVED, NOT ACCEPTED 0 $0 201 $220,066 401 $205,267 46 $139,281 0 $0 60 $206,331 10 $81,007 APPLICATIONS DENIED 5 $295,030 390 $209,698 926 $221,292 181 $102,063 1 $500,000 133 $210,470 19 $81,516 APPLICATIONS WITHDRAWN 1 $140,170 318 $222,410 894 $206,384 73 $119,440 11 $745,902 74 $206,389 6 $108,408 FILES CLOSED FOR INCOMPLETENESS 1 $115,000 51 $252,758 139 $238,511 18 $121,693 1 $240,000 20 $215,844 1 $34,000
Aggregated Statistics For Year 2003(Based on 11 full and 8 partial tracts) A) FHA, FSA/RHS & VA B) Conventional C) Refinancings D) Home Improvement Loans E) Loans on Dwellings For 5+ Families F) Non-occupant Loans on Number Average Value Number Average Value Number Average Value Number Average Value Number Average Value Number Average Value
LOANS ORIGINATED 146 $235,746 1,203 $195,478 4,105 $166,075 90 $49,827 21 $960,902 671 $170,357 APPLICATIONS APPROVED, NOT ACCEPTED 5 $186,624 131 $174,725 507 $171,348 34 $60,610 1 $298,000 68 $160,072 APPLICATIONS DENIED 9 $236,393 254 $179,124 891 $172,597 103 $48,911 1 $1,100,000 118 $169,962 APPLICATIONS WITHDRAWN 10 $239,906 119 $206,090 912 $175,222 36 $58,576 1 $490,000 58 $171,804 FILES CLOSED FOR INCOMPLETENESS 0 $0 33 $202,121 104 $178,618 6 $40,605 0 $0 21 $166,559
Aggregated Statistics For Year 2002(Based on 6 full and 4 partial tracts) A) FHA, FSA/RHS & VA B) Conventional C) Refinancings D) Home Improvement Loans E) Loans on Dwellings For 5+ Families F) Non-occupant Loans on Number Average Value Number Average Value Number Average Value Number Average Value Number Average Value Number Average Value
LOANS ORIGINATED 101 $201,899 485 $171,376 999 $144,572 25 $42,595 17 $668,338 238 $143,190 APPLICATIONS APPROVED, NOT ACCEPTED 3 $118,947 48 $150,338 136 $137,281 5 $25,992 0 $0 16 $124,426 APPLICATIONS DENIED 7 $157,404 95 $149,345 247 $135,072 38 $29,754 1 $495,900 31 $123,553 APPLICATIONS WITHDRAWN 2 $225,090 46 $156,448 208 $149,528 15 $30,048 1 $346,000 18 $130,318 FILES CLOSED FOR INCOMPLETENESS 1 $164,710 7 $163,549 42 $165,329 2 $79,000 1 $550,000 6 $136,375
Aggregated Statistics For Year 2001(Based on 6 full and 4 partial tracts) A) FHA, FSA/RHS & VA B) Conventional C) Refinancings D) Home Improvement Loans E) Loans on Dwellings For 5+ Families F) Non-occupant Loans on Number Average Value Number Average Value Number Average Value Number Average Value Number Average Value Number Average Value
LOANS ORIGINATED 117 $165,114 280 $129,938 805 $124,944 42 $32,903 7 $3,809,989 149 $126,602 APPLICATIONS APPROVED, NOT ACCEPTED 7 $150,611 22 $127,773 99 $112,243 9 $22,417 1 $2,460,680 15 $123,035 APPLICATIONS DENIED 16 $128,532 57 $109,146 277 $112,438 59 $19,033 0 $0 41 $123,246 APPLICATIONS WITHDRAWN 7 $129,896 25 $132,732 206 $121,130 32 $29,662 1 $550,000 10 $113,384 FILES CLOSED FOR INCOMPLETENESS 2 $233,500 6 $103,503 39 $125,944 6 $30,010 0 $0 5 $89,464
Aggregated Statistics For Year 2000(Based on 6 full and 4 partial tracts) A) FHA, FSA/RHS & VA B) Conventional C) Refinancings D) Home Improvement Loans E) Loans on Dwellings For 5+ Families F) Non-occupant Loans on Number Average Value Number Average Value Number Average Value Number Average Value Number Average Value Number Average Value
LOANS ORIGINATED 133 $138,393 263 $104,575 193 $84,008 29 $22,088 13 $553,692 62 $107,538 APPLICATIONS APPROVED, NOT ACCEPTED 7 $121,023 22 $93,293 33 $90,480 9 $24,588 0 $0 9 $103,208 APPLICATIONS DENIED 9 $148,984 50 $90,565 160 $74,659 28 $23,505 1 $163,000 18 $84,501 APPLICATIONS WITHDRAWN 9 $161,703 33 $109,512 78 $79,467 6 $18,398 0 $0 6 $98,690 FILES CLOSED FOR INCOMPLETENESS 1 $144,860 7 $111,461 9 $78,186 2 $56,450 0 $0 1 $50,620
Aggregated Statistics For Year 1999(Based on 8 full and 8 partial tracts) A) FHA, FSA/RHS & VA B) Conventional C) Refinancings D) Home Improvement Loans E) Loans on Dwellings For 5+ Families F) Non-occupant Loans on Number Average Value Number Average Value Number Average Value Number Average Value Number Average Value Number Average Value
LOANS ORIGINATED 265 $124,314 501 $112,939 670 $93,118 67 $23,798 17 $1,072,215 174 $88,719 APPLICATIONS APPROVED, NOT ACCEPTED 13 $120,416 59 $84,441 110 $99,673 18 $21,933 1 $114,520 17 $85,148 APPLICATIONS DENIED 21 $117,410 98 $105,247 340 $86,962 61 $19,400 3 $283,137 31 $94,156 APPLICATIONS WITHDRAWN 22 $133,420 54 $119,862 218 $92,602 18 $44,406 2 $334,090 29 $79,757 FILES CLOSED FOR INCOMPLETENESS 5 $99,598 10 $97,131 51 $118,063 3 $31,667 1 $1,360,000 5 $93,820
Detailed mortgage data for all 19 tracts in Santa Maria, CA
Private Mortgage Insurance Companies Aggregated Statistics For Year 2009(Based on 11 full and 7 partial tracts) A) Conventional B) Refinancings C) Non-occupant Loans on Number Average Value Number Average Value Number Average Value
LOANS ORIGINATED 34 $211,150 4 $315,618 1 $161,750 APPLICATIONS APPROVED, NOT ACCEPTED 17 $209,467 1 $430,260 1 $218,090 APPLICATIONS DENIED 7 $191,299 1 $429,110 0 $0 APPLICATIONS WITHDRAWN 1 $246,000 0 $0 0 $0 FILES CLOSED FOR INCOMPLETENESS 4 $262,612 0 $0 0 $0
Aggregated Statistics For Year 2008(Based on 11 full and 8 partial tracts) A) Conventional B) Refinancings C) Non-occupant Loans on Number Average Value Number Average Value Number Average Value
LOANS ORIGINATED 169 $244,128 26 $284,118 10 $180,629 APPLICATIONS APPROVED, NOT ACCEPTED 77 $270,363 37 $330,282 6 $247,272 APPLICATIONS DENIED 32 $222,361 2 $270,910 12 $235,304 APPLICATIONS WITHDRAWN 6 $264,895 3 $275,600 1 $256,280 FILES CLOSED FOR INCOMPLETENESS 5 $284,384 1 $315,980 1 $285,000
Aggregated Statistics For Year 2007(Based on 11 full and 8 partial tracts) A) Conventional B) Refinancings C) Non-occupant Loans on Number Average Value Number Average Value Number Average Value
LOANS ORIGINATED 79 $313,688 49 $369,099 4 $189,305 APPLICATIONS APPROVED, NOT ACCEPTED 8 $310,224 23 $376,745 1 $212,000 APPLICATIONS DENIED 4 $276,428 7 $320,570 2 $305,000 APPLICATIONS WITHDRAWN 5 $313,014 5 $376,800 0 $0 FILES CLOSED FOR INCOMPLETENESS 0 $0 0 $0 0 $0
Aggregated Statistics For Year 2006(Based on 9 full and 8 partial tracts) A) Conventional B) Refinancings C) Non-occupant Loans on Number Average Value Number Average Value Number Average Value
LOANS ORIGINATED 11 $381,468 31 $381,850 2 $326,000 APPLICATIONS APPROVED, NOT ACCEPTED 4 $405,815 13 $353,145 0 $0 APPLICATIONS DENIED 0 $0 1 $288,100 0 $0 APPLICATIONS WITHDRAWN 0 $0 3 $329,750 0 $0 FILES CLOSED FOR INCOMPLETENESS 0 $0 0 $0 0 $0
Aggregated Statistics For Year 2005(Based on 11 full and 6 partial tracts) A) Conventional B) Refinancings C) Non-occupant Loans on Number Average Value Number Average Value Number Average Value
LOANS ORIGINATED 24 $349,110 29 $345,581 4 $222,692 APPLICATIONS APPROVED, NOT ACCEPTED 5 $321,794 10 $324,173 0 $0 APPLICATIONS DENIED 2 $229,335 0 $0 0 $0 APPLICATIONS WITHDRAWN 1 $145,000 1 $308,000 0 $0 FILES CLOSED FOR INCOMPLETENESS 0 $0 1 $251,180 0 $0
Aggregated Statistics For Year 2004(Based on 10 full and 8 partial tracts) A) Conventional B) Refinancings C) Non-occupant Loans on Number Average Value Number Average Value Number Average Value
LOANS ORIGINATED 88 $284,525 42 $291,422 9 $245,784 APPLICATIONS APPROVED, NOT ACCEPTED 26 $282,577 14 $288,035 4 $184,080 APPLICATIONS DENIED 3 $334,713 1 $353,180 0 $0 APPLICATIONS WITHDRAWN 7 $246,000 4 $232,660 2 $256,000 FILES CLOSED FOR INCOMPLETENESS 1 $286,000 0 $0 0 $0
Aggregated Statistics For Year 2003(Based on 11 full and 8 partial tracts) A) Conventional B) Refinancings C) Non-occupant Loans on Number Average Value Number Average Value Number Average Value
LOANS ORIGINATED 187 $255,528 63 $216,814 19 $235,953 APPLICATIONS APPROVED, NOT ACCEPTED 41 $223,298 37 $218,634 7 $194,469 APPLICATIONS DENIED 2 $140,895 7 $231,003 0 $0 APPLICATIONS WITHDRAWN 28 $211,607 2 $210,265 2 $120,800 FILES CLOSED FOR INCOMPLETENESS 1 $87,970 0 $0 1 $87,970
Aggregated Statistics For Year 2002(Based on 6 full and 4 partial tracts) A) Conventional B) Refinancings C) Non-occupant Loans on Number Average Value Number Average Value Number Average Value
LOANS ORIGINATED 90 $209,741 31 $194,366 10 $187,906 APPLICATIONS APPROVED, NOT ACCEPTED 12 $192,093 13 $170,231 2 $139,805 APPLICATIONS DENIED 2 $157,810 4 $166,400 0 $0 APPLICATIONS WITHDRAWN 0 $0 1 $178,070 0 $0 FILES CLOSED FOR INCOMPLETENESS 0 $0 0 $0 0 $0
Aggregated Statistics For Year 2001(Based on 6 full and 4 partial tracts) A) Conventional B) Refinancings C) Non-occupant Loans on Number Average Value Number Average Value Number Average Value
LOANS ORIGINATED 59 $156,036 41 $156,424 5 $105,160 APPLICATIONS APPROVED, NOT ACCEPTED 7 $129,929 4 $156,988 3 $98,000 APPLICATIONS DENIED 1 $48,460 1 $158,650 0 $0 APPLICATIONS WITHDRAWN 1 $107,160 0 $0 0 $0 FILES CLOSED FOR INCOMPLETENESS 0 $0 0 $0 0 $0
Aggregated Statistics For Year 2000(Based on 5 full and 4 partial tracts) A) Conventional B) Refinancings C) Non-occupant Loans on Number Average Value Number Average Value Number Average Value
LOANS ORIGINATED 60 $127,120 23 $135,263 9 $118,583 APPLICATIONS APPROVED, NOT ACCEPTED 12 $114,476 7 $129,981 1 $207,870 APPLICATIONS DENIED 1 $158,860 2 $174,435 0 $0 APPLICATIONS WITHDRAWN 0 $0 0 $0 0 $0 FILES CLOSED FOR INCOMPLETENESS 2 $91,425 1 $103,000 1 $103,000
Aggregated Statistics For Year 1999(Based on 8 full and 8 partial tracts) A) Conventional B) Refinancings C) Non-occupant Loans on Number Average Value Number Average Value Number Average Value
LOANS ORIGINATED 138 $127,450 80 $126,351 13 $100,921 APPLICATIONS APPROVED, NOT ACCEPTED 17 $125,144 12 $126,098 1 $150,430 APPLICATIONS DENIED 5 $169,902 8 $114,412 1 $120,350 APPLICATIONS WITHDRAWN 3 $111,130 8 $99,789 1 $61,420 FILES CLOSED FOR INCOMPLETENESS 0 $0 1 $157,030 0 $0
Fire-safe hotels and motels in Santa Maria, California:
Santa Maria Inn, 801 S Broadway, Santa Maria, California 93454 Phone: (805) 928-7777, Fax: (805) 928-5690
Holiday In Hotel & Suites, 2100 N Broadway, Santa Maria, California 93454 Phone: (805) 928-6000, Fax: (805) 928-0356
Best Western Big America, 1725 N Broadway, Santa Maria, California 93454 Phone: (805) 922-5200, Fax: (805) 922-9865
Radisson Hotel Santa Maria, 3455 Skwy Dr, Santa Maria, California 93455 Phone: (805) 928-8000, Fax: (805) 928-5251
Town Center Hotel, 215 N Broadway, Santa Maria, California 93454 Phone: (805) 925-6163
Comfort Inn, 210 Nicholson Ave, Santa Maria, California 93454 Phone: (805) 922-5891, Fax: (805) 922-7821
Travelodge, 1514 S Broadway, Santa Maria, California 93454 Phone: (805) 922-2123, Fax: (805) 925-1523
Fairfield Inn & Suites By Marriott, 2061 N Roemer Ct, Santa Maria, California 93454 Phone: (805) 925-8500, Fax: (805) 925-8055
3 other hotels and motels
All 11 fire-safe hotels and motels in Santa Maria, California
Most common first names in Santa Maria, CA among deceased individuals Name Count Lived (average)
John 449 75.1 years Mary 424 80.1 years Robert 402 72.6 years William 393 76.2 years James 322 74.3 years George 246 76.4 years Charles 213 75.8 years Dorothy 200 78.3 years Margaret 197 79.4 years Frank 191 75.9 years
Most common last names in Santa Maria, CA among deceased individuals Last name Count Lived (average)
Smith 164 75.3 years Johnson 124 74.9 years Brown 105 76.8 years Miller 96 75.8 years Silva 87 79.8 years Williams 79 75.2 years Jones 75 76.5 years Wilson 74 76.8 years Davis 72 74.7 years Martinez 71 71.4 years
Santa Maria compared to California state average:
Unemployed percentage below state average. Black race population percentage significantly below state average. Hispanic race population percentage above state average. Foreign-born population percentage above state average. Percentage of population with a bachelor's degree or higher below state average. Santa Maria on our top lists :
#2 on the list of "Top 101 cities with largest percentage of females in industries: agriculture, forestry, fishing and hunting (population 50,000+)"
#2 on the list of "Top 101 cities with largest percentage of males in occupations: farming, fishing, and forestry occupations (population 50,000+)"
#2 on the list of "Top 101 cities with largest percentage of females in occupations: farming, fishing, and forestry occupations (population 50,000+)"
#3 on the list of "Top 101 cities with largest percentage of males in industries: agriculture, forestry, fishing and hunting (population 50,000+)"
#9 on the list of "Top 101 cities with the least people having Master's or Doctorate degrees (population 50,000+)"
#12 on the list of "Top 101 cities with the smallest temperature differences during a year (population 50,000+)"
#14 on the list of "Top 100 least-educated cities (pop. 50,000+)"
#34 on the list of "Top 101 cities with the smallest percentages of current college students (population 100,000+)"
#38 on the list of "Top 101 cities with the lowest number of police officers per 1000 residents (population 50,000+)"
#42 on the list of "Top 101 cities with the least people having professional degrees (population 50,000+)"
#43 on the list of "Top 101 cities with the lowest percentage of workers working at home, population 50,000+"
#43 on the list of "Top 101 cities with the lowest percentage of English-only speaking households, population 50,000+"
#45 on the list of "Top 101 cities with the lowest average snowfall in a year (population 50,000+)"
#51 on the list of "Top 101 cities with the least people having Doctorate degrees (population 50,000+)"
#52 on the list of "Top 101 cities with the largest city-data.com crime index per police officer (population 50,000+)"
#53 on the list of "Top 101 cities with the highest percentage of family households, population 100,000+"
#54 on the list of "Top 101 cities with the highest maximum monthly morning or afternoon humidity (population 50,000+)"
#56 on the list of "Top 100 cities with the largest percentage of males (pop. 50,000+)"
#61 on the list of "Top 101 cities with largest percentage of males in industries: mining, quarrying, and oil and gas extraction (population 50,000+)"
#62 on the list of "Top 100 cities with youngest residents (pop. 50,000+)"
#66 (93458) on the list of "Top 101 zip codes with the smallest percentage of taxpayers reporting profit/loss from business in 2012 (pop 5,000+)"
#81 (93458) on the list of "Top 101 zip codes with the largest percentage of returns reporting salary or wage in 2012 (pop 5,000+)"
#17 on the list of "Top 101 counties with the lowest Sulfur Oxides Annual air pollution readings in 2012 (µg/m3 )"
#32 on the list of "Top 101 counties with the highest Nitrogen Dioxide air pollution readings in 2012 (ppm)"
#38 on the list of "Top 101 counties with the lowest number of infant deaths per 1000 residents 2007-2013 (pop. 50,000+)"
#78 on the list of "Top 101 counties with the highest carbon monoxide air pollution readings in 2012 (ppm)"
#81 on the list of "Top 101 counties with the largest decrease in the number of infant deaths per 1000 residents 2000-2006 to 2007-2013 (pop. 50,000+)"
Top Patent Applicants
Charles E. Ankner (7)
John D. Riley (7)
William Daily (6)
Wenhui Zhou (6)
Denzal Wayne Van Winkle (5)
Frank D. Elswick (5)
Dong-Kil Yim (4)
Edmund David Burke (4)
Donna Shpak (4)
Nahum Shpak (4)
Total of 148 patent applications in 2008-2024.
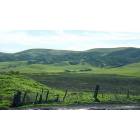

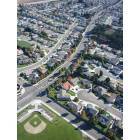
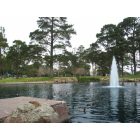
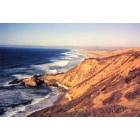
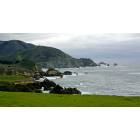
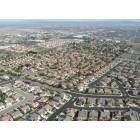


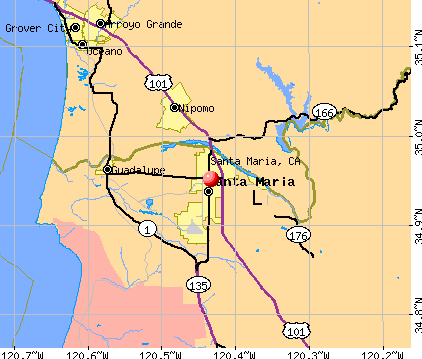


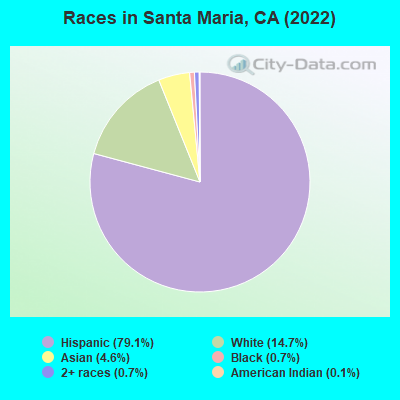
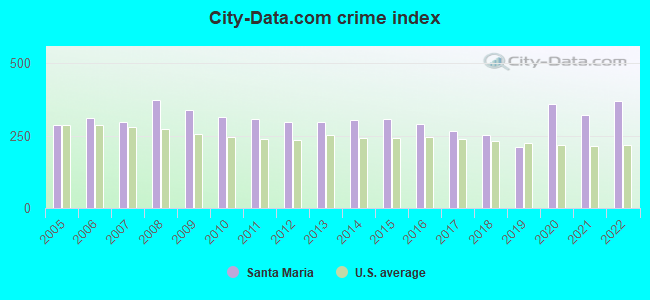
 Recent articles from our blog. Our writers, many of them Ph.D. graduates or candidates, create easy-to-read articles on a wide variety of topics.


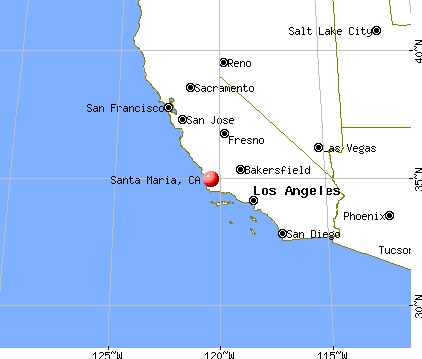
 (84.1 miles
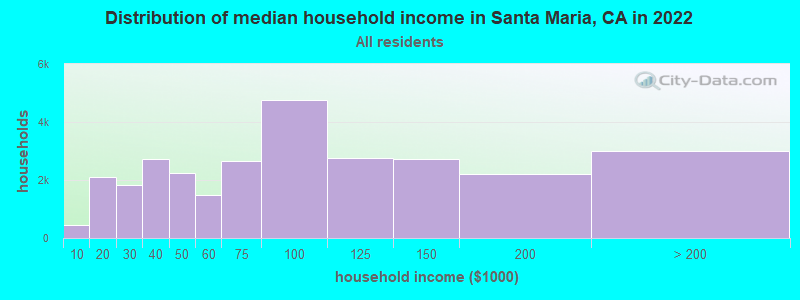
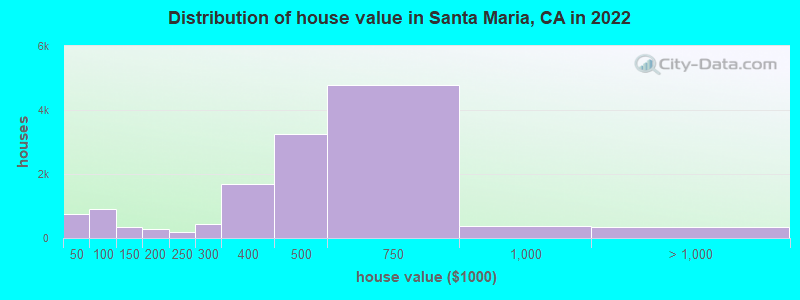
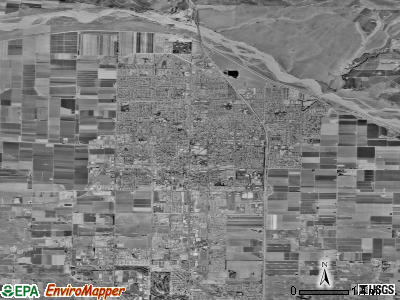
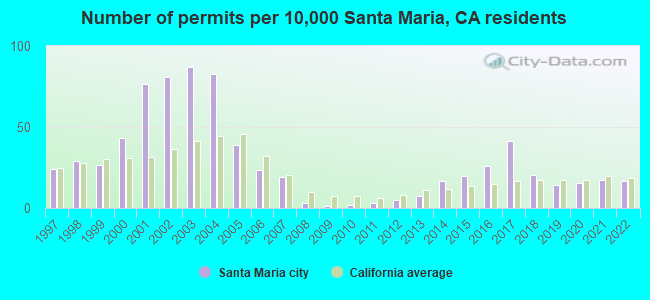
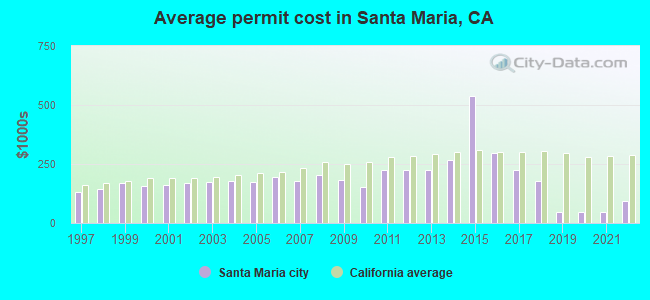
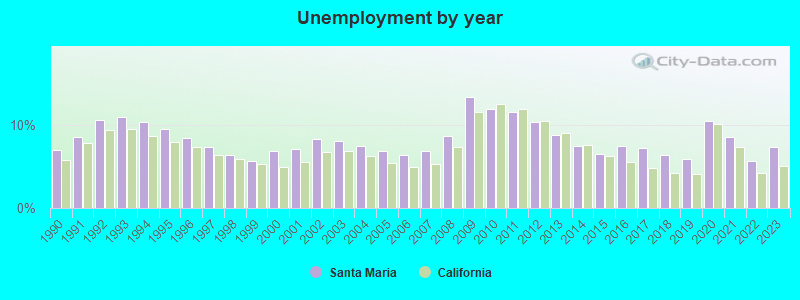
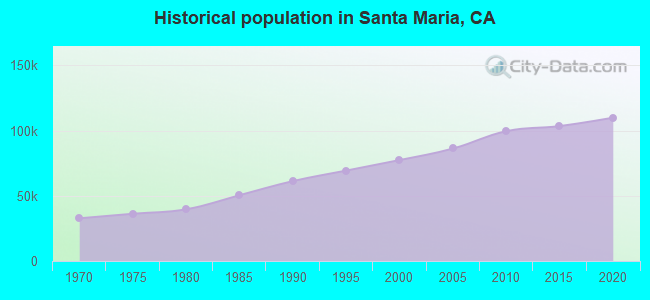
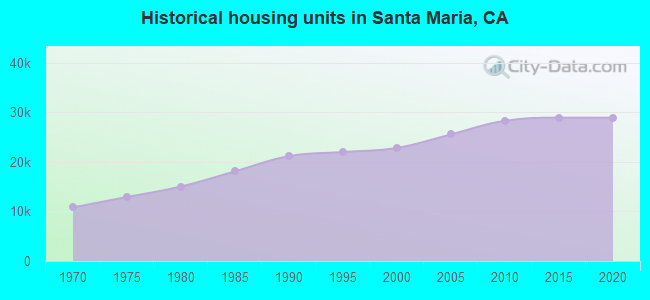
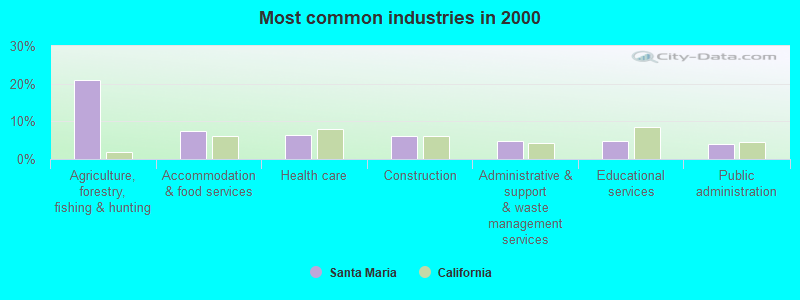
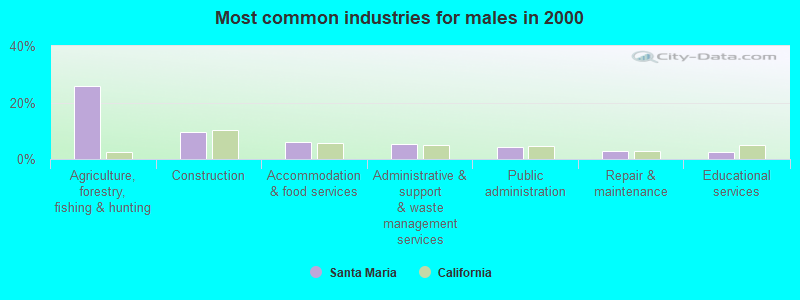
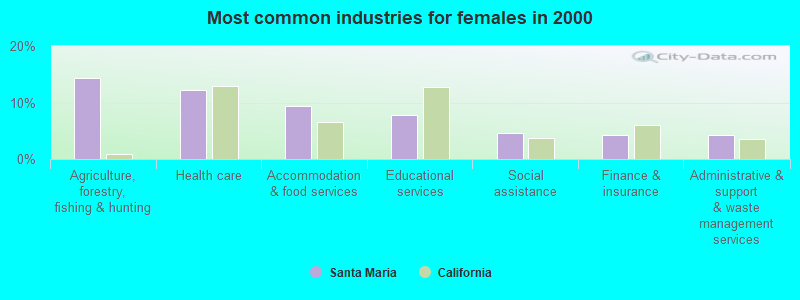
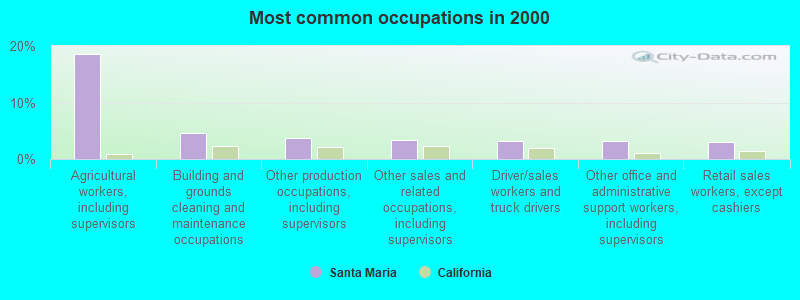
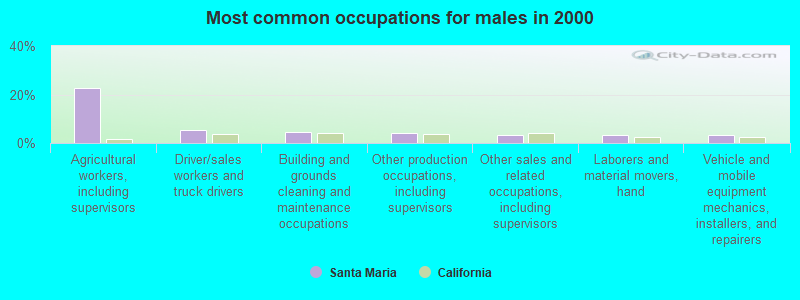
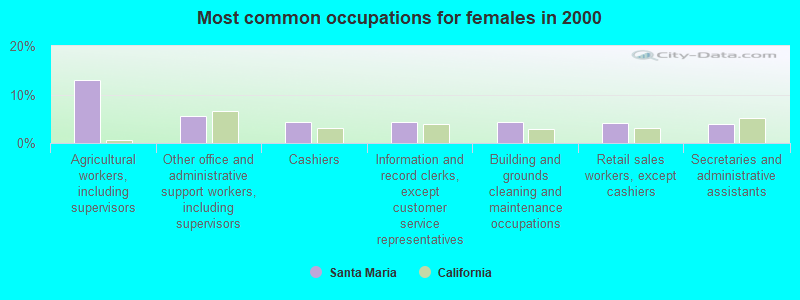
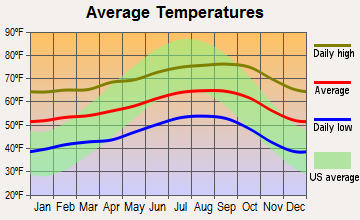
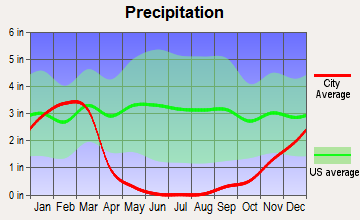
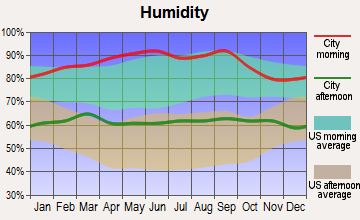
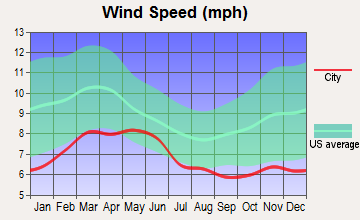
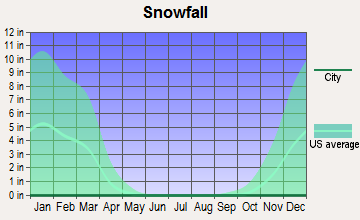
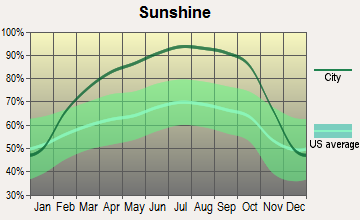
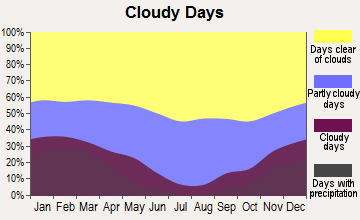
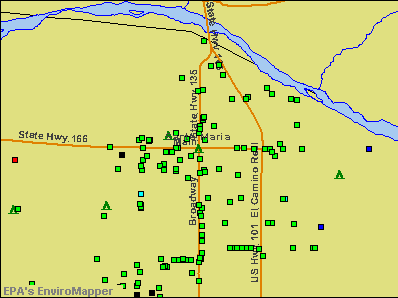

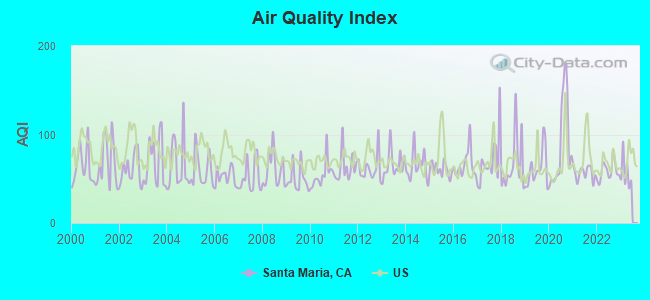
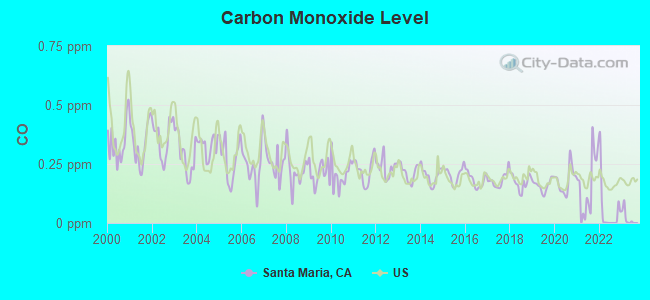
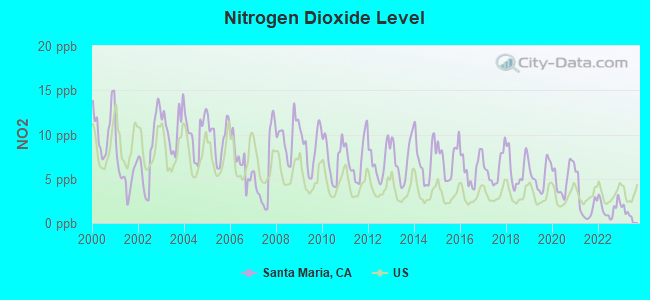
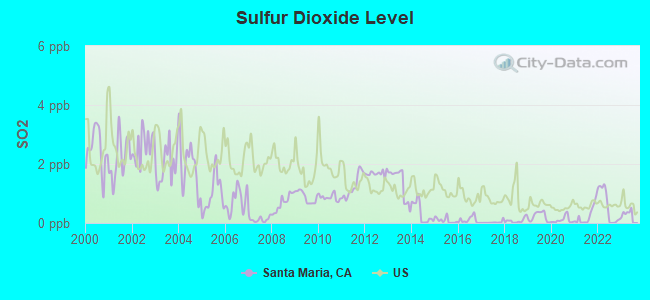
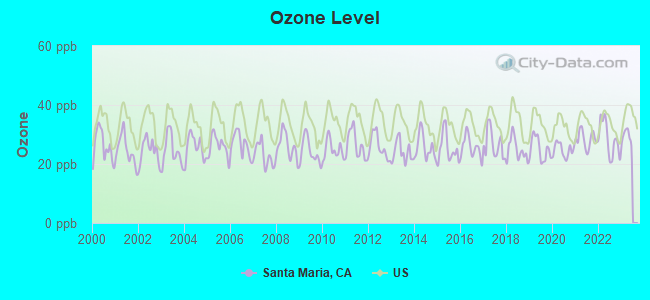
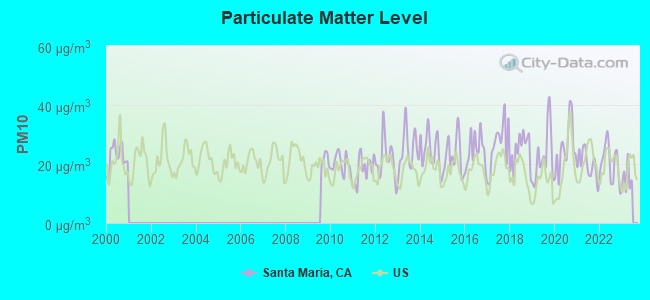
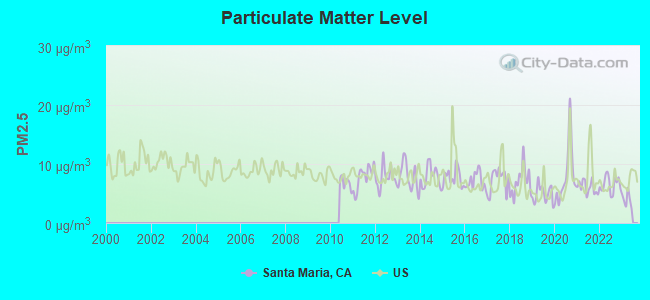
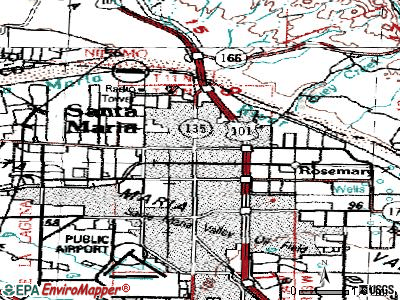
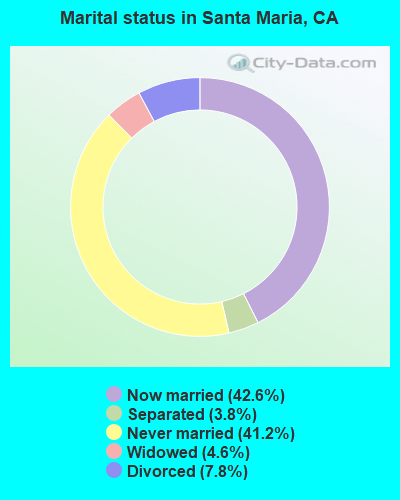
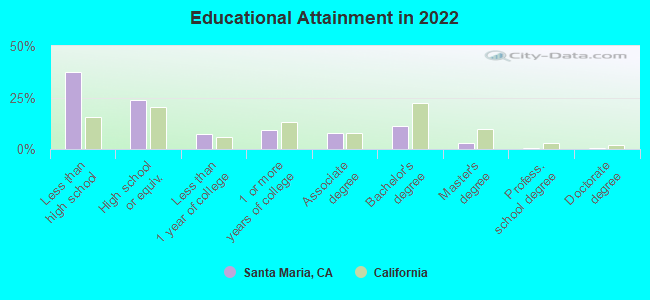
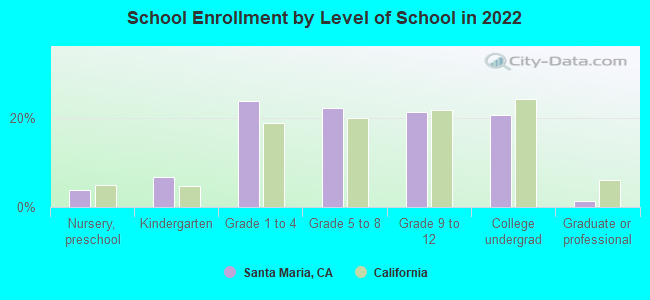
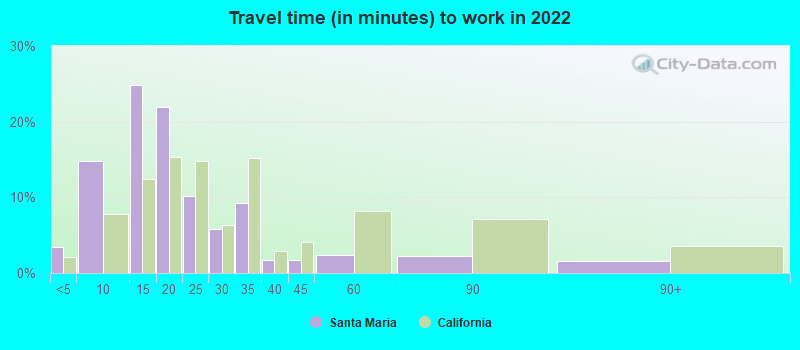
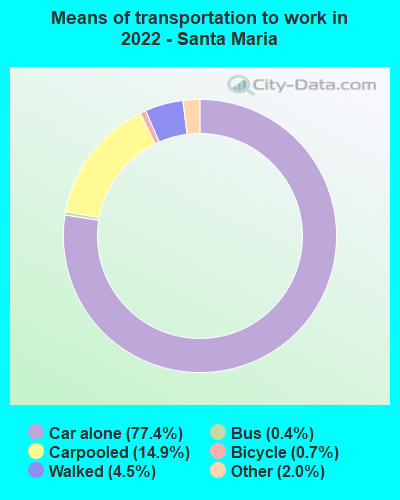
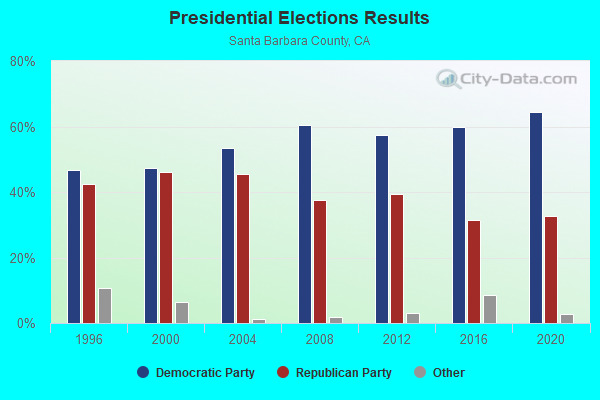
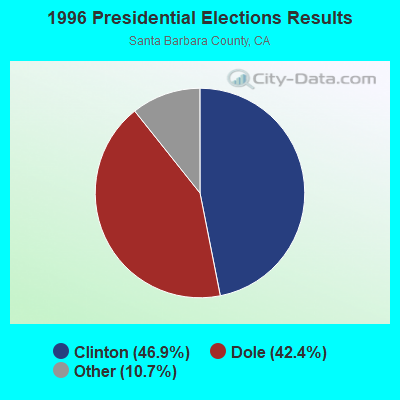
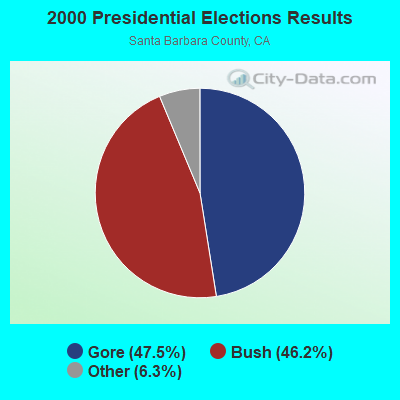
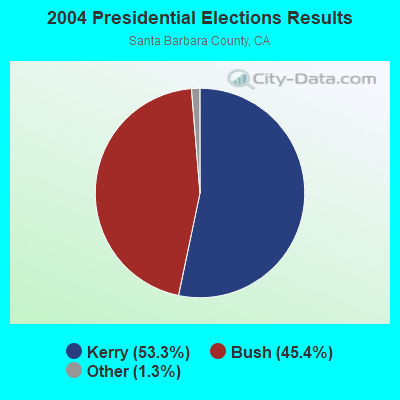
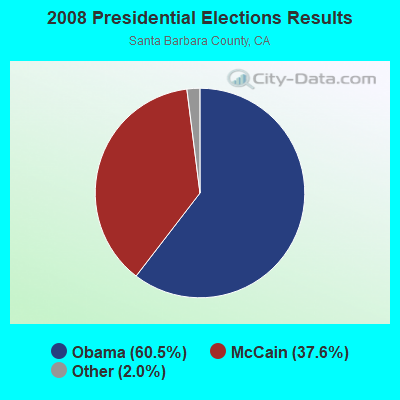
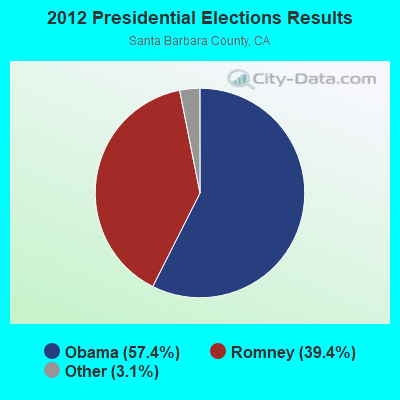
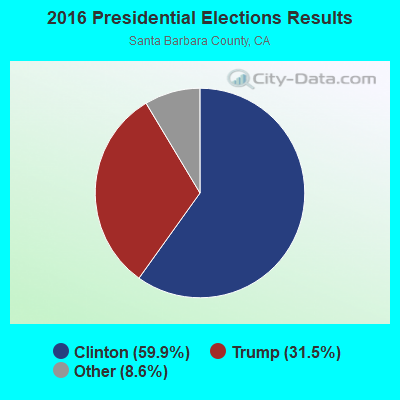
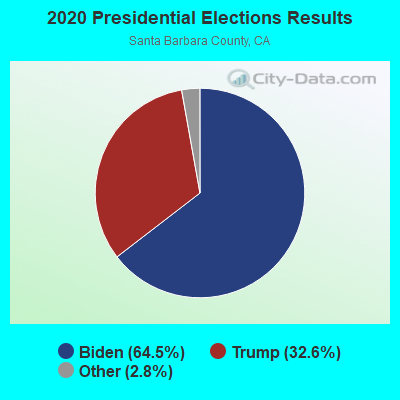
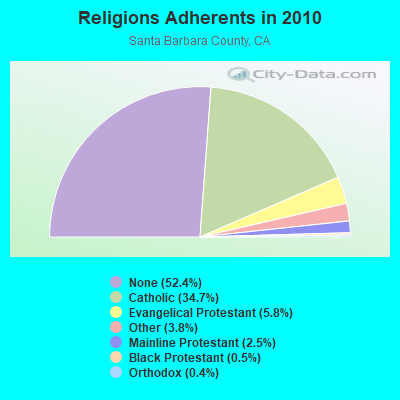
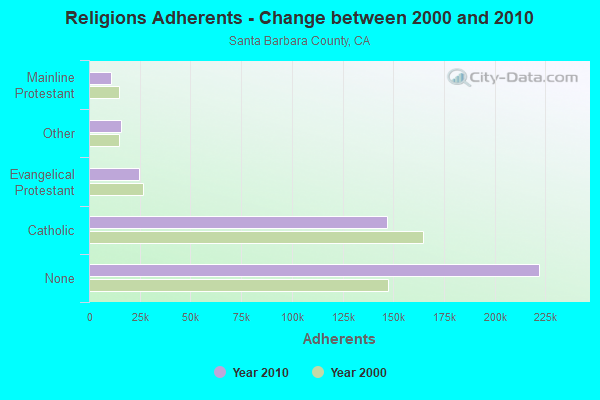
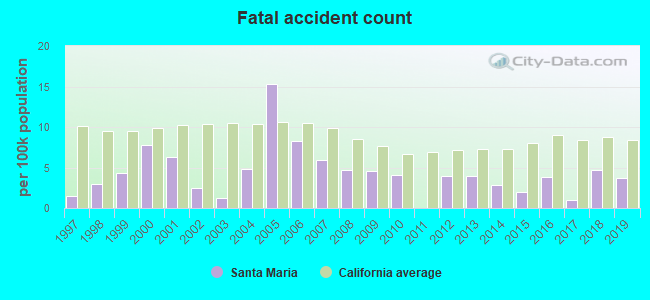
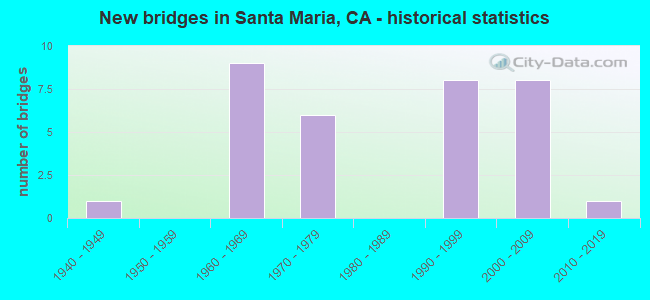
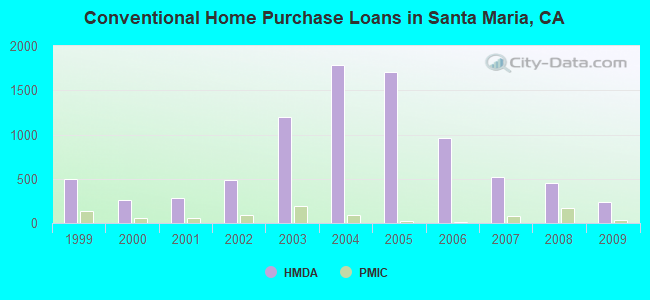
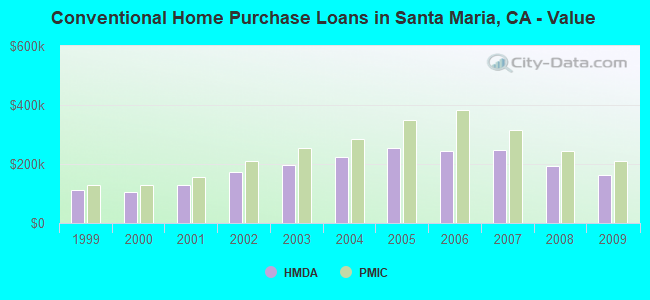
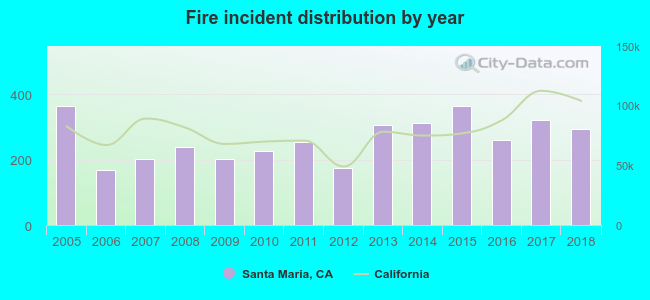 Based on the data from the years 2005 - 2018 the average number of fires per year is 264. The highest number of reported fires - 365 took place in 2015, and the least - 169 in 2006. The data has a declining trend.
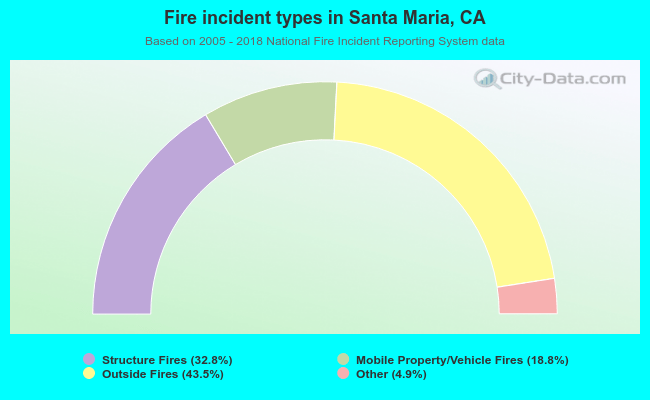 When looking into fire subcategories, the most reports belonged to: Outside Fires (43.5%), and Structure Fires (32.8%).