Simpsonville, South Carolina Submit your own pictures of this city and show them to the world
OSM Map
General Map
Google Map
MSN Map
OSM Map
General Map
Google Map
MSN Map
OSM Map
General Map
Google Map
MSN Map
OSM Map
General Map
Google Map
MSN Map
Please wait while loading the map...
Population in 2022: 26,748 (100% urban, 0% rural). Population change since 2000: +86.4%Males: 13,571 Females: 13,177
March 2022 cost of living index in Simpsonville: 86.2 (less than average, U.S. average is 100) Percentage of residents living in poverty in 2022: 6.4%for White Non-Hispanic residents , 13.8% for Black residents )
Profiles of local businesses
Business Search - 14 Million verified businesses
Data:
Median household income ($)
Median household income (% change since 2000)
Household income diversity
Ratio of average income to average house value (%)
Ratio of average income to average rent
Median household income ($) - White
Median household income ($) - Black or African American
Median household income ($) - Asian
Median household income ($) - Hispanic or Latino
Median household income ($) - American Indian and Alaska Native
Median household income ($) - Multirace
Median household income ($) - Other Race
Median household income for houses/condos with a mortgage ($)
Median household income for apartments without a mortgage ($)
Races - White alone (%)
Races - White alone (% change since 2000)
Races - Black alone (%)
Races - Black alone (% change since 2000)
Races - American Indian alone (%)
Races - American Indian alone (% change since 2000)
Races - Asian alone (%)
Races - Asian alone (% change since 2000)
Races - Hispanic (%)
Races - Hispanic (% change since 2000)
Races - Native Hawaiian and Other Pacific Islander alone (%)
Races - Native Hawaiian and Other Pacific Islander alone (% change since 2000)
Races - Two or more races (%)
Races - Two or more races (% change since 2000)
Races - Other race alone (%)
Races - Other race alone (% change since 2000)
Racial diversity
Unemployment (%)
Unemployment (% change since 2000)
Unemployment (%) - White
Unemployment (%) - Black or African American
Unemployment (%) - Asian
Unemployment (%) - Hispanic or Latino
Unemployment (%) - American Indian and Alaska Native
Unemployment (%) - Multirace
Unemployment (%) - Other Race
Population density (people per square mile)
Population - Males (%)
Population - Females (%)
Population - Males (%) - White
Population - Males (%) - Black or African American
Population - Males (%) - Asian
Population - Males (%) - Hispanic or Latino
Population - Males (%) - American Indian and Alaska Native
Population - Males (%) - Multirace
Population - Males (%) - Other Race
Population - Females (%) - White
Population - Females (%) - Black or African American
Population - Females (%) - Asian
Population - Females (%) - Hispanic or Latino
Population - Females (%) - American Indian and Alaska Native
Population - Females (%) - Multirace
Population - Females (%) - Other Race
Coronavirus confirmed cases (Apr 24, 2024)
Deaths caused by coronavirus (Apr 24, 2024)
Coronavirus confirmed cases (per 100k population) (Apr 24, 2024)
Deaths caused by coronavirus (per 100k population) (Apr 24, 2024)
Daily increase in number of cases (Apr 24, 2024)
Weekly increase in number of cases (Apr 24, 2024)
Cases doubled (in days) (Apr 24, 2024)
Hospitalized patients (Apr 18, 2022)
Negative test results (Apr 18, 2022)
Total test results (Apr 18, 2022)
COVID Vaccine doses distributed (per 100k population) (Sep 19, 2023)
COVID Vaccine doses administered (per 100k population) (Sep 19, 2023)
COVID Vaccine doses distributed (Sep 19, 2023)
COVID Vaccine doses administered (Sep 19, 2023)
Likely homosexual households (%)
Likely homosexual households (% change since 2000)
Likely homosexual households - Lesbian couples (%)
Likely homosexual households - Lesbian couples (% change since 2000)
Likely homosexual households - Gay men (%)
Likely homosexual households - Gay men (% change since 2000)
Cost of living index
Median gross rent ($)
Median contract rent ($)
Median monthly housing costs ($)
Median house or condo value ($)
Median house or condo value ($ change since 2000)
Mean house or condo value by units in structure - 1, detached ($)
Mean house or condo value by units in structure - 1, attached ($)
Mean house or condo value by units in structure - 2 ($)
Mean house or condo value by units in structure by units in structure - 3 or 4 ($)
Mean house or condo value by units in structure - 5 or more ($)
Mean house or condo value by units in structure - Boat, RV, van, etc. ($)
Mean house or condo value by units in structure - Mobile home ($)
Median house or condo value ($) - White
Median house or condo value ($) - Black or African American
Median house or condo value ($) - Asian
Median house or condo value ($) - Hispanic or Latino
Median house or condo value ($) - American Indian and Alaska Native
Median house or condo value ($) - Multirace
Median house or condo value ($) - Other Race
Median resident age
Resident age diversity
Median resident age - Males
Median resident age - Females
Median resident age - White
Median resident age - Black or African American
Median resident age - Asian
Median resident age - Hispanic or Latino
Median resident age - American Indian and Alaska Native
Median resident age - Multirace
Median resident age - Other Race
Median resident age - Males - White
Median resident age - Males - Black or African American
Median resident age - Males - Asian
Median resident age - Males - Hispanic or Latino
Median resident age - Males - American Indian and Alaska Native
Median resident age - Males - Multirace
Median resident age - Males - Other Race
Median resident age - Females - White
Median resident age - Females - Black or African American
Median resident age - Females - Asian
Median resident age - Females - Hispanic or Latino
Median resident age - Females - American Indian and Alaska Native
Median resident age - Females - Multirace
Median resident age - Females - Other Race
Commute - mean travel time to work (minutes)
Travel time to work - Less than 5 minutes (%)
Travel time to work - Less than 5 minutes (% change since 2000)
Travel time to work - 5 to 9 minutes (%)
Travel time to work - 5 to 9 minutes (% change since 2000)
Travel time to work - 10 to 19 minutes (%)
Travel time to work - 10 to 19 minutes (% change since 2000)
Travel time to work - 20 to 29 minutes (%)
Travel time to work - 20 to 29 minutes (% change since 2000)
Travel time to work - 30 to 39 minutes (%)
Travel time to work - 30 to 39 minutes (% change since 2000)
Travel time to work - 40 to 59 minutes (%)
Travel time to work - 40 to 59 minutes (% change since 2000)
Travel time to work - 60 to 89 minutes (%)
Travel time to work - 60 to 89 minutes (% change since 2000)
Travel time to work - 90 or more minutes (%)
Travel time to work - 90 or more minutes (% change since 2000)
Marital status - Never married (%)
Marital status - Now married (%)
Marital status - Separated (%)
Marital status - Widowed (%)
Marital status - Divorced (%)
Median family income ($)
Median family income (% change since 2000)
Median non-family income ($)
Median non-family income (% change since 2000)
Median per capita income ($)
Median per capita income (% change since 2000)
Median family income ($) - White
Median family income ($) - Black or African American
Median family income ($) - Asian
Median family income ($) - Hispanic or Latino
Median family income ($) - American Indian and Alaska Native
Median family income ($) - Multirace
Median family income ($) - Other Race
Median year house/condo built
Median year apartment built
Year house built - Built 2005 or later (%)
Year house built - Built 2000 to 2004 (%)
Year house built - Built 1990 to 1999 (%)
Year house built - Built 1980 to 1989 (%)
Year house built - Built 1970 to 1979 (%)
Year house built - Built 1960 to 1969 (%)
Year house built - Built 1950 to 1959 (%)
Year house built - Built 1940 to 1949 (%)
Year house built - Built 1939 or earlier (%)
Average household size
Household density (households per square mile)
Average household size - White
Average household size - Black or African American
Average household size - Asian
Average household size - Hispanic or Latino
Average household size - American Indian and Alaska Native
Average household size - Multirace
Average household size - Other Race
Occupied housing units (%)
Vacant housing units (%)
Owner occupied housing units (%)
Renter occupied housing units (%)
Vacancy status - For rent (%)
Vacancy status - For sale only (%)
Vacancy status - Rented or sold, not occupied (%)
Vacancy status - For seasonal, recreational, or occasional use (%)
Vacancy status - For migrant workers (%)
Vacancy status - Other vacant (%)
Residents with income below the poverty level (%)
Residents with income below 50% of the poverty level (%)
Children below poverty level (%)
Poor families by family type - Married-couple family (%)
Poor families by family type - Male, no wife present (%)
Poor families by family type - Female, no husband present (%)
Poverty status for native-born residents (%)
Poverty status for foreign-born residents (%)
Poverty among high school graduates not in families (%)
Poverty among people who did not graduate high school not in families (%)
Residents with income below the poverty level (%) - White
Residents with income below the poverty level (%) - Black or African American
Residents with income below the poverty level (%) - Asian
Residents with income below the poverty level (%) - Hispanic or Latino
Residents with income below the poverty level (%) - American Indian and Alaska Native
Residents with income below the poverty level (%) - Multirace
Residents with income below the poverty level (%) - Other Race
Air pollution - Air Quality Index (AQI)
Air pollution - CO
Air pollution - NO2
Air pollution - SO2
Air pollution - Ozone
Air pollution - PM10
Air pollution - PM25
Air pollution - Pb
Crime - Murders per 100,000 population
Crime - Rapes per 100,000 population
Crime - Robberies per 100,000 population
Crime - Assaults per 100,000 population
Crime - Burglaries per 100,000 population
Crime - Thefts per 100,000 population
Crime - Auto thefts per 100,000 population
Crime - Arson per 100,000 population
Crime - City-data.com crime index
Crime - Violent crime index
Crime - Property crime index
Crime - Murders per 100,000 population (5 year average)
Crime - Rapes per 100,000 population (5 year average)
Crime - Robberies per 100,000 population (5 year average)
Crime - Assaults per 100,000 population (5 year average)
Crime - Burglaries per 100,000 population (5 year average)
Crime - Thefts per 100,000 population (5 year average)
Crime - Auto thefts per 100,000 population (5 year average)
Crime - Arson per 100,000 population (5 year average)
Crime - City-data.com crime index (5 year average)
Crime - Violent crime index (5 year average)
Crime - Property crime index (5 year average)
1996 Presidential Elections Results (%) - Democratic Party (Clinton)
1996 Presidential Elections Results (%) - Republican Party (Dole)
1996 Presidential Elections Results (%) - Other
2000 Presidential Elections Results (%) - Democratic Party (Gore)
2000 Presidential Elections Results (%) - Republican Party (Bush)
2000 Presidential Elections Results (%) - Other
2004 Presidential Elections Results (%) - Democratic Party (Kerry)
2004 Presidential Elections Results (%) - Republican Party (Bush)
2004 Presidential Elections Results (%) - Other
2008 Presidential Elections Results (%) - Democratic Party (Obama)
2008 Presidential Elections Results (%) - Republican Party (McCain)
2008 Presidential Elections Results (%) - Other
2012 Presidential Elections Results (%) - Democratic Party (Obama)
2012 Presidential Elections Results (%) - Republican Party (Romney)
2012 Presidential Elections Results (%) - Other
2016 Presidential Elections Results (%) - Democratic Party (Clinton)
2016 Presidential Elections Results (%) - Republican Party (Trump)
2016 Presidential Elections Results (%) - Other
2020 Presidential Elections Results (%) - Democratic Party (Biden)
2020 Presidential Elections Results (%) - Republican Party (Trump)
2020 Presidential Elections Results (%) - Other
Ancestries Reported - Arab (%)
Ancestries Reported - Czech (%)
Ancestries Reported - Danish (%)
Ancestries Reported - Dutch (%)
Ancestries Reported - English (%)
Ancestries Reported - French (%)
Ancestries Reported - French Canadian (%)
Ancestries Reported - German (%)
Ancestries Reported - Greek (%)
Ancestries Reported - Hungarian (%)
Ancestries Reported - Irish (%)
Ancestries Reported - Italian (%)
Ancestries Reported - Lithuanian (%)
Ancestries Reported - Norwegian (%)
Ancestries Reported - Polish (%)
Ancestries Reported - Portuguese (%)
Ancestries Reported - Russian (%)
Ancestries Reported - Scotch-Irish (%)
Ancestries Reported - Scottish (%)
Ancestries Reported - Slovak (%)
Ancestries Reported - Subsaharan African (%)
Ancestries Reported - Swedish (%)
Ancestries Reported - Swiss (%)
Ancestries Reported - Ukrainian (%)
Ancestries Reported - United States (%)
Ancestries Reported - Welsh (%)
Ancestries Reported - West Indian (%)
Ancestries Reported - Other (%)
Educational Attainment - No schooling completed (%)
Educational Attainment - Less than high school (%)
Educational Attainment - High school or equivalent (%)
Educational Attainment - Less than 1 year of college (%)
Educational Attainment - 1 or more years of college (%)
Educational Attainment - Associate degree (%)
Educational Attainment - Bachelor's degree (%)
Educational Attainment - Master's degree (%)
Educational Attainment - Professional school degree (%)
Educational Attainment - Doctorate degree (%)
School Enrollment - Nursery, preschool (%)
School Enrollment - Kindergarten (%)
School Enrollment - Grade 1 to 4 (%)
School Enrollment - Grade 5 to 8 (%)
School Enrollment - Grade 9 to 12 (%)
School Enrollment - College undergrad (%)
School Enrollment - Graduate or professional (%)
School Enrollment - Not enrolled in school (%)
School enrollment - Public schools (%)
School enrollment - Private schools (%)
School enrollment - Not enrolled (%)
Median number of rooms in houses and condos
Median number of rooms in apartments
Housing units lacking complete plumbing facilities (%)
Housing units lacking complete kitchen facilities (%)
Density of houses
Urban houses (%)
Rural houses (%)
Households with people 60 years and over (%)
Households with people 65 years and over (%)
Households with people 75 years and over (%)
Households with one or more nonrelatives (%)
Households with no nonrelatives (%)
Population in households (%)
Family households (%)
Nonfamily households (%)
Population in families (%)
Family households with own children (%)
Median number of bedrooms in owner occupied houses
Mean number of bedrooms in owner occupied houses
Median number of bedrooms in renter occupied houses
Mean number of bedrooms in renter occupied houses
Median number of vehichles in owner occupied houses
Mean number of vehichles in owner occupied houses
Median number of vehichles in renter occupied houses
Mean number of vehichles in renter occupied houses
Mortgage status - with mortgage (%)
Mortgage status - with second mortgage (%)
Mortgage status - with home equity loan (%)
Mortgage status - with both second mortgage and home equity loan (%)
Mortgage status - without a mortgage (%)
Average family size
Average family size - White
Average family size - Black or African American
Average family size - Asian
Average family size - Hispanic or Latino
Average family size - American Indian and Alaska Native
Average family size - Multirace
Average family size - Other Race
Geographical mobility - Same house 1 year ago (%)
Geographical mobility - Moved within same county (%)
Geographical mobility - Moved from different county within same state (%)
Geographical mobility - Moved from different state (%)
Geographical mobility - Moved from abroad (%)
Place of birth - Born in state of residence (%)
Place of birth - Born in other state (%)
Place of birth - Native, outside of US (%)
Place of birth - Foreign born (%)
Housing units in structures - 1, detached (%)
Housing units in structures - 1, attached (%)
Housing units in structures - 2 (%)
Housing units in structures - 3 or 4 (%)
Housing units in structures - 5 to 9 (%)
Housing units in structures - 10 to 19 (%)
Housing units in structures - 20 to 49 (%)
Housing units in structures - 50 or more (%)
Housing units in structures - Mobile home (%)
Housing units in structures - Boat, RV, van, etc. (%)
House/condo owner moved in on average (years ago)
Renter moved in on average (years ago)
Year householder moved into unit - Moved in 1999 to March 2000 (%)
Year householder moved into unit - Moved in 1995 to 1998 (%)
Year householder moved into unit - Moved in 1990 to 1994 (%)
Year householder moved into unit - Moved in 1980 to 1989 (%)
Year householder moved into unit - Moved in 1970 to 1979 (%)
Year householder moved into unit - Moved in 1969 or earlier (%)
Means of transportation to work - Drove car alone (%)
Means of transportation to work - Carpooled (%)
Means of transportation to work - Public transportation (%)
Means of transportation to work - Bus or trolley bus (%)
Means of transportation to work - Streetcar or trolley car (%)
Means of transportation to work - Subway or elevated (%)
Means of transportation to work - Railroad (%)
Means of transportation to work - Ferryboat (%)
Means of transportation to work - Taxicab (%)
Means of transportation to work - Motorcycle (%)
Means of transportation to work - Bicycle (%)
Means of transportation to work - Walked (%)
Means of transportation to work - Other means (%)
Working at home (%)
Industry diversity
Most Common Industries - Agriculture, forestry, fishing and hunting, and mining (%)
Most Common Industries - Agriculture, forestry, fishing and hunting (%)
Most Common Industries - Mining, quarrying, and oil and gas extraction (%)
Most Common Industries - Construction (%)
Most Common Industries - Manufacturing (%)
Most Common Industries - Wholesale trade (%)
Most Common Industries - Retail trade (%)
Most Common Industries - Transportation and warehousing, and utilities (%)
Most Common Industries - Transportation and warehousing (%)
Most Common Industries - Utilities (%)
Most Common Industries - Information (%)
Most Common Industries - Finance and insurance, and real estate and rental and leasing (%)
Most Common Industries - Finance and insurance (%)
Most Common Industries - Real estate and rental and leasing (%)
Most Common Industries - Professional, scientific, and management, and administrative and waste management services (%)
Most Common Industries - Professional, scientific, and technical services (%)
Most Common Industries - Management of companies and enterprises (%)
Most Common Industries - Administrative and support and waste management services (%)
Most Common Industries - Educational services, and health care and social assistance (%)
Most Common Industries - Educational services (%)
Most Common Industries - Health care and social assistance (%)
Most Common Industries - Arts, entertainment, and recreation, and accommodation and food services (%)
Most Common Industries - Arts, entertainment, and recreation (%)
Most Common Industries - Accommodation and food services (%)
Most Common Industries - Other services, except public administration (%)
Most Common Industries - Public administration (%)
Occupation diversity
Most Common Occupations - Management, business, science, and arts occupations (%)
Most Common Occupations - Management, business, and financial occupations (%)
Most Common Occupations - Management occupations (%)
Most Common Occupations - Business and financial operations occupations (%)
Most Common Occupations - Computer, engineering, and science occupations (%)
Most Common Occupations - Computer and mathematical occupations (%)
Most Common Occupations - Architecture and engineering occupations (%)
Most Common Occupations - Life, physical, and social science occupations (%)
Most Common Occupations - Education, legal, community service, arts, and media occupations (%)
Most Common Occupations - Community and social service occupations (%)
Most Common Occupations - Legal occupations (%)
Most Common Occupations - Education, training, and library occupations (%)
Most Common Occupations - Arts, design, entertainment, sports, and media occupations (%)
Most Common Occupations - Healthcare practitioners and technical occupations (%)
Most Common Occupations - Health diagnosing and treating practitioners and other technical occupations (%)
Most Common Occupations - Health technologists and technicians (%)
Most Common Occupations - Service occupations (%)
Most Common Occupations - Healthcare support occupations (%)
Most Common Occupations - Protective service occupations (%)
Most Common Occupations - Fire fighting and prevention, and other protective service workers including supervisors (%)
Most Common Occupations - Law enforcement workers including supervisors (%)
Most Common Occupations - Food preparation and serving related occupations (%)
Most Common Occupations - Building and grounds cleaning and maintenance occupations (%)
Most Common Occupations - Personal care and service occupations (%)
Most Common Occupations - Sales and office occupations (%)
Most Common Occupations - Sales and related occupations (%)
Most Common Occupations - Office and administrative support occupations (%)
Most Common Occupations - Natural resources, construction, and maintenance occupations (%)
Most Common Occupations - Farming, fishing, and forestry occupations (%)
Most Common Occupations - Construction and extraction occupations (%)
Most Common Occupations - Installation, maintenance, and repair occupations (%)
Most Common Occupations - Production, transportation, and material moving occupations (%)
Most Common Occupations - Production occupations (%)
Most Common Occupations - Transportation occupations (%)
Most Common Occupations - Material moving occupations (%)
People in Group quarters - Institutionalized population (%)
People in Group quarters - Correctional institutions (%)
People in Group quarters - Federal prisons and detention centers (%)
People in Group quarters - Halfway houses (%)
People in Group quarters - Local jails and other confinement facilities (including police lockups) (%)
People in Group quarters - Military disciplinary barracks (%)
People in Group quarters - State prisons (%)
People in Group quarters - Other types of correctional institutions (%)
People in Group quarters - Nursing homes (%)
People in Group quarters - Hospitals/wards, hospices, and schools for the handicapped (%)
People in Group quarters - Hospitals/wards and hospices for chronically ill (%)
People in Group quarters - Hospices or homes for chronically ill (%)
People in Group quarters - Military hospitals or wards for chronically ill (%)
People in Group quarters - Other hospitals or wards for chronically ill (%)
People in Group quarters - Hospitals or wards for drug/alcohol abuse (%)
People in Group quarters - Mental (Psychiatric) hospitals or wards (%)
People in Group quarters - Schools, hospitals, or wards for the mentally retarded (%)
People in Group quarters - Schools, hospitals, or wards for the physically handicapped (%)
People in Group quarters - Institutions for the deaf (%)
People in Group quarters - Institutions for the blind (%)
People in Group quarters - Orthopedic wards and institutions for the physically handicapped (%)
People in Group quarters - Wards in general hospitals for patients who have no usual home elsewhere (%)
People in Group quarters - Wards in military hospitals for patients who have no usual home elsewhere (%)
People in Group quarters - Juvenile institutions (%)
People in Group quarters - Long-term care (%)
People in Group quarters - Homes for abused, dependent, and neglected children (%)
People in Group quarters - Residential treatment centers for emotionally disturbed children (%)
People in Group quarters - Training schools for juvenile delinquents (%)
People in Group quarters - Short-term care, detention or diagnostic centers for delinquent children (%)
People in Group quarters - Type of juvenile institution unknown (%)
People in Group quarters - Noninstitutionalized population (%)
People in Group quarters - College dormitories (includes college quarters off campus) (%)
People in Group quarters - Military quarters (%)
People in Group quarters - On base (%)
People in Group quarters - Barracks, unaccompanied personnel housing (UPH), (Enlisted/Officer), ;and similar group living quarters for military personnel (%)
People in Group quarters - Transient quarters for temporary residents (%)
People in Group quarters - Military ships (%)
People in Group quarters - Group homes (%)
People in Group quarters - Homes or halfway houses for drug/alcohol abuse (%)
People in Group quarters - Homes for the mentally ill (%)
People in Group quarters - Homes for the mentally retarded (%)
People in Group quarters - Homes for the physically handicapped (%)
People in Group quarters - Other group homes (%)
People in Group quarters - Religious group quarters (%)
People in Group quarters - Dormitories (%)
People in Group quarters - Agriculture workers' dormitories on farms (%)
People in Group quarters - Job Corps and vocational training facilities (%)
People in Group quarters - Other workers' dormitories (%)
People in Group quarters - Crews of maritime vessels (%)
People in Group quarters - Other nonhousehold living situations (%)
People in Group quarters - Other noninstitutional group quarters (%)
Residents speaking English at home (%)
Residents speaking English at home - Born in the United States (%)
Residents speaking English at home - Native, born elsewhere (%)
Residents speaking English at home - Foreign born (%)
Residents speaking Spanish at home (%)
Residents speaking Spanish at home - Born in the United States (%)
Residents speaking Spanish at home - Native, born elsewhere (%)
Residents speaking Spanish at home - Foreign born (%)
Residents speaking other language at home (%)
Residents speaking other language at home - Born in the United States (%)
Residents speaking other language at home - Native, born elsewhere (%)
Residents speaking other language at home - Foreign born (%)
Class of Workers - Employee of private company (%)
Class of Workers - Self-employed in own incorporated business (%)
Class of Workers - Private not-for-profit wage and salary workers (%)
Class of Workers - Local government workers (%)
Class of Workers - State government workers (%)
Class of Workers - Federal government workers (%)
Class of Workers - Self-employed workers in own not incorporated business and Unpaid family workers (%)
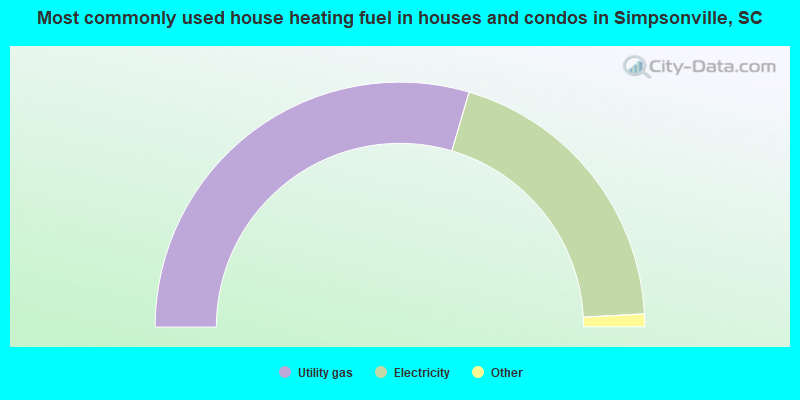
House heating fuel used in houses and condos - Utility gas (%)
House heating fuel used in houses and condos - Bottled, tank, or LP gas (%)
House heating fuel used in houses and condos - Electricity (%)
House heating fuel used in houses and condos - Fuel oil, kerosene, etc. (%)
House heating fuel used in houses and condos - Coal or coke (%)
House heating fuel used in houses and condos - Wood (%)
House heating fuel used in houses and condos - Solar energy (%)
House heating fuel used in houses and condos - Other fuel (%)
House heating fuel used in houses and condos - No fuel used (%)
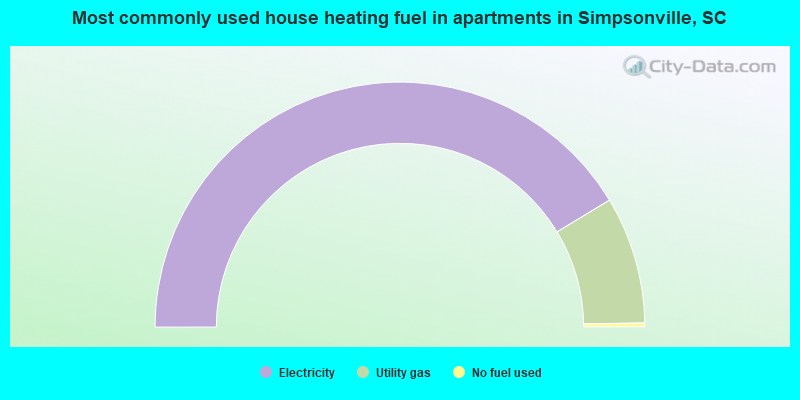
House heating fuel used in apartments - Utility gas (%)
House heating fuel used in apartments - Bottled, tank, or LP gas (%)
House heating fuel used in apartments - Electricity (%)
House heating fuel used in apartments - Fuel oil, kerosene, etc. (%)
House heating fuel used in apartments - Coal or coke (%)
House heating fuel used in apartments - Wood (%)
House heating fuel used in apartments - Solar energy (%)
House heating fuel used in apartments - Other fuel (%)
House heating fuel used in apartments - No fuel used (%)
Armed forces status - In Armed Forces (%)
Armed forces status - Civilian (%)
Armed forces status - Civilian - Veteran (%)
Armed forces status - Civilian - Nonveteran (%)
Fatal accidents locations in years 2005-2021
Fatal accidents locations in 2005
Fatal accidents locations in 2006
Fatal accidents locations in 2007
Fatal accidents locations in 2008
Fatal accidents locations in 2009
Fatal accidents locations in 2010
Fatal accidents locations in 2011
Fatal accidents locations in 2012
Fatal accidents locations in 2013
Fatal accidents locations in 2014
Fatal accidents locations in 2015
Fatal accidents locations in 2016
Fatal accidents locations in 2017
Fatal accidents locations in 2018
Fatal accidents locations in 2019
Fatal accidents locations in 2020
Fatal accidents locations in 2021
Alcohol use - People drinking some alcohol every month (%)
Alcohol use - People not drinking at all (%)
Alcohol use - Average days/month drinking alcohol
Alcohol use - Average drinks/week
Alcohol use - Average days/year people drink much
Audiometry - Average condition of hearing (%)
Audiometry - People that can hear a whisper from across a quiet room (%)
Audiometry - People that can hear normal voice from across a quiet room (%)
Audiometry - Ears ringing, roaring, buzzing (%)
Audiometry - Had a job exposure to loud noise (%)
Audiometry - Had off-work exposure to loud noise (%)
Blood Pressure & Cholesterol - Has high blood pressure (%)
Blood Pressure & Cholesterol - Checking blood pressure at home (%)
Blood Pressure & Cholesterol - Frequently checking blood cholesterol (%)
Blood Pressure & Cholesterol - Has high cholesterol level (%)
Consumer Behavior - Money monthly spent on food at supermarket/grocery store
Consumer Behavior - Money monthly spent on food at other stores
Consumer Behavior - Money monthly spent on eating out
Consumer Behavior - Money monthly spent on carryout/delivered foods
Consumer Behavior - Income spent on food at supermarket/grocery store (%)
Consumer Behavior - Income spent on food at other stores (%)
Consumer Behavior - Income spent on eating out (%)
Consumer Behavior - Income spent on carryout/delivered foods (%)
Current Health Status - General health condition (%)
Current Health Status - Blood donors (%)
Current Health Status - Has blood ever tested for HIV virus (%)
Current Health Status - Left-handed people (%)
Dermatology - People using sunscreen (%)
Diabetes - Diabetics (%)
Diabetes - Had a blood test for high blood sugar (%)
Diabetes - People taking insulin (%)
Diet Behavior & Nutrition - Diet health (%)
Diet Behavior & Nutrition - Milk product consumption (# of products/month)
Diet Behavior & Nutrition - Meals not home prepared (#/week)
Diet Behavior & Nutrition - Meals from fast food or pizza place (#/week)
Diet Behavior & Nutrition - Ready-to-eat foods (#/month)
Diet Behavior & Nutrition - Frozen meals/pizza (#/month)
Drug Use - People that ever used marijuana or hashish (%)
Drug Use - Ever used hard drugs (%)
Drug Use - Ever used any form of cocaine (%)
Drug Use - Ever used heroin (%)
Drug Use - Ever used methamphetamine (%)
Health Insurance - People covered by health insurance (%)
Kidney Conditions-Urology - Avg. # of times urinating at night
Medical Conditions - People with asthma (%)
Medical Conditions - People with anemia (%)
Medical Conditions - People with psoriasis (%)
Medical Conditions - People with overweight (%)
Medical Conditions - Elderly people having difficulties in thinking or remembering (%)
Medical Conditions - People who ever received blood transfusion (%)
Medical Conditions - People having trouble seeing even with glass/contacts (%)
Medical Conditions - People with arthritis (%)
Medical Conditions - People with gout (%)
Medical Conditions - People with congestive heart failure (%)
Medical Conditions - People with coronary heart disease (%)
Medical Conditions - People with angina pectoris (%)
Medical Conditions - People who ever had heart attack (%)
Medical Conditions - People who ever had stroke (%)
Medical Conditions - People with emphysema (%)
Medical Conditions - People with thyroid problem (%)
Medical Conditions - People with chronic bronchitis (%)
Medical Conditions - People with any liver condition (%)
Medical Conditions - People who ever had cancer or malignancy (%)
Mental Health - People who have little interest in doing things (%)
Mental Health - People feeling down, depressed, or hopeless (%)
Mental Health - People who have trouble sleeping or sleeping too much (%)
Mental Health - People feeling tired or having little energy (%)
Mental Health - People with poor appetite or overeating (%)
Mental Health - People feeling bad about themself (%)
Mental Health - People who have trouble concentrating on things (%)
Mental Health - People moving or speaking slowly or too fast (%)
Mental Health - People having thoughts they would be better off dead (%)
Oral Health - Average years since last visit a dentist
Oral Health - People embarrassed because of mouth (%)
Oral Health - People with gum disease (%)
Oral Health - General health of teeth and gums (%)
Oral Health - Average days a week using dental floss/device
Oral Health - Average days a week using mouthwash for dental problem
Oral Health - Average number of teeth
Pesticide Use - Households using pesticides to control insects (%)
Pesticide Use - Households using pesticides to kill weeds (%)
Physical Activity - People doing vigorous-intensity work activities (%)
Physical Activity - People doing moderate-intensity work activities (%)
Physical Activity - People walking or bicycling (%)
Physical Activity - People doing vigorous-intensity recreational activities (%)
Physical Activity - People doing moderate-intensity recreational activities (%)
Physical Activity - Average hours a day doing sedentary activities
Physical Activity - Average hours a day watching TV or videos
Physical Activity - Average hours a day using computer
Physical Functioning - People having limitations keeping them from working (%)
Physical Functioning - People limited in amount of work they can do (%)
Physical Functioning - People that need special equipment to walk (%)
Physical Functioning - People experiencing confusion/memory problems (%)
Physical Functioning - People requiring special healthcare equipment (%)
Prescription Medications - Average number of prescription medicines taking
Preventive Aspirin Use - Adults 40+ taking low-dose aspirin (%)
Reproductive Health - Vaginal deliveries (%)
Reproductive Health - Cesarean deliveries (%)
Reproductive Health - Deliveries resulted in a live birth (%)
Reproductive Health - Pregnancies resulted in a delivery (%)
Reproductive Health - Women breastfeeding newborns (%)
Reproductive Health - Women that had a hysterectomy (%)
Reproductive Health - Women that had both ovaries removed (%)
Reproductive Health - Women that have ever taken birth control pills (%)
Reproductive Health - Women taking birth control pills (%)
Reproductive Health - Women that have ever used Depo-Provera or injectables (%)
Reproductive Health - Women that have ever used female hormones (%)
Sexual Behavior - People 18+ that ever had sex (vaginal, anal, or oral) (%)
Sexual Behavior - Males 18+ that ever had vaginal sex with a woman (%)
Sexual Behavior - Males 18+ that ever performed oral sex on a woman (%)
Sexual Behavior - Males 18+ that ever had anal sex with a woman (%)
Sexual Behavior - Males 18+ that ever had any sex with a man (%)
Sexual Behavior - Females 18+ that ever had vaginal sex with a man (%)
Sexual Behavior - Females 18+ that ever performed oral sex on a man (%)
Sexual Behavior - Females 18+ that ever had anal sex with a man (%)
Sexual Behavior - Females 18+ that ever had any kind of sex with a woman (%)
Sexual Behavior - Average age people first had sex
Sexual Behavior - Average number of female sex partners in lifetime (males 18+)
Sexual Behavior - Average number of female vaginal sex partners in lifetime (males 18+)
Sexual Behavior - Average age people first performed oral sex on a woman (18+)
Sexual Behavior - Average number of woman performed oral sex on in lifetime (18+)
Sexual Behavior - Average number of male sex partners in lifetime (males 18+)
Sexual Behavior - Average number of male anal sex partners in lifetime (males 18+)
Sexual Behavior - Average age people first performed oral sex on a man (18+)
Sexual Behavior - Average number of male oral sex partners in lifetime (18+)
Sexual Behavior - People using protection when performing oral sex (%)
Sexual Behavior - Average number of times people have vaginal or anal sex a year
Sexual Behavior - People having sex without condom (%)
Sexual Behavior - Average number of male sex partners in lifetime (females 18+)
Sexual Behavior - Average number of male vaginal sex partners in lifetime (females 18+)
Sexual Behavior - Average number of female sex partners in lifetime (females 18+)
Sexual Behavior - Circumcised males 18+ (%)
Sleep Disorders - Average hours sleeping at night
Sleep Disorders - People that has trouble sleeping (%)
Smoking-Cigarette Use - People smoking cigarettes (%)
Taste & Smell - People 40+ having problems with smell (%)
Taste & Smell - People 40+ having problems with taste (%)
Taste & Smell - People 40+ that ever had wisdom teeth removed (%)
Taste & Smell - People 40+ that ever had tonsils teeth removed (%)
Taste & Smell - People 40+ that ever had a loss of consciousness because of a head injury (%)
Taste & Smell - People 40+ that ever had a broken nose or other serious injury to face or skull (%)
Taste & Smell - People 40+ that ever had two or more sinus infections (%)
Weight - Average height (inches)
Weight - Average weight (pounds)
Weight - Average BMI
Weight - People that are obese (%)
Weight - People that ever were obese (%)
Weight - People trying to lose weight (%)
Officers per 1,000 residents here:
1.61South Carolina average:
2.21
Latest news from Simpsonville, SC collected exclusively by city-data.com from local newspapers, TV, and radio stations
Ancestries: Irish (14.7%), English (11.4%), American (10.6%), Scotch-Irish (4.6%), German (4.4%), Italian (3.1%).
Current Local Time:
Land area: 6.22 square miles.
Population density: 4,298 people per square mile (average).
1,894 residents are foreign born (5.0% Latin America , 1.3% Asia , 0.9% Europe ).
This city:
7.6%South Carolina:
5.3%
Median real estate property taxes paid for housing units with mortgages in 2022: $1,327 (0.5%)Median real estate property taxes paid for housing units with no mortgage in 2022: $1,205 (0.5%)
Nearest city with pop. 50,000+: Greenville, SC
Nearest city with pop. 200,000+: Charlotte, NC
Nearest city with pop. 1,000,000+: Philadelphia, PA
Nearest cities:
Latitude: 34.73 N, Longitude: 82.26 W
Daytime population change due to commuting: -2,815 (-11.2%)Workers who live and work in this city: 3,064 (23.4%)
Property values in Simpsonville, SC
Single-family new house construction building permits:
2022: 331 buildings , average cost: $193,4002021: 532 buildings , average cost: $156,0002020: 303 buildings , average cost: $123,6002019: 297 buildings , average cost: $130,0002018: 291 buildings , average cost: $153,5002017: 251 buildings , average cost: $164,1002016: 327 buildings , average cost: $153,2002015: 258 buildings , average cost: $153,3002014: 201 buildings , average cost: $160,3002013: 161 buildings , average cost: $159,4002012: 116 buildings , average cost: $188,0002011: 80 buildings , average cost: $213,8002010: 76 buildings , average cost: $192,5002009: 26 buildings , average cost: $128,0002008: 88 buildings , average cost: $130,5002007: 135 buildings , average cost: $133,8002006: 261 buildings , average cost: $111,5002005: 180 buildings , average cost: $118,2002004: 108 buildings , average cost: $111,7002003: 141 buildings , average cost: $128,6002002: 74 buildings , average cost: $121,2002001: 70 buildings , average cost: $94,3002000: 96 buildings , average cost: $82,2001999: 96 buildings , average cost: $88,9001998: 90 buildings , average cost: $78,5001997: 62 buildings , average cost: $103,700Unemployment in December 2023: Here:
2.8%South Carolina:
3.1%
Population change in the 1990s: +2,491 (+21.0%).
Most common occupations in Simpsonville, SC (%)
Both Males Females
Other production occupations, including supervisors (6.2%)
Other sales and related occupations, including supervisors (4.8%)
Other office and administrative support workers, including supervisors (4.3%)
Secretaries and administrative assistants (3.7%)
Sales representatives, services, wholesale and manufacturing (3.6%)
Other management occupations, except farmers and farm managers (3.5%)
Retail sales workers, except cashiers (3.4%)
Other production occupations, including supervisors (7.2%)
Other sales and related occupations, including supervisors (6.0%)
Sales representatives, services, wholesale and manufacturing (5.6%)
Engineers (5.1%)
Computer specialists (4.5%)
Driver/sales workers and truck drivers (4.4%)
Other management occupations, except farmers and farm managers (4.0%)
Secretaries and administrative assistants (8.0%)
Other office and administrative support workers, including supervisors (7.0%)
Other production occupations, including supervisors (5.0%)
Preschool, kindergarten, elementary, and middle school teachers (4.5%)
Retail sales workers, except cashiers (3.9%)
Child care workers (3.7%)
Bookkeeping, accounting, and auditing clerks (3.6%)
Tornado activity:
Simpsonville-area historical tornado activity is near South Carolina state average. It is 13% greater than the overall U.S. average.
On 5/10/1952, a category F3 (max. wind speeds 158-206 mph) tornado 4.6 miles away from the Simpsonville city center killed 2 people and injured 4 people .
On 5/5/1989, a category F4 (max. wind speeds 207-260 mph) tornado 30.4 miles away from the city center killed 2 people and injured 35 people and caused between $500,000 and $5,000,000 in damages.
Earthquake activity:
Simpsonville-area historical earthquake activity is significantly above South Carolina state average. It is 10% greater than the overall U.S. average. On 8/2/1974 at 08:52:09, a magnitude 4.9 (4.3 MB, 4.9 LG, Class: Light, Intensity: IV - V) earthquake occurred 61.0 miles away from the city center On 8/9/2020 at 12:07:37, a magnitude 5.1 (5.1 MW, Depth: 4.7 mi, Class: Moderate, Intensity: VI - VII) earthquake occurred 137.2 miles away from Simpsonville center On 8/23/2011 at 17:51:04, a magnitude 5.8 (5.8 MW, Depth: 3.7 mi) earthquake occurred 326.0 miles away from the city center On 11/30/1973 at 07:48:41, a magnitude 4.7 (4.7 MB, 4.6 ML) earthquake occurred 121.1 miles away from Simpsonville center On 4/29/2003 at 08:59:39, a magnitude 4.9 (4.4 MB, 4.6 MW, 4.9 LG) earthquake occurred 192.5 miles away from Simpsonville center On 7/27/1980 at 18:52:21, a magnitude 5.2 (5.1 MB, 4.7 MS, 5.0 UK, 5.2 UK) earthquake occurred 257.7 miles away from the city center Magnitude types: regional Lg-wave magnitude (LG), body-wave magnitude (MB), local magnitude (ML), surface-wave magnitude (MS), moment magnitude (MW) Natural disasters: The number of natural disasters in Greenville County (12) is smaller than the US average (15).Major Disasters (Presidential) Declared: 4Emergencies Declared: 5Floods: 3, Hurricanes: 3, Storms: 3, Ice Storms: 2, Drought: 1, Tornado: 1, Tropical Storm: 1, Wind: 1, Winter Storm: 1, Other: 1 (Note: some incidents may be assigned to more than one category). Main business address for: KEMET CORP ELECTRONIC COMPONENTS & ACCESSORIES ).
Hospitals and medical centers in Simpsonville: HEARTLAND HOSPICE SERVICES - GREENVILLE (421 SE MAIN STREET) HILLCREST MEMORIAL HOSPITAL (Government - Hospital District or Authority, provides emergency services, 729 SOUTH EAST MAIN STREET) DAYSPRING HEALTH AND REHAB OF SIMPSONVILLE, LLC (721 WEST CURTIS STREET)
DIAMOND HEALTH AND REHAB OF SIMPSONVILLE, LLC (807 SOUTH EAST MAIN STREET)
PALMETTO CONVALESCENT CENTER (721 W CURTIS ST)
DSI POWDERHORN DIALYSIS (16 POWDERHORN ROAD)
Airports located in Simpsonville: Amtrak station near Simpsonville: 13 miles: GREENVILLE (1120 W. WASHINGTON ST.) Services: ticket office, fully wheelchair accessible, enclosed waiting area, public restrooms, public payphones, vending machines, free short-term parking, free long-term parking, call for taxi service.
Colleges/universities with over 2000 students nearest to Simpsonville:
Greenville Technical College (about 9 miles; Greenville, SC ; Full-time enrollment: 9,859)
Bob Jones University (about 12 miles; Greenville, SC ; FT enrollment: 3,308)
Furman University (about 17 miles; Greenville, SC ; FT enrollment: 2,988)
Spartanburg Community College (about 23 miles; Spartanburg, SC ; FT enrollment: 4,309)
North Greenville University (about 25 miles; Tigerville, SC ; FT enrollment: 2,341)
University of South Carolina-Upstate (about 25 miles; Spartanburg, SC ; FT enrollment: 4,994)
Anderson University (about 27 miles; Anderson, SC ; FT enrollment: 2,510)
Public high schools in Simpsonville:
Private high schools in Simpsonville: SOUTHSIDE CHRISTIAN SCHOOL Students: 1,060, Location: 2211 WOODRUFF RD, Grades: PK-12)
GREENVILLE CLASSICAL ACADEMY Students: 61, Location: 2519 WOODRUFF RD, Grades: KG-11)
Biggest public elementary/middle schools in Simpsonville: OAKVIEW ELEMENTARY Students: 1,244, Location: 515 GODFREY ROAD, Grades: PK-5)BELL'S CROSSING ELEMENTARY Students: 1,210, Location: 804 SCUFFLETOWN ROAD, Grades: KG-5)MAULDIN MIDDLE Students: 1,169, Location: 1190 HOLLAND ROAD, Grades: 6-8)BRYSON MIDDLE Students: 1,118, Location: 3657 SOUTH INDUSTRIAL DRIVE, Grades: 6-8)MAULDIN ELEMENTARY Students: 996, Location: 1194 HOLLAND ROAD, Grades: PK-5)PLAIN ELEMENTARY Students: 944, Location: 506 NEELY FERRY ROAD, Grades: KG-5)BRYSON ELEMENTARY Students: 869, Location: 703 BRYSON DRIVE, Grades: KG-5)SIMPSONVILLE ELEMENTARY Students: 763, Location: 200 MORTON AVENUE, Grades: PK-5)RALPH CHANDLER MIDDLE Students: 723, Location: 4231 FORK SHOALS ROAD, Grades: 6-8)RUDOLPH GORDON ELEMENTARY Students: 598, Location: 1507 SCUFFLETOWN ROAD, Grades: KG-5)Private elementary/middle schools in Simpsonville: FIVE OAKS ACADEMY Students: 164, Location: 1101 JONESVILLE RD, Grades: PK-8)
BETHLEHEM CHRISTIAN ACADEMY Students: 77, Location: 4 HARRISON BRIDGE RD, Grades: PK-5)
HOPE ACADEMY Students: 64, Location: 2258 WOODRUFF RD, Grades: UG-5)
See full list of schools located in Simpsonville
Notable locations in Simpsonville: (A) , Simpsonville Fire Department Station 2 (B) . Display/hide their locations on the map
Shopping Centers: (1) , Simpsonville Shopping Center (2) . Display/hide their locations on the map
Cemetery: (1) . Display/hide its location on the map
Hotels:
Court:
Birthplace of: Shane Hall - Stock car racing driver, Stephen Thompson (fighter) - Kickboxer, Greg Taylor - College basketball player (Wofford Terriers), Red Barbary - Baseball player.
Greenville County has a predicted average indoor radon screening level greater than 4 pCi/L (pico curies per liter) - Highest Potential Drinking water stations with addresses in Simpsonville and their reported violations in the past:
EDGEWATER ACRES (2350024) (Address: ATTN: ROGER DAUGHERTY Population served: 40, Groundwater):
Past monitoring violations:
2 routine major monitoring violations
Average household size: This city:
2.6 peopleSouth Carolina:
2.5 people
Percentage of family households: This city:
71.1%Whole state:
67.5%
Percentage of households with unmarried partners: This city:
5.3%Whole state:
6.0%
Likely homosexual households (counted as self-reported same-sex unmarried-partner households)
Lesbian couples: 0.3% of all households Gay men: 0.3% of all households
172 people in nursing facilities/skilled-nursing facilities in 2010people in group homes intended for adults in 2010people in nursing homes in 2000people in other noninstitutional group quarters in 2000
Banks with most branches in Simpsonville (2011 data):
SunTrust Bank: Simpsonville Bi-Lo Branch at 699 Fairview Road, branch established on 2003/11/19; Simpsonville Branch 762 at 124 Ne Main St, branch established on 1921/01/01. Info updated 2010/05/27: Bank assets: $171,291.7 mil, Deposits: $129,833.2 mil, headquarters in Atlanta, GA, positive income , Commercial Lending Specialization, 1716 total offices , Holding Company: Suntrust Banks, Inc.
First Citizens Bank and Trust Company, Inc.: Five Forks Branch at 2708 Woodruff Road, branch established on 2005/12/12; Simpsonville Branch at 636 Fairview Road, branch established on 1999/06/07. Info updated 2011/08/24: Bank assets: $8,104.0 mil, Deposits: $6,880.8 mil, headquarters in Columbia, SC, positive income , 197 total offices , Holding Company: First Citizens Bancorporation, Inc.
The Palmetto Bank: Simpsonville Branch at Maple And College Streets, branch established on 1976/03/22. Info updated 2011/04/01: Bank assets: $1,204.5 mil, Deposits: $1,066.9 mil, headquarters in Greenville, SC, negative income in the last year , Commercial Lending Specialization, 34 total offices , Holding Company: Capgen Capital Group V Lp
SCBT National Association: Simpsonville Branch at #1 Five Forks Plaza Court, branch established on 2000/05/07. Info updated 2011/08/01: Bank assets: $3,893.8 mil, Deposits: $3,257.7 mil, headquarters in Orangeburg, SC, positive income , Commercial Lending Specialization, 79 total offices , Holding Company: Scbt Financial Corporation
Wells Fargo Bank, National Association: Simpsonville Branch at 667 Fairview Road, branch established on 2004/02/06. Info updated 2011/04/05: Bank assets: $1,161,490.0 mil, Deposits: $905,653.0 mil, headquarters in Sioux Falls, SD, positive income , 6395 total offices , Holding Company: Wells Fargo & Company
Provident Community Bank, National Association: Simpsonville Banking Branch at 116 Northeast Main Street, branch established on 2006/03/01. Info updated 2007/04/09: Bank assets: $376.6 mil, Deposits: $283.8 mil, headquarters in Rock Hill, SC, positive income , Commercial Lending Specialization, 11 total offices , Holding Company: Provident Community Bancshares, Inc.
Woodforest National Bank: Simpsonville Branch at 3950 Grandview Drive, branch established on 2008/03/15. Info updated 2011/05/10: Bank assets: $3,488.9 mil, Deposits: $3,097.6 mil, headquarters in Houston, TX, positive income , Commercial Lending Specialization, 766 total offices , Holding Company: Woodforest Financial Group Employee Stock Ownership Plan (With 401(K) Provisions)
Regions Bank: Simpsonville Branch at 2565 Woodruff Road, branch established on 2006/11/01. Info updated 2011/02/24: Bank assets: $123,368.2 mil, Deposits: $98,301.3 mil, headquarters in Birmingham, AL, positive income , Commercial Lending Specialization, 1778 total offices , Holding Company: Regions Financial Corporation
Branch Banking and Trust Company: Simpsonville Branch at 713 Se Main St, branch established on 1980/12/15. Info updated 2010/03/29: Bank assets: $168,867.6 mil, Deposits: $127,549.5 mil, headquarters in Winston Salem, NC, positive income , Commercial Lending Specialization, 1793 total offices , Holding Company: Bb&T Corporation
3 other banks with 3 local branches
For population 15 years and over in Simpsonville:
Never married: 28.4%Now married: 57.5%Separated: 1.6%Widowed: 4.7%Divorced: 7.7% For population 25 years and over in Simpsonville:
High school or higher: 94.1%Bachelor's degree or higher: 35.2%Graduate or professional degree: 12.3%Unemployed: 2.2%Mean travel time to work (commute): 18.8 minutes
Education Gini index (Inequality in education) Here:
10.3South Carolina average:
11.1
Religion statistics for Simpsonville, SC (based on Greenville County data)
Religion Adherents Congregations Evangelical Protestant 186,955 473 Mainline Protestant 44,200 96 Catholic 25,417 8 Black Protestant 7,753 24 Other 5,656 25 Orthodox 1,930 3 None 179,314 -
Source: Clifford Grammich, Kirk Hadaway, Richard Houseal, Dale E.Jones, Alexei Krindatch, Richie Stanley and Richard H.Taylor. 2012. 2010 U.S.Religion Census: Religious Congregations & Membership Study. Association of Statisticians of American Religious Bodies. Jones, Dale E., et al. 2002. Congregations and Membership in the United States 2000. Nashville, TN: Glenmary Research Center. Graphs represent county-level data
Food Environment Statistics: Number of grocery stores : 86Greenville County :
2.01 / 10,000 pop.South Carolina :
1.99 / 10,000 pop.
Number of supercenters and club stores : 6Greenville County :
0.14 / 10,000 pop.State :
0.15 / 10,000 pop.
Number of convenience stores (no gas) : 23This county :
0.54 / 10,000 pop.South Carolina :
0.85 / 10,000 pop.
Number of convenience stores (with gas) : 198This county :
4.63 / 10,000 pop.State :
5.38 / 10,000 pop.
Number of full-service restaurants : 383Greenville County :
8.96 / 10,000 pop.South Carolina :
7.75 / 10,000 pop.
Adult diabetes rate : Greenville County :
8.3%South Carolina :
10.6%
Adult obesity rate : This county :
24.4%South Carolina :
29.4%
Low-income preschool obesity rate : This county :
13.7%South Carolina :
13.4%
Health and Nutrition: Healthy diet rate : Simpsonville:
49.8%South Carolina:
49.2%
Average overall health of teeth and gums : Simpsonville:
48.3%State:
46.2%
Average BMI : Simpsonville:
28.8South Carolina:
29.0
People feeling badly about themselves : Simpsonville:
21.4%South Carolina:
20.4%
People not drinking alcohol at all : Here:
9.5%South Carolina:
11.0%
Average hours sleeping at night : Overweight people : Simpsonville:
34.1%South Carolina:
34.4%
General health condition : Simpsonville:
57.9%South Carolina:
55.6%
Average condition of hearing : This city:
80.8%South Carolina:
79.9%
More about Health and Nutrition of Simpsonville, SC Residents
Local government employment and payroll (March 2022)
Function
Full-time employees
Monthly full-time payroll
Average yearly full-time wage
Part-time employees
Monthly part-time payroll
Firefighters
70 $217,919 $37,358 0 $0 Police Protection - Officers
39 $118,026 $36,316 0 $0 Parks and Recreation
18 $58,131 $38,754 6 $3,093 Streets and Highways
17 $38,116 $26,905 0 $0 Police - Other
17 $55,934 $39,483 0 $0 Other Government Administration
12 $31,842 $31,842 0 $0 Fire - Other
6 $26,325 $52,650 0 $0 Solid Waste Management
5 $13,285 $31,884 0 $0 Sewerage
5 $13,914 $33,394 0 $0 Judicial and Legal
4 $13,990 $41,970 0 $0 Financial Administration
4 $14,573 $43,719 0 $0 Other and Unallocable
3 $9,175 $36,700 0 $0
Totals for Government
200 $611,230 $36,674 6 $3,093
Simpsonville government finances - Expenditure in 2021 (per resident):
Construction - Sewerage: $2,020,000 ($75.52)
General - Other: $1,228,000 ($45.91)Regular Highways: $688,000 ($25.72)Current Operations - Local Fire Protection: $5,248,000 ($196.20)
Police Protection: $4,479,000 ($167.45)Regular Highways: $3,190,000 ($119.26)Parks and Recreation: $1,964,000 ($73.43)Central Staff Services: $1,799,000 ($67.26)Sewerage: $551,000 ($20.60)Judicial and Legal Services: $248,000 ($9.27)General - Other: $222,000 ($8.30)General - Interest on Debt: $319,000 ($11.93)
Simpsonville government finances - Revenue in 2021 (per resident):
Charges - Sewerage: $1,993,000 ($74.51)
Other: $1,397,000 ($52.23)Miscellaneous - Donations From Private Sources: $425,000 ($15.89)
Interest Earnings: $157,000 ($5.87)Fines and Forfeits: $96,000 ($3.59)State Intergovernmental - Other: $193,000 ($7.22)
Tax - Property: $14,578,000 ($545.01)
Other Selective Sales: $2,450,000 ($91.60)Other License: $2,375,000 ($88.79)Public Utilities Sales: $1,680,000 ($62.81)
Simpsonville government finances - Debt in 2021 (per resident):
Long Term Debt - Beginning Outstanding - Unspecified Public Purpose: $14,517,000 ($542.73)
Outstanding Unspecified Public Purpose: $12,617,000 ($471.70)Retired Unspecified Public Purpose: $1,900,000 ($71.03)
Simpsonville government finances - Cash and Securities in 2021 (per resident):
Bond Funds - Cash and Securities: $208,000 ($7.78)
Other Funds - Cash and Securities: $151,469,000 ($5662.82)
8.41% of this county's 2021 resident taxpayers lived in other counties in 2020 ($69,436 average adjusted gross income )
Here:
8.41%South Carolina average:
8.89%
0.01% of residents moved from foreign countries ($100 average AGI )Greenville County:
0.01%South Carolina average:
0.04%
Top counties from which taxpayers relocated into this county between 2020 and 2021:
6.82% of this county's 2020 resident taxpayers moved to other counties in 2021 ($63,413 average adjusted gross income )
Here:
6.82%South Carolina average:
7.46%
0.01% of residents moved to foreign countries ($106 average AGI )Greenville County:
0.01%South Carolina average:
0.03%
Top counties to which taxpayers relocated from this county between 2020 and 2021:
Businesses in Simpsonville, SC
Name Count Name Count
AT&T 1 McDonald's 3 Advance Auto Parts 2 Motel 6 1 Applebee's 1 Nike 1 Arby's 2 Panera Bread 1 AutoZone 1 Papa John's Pizza 1 Blockbuster 2 Penske 2 Burger King 1 Pier 1 Imports 1 CVS 4 Pizza Hut 1 Chick-Fil-A 1 Publix Super Markets 2 Comfort Suites 1 Quality 1 Cracker Barrel 1 Quiznos 1 Curves 1 RadioShack 1 Days Inn 1 Rite Aid 2 Decora Cabinetry 1 Ruby Tuesday 1 Domino's Pizza 1 Ryan's Grill 1 Dunkin Donuts 1 SONIC Drive-In 1 FedEx 4 Sprint Nextel 2 Firestone Complete Auto Care 1 Starbucks 2 GNC 1 Subway 5 GameStop 1 T-Mobile 3 H&R Block 2 T.J.Maxx 1 Hardee's 1 Taco Bell 1 Hilton 1 Target 1 Holiday Inn 1 Tire Kingdom 1 Home Depot 1 U-Haul 2 Jack In The Box 2 UPS 8 Just Tires 1 Verizon Wireless 1 KFC 1 Waffle House 1 Kohl's 1 Walgreens 1 Little Caesars Pizza 1 Walmart 1 Lowe's 1 Wendy's 1 MasterBrand Cabinets 2 YMCA 1
Strongest AM radio stations in Simpsonville:
WLFJ (660 AM; daytime; 50 kW; GREENVILLE, SC; Owner: CLEAR CHANNEL BROADCASTING LICENSES, INC.)
WCSZ (1070 AM; 50 kW; SANS SOUCI, SC; Owner: WHYZ RADIO, L.P.)
WFIS (1600 AM; 1 kW; FOUNTAIN INN, SC; Owner: GOLDEN STRIP BROADCASTING, INC.)
WBCU (1460 AM; 50 kW; UNION, SC)
WYRD (1330 AM; 5 kW; GREENVILLE, SC; Owner: ENTERCOM GREENVILLE LICENSE, LLC)
WMUU (1260 AM; 5 kW; GREENVILLE, SC; Owner: WMUU, INC.)
WGVL (1440 AM; 5 kW; GREENVILLE, SC; Owner: CAPSTAR TX LIMITED PARTNERSHIP)
WFGW (1010 AM; 50 kW; BLACK MOUNTAIN, NC; Owner: BLUE RIDGE BROADCASTING CORP.)
WRIX (1020 AM; daytime; 10 kW; HOMELAND PARK, SC; Owner: AM 1020 INCORPORATED)
WORD (950 AM; 5 kW; SPARTANBURG, SC; Owner: ENTERCOM GREENVILLE LICENSE, LLC)
WDAB (1580 AM; 5 kW; TRAVELERS REST, SC; Owner: DABNEY-ADAMSON BROADCASTING, INC.)
WTBI (1540 AM; daytime; 10 kW; PICKENS, SC; Owner: TABERNACLE CHRISTIAN SCHOOLS)
WBAJ (890 AM; daytime; 50 kW; BLYTHEWOOD, SC; Owner: FAMILY FIRST)
Strongest FM radio stations in Simpsonville:
WROQ (101.1 FM; ANDERSON, SC; Owner: OBC BROADCASTING, INC.)
WSSL-FM (100.5 FM; GRAY COURT, SC; Owner: CAPSTAR TX LIMITED PARTNERSHIP)
WMUU-FM (94.5 FM; GREENVILLE, SC; Owner: WMUU, INC.)
WEPR (90.1 FM; GREENVILLE, SC; Owner: SOUTH CAROLINA EDUCATIONAL TV COMMISSION)
WLFJ-FM (89.3 FM; GREENVILLE, SC; Owner: RADIO TRAINING NETWORK, INC.)
WBZT-FM (96.7 FM; MAULDIN, SC; Owner: CLEAR CHANNEL BROADCASTING LICENSES, INC.)
WSPA-FM (98.9 FM; SPARTANBURG, SC; Owner: ENTERCOM GREENVILLE LICENSE, LLC)
WFBC-FM (93.7 FM; GREENVILLE, SC; Owner: ENTERCOM GREENVILLE LICENSE, LLC)
WJMZ-FM (107.3 FM; ANDERSON, SC; Owner: CXR HOLDINGS, INC.)
WESC-FM (92.5 FM; GREENVILLE, SC; Owner: CLEAR CHANNEL BROADCASTING LICENSES, INC.)
WTPT (93.3 FM; FOREST CITY, NC; Owner: UPSTATE BROADCASTING, LLC)
WMYI (102.5 FM; HENDERSONVILLE, NC; Owner: CAPSTAR TX LIMITED PARTNERSHIP)
WTBI-FM (91.7 FM; GREENVILLE, SC; Owner: TABERNACLE BAPTIST BIBLE COLLEGE)
WKSF (99.9 FM; ASHEVILLE, NC; Owner: CAPSTAR TX LIMITED PARTNERSHIP)
WMIT (106.9 FM; BLACK MOUNTAIN, NC; Owner: BLUE RIDGE BROADCASTING CORPORATION)
WNCW (88.7 FM; SPINDALE, NC; Owner: ISOTHERMAL COMMUNITY COLLEGE)
W218AD (91.5 FM; BREVARD, NC; Owner: WESTERN NORTH CAROLINA PUBLIC RADIO)
W247AB (97.3 FM; GREENVILLE, SC; Owner: ISOTHERMAL COMMUNITY COLLEGE)
W220CD (91.9 FM; ENKA, NC; Owner: CALVARY CHAPEL OF TWIN FALLS, INC.)
WOLT (103.3 FM; GREER, SC; Owner: ENTERCOM GREENVILLE LICENSE, LLC)
TV broadcast stations around Simpsonville:
WBSC-TV (Channel 40; ANDERSON, SC; Owner: ANDERSON (WFBC-TV) LICENSEE, INC.)
WHNS (Channel 21; ASHEVILLE, NC; Owner: MEREDITH CORPORATION)
WSQY-LP (Channel 66; SPARTANBURG, SC; Owner: ASHEVILLE MEDIA GROUP, LLC)
WRET-TV (Channel 49; SPARTANBURG, SC; Owner: SOUTH CAROLINA EDUCATIONAL TV COMMISSION)
WASV-TV (Channel 62; ASHEVILLE, NC; Owner: MEDIA GENERAL BROADCASTING OF SOUTH CAROLINA HOLDINGS, INC.)
WNEH (Channel 38; GREENWOOD, SC; Owner: SOUTH CAROLINA EDUCATIONAL TV COMMISSION)
WYFF (Channel 4; GREENVILLE, SC; Owner: WYFF HEARST-ARGYLE TELEVISION, INC.)
W22AC (Channel 22; HARTWELL & ROYSTON, GA; Owner: GEORGIA PUBLIC TELECOMMUNICATIONS COMMISSION)
WSPA-TV (Channel 7; SPARTANBURG, SC; Owner: MEDIA GENERAL BROADCASTING OF SO. CAROLINA HOLDINGS, INC.)
WNTV (Channel 29; GREENVILLE, SC; Owner: SOUTH CAROLINA EDUCATIONAL TV COMMISSION)
W65DS (Channel 65; HONEA PATH, SC; Owner: CAROLINA CHRISTIAN BROADCASTING, INC.)
WGGS-TV (Channel 16; GREENVILLE, SC; Owner: CAROLINA CHRISTIAN BROADCASTING, INC)
National Bridge Inventory (NBI) Statistics 23 Number of bridges213ft / 64.9m Total length $275,000 Total costs285,800 Total average daily traffic20,146 Total average daily truck traffic
New bridges - historical statistics
1 1940-1949 1 1960-1969 3 1970-1979 1 1980-1989 3 1990-1999 8 2000-2009 4 2010-2019 2 2020-2022
See full National Bridge Inventory statistics for Simpsonville, SC
Home Mortgage Disclosure Act Aggregated Statistics For Year 2009(Based on 3 partial tracts) A) FHA, FSA/RHS & VA B) Conventional C) Refinancings D) Home Improvement Loans F) Non-occupant Loans on G) Loans On Manufactured Number Average Value Number Average Value Number Average Value Number Average Value Number Average Value Number Average Value
LOANS ORIGINATED 71 $141,648 38 $163,052 191 $153,265 5 $100,920 14 $166,379 1 $16,920 APPLICATIONS APPROVED, NOT ACCEPTED 6 $155,752 3 $153,683 11 $171,834 0 $0 1 $72,290 0 $0 APPLICATIONS DENIED 11 $151,055 7 $136,001 63 $153,219 3 $72,360 4 $66,032 0 $0 APPLICATIONS WITHDRAWN 6 $161,238 6 $124,433 49 $153,801 1 $123,640 2 $128,935 0 $0 FILES CLOSED FOR INCOMPLETENESS 1 $126,580 2 $106,390 16 $146,984 1 $62,740 0 $0 0 $0
Aggregated Statistics For Year 2008(Based on 3 partial tracts) A) FHA, FSA/RHS & VA B) Conventional C) Refinancings D) Home Improvement Loans F) Non-occupant Loans on G) Loans On Manufactured Number Average Value Number Average Value Number Average Value Number Average Value Number Average Value Number Average Value
LOANS ORIGINATED 59 $151,567 120 $143,441 115 $133,614 7 $67,814 26 $101,710 2 $23,030 APPLICATIONS APPROVED, NOT ACCEPTED 4 $156,142 7 $139,039 16 $143,738 2 $17,265 2 $151,735 0 $0 APPLICATIONS DENIED 15 $142,067 20 $133,910 73 $131,737 12 $40,387 6 $126,380 2 $51,400 APPLICATIONS WITHDRAWN 10 $138,945 11 $164,536 42 $136,686 2 $91,025 2 $59,695 1 $56,540 FILES CLOSED FOR INCOMPLETENESS 2 $141,625 4 $132,682 9 $148,408 0 $0 1 $56,570 0 $0
Aggregated Statistics For Year 2007(Based on 3 partial tracts) A) FHA, FSA/RHS & VA B) Conventional C) Refinancings D) Home Improvement Loans E) Loans on Dwellings For 5+ Families F) Non-occupant Loans on G) Loans On Manufactured Number Average Value Number Average Value Number Average Value Number Average Value Number Average Value Number Average Value Number Average Value
LOANS ORIGINATED 18 $179,213 224 $138,553 116 $112,273 13 $46,642 1 $819,800 40 $100,584 4 $28,120 APPLICATIONS APPROVED, NOT ACCEPTED 1 $258,510 16 $125,999 24 $111,563 2 $44,505 0 $0 3 $77,137 0 $0 APPLICATIONS DENIED 5 $155,254 36 $144,144 93 $112,761 25 $31,971 0 $0 10 $121,521 2 $71,260 APPLICATIONS WITHDRAWN 3 $146,903 20 $147,622 57 $129,108 3 $64,580 0 $0 5 $127,888 0 $0 FILES CLOSED FOR INCOMPLETENESS 0 $0 6 $321,607 15 $116,557 1 $8,440 0 $0 1 $47,470 0 $0
Aggregated Statistics For Year 2006(Based on 3 partial tracts) A) FHA, FSA/RHS & VA B) Conventional C) Refinancings D) Home Improvement Loans E) Loans on Dwellings For 5+ Families F) Non-occupant Loans on G) Loans On Manufactured Number Average Value Number Average Value Number Average Value Number Average Value Number Average Value Number Average Value Number Average Value
LOANS ORIGINATED 20 $155,199 304 $120,161 127 $94,628 16 $28,615 1 $5,086,700 78 $94,526 1 $53,840 APPLICATIONS APPROVED, NOT ACCEPTED 0 $0 33 $90,324 27 $103,872 5 $29,204 0 $0 8 $75,970 2 $48,705 APPLICATIONS DENIED 2 $143,955 43 $117,839 117 $110,918 20 $35,372 0 $0 10 $92,547 3 $81,770 APPLICATIONS WITHDRAWN 2 $161,600 31 $99,356 66 $120,634 3 $52,613 0 $0 8 $79,636 0 $0 FILES CLOSED FOR INCOMPLETENESS 1 $89,730 10 $108,851 20 $112,920 1 $13,660 0 $0 1 $65,540 0 $0
Aggregated Statistics For Year 2005(Based on 3 partial tracts) A) FHA, FSA/RHS & VA B) Conventional C) Refinancings D) Home Improvement Loans E) Loans on Dwellings For 5+ Families F) Non-occupant Loans on G) Loans On Manufactured Number Average Value Number Average Value Number Average Value Number Average Value Number Average Value Number Average Value Number Average Value
LOANS ORIGINATED 17 $129,266 199 $105,127 130 $107,308 18 $35,643 1 $927,830 34 $89,272 3 $33,057 APPLICATIONS APPROVED, NOT ACCEPTED 0 $0 16 $105,139 23 $117,159 4 $29,505 0 $0 2 $120,390 1 $73,900 APPLICATIONS DENIED 3 $130,357 33 $98,007 111 $122,441 16 $29,085 0 $0 9 $95,029 4 $79,905 APPLICATIONS WITHDRAWN 3 $134,613 22 $97,574 73 $127,856 9 $205,960 0 $0 3 $77,297 1 $124,340 FILES CLOSED FOR INCOMPLETENESS 0 $0 6 $92,500 22 $127,412 1 $41,040 0 $0 0 $0 0 $0
Aggregated Statistics For Year 2004(Based on 3 partial tracts) A) FHA, FSA/RHS & VA B) Conventional C) Refinancings D) Home Improvement Loans F) Non-occupant Loans on G) Loans On Manufactured Number Average Value Number Average Value Number Average Value Number Average Value Number Average Value Number Average Value
LOANS ORIGINATED 27 $125,363 171 $115,518 147 $105,772 17 $36,505 33 $88,844 2 $57,865 APPLICATIONS APPROVED, NOT ACCEPTED 1 $106,340 16 $105,611 18 $101,172 2 $17,115 3 $61,730 4 $57,928 APPLICATIONS DENIED 5 $121,254 28 $92,185 122 $106,409 15 $29,877 9 $74,331 7 $63,517 APPLICATIONS WITHDRAWN 6 $148,365 18 $127,012 63 $109,942 4 $30,742 4 $103,402 0 $0 FILES CLOSED FOR INCOMPLETENESS 1 $96,430 6 $91,578 18 $121,561 3 $38,137 1 $44,000 0 $0
Aggregated Statistics For Year 2003(Based on 3 partial tracts) A) FHA, FSA/RHS & VA B) Conventional C) Refinancings D) Home Improvement Loans E) Loans on Dwellings For 5+ Families F) Non-occupant Loans on Number Average Value Number Average Value Number Average Value Number Average Value Number Average Value Number Average Value
LOANS ORIGINATED 32 $119,128 136 $122,246 379 $114,130 14 $29,338 1 $110,780 28 $86,085 APPLICATIONS APPROVED, NOT ACCEPTED 0 $0 10 $116,776 38 $106,457 3 $12,677 0 $0 1 $80,300 APPLICATIONS DENIED 6 $109,632 29 $83,566 97 $105,157 10 $18,162 0 $0 4 $73,292 APPLICATIONS WITHDRAWN 5 $126,936 16 $109,416 64 $107,334 2 $40,370 0 $0 4 $81,852 FILES CLOSED FOR INCOMPLETENESS 0 $0 4 $123,508 17 $129,813 0 $0 0 $0 0 $0
Aggregated Statistics For Year 2002(Based on 3 partial tracts) A) FHA, FSA/RHS & VA B) Conventional C) Refinancings D) Home Improvement Loans F) Non-occupant Loans on Number Average Value Number Average Value Number Average Value Number Average Value Number Average Value
LOANS ORIGINATED 28 $114,766 116 $118,053 274 $106,686 9 $27,589 26 $106,297 APPLICATIONS APPROVED, NOT ACCEPTED 1 $187,720 13 $106,852 31 $98,333 2 $48,735 0 $0 APPLICATIONS DENIED 4 $125,918 23 $76,166 111 $92,496 9 $12,347 6 $75,067 APPLICATIONS WITHDRAWN 2 $91,860 10 $104,501 53 $100,534 2 $21,550 0 $0 FILES CLOSED FOR INCOMPLETENESS 0 $0 3 $119,083 17 $127,443 0 $0 0 $0
Aggregated Statistics For Year 2001(Based on 3 partial tracts) A) FHA, FSA/RHS & VA B) Conventional C) Refinancings D) Home Improvement Loans E) Loans on Dwellings For 5+ Families F) Non-occupant Loans on Number Average Value Number Average Value Number Average Value Number Average Value Number Average Value Number Average Value
LOANS ORIGINATED 35 $109,643 133 $123,594 235 $102,331 17 $15,212 1 $171,360 19 $122,092 APPLICATIONS APPROVED, NOT ACCEPTED 1 $59,070 18 $81,978 24 $84,367 1 $12,160 0 $0 0 $0 APPLICATIONS DENIED 4 $122,128 32 $72,708 109 $77,545 12 $19,890 0 $0 5 $84,918 APPLICATIONS WITHDRAWN 2 $101,360 15 $116,466 57 $83,788 1 $26,580 0 $0 3 $64,373 FILES CLOSED FOR INCOMPLETENESS 1 $69,200 2 $141,470 9 $88,782 0 $0 0 $0 0 $0
Aggregated Statistics For Year 2000(Based on 3 partial tracts) A) FHA, FSA/RHS & VA B) Conventional C) Refinancings D) Home Improvement Loans F) Non-occupant Loans on Number Average Value Number Average Value Number Average Value Number Average Value Number Average Value
LOANS ORIGINATED 43 $102,595 144 $111,057 60 $81,504 13 $24,645 18 $112,016 APPLICATIONS APPROVED, NOT ACCEPTED 3 $75,257 18 $78,404 26 $75,051 4 $20,878 2 $48,745 APPLICATIONS DENIED 9 $100,438 44 $72,625 92 $66,875 16 $21,615 3 $81,260 APPLICATIONS WITHDRAWN 6 $109,568 16 $111,882 34 $62,715 2 $31,930 1 $57,400 FILES CLOSED FOR INCOMPLETENESS 1 $67,810 5 $116,280 6 $81,445 0 $0 1 $27,730
Aggregated Statistics For Year 1999(Based on 3 partial tracts) A) FHA, FSA/RHS & VA B) Conventional C) Refinancings D) Home Improvement Loans F) Non-occupant Loans on Number Average Value Number Average Value Number Average Value Number Average Value Number Average Value
LOANS ORIGINATED 45 $104,556 151 $101,714 128 $85,583 16 $15,644 12 $66,853 APPLICATIONS APPROVED, NOT ACCEPTED 3 $84,693 19 $84,159 41 $78,728 9 $21,767 4 $59,585 APPLICATIONS DENIED 5 $109,260 58 $69,153 80 $73,554 17 $15,479 3 $89,830 APPLICATIONS WITHDRAWN 7 $104,154 24 $101,307 45 $75,128 0 $0 2 $138,280 FILES CLOSED FOR INCOMPLETENESS 1 $106,440 6 $112,612 17 $69,730 0 $0 0 $0
Detailed HMDA statistics for the following Tracts:
0030.04
, 0030.05 , 0030.06
Private Mortgage Insurance Companies Aggregated Statistics For Year 2009(Based on 3 partial tracts) A) Conventional B) Refinancings Number Average Value Number Average Value
LOANS ORIGINATED 10 $164,111 15 $168,673 APPLICATIONS APPROVED, NOT ACCEPTED 5 $173,982 5 $163,984 APPLICATIONS DENIED 2 $168,720 1 $290,800 APPLICATIONS WITHDRAWN 0 $0 2 $116,990 FILES CLOSED FOR INCOMPLETENESS 2 $96,475 1 $105,140
Aggregated Statistics For Year 2008(Based on 3 partial tracts) A) Conventional B) Refinancings C) Non-occupant Loans on Number Average Value Number Average Value Number Average Value
LOANS ORIGINATED 57 $149,600 22 $163,382 6 $123,758 APPLICATIONS APPROVED, NOT ACCEPTED 17 $141,648 6 $129,822 5 $89,068 APPLICATIONS DENIED 6 $116,127 0 $0 1 $147,410 APPLICATIONS WITHDRAWN 2 $143,180 1 $90,070 0 $0 FILES CLOSED FOR INCOMPLETENESS 1 $143,740 1 $148,450 0 $0
Aggregated Statistics For Year 2007(Based on 3 partial tracts) A) Conventional B) Refinancings C) Non-occupant Loans on Number Average Value Number Average Value Number Average Value
LOANS ORIGINATED 92 $151,118 23 $136,110 8 $119,826 APPLICATIONS APPROVED, NOT ACCEPTED 11 $154,335 3 $141,023 2 $97,760 APPLICATIONS DENIED 1 $165,280 1 $155,370 0 $0 APPLICATIONS WITHDRAWN 2 $133,365 2 $109,630 0 $0 FILES CLOSED FOR INCOMPLETENESS 1 $105,260 1 $44,430 0 $0
Aggregated Statistics For Year 2006(Based on 3 partial tracts) A) Conventional B) Refinancings C) Non-occupant Loans on Number Average Value Number Average Value Number Average Value
LOANS ORIGINATED 51 $141,334 13 $125,270 5 $109,246 APPLICATIONS APPROVED, NOT ACCEPTED 4 $137,025 4 $148,762 1 $32,070 APPLICATIONS DENIED 1 $98,830 0 $0 0 $0 APPLICATIONS WITHDRAWN 4 $116,198 3 $130,780 1 $185,740 FILES CLOSED FOR INCOMPLETENESS 0 $0 0 $0 0 $0
Aggregated Statistics For Year 2005(Based on 3 partial tracts) A) Conventional B) Refinancings C) Non-occupant Loans on Number Average Value Number Average Value Number Average Value
LOANS ORIGINATED 44 $124,776 21 $125,607 6 $112,130 APPLICATIONS APPROVED, NOT ACCEPTED 5 $91,620 6 $163,073 3 $70,160 APPLICATIONS DENIED 0 $0 1 $145,950 0 $0 APPLICATIONS WITHDRAWN 1 $183,410 1 $75,420 0 $0 FILES CLOSED FOR INCOMPLETENESS 0 $0 0 $0 0 $0
Aggregated Statistics For Year 2004(Based on 3 partial tracts) A) Conventional B) Refinancings C) Non-occupant Loans on D) Loans On Manufactured Number Average Value Number Average Value Number Average Value Number Average Value
LOANS ORIGINATED 43 $119,933 28 $127,016 8 $97,660 1 $30,660 APPLICATIONS APPROVED, NOT ACCEPTED 8 $128,262 10 $130,993 1 $23,270 0 $0 APPLICATIONS DENIED 1 $127,600 2 $96,120 0 $0 0 $0 APPLICATIONS WITHDRAWN 3 $119,703 5 $147,074 1 $107,170 0 $0 FILES CLOSED FOR INCOMPLETENESS 1 $135,320 1 $139,550 0 $0 0 $0
Aggregated Statistics For Year 2003(Based on 3 partial tracts) A) Conventional B) Refinancings C) Non-occupant Loans on Number Average Value Number Average Value Number Average Value
LOANS ORIGINATED 58 $128,662 92 $127,434 3 $70,783 APPLICATIONS APPROVED, NOT ACCEPTED 11 $113,060 31 $124,172 2 $72,975 APPLICATIONS DENIED 3 $129,003 3 $134,620 0 $0 APPLICATIONS WITHDRAWN 1 $66,190 5 $116,492 0 $0 FILES CLOSED FOR INCOMPLETENESS 0 $0 1 $70,380 0 $0
Aggregated Statistics For Year 2002(Based on 3 partial tracts) A) Conventional B) Refinancings C) Non-occupant Loans on Number Average Value Number Average Value Number Average Value
LOANS ORIGINATED 61 $132,710 75 $120,240 5 $90,946 APPLICATIONS APPROVED, NOT ACCEPTED 10 $121,285 19 $118,587 2 $59,245 APPLICATIONS DENIED 1 $173,280 3 $122,610 0 $0 APPLICATIONS WITHDRAWN 3 $109,500 3 $123,553 0 $0 FILES CLOSED FOR INCOMPLETENESS 2 $96,775 3 $112,900 0 $0
Aggregated Statistics For Year 2001(Based on 3 partial tracts) A) Conventional B) Refinancings C) Non-occupant Loans on Number Average Value Number Average Value Number Average Value
LOANS ORIGINATED 67 $122,573 62 $119,929 3 $79,397 APPLICATIONS APPROVED, NOT ACCEPTED 11 $117,579 8 $130,303 1 $77,950 APPLICATIONS DENIED 2 $108,265 6 $126,578 1 $170,740 APPLICATIONS WITHDRAWN 2 $89,200 4 $99,132 1 $46,630 FILES CLOSED FOR INCOMPLETENESS 0 $0 0 $0 0 $0
Aggregated Statistics For Year 2000(Based on 3 partial tracts) A) Conventional B) Refinancings C) Non-occupant Loans on Number Average Value Number Average Value Number Average Value
LOANS ORIGINATED 69 $119,461 5 $90,188 2 $98,020 APPLICATIONS APPROVED, NOT ACCEPTED 8 $113,778 2 $97,745 0 $0 APPLICATIONS DENIED 2 $139,535 3 $173,013 0 $0 APPLICATIONS WITHDRAWN 4 $117,135 1 $28,560 0 $0 FILES CLOSED FOR INCOMPLETENESS 2 $86,925 0 $0 0 $0
Aggregated Statistics For Year 1999(Based on 3 partial tracts) A) Conventional B) Refinancings C) Non-occupant Loans on Number Average Value Number Average Value Number Average Value
LOANS ORIGINATED 72 $117,767 21 $109,020 2 $86,000 APPLICATIONS APPROVED, NOT ACCEPTED 7 $117,981 3 $84,213 0 $0 APPLICATIONS DENIED 3 $97,407 3 $85,707 1 $45,030 APPLICATIONS WITHDRAWN 1 $154,170 2 $80,790 0 $0 FILES CLOSED FOR INCOMPLETENESS 1 $131,220 0 $0 0 $0
Detailed PMIC statistics for the following Tracts:
0030.04
, 0030.05 , 0030.06 Fire-safe hotels and motels in Simpsonville, South Carolina:
Fairfield Inn & Suites, 3821 Grandview Dr, Simpsonville, South Carolina 29680 Phone: (864) 962-8500, Fax: (864) 962-8501
Hampton Inn Simpsonville, 3934 Grandview Dr, Simpsonville, South Carolina 29680 Phone: (864) 963-9292, Fax: (864) 962-9494
Quality Inn, 3755 Grandview Dr, Simpsonville, South Carolina 29680 Phone: (864) 963-2777, Fax: (864) 963-2777
Value Place Simpsonville, 3025 Grandview Dr, Simpsonville, South Carolina 29680 Phone: (864) 962-9500, Fax: (864) 588-8999
Comfort Suites Simpsonville, 3971 Grandview Dr, Simpsonville, South Carolina 29680 Phone: (864) 757-1552, Fax: (864) 757-1553
Holiday Inn Express & Suites Greenville SE-Simpsonville, 642 Fairview Rd, Simpsonville, South Carolina 29680 Phone: (864) 962-3228, Fax: (864) 962-3229
All 6 fire-safe hotels and motels in Simpsonville, South Carolina
Most common first names in Simpsonville, SC among deceased individuals Name Count Lived (average)
James 191 70.3 years John 143 71.4 years William 135 72.7 years Mary 115 75.4 years Robert 87 71.5 years Charles 73 71.7 years Margaret 59 76.3 years George 54 73.6 years Thomas 52 68.9 years Willie 48 75.8 years
Most common last names in Simpsonville, SC among deceased individuals Last name Count Lived (average)
Smith 82 72.3 years Jones 52 77.1 years Brown 42 75.3 years Fowler 42 76.4 years Johnson 38 73.0 years Sullivan 37 72.2 years Henderson 34 76.1 years Williams 31 74.9 years Thompson 30 76.5 years Garrett 30 72.8 years
Simpsonville compared to South Carolina state average:
Unemployed percentage significantly below state average. Hispanic race population percentage above state average. Foreign-born population percentage significantly above state average. Length of stay since moving in above state average. House age below state average. Percentage of population with a bachelor's degree or higher above state average. Simpsonville on our top lists :
#63 on the list of "Top 101 cities with the most residents born in Egypt (population 500+)"
#82 on the list of "Top 101 cities with the smallest racial income disparities between White and Black householders (with at least 200 householders)"
#8 on the list of "Top 101 counties with the highest lead air pollution readings in 2012 (µg/m3 )"
#22 on the list of "Top 101 counties with the lowest lead air pollution readings in 2012 (µg/m3 )"
#27 on the list of "Top 101 counties with the most Evangelical Protestant adherents"
#32 on the list of "Top 101 counties with the lowest percentage of residents that drank alcohol in the past 30 days"
#34 on the list of "Top 101 counties with the largest increase in the number of infant deaths per 1000 residents 2000-2006 to 2007-2013 (pop. 50,000+)"
Top Patent Applicants
Srikanth Chandrudu Kottilingam (106)
Jonathan Dwight Berry (75)
Richard Martin Dicintio (46)
Gary Michael Itzel (38)
David Wayne Weber (38)
Willy Steve Ziminsky (38)
Jong Ho Uhm (36)
Aaron Ezekiel Smith (35)
Geoffrey David Myers (35)
Baifang Zuo (32)
Total of 3009 patent applications in 2008-2024.

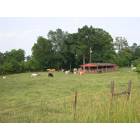


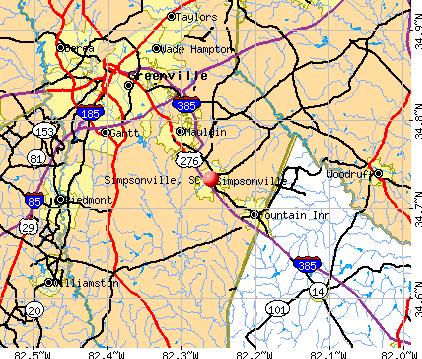


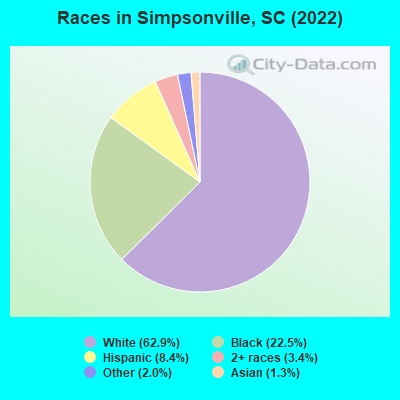
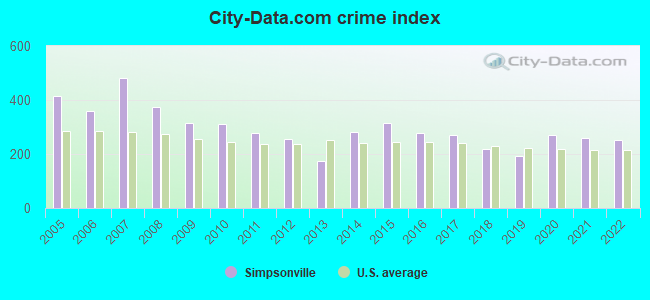
 Recent articles from our blog. Our writers, many of them Ph.D. graduates or candidates, create easy-to-read articles on a wide variety of topics.


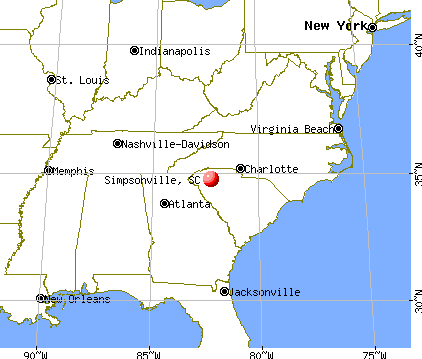
 (10.5 miles
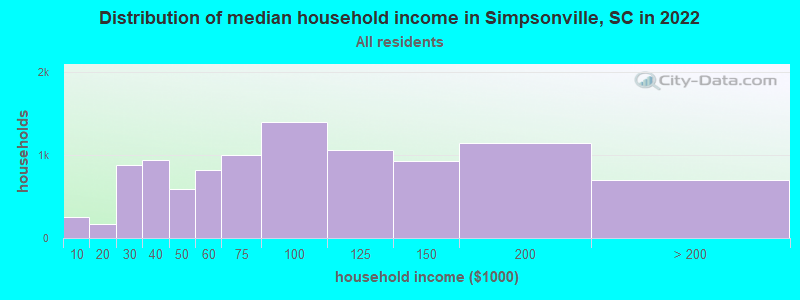
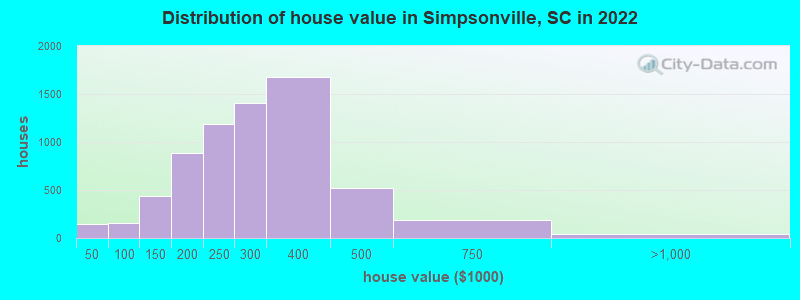
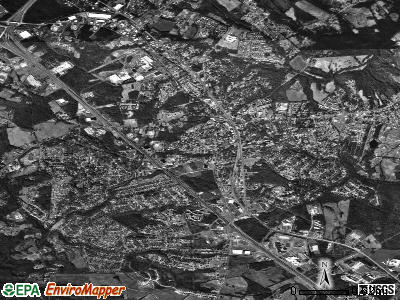
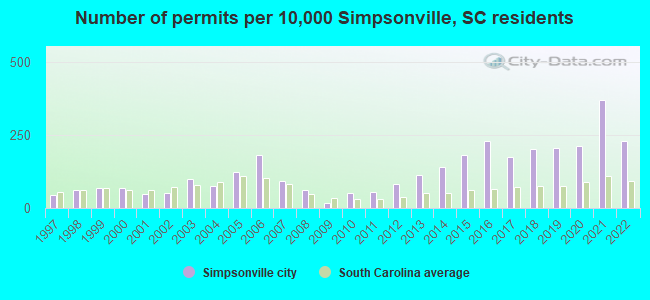
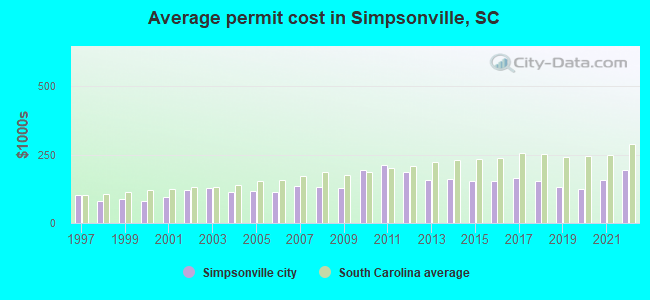
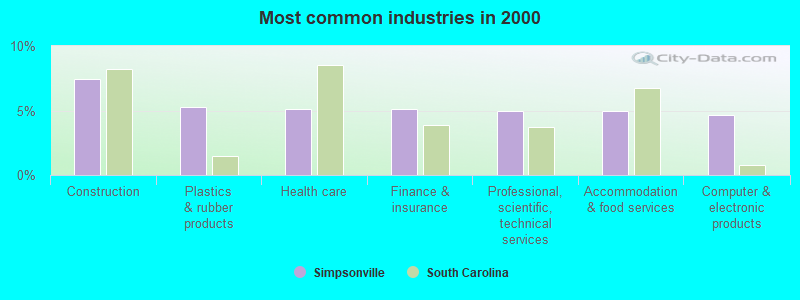
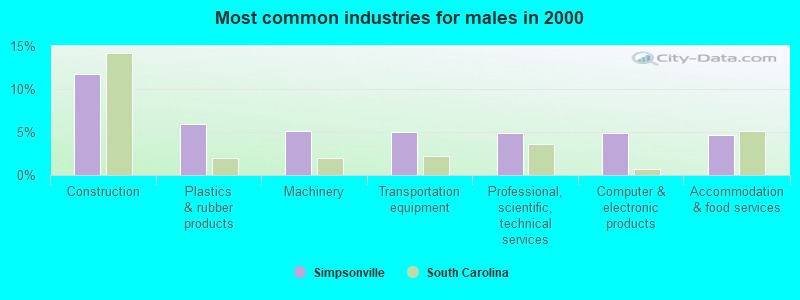
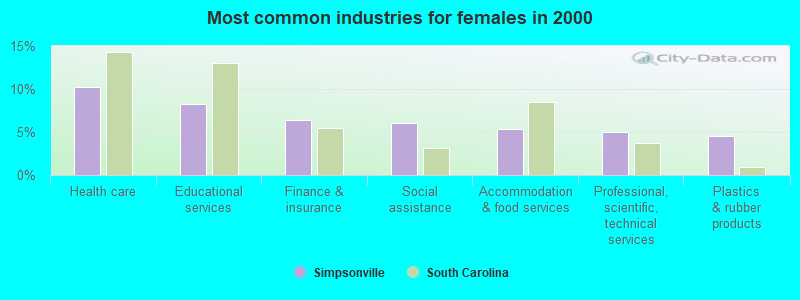
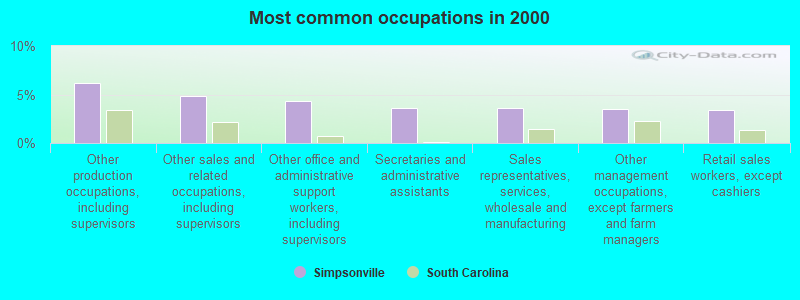
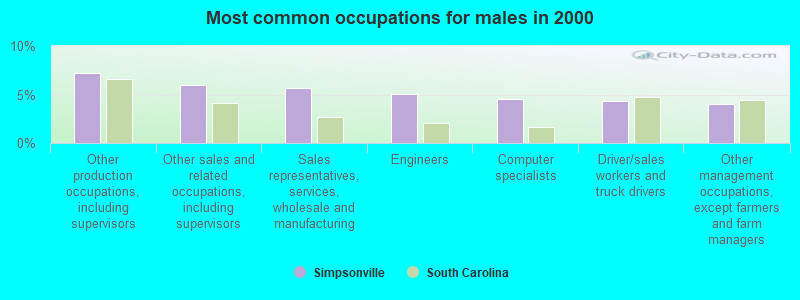
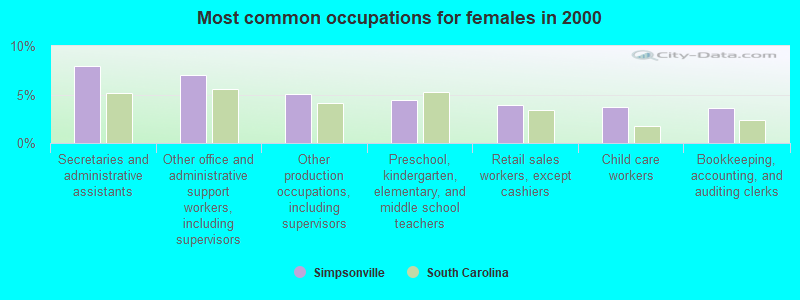


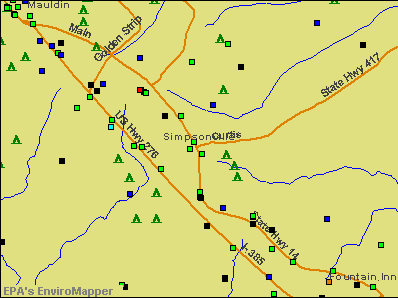

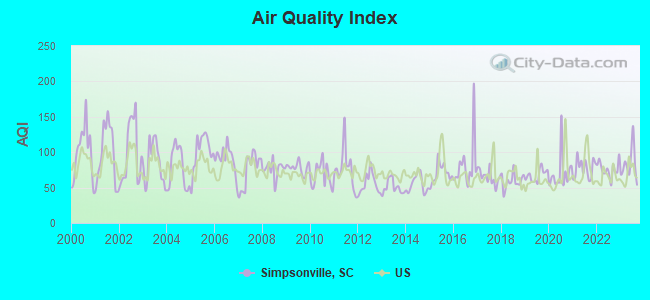
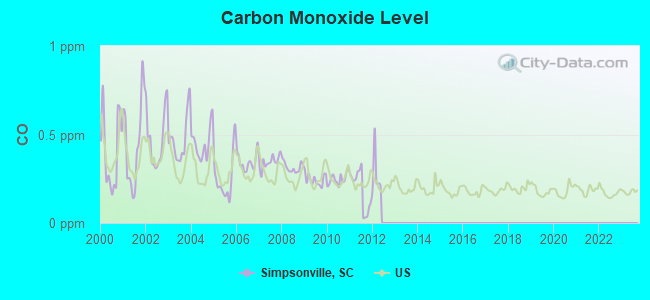
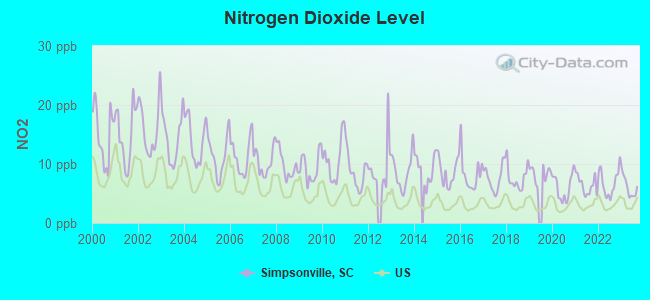
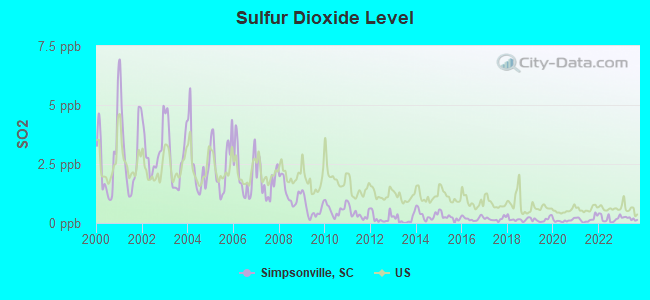
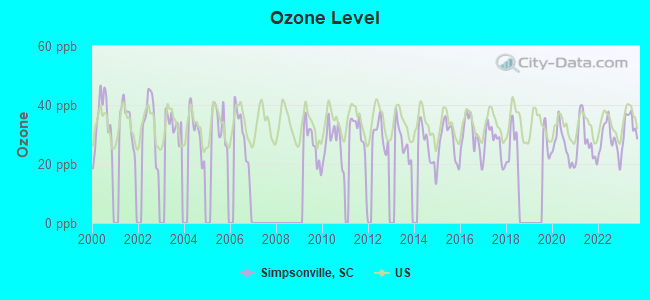
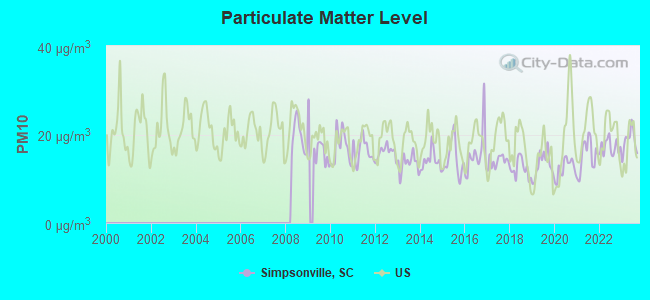
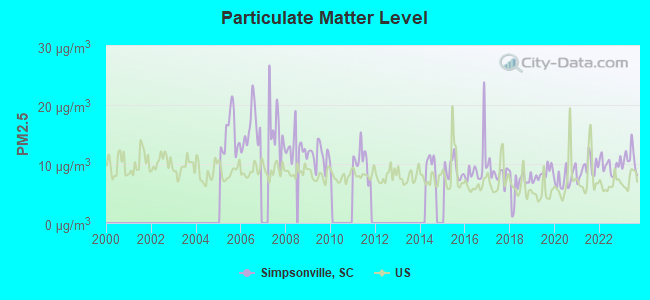
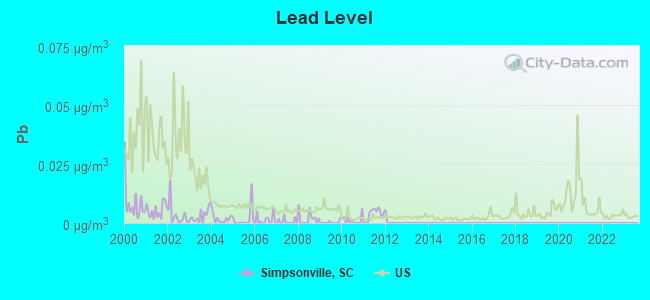
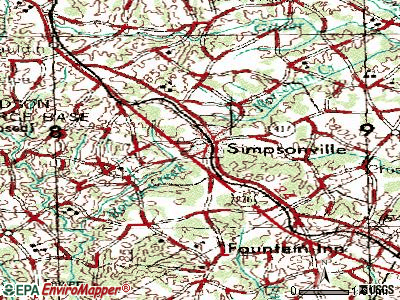
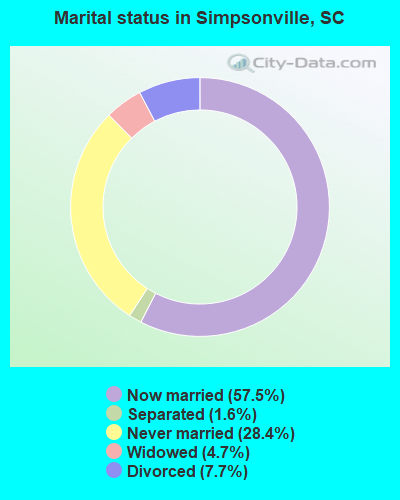
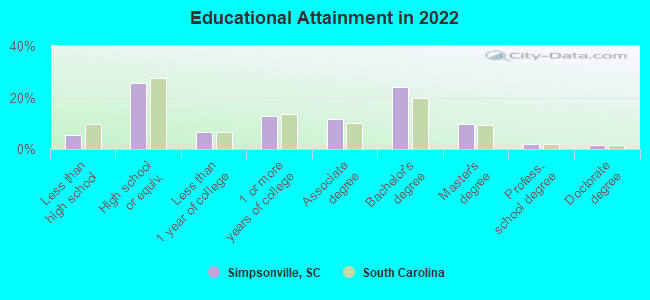
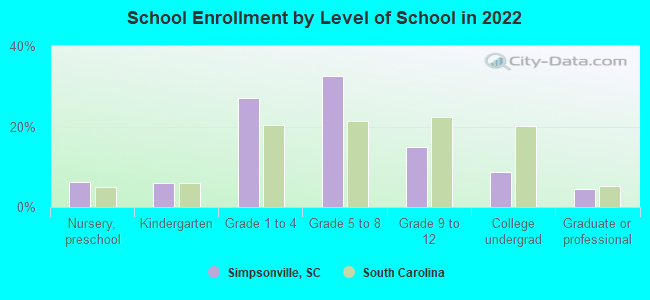
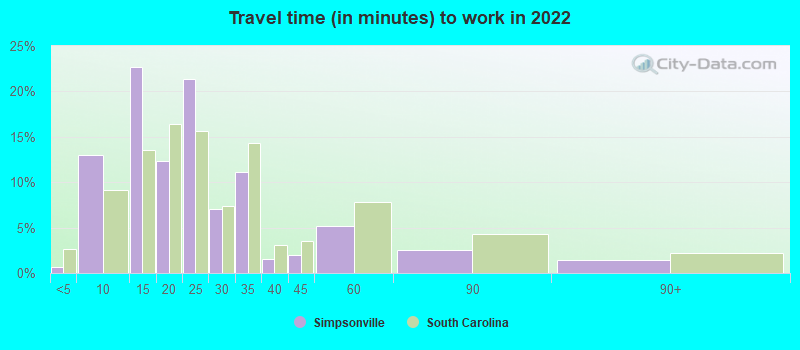
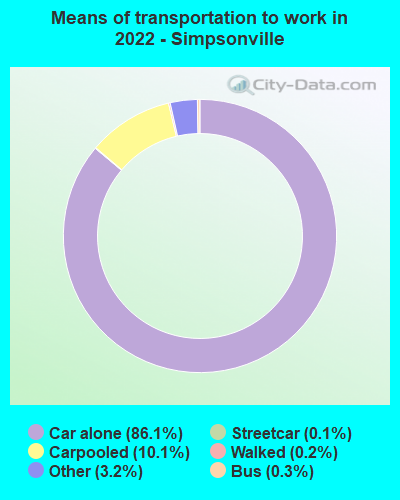
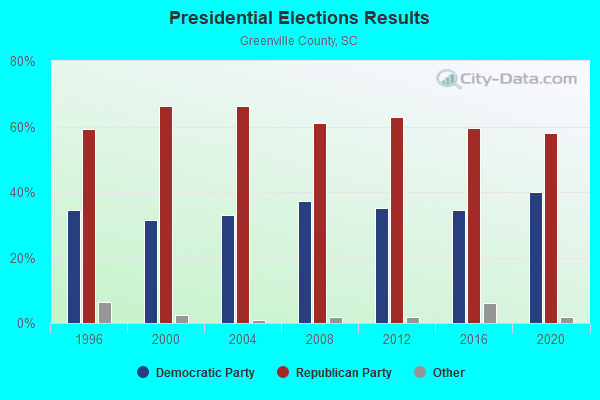

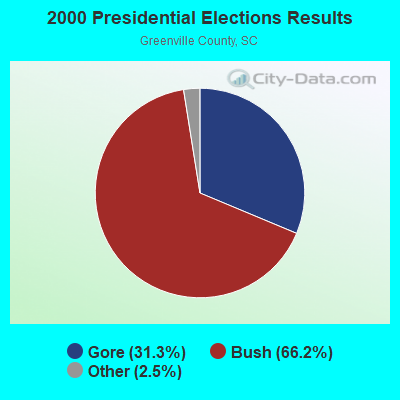
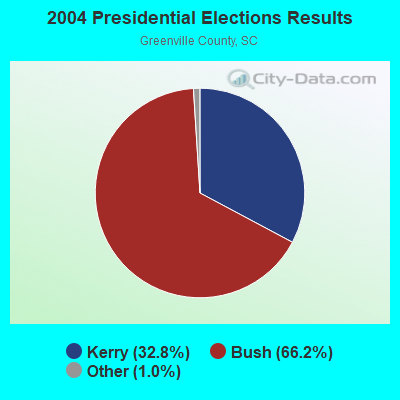
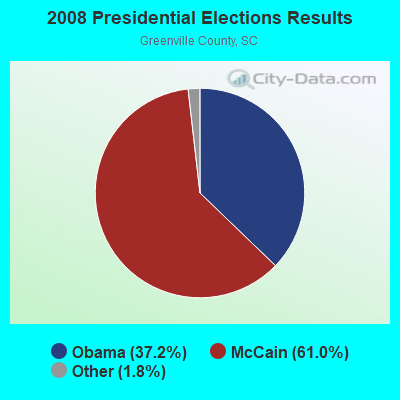
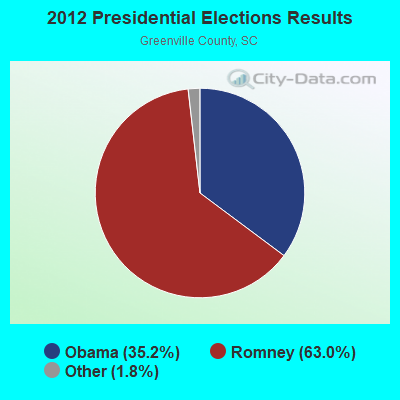
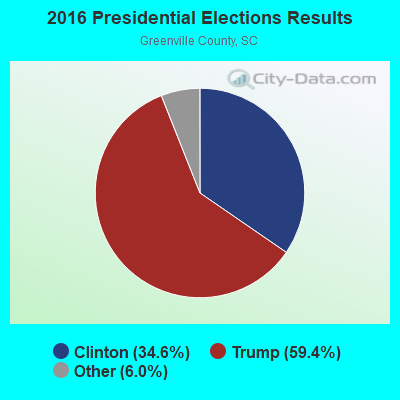
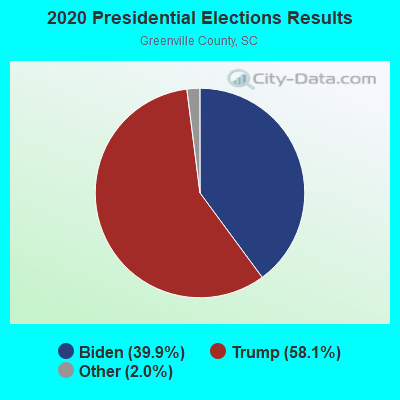
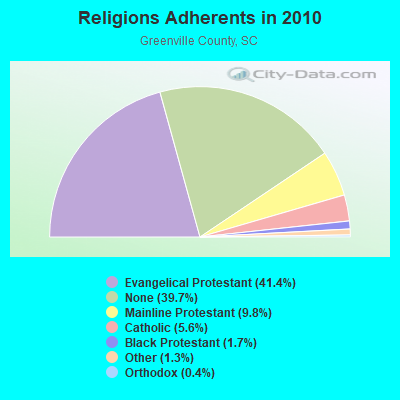
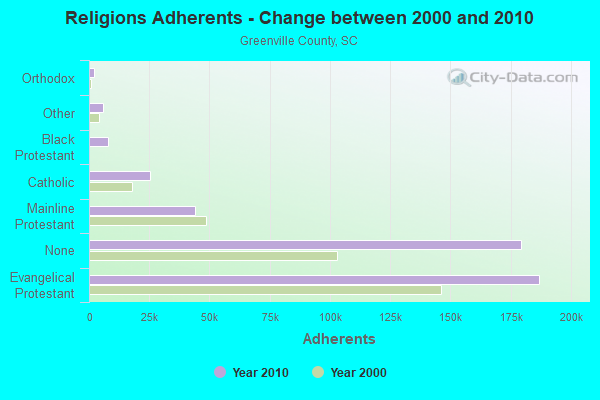
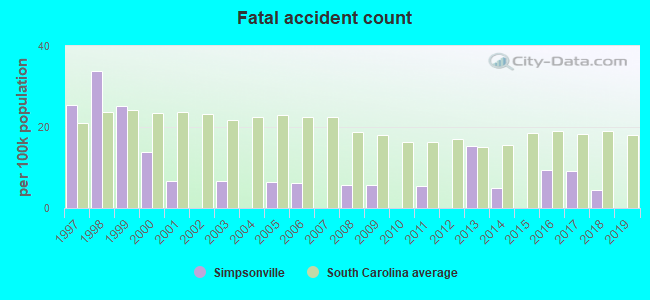
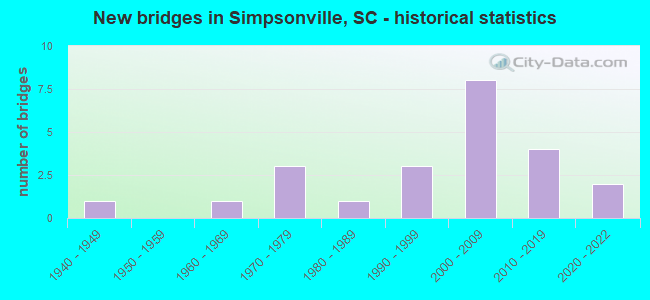
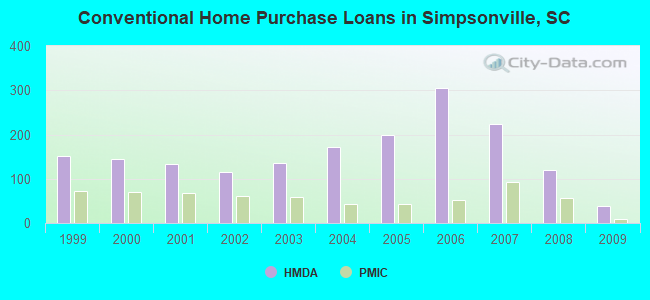
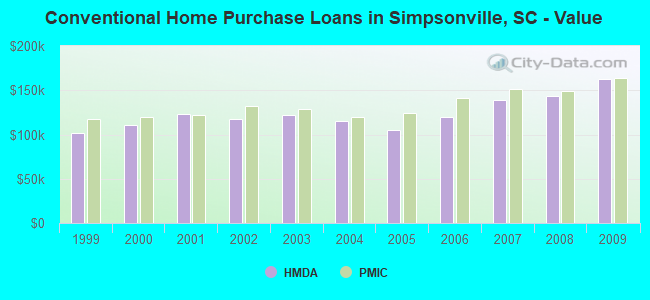
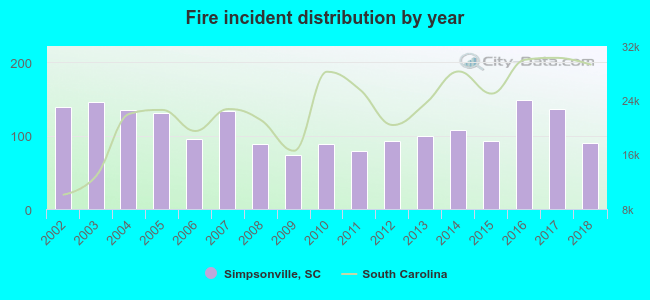 According to the data from the years 2002 - 2018 the average number of fires per year is 110. The highest number of fires - 148 took place in 2016, and the least - 73 in 2009. The data has a decreasing trend.
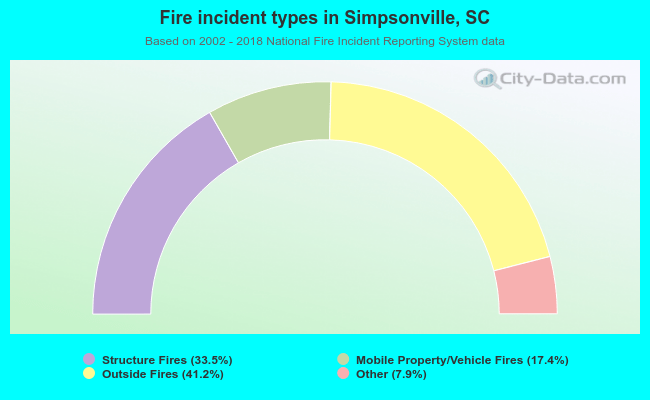 When looking into fire subcategories, the most reports belonged to: Outside Fires (41.2%), and Structure Fires (33.5%).