Somersworth, New Hampshire Submit your own pictures of this city and show them to the world
OSM Map
General Map
Google Map
MSN Map
OSM Map
General Map
Google Map
MSN Map
OSM Map
General Map
Google Map
MSN Map
OSM Map
General Map
Google Map
MSN Map
Please wait while loading the map...
Population in 2022: 12,159 (97% urban, 3% rural). Population change since 2000: +5.9%Males: 6,135 Females: 6,024
March 2022 cost of living index in Somersworth: 131.9 (high, U.S. average is 100) Percentage of residents living in poverty in 2022: 8.7%for White Non-Hispanic residents , 29.1% for Hispanic or Latino residents , 100.0% for American Indian residents , 32.7% for other race residents , 4.6% for two or more races residents )
Profiles of local businesses
Business Search - 14 Million verified businesses
Data:
Median household income ($)
Median household income (% change since 2000)
Household income diversity
Ratio of average income to average house value (%)
Ratio of average income to average rent
Median household income ($) - White
Median household income ($) - Black or African American
Median household income ($) - Asian
Median household income ($) - Hispanic or Latino
Median household income ($) - American Indian and Alaska Native
Median household income ($) - Multirace
Median household income ($) - Other Race
Median household income for houses/condos with a mortgage ($)
Median household income for apartments without a mortgage ($)
Races - White alone (%)
Races - White alone (% change since 2000)
Races - Black alone (%)
Races - Black alone (% change since 2000)
Races - American Indian alone (%)
Races - American Indian alone (% change since 2000)
Races - Asian alone (%)
Races - Asian alone (% change since 2000)
Races - Hispanic (%)
Races - Hispanic (% change since 2000)
Races - Native Hawaiian and Other Pacific Islander alone (%)
Races - Native Hawaiian and Other Pacific Islander alone (% change since 2000)
Races - Two or more races (%)
Races - Two or more races (% change since 2000)
Races - Other race alone (%)
Races - Other race alone (% change since 2000)
Racial diversity
Unemployment (%)
Unemployment (% change since 2000)
Unemployment (%) - White
Unemployment (%) - Black or African American
Unemployment (%) - Asian
Unemployment (%) - Hispanic or Latino
Unemployment (%) - American Indian and Alaska Native
Unemployment (%) - Multirace
Unemployment (%) - Other Race
Population density (people per square mile)
Population - Males (%)
Population - Females (%)
Population - Males (%) - White
Population - Males (%) - Black or African American
Population - Males (%) - Asian
Population - Males (%) - Hispanic or Latino
Population - Males (%) - American Indian and Alaska Native
Population - Males (%) - Multirace
Population - Males (%) - Other Race
Population - Females (%) - White
Population - Females (%) - Black or African American
Population - Females (%) - Asian
Population - Females (%) - Hispanic or Latino
Population - Females (%) - American Indian and Alaska Native
Population - Females (%) - Multirace
Population - Females (%) - Other Race
Coronavirus confirmed cases (Apr 19, 2024)
Deaths caused by coronavirus (Apr 19, 2024)
Coronavirus confirmed cases (per 100k population) (Apr 19, 2024)
Deaths caused by coronavirus (per 100k population) (Apr 19, 2024)
Daily increase in number of cases (Apr 19, 2024)
Weekly increase in number of cases (Apr 19, 2024)
Cases doubled (in days) (Apr 19, 2024)
Hospitalized patients (Apr 18, 2022)
Negative test results (Apr 18, 2022)
Total test results (Apr 18, 2022)
COVID Vaccine doses distributed (per 100k population) (Sep 19, 2023)
COVID Vaccine doses administered (per 100k population) (Sep 19, 2023)
COVID Vaccine doses distributed (Sep 19, 2023)
COVID Vaccine doses administered (Sep 19, 2023)
Likely homosexual households (%)
Likely homosexual households (% change since 2000)
Likely homosexual households - Lesbian couples (%)
Likely homosexual households - Lesbian couples (% change since 2000)
Likely homosexual households - Gay men (%)
Likely homosexual households - Gay men (% change since 2000)
Cost of living index
Median gross rent ($)
Median contract rent ($)
Median monthly housing costs ($)
Median house or condo value ($)
Median house or condo value ($ change since 2000)
Mean house or condo value by units in structure - 1, detached ($)
Mean house or condo value by units in structure - 1, attached ($)
Mean house or condo value by units in structure - 2 ($)
Mean house or condo value by units in structure by units in structure - 3 or 4 ($)
Mean house or condo value by units in structure - 5 or more ($)
Mean house or condo value by units in structure - Boat, RV, van, etc. ($)
Mean house or condo value by units in structure - Mobile home ($)
Median house or condo value ($) - White
Median house or condo value ($) - Black or African American
Median house or condo value ($) - Asian
Median house or condo value ($) - Hispanic or Latino
Median house or condo value ($) - American Indian and Alaska Native
Median house or condo value ($) - Multirace
Median house or condo value ($) - Other Race
Median resident age
Resident age diversity
Median resident age - Males
Median resident age - Females
Median resident age - White
Median resident age - Black or African American
Median resident age - Asian
Median resident age - Hispanic or Latino
Median resident age - American Indian and Alaska Native
Median resident age - Multirace
Median resident age - Other Race
Median resident age - Males - White
Median resident age - Males - Black or African American
Median resident age - Males - Asian
Median resident age - Males - Hispanic or Latino
Median resident age - Males - American Indian and Alaska Native
Median resident age - Males - Multirace
Median resident age - Males - Other Race
Median resident age - Females - White
Median resident age - Females - Black or African American
Median resident age - Females - Asian
Median resident age - Females - Hispanic or Latino
Median resident age - Females - American Indian and Alaska Native
Median resident age - Females - Multirace
Median resident age - Females - Other Race
Commute - mean travel time to work (minutes)
Travel time to work - Less than 5 minutes (%)
Travel time to work - Less than 5 minutes (% change since 2000)
Travel time to work - 5 to 9 minutes (%)
Travel time to work - 5 to 9 minutes (% change since 2000)
Travel time to work - 10 to 19 minutes (%)
Travel time to work - 10 to 19 minutes (% change since 2000)
Travel time to work - 20 to 29 minutes (%)
Travel time to work - 20 to 29 minutes (% change since 2000)
Travel time to work - 30 to 39 minutes (%)
Travel time to work - 30 to 39 minutes (% change since 2000)
Travel time to work - 40 to 59 minutes (%)
Travel time to work - 40 to 59 minutes (% change since 2000)
Travel time to work - 60 to 89 minutes (%)
Travel time to work - 60 to 89 minutes (% change since 2000)
Travel time to work - 90 or more minutes (%)
Travel time to work - 90 or more minutes (% change since 2000)
Marital status - Never married (%)
Marital status - Now married (%)
Marital status - Separated (%)
Marital status - Widowed (%)
Marital status - Divorced (%)
Median family income ($)
Median family income (% change since 2000)
Median non-family income ($)
Median non-family income (% change since 2000)
Median per capita income ($)
Median per capita income (% change since 2000)
Median family income ($) - White
Median family income ($) - Black or African American
Median family income ($) - Asian
Median family income ($) - Hispanic or Latino
Median family income ($) - American Indian and Alaska Native
Median family income ($) - Multirace
Median family income ($) - Other Race
Median year house/condo built
Median year apartment built
Year house built - Built 2005 or later (%)
Year house built - Built 2000 to 2004 (%)
Year house built - Built 1990 to 1999 (%)
Year house built - Built 1980 to 1989 (%)
Year house built - Built 1970 to 1979 (%)
Year house built - Built 1960 to 1969 (%)
Year house built - Built 1950 to 1959 (%)
Year house built - Built 1940 to 1949 (%)
Year house built - Built 1939 or earlier (%)
Average household size
Household density (households per square mile)
Average household size - White
Average household size - Black or African American
Average household size - Asian
Average household size - Hispanic or Latino
Average household size - American Indian and Alaska Native
Average household size - Multirace
Average household size - Other Race
Occupied housing units (%)
Vacant housing units (%)
Owner occupied housing units (%)
Renter occupied housing units (%)
Vacancy status - For rent (%)
Vacancy status - For sale only (%)
Vacancy status - Rented or sold, not occupied (%)
Vacancy status - For seasonal, recreational, or occasional use (%)
Vacancy status - For migrant workers (%)
Vacancy status - Other vacant (%)
Residents with income below the poverty level (%)
Residents with income below 50% of the poverty level (%)
Children below poverty level (%)
Poor families by family type - Married-couple family (%)
Poor families by family type - Male, no wife present (%)
Poor families by family type - Female, no husband present (%)
Poverty status for native-born residents (%)
Poverty status for foreign-born residents (%)
Poverty among high school graduates not in families (%)
Poverty among people who did not graduate high school not in families (%)
Residents with income below the poverty level (%) - White
Residents with income below the poverty level (%) - Black or African American
Residents with income below the poverty level (%) - Asian
Residents with income below the poverty level (%) - Hispanic or Latino
Residents with income below the poverty level (%) - American Indian and Alaska Native
Residents with income below the poverty level (%) - Multirace
Residents with income below the poverty level (%) - Other Race
Air pollution - Air Quality Index (AQI)
Air pollution - CO
Air pollution - NO2
Air pollution - SO2
Air pollution - Ozone
Air pollution - PM10
Air pollution - PM25
Air pollution - Pb
Crime - Murders per 100,000 population
Crime - Rapes per 100,000 population
Crime - Robberies per 100,000 population
Crime - Assaults per 100,000 population
Crime - Burglaries per 100,000 population
Crime - Thefts per 100,000 population
Crime - Auto thefts per 100,000 population
Crime - Arson per 100,000 population
Crime - City-data.com crime index
Crime - Violent crime index
Crime - Property crime index
Crime - Murders per 100,000 population (5 year average)
Crime - Rapes per 100,000 population (5 year average)
Crime - Robberies per 100,000 population (5 year average)
Crime - Assaults per 100,000 population (5 year average)
Crime - Burglaries per 100,000 population (5 year average)
Crime - Thefts per 100,000 population (5 year average)
Crime - Auto thefts per 100,000 population (5 year average)
Crime - Arson per 100,000 population (5 year average)
Crime - City-data.com crime index (5 year average)
Crime - Violent crime index (5 year average)
Crime - Property crime index (5 year average)
1996 Presidential Elections Results (%) - Democratic Party (Clinton)
1996 Presidential Elections Results (%) - Republican Party (Dole)
1996 Presidential Elections Results (%) - Other
2000 Presidential Elections Results (%) - Democratic Party (Gore)
2000 Presidential Elections Results (%) - Republican Party (Bush)
2000 Presidential Elections Results (%) - Other
2004 Presidential Elections Results (%) - Democratic Party (Kerry)
2004 Presidential Elections Results (%) - Republican Party (Bush)
2004 Presidential Elections Results (%) - Other
2008 Presidential Elections Results (%) - Democratic Party (Obama)
2008 Presidential Elections Results (%) - Republican Party (McCain)
2008 Presidential Elections Results (%) - Other
2012 Presidential Elections Results (%) - Democratic Party (Obama)
2012 Presidential Elections Results (%) - Republican Party (Romney)
2012 Presidential Elections Results (%) - Other
2016 Presidential Elections Results (%) - Democratic Party (Clinton)
2016 Presidential Elections Results (%) - Republican Party (Trump)
2016 Presidential Elections Results (%) - Other
2020 Presidential Elections Results (%) - Democratic Party (Biden)
2020 Presidential Elections Results (%) - Republican Party (Trump)
2020 Presidential Elections Results (%) - Other
Ancestries Reported - Arab (%)
Ancestries Reported - Czech (%)
Ancestries Reported - Danish (%)
Ancestries Reported - Dutch (%)
Ancestries Reported - English (%)
Ancestries Reported - French (%)
Ancestries Reported - French Canadian (%)
Ancestries Reported - German (%)
Ancestries Reported - Greek (%)
Ancestries Reported - Hungarian (%)
Ancestries Reported - Irish (%)
Ancestries Reported - Italian (%)
Ancestries Reported - Lithuanian (%)
Ancestries Reported - Norwegian (%)
Ancestries Reported - Polish (%)
Ancestries Reported - Portuguese (%)
Ancestries Reported - Russian (%)
Ancestries Reported - Scotch-Irish (%)
Ancestries Reported - Scottish (%)
Ancestries Reported - Slovak (%)
Ancestries Reported - Subsaharan African (%)
Ancestries Reported - Swedish (%)
Ancestries Reported - Swiss (%)
Ancestries Reported - Ukrainian (%)
Ancestries Reported - United States (%)
Ancestries Reported - Welsh (%)
Ancestries Reported - West Indian (%)
Ancestries Reported - Other (%)
Educational Attainment - No schooling completed (%)
Educational Attainment - Less than high school (%)
Educational Attainment - High school or equivalent (%)
Educational Attainment - Less than 1 year of college (%)
Educational Attainment - 1 or more years of college (%)
Educational Attainment - Associate degree (%)
Educational Attainment - Bachelor's degree (%)
Educational Attainment - Master's degree (%)
Educational Attainment - Professional school degree (%)
Educational Attainment - Doctorate degree (%)
School Enrollment - Nursery, preschool (%)
School Enrollment - Kindergarten (%)
School Enrollment - Grade 1 to 4 (%)
School Enrollment - Grade 5 to 8 (%)
School Enrollment - Grade 9 to 12 (%)
School Enrollment - College undergrad (%)
School Enrollment - Graduate or professional (%)
School Enrollment - Not enrolled in school (%)
School enrollment - Public schools (%)
School enrollment - Private schools (%)
School enrollment - Not enrolled (%)
Median number of rooms in houses and condos
Median number of rooms in apartments
Housing units lacking complete plumbing facilities (%)
Housing units lacking complete kitchen facilities (%)
Density of houses
Urban houses (%)
Rural houses (%)
Households with people 60 years and over (%)
Households with people 65 years and over (%)
Households with people 75 years and over (%)
Households with one or more nonrelatives (%)
Households with no nonrelatives (%)
Population in households (%)
Family households (%)
Nonfamily households (%)
Population in families (%)
Family households with own children (%)
Median number of bedrooms in owner occupied houses
Mean number of bedrooms in owner occupied houses
Median number of bedrooms in renter occupied houses
Mean number of bedrooms in renter occupied houses
Median number of vehichles in owner occupied houses
Mean number of vehichles in owner occupied houses
Median number of vehichles in renter occupied houses
Mean number of vehichles in renter occupied houses
Mortgage status - with mortgage (%)
Mortgage status - with second mortgage (%)
Mortgage status - with home equity loan (%)
Mortgage status - with both second mortgage and home equity loan (%)
Mortgage status - without a mortgage (%)
Average family size
Average family size - White
Average family size - Black or African American
Average family size - Asian
Average family size - Hispanic or Latino
Average family size - American Indian and Alaska Native
Average family size - Multirace
Average family size - Other Race
Geographical mobility - Same house 1 year ago (%)
Geographical mobility - Moved within same county (%)
Geographical mobility - Moved from different county within same state (%)
Geographical mobility - Moved from different state (%)
Geographical mobility - Moved from abroad (%)
Place of birth - Born in state of residence (%)
Place of birth - Born in other state (%)
Place of birth - Native, outside of US (%)
Place of birth - Foreign born (%)
Housing units in structures - 1, detached (%)
Housing units in structures - 1, attached (%)
Housing units in structures - 2 (%)
Housing units in structures - 3 or 4 (%)
Housing units in structures - 5 to 9 (%)
Housing units in structures - 10 to 19 (%)
Housing units in structures - 20 to 49 (%)
Housing units in structures - 50 or more (%)
Housing units in structures - Mobile home (%)
Housing units in structures - Boat, RV, van, etc. (%)
House/condo owner moved in on average (years ago)
Renter moved in on average (years ago)
Year householder moved into unit - Moved in 1999 to March 2000 (%)
Year householder moved into unit - Moved in 1995 to 1998 (%)
Year householder moved into unit - Moved in 1990 to 1994 (%)
Year householder moved into unit - Moved in 1980 to 1989 (%)
Year householder moved into unit - Moved in 1970 to 1979 (%)
Year householder moved into unit - Moved in 1969 or earlier (%)
Means of transportation to work - Drove car alone (%)
Means of transportation to work - Carpooled (%)
Means of transportation to work - Public transportation (%)
Means of transportation to work - Bus or trolley bus (%)
Means of transportation to work - Streetcar or trolley car (%)
Means of transportation to work - Subway or elevated (%)
Means of transportation to work - Railroad (%)
Means of transportation to work - Ferryboat (%)
Means of transportation to work - Taxicab (%)
Means of transportation to work - Motorcycle (%)
Means of transportation to work - Bicycle (%)
Means of transportation to work - Walked (%)
Means of transportation to work - Other means (%)
Working at home (%)
Industry diversity
Most Common Industries - Agriculture, forestry, fishing and hunting, and mining (%)
Most Common Industries - Agriculture, forestry, fishing and hunting (%)
Most Common Industries - Mining, quarrying, and oil and gas extraction (%)
Most Common Industries - Construction (%)
Most Common Industries - Manufacturing (%)
Most Common Industries - Wholesale trade (%)
Most Common Industries - Retail trade (%)
Most Common Industries - Transportation and warehousing, and utilities (%)
Most Common Industries - Transportation and warehousing (%)
Most Common Industries - Utilities (%)
Most Common Industries - Information (%)
Most Common Industries - Finance and insurance, and real estate and rental and leasing (%)
Most Common Industries - Finance and insurance (%)
Most Common Industries - Real estate and rental and leasing (%)
Most Common Industries - Professional, scientific, and management, and administrative and waste management services (%)
Most Common Industries - Professional, scientific, and technical services (%)
Most Common Industries - Management of companies and enterprises (%)
Most Common Industries - Administrative and support and waste management services (%)
Most Common Industries - Educational services, and health care and social assistance (%)
Most Common Industries - Educational services (%)
Most Common Industries - Health care and social assistance (%)
Most Common Industries - Arts, entertainment, and recreation, and accommodation and food services (%)
Most Common Industries - Arts, entertainment, and recreation (%)
Most Common Industries - Accommodation and food services (%)
Most Common Industries - Other services, except public administration (%)
Most Common Industries - Public administration (%)
Occupation diversity
Most Common Occupations - Management, business, science, and arts occupations (%)
Most Common Occupations - Management, business, and financial occupations (%)
Most Common Occupations - Management occupations (%)
Most Common Occupations - Business and financial operations occupations (%)
Most Common Occupations - Computer, engineering, and science occupations (%)
Most Common Occupations - Computer and mathematical occupations (%)
Most Common Occupations - Architecture and engineering occupations (%)
Most Common Occupations - Life, physical, and social science occupations (%)
Most Common Occupations - Education, legal, community service, arts, and media occupations (%)
Most Common Occupations - Community and social service occupations (%)
Most Common Occupations - Legal occupations (%)
Most Common Occupations - Education, training, and library occupations (%)
Most Common Occupations - Arts, design, entertainment, sports, and media occupations (%)
Most Common Occupations - Healthcare practitioners and technical occupations (%)
Most Common Occupations - Health diagnosing and treating practitioners and other technical occupations (%)
Most Common Occupations - Health technologists and technicians (%)
Most Common Occupations - Service occupations (%)
Most Common Occupations - Healthcare support occupations (%)
Most Common Occupations - Protective service occupations (%)
Most Common Occupations - Fire fighting and prevention, and other protective service workers including supervisors (%)
Most Common Occupations - Law enforcement workers including supervisors (%)
Most Common Occupations - Food preparation and serving related occupations (%)
Most Common Occupations - Building and grounds cleaning and maintenance occupations (%)
Most Common Occupations - Personal care and service occupations (%)
Most Common Occupations - Sales and office occupations (%)
Most Common Occupations - Sales and related occupations (%)
Most Common Occupations - Office and administrative support occupations (%)
Most Common Occupations - Natural resources, construction, and maintenance occupations (%)
Most Common Occupations - Farming, fishing, and forestry occupations (%)
Most Common Occupations - Construction and extraction occupations (%)
Most Common Occupations - Installation, maintenance, and repair occupations (%)
Most Common Occupations - Production, transportation, and material moving occupations (%)
Most Common Occupations - Production occupations (%)
Most Common Occupations - Transportation occupations (%)
Most Common Occupations - Material moving occupations (%)
People in Group quarters - Institutionalized population (%)
People in Group quarters - Correctional institutions (%)
People in Group quarters - Federal prisons and detention centers (%)
People in Group quarters - Halfway houses (%)
People in Group quarters - Local jails and other confinement facilities (including police lockups) (%)
People in Group quarters - Military disciplinary barracks (%)
People in Group quarters - State prisons (%)
People in Group quarters - Other types of correctional institutions (%)
People in Group quarters - Nursing homes (%)
People in Group quarters - Hospitals/wards, hospices, and schools for the handicapped (%)
People in Group quarters - Hospitals/wards and hospices for chronically ill (%)
People in Group quarters - Hospices or homes for chronically ill (%)
People in Group quarters - Military hospitals or wards for chronically ill (%)
People in Group quarters - Other hospitals or wards for chronically ill (%)
People in Group quarters - Hospitals or wards for drug/alcohol abuse (%)
People in Group quarters - Mental (Psychiatric) hospitals or wards (%)
People in Group quarters - Schools, hospitals, or wards for the mentally retarded (%)
People in Group quarters - Schools, hospitals, or wards for the physically handicapped (%)
People in Group quarters - Institutions for the deaf (%)
People in Group quarters - Institutions for the blind (%)
People in Group quarters - Orthopedic wards and institutions for the physically handicapped (%)
People in Group quarters - Wards in general hospitals for patients who have no usual home elsewhere (%)
People in Group quarters - Wards in military hospitals for patients who have no usual home elsewhere (%)
People in Group quarters - Juvenile institutions (%)
People in Group quarters - Long-term care (%)
People in Group quarters - Homes for abused, dependent, and neglected children (%)
People in Group quarters - Residential treatment centers for emotionally disturbed children (%)
People in Group quarters - Training schools for juvenile delinquents (%)
People in Group quarters - Short-term care, detention or diagnostic centers for delinquent children (%)
People in Group quarters - Type of juvenile institution unknown (%)
People in Group quarters - Noninstitutionalized population (%)
People in Group quarters - College dormitories (includes college quarters off campus) (%)
People in Group quarters - Military quarters (%)
People in Group quarters - On base (%)
People in Group quarters - Barracks, unaccompanied personnel housing (UPH), (Enlisted/Officer), ;and similar group living quarters for military personnel (%)
People in Group quarters - Transient quarters for temporary residents (%)
People in Group quarters - Military ships (%)
People in Group quarters - Group homes (%)
People in Group quarters - Homes or halfway houses for drug/alcohol abuse (%)
People in Group quarters - Homes for the mentally ill (%)
People in Group quarters - Homes for the mentally retarded (%)
People in Group quarters - Homes for the physically handicapped (%)
People in Group quarters - Other group homes (%)
People in Group quarters - Religious group quarters (%)
People in Group quarters - Dormitories (%)
People in Group quarters - Agriculture workers' dormitories on farms (%)
People in Group quarters - Job Corps and vocational training facilities (%)
People in Group quarters - Other workers' dormitories (%)
People in Group quarters - Crews of maritime vessels (%)
People in Group quarters - Other nonhousehold living situations (%)
People in Group quarters - Other noninstitutional group quarters (%)
Residents speaking English at home (%)
Residents speaking English at home - Born in the United States (%)
Residents speaking English at home - Native, born elsewhere (%)
Residents speaking English at home - Foreign born (%)
Residents speaking Spanish at home (%)
Residents speaking Spanish at home - Born in the United States (%)
Residents speaking Spanish at home - Native, born elsewhere (%)
Residents speaking Spanish at home - Foreign born (%)
Residents speaking other language at home (%)
Residents speaking other language at home - Born in the United States (%)
Residents speaking other language at home - Native, born elsewhere (%)
Residents speaking other language at home - Foreign born (%)
Class of Workers - Employee of private company (%)
Class of Workers - Self-employed in own incorporated business (%)
Class of Workers - Private not-for-profit wage and salary workers (%)
Class of Workers - Local government workers (%)
Class of Workers - State government workers (%)
Class of Workers - Federal government workers (%)
Class of Workers - Self-employed workers in own not incorporated business and Unpaid family workers (%)
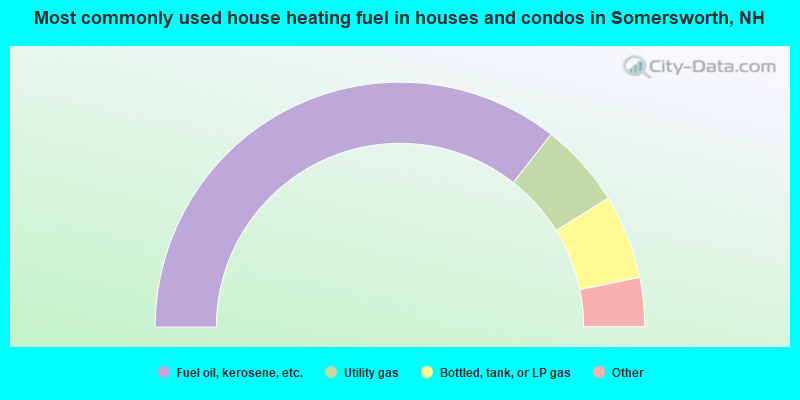
House heating fuel used in houses and condos - Utility gas (%)
House heating fuel used in houses and condos - Bottled, tank, or LP gas (%)
House heating fuel used in houses and condos - Electricity (%)
House heating fuel used in houses and condos - Fuel oil, kerosene, etc. (%)
House heating fuel used in houses and condos - Coal or coke (%)
House heating fuel used in houses and condos - Wood (%)
House heating fuel used in houses and condos - Solar energy (%)
House heating fuel used in houses and condos - Other fuel (%)
House heating fuel used in houses and condos - No fuel used (%)
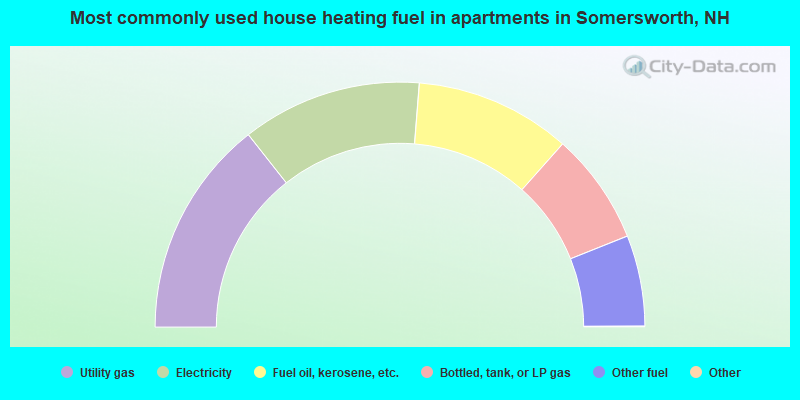
House heating fuel used in apartments - Utility gas (%)
House heating fuel used in apartments - Bottled, tank, or LP gas (%)
House heating fuel used in apartments - Electricity (%)
House heating fuel used in apartments - Fuel oil, kerosene, etc. (%)
House heating fuel used in apartments - Coal or coke (%)
House heating fuel used in apartments - Wood (%)
House heating fuel used in apartments - Solar energy (%)
House heating fuel used in apartments - Other fuel (%)
House heating fuel used in apartments - No fuel used (%)
Armed forces status - In Armed Forces (%)
Armed forces status - Civilian (%)
Armed forces status - Civilian - Veteran (%)
Armed forces status - Civilian - Nonveteran (%)
Fatal accidents locations in years 2005-2021
Fatal accidents locations in 2005
Fatal accidents locations in 2006
Fatal accidents locations in 2007
Fatal accidents locations in 2008
Fatal accidents locations in 2009
Fatal accidents locations in 2010
Fatal accidents locations in 2011
Fatal accidents locations in 2012
Fatal accidents locations in 2013
Fatal accidents locations in 2014
Fatal accidents locations in 2015
Fatal accidents locations in 2016
Fatal accidents locations in 2017
Fatal accidents locations in 2018
Fatal accidents locations in 2019
Fatal accidents locations in 2020
Fatal accidents locations in 2021
Alcohol use - People drinking some alcohol every month (%)
Alcohol use - People not drinking at all (%)
Alcohol use - Average days/month drinking alcohol
Alcohol use - Average drinks/week
Alcohol use - Average days/year people drink much
Audiometry - Average condition of hearing (%)
Audiometry - People that can hear a whisper from across a quiet room (%)
Audiometry - People that can hear normal voice from across a quiet room (%)
Audiometry - Ears ringing, roaring, buzzing (%)
Audiometry - Had a job exposure to loud noise (%)
Audiometry - Had off-work exposure to loud noise (%)
Blood Pressure & Cholesterol - Has high blood pressure (%)
Blood Pressure & Cholesterol - Checking blood pressure at home (%)
Blood Pressure & Cholesterol - Frequently checking blood cholesterol (%)
Blood Pressure & Cholesterol - Has high cholesterol level (%)
Consumer Behavior - Money monthly spent on food at supermarket/grocery store
Consumer Behavior - Money monthly spent on food at other stores
Consumer Behavior - Money monthly spent on eating out
Consumer Behavior - Money monthly spent on carryout/delivered foods
Consumer Behavior - Income spent on food at supermarket/grocery store (%)
Consumer Behavior - Income spent on food at other stores (%)
Consumer Behavior - Income spent on eating out (%)
Consumer Behavior - Income spent on carryout/delivered foods (%)
Current Health Status - General health condition (%)
Current Health Status - Blood donors (%)
Current Health Status - Has blood ever tested for HIV virus (%)
Current Health Status - Left-handed people (%)
Dermatology - People using sunscreen (%)
Diabetes - Diabetics (%)
Diabetes - Had a blood test for high blood sugar (%)
Diabetes - People taking insulin (%)
Diet Behavior & Nutrition - Diet health (%)
Diet Behavior & Nutrition - Milk product consumption (# of products/month)
Diet Behavior & Nutrition - Meals not home prepared (#/week)
Diet Behavior & Nutrition - Meals from fast food or pizza place (#/week)
Diet Behavior & Nutrition - Ready-to-eat foods (#/month)
Diet Behavior & Nutrition - Frozen meals/pizza (#/month)
Drug Use - People that ever used marijuana or hashish (%)
Drug Use - Ever used hard drugs (%)
Drug Use - Ever used any form of cocaine (%)
Drug Use - Ever used heroin (%)
Drug Use - Ever used methamphetamine (%)
Health Insurance - People covered by health insurance (%)
Kidney Conditions-Urology - Avg. # of times urinating at night
Medical Conditions - People with asthma (%)
Medical Conditions - People with anemia (%)
Medical Conditions - People with psoriasis (%)
Medical Conditions - People with overweight (%)
Medical Conditions - Elderly people having difficulties in thinking or remembering (%)
Medical Conditions - People who ever received blood transfusion (%)
Medical Conditions - People having trouble seeing even with glass/contacts (%)
Medical Conditions - People with arthritis (%)
Medical Conditions - People with gout (%)
Medical Conditions - People with congestive heart failure (%)
Medical Conditions - People with coronary heart disease (%)
Medical Conditions - People with angina pectoris (%)
Medical Conditions - People who ever had heart attack (%)
Medical Conditions - People who ever had stroke (%)
Medical Conditions - People with emphysema (%)
Medical Conditions - People with thyroid problem (%)
Medical Conditions - People with chronic bronchitis (%)
Medical Conditions - People with any liver condition (%)
Medical Conditions - People who ever had cancer or malignancy (%)
Mental Health - People who have little interest in doing things (%)
Mental Health - People feeling down, depressed, or hopeless (%)
Mental Health - People who have trouble sleeping or sleeping too much (%)
Mental Health - People feeling tired or having little energy (%)
Mental Health - People with poor appetite or overeating (%)
Mental Health - People feeling bad about themself (%)
Mental Health - People who have trouble concentrating on things (%)
Mental Health - People moving or speaking slowly or too fast (%)
Mental Health - People having thoughts they would be better off dead (%)
Oral Health - Average years since last visit a dentist
Oral Health - People embarrassed because of mouth (%)
Oral Health - People with gum disease (%)
Oral Health - General health of teeth and gums (%)
Oral Health - Average days a week using dental floss/device
Oral Health - Average days a week using mouthwash for dental problem
Oral Health - Average number of teeth
Pesticide Use - Households using pesticides to control insects (%)
Pesticide Use - Households using pesticides to kill weeds (%)
Physical Activity - People doing vigorous-intensity work activities (%)
Physical Activity - People doing moderate-intensity work activities (%)
Physical Activity - People walking or bicycling (%)
Physical Activity - People doing vigorous-intensity recreational activities (%)
Physical Activity - People doing moderate-intensity recreational activities (%)
Physical Activity - Average hours a day doing sedentary activities
Physical Activity - Average hours a day watching TV or videos
Physical Activity - Average hours a day using computer
Physical Functioning - People having limitations keeping them from working (%)
Physical Functioning - People limited in amount of work they can do (%)
Physical Functioning - People that need special equipment to walk (%)
Physical Functioning - People experiencing confusion/memory problems (%)
Physical Functioning - People requiring special healthcare equipment (%)
Prescription Medications - Average number of prescription medicines taking
Preventive Aspirin Use - Adults 40+ taking low-dose aspirin (%)
Reproductive Health - Vaginal deliveries (%)
Reproductive Health - Cesarean deliveries (%)
Reproductive Health - Deliveries resulted in a live birth (%)
Reproductive Health - Pregnancies resulted in a delivery (%)
Reproductive Health - Women breastfeeding newborns (%)
Reproductive Health - Women that had a hysterectomy (%)
Reproductive Health - Women that had both ovaries removed (%)
Reproductive Health - Women that have ever taken birth control pills (%)
Reproductive Health - Women taking birth control pills (%)
Reproductive Health - Women that have ever used Depo-Provera or injectables (%)
Reproductive Health - Women that have ever used female hormones (%)
Sexual Behavior - People 18+ that ever had sex (vaginal, anal, or oral) (%)
Sexual Behavior - Males 18+ that ever had vaginal sex with a woman (%)
Sexual Behavior - Males 18+ that ever performed oral sex on a woman (%)
Sexual Behavior - Males 18+ that ever had anal sex with a woman (%)
Sexual Behavior - Males 18+ that ever had any sex with a man (%)
Sexual Behavior - Females 18+ that ever had vaginal sex with a man (%)
Sexual Behavior - Females 18+ that ever performed oral sex on a man (%)
Sexual Behavior - Females 18+ that ever had anal sex with a man (%)
Sexual Behavior - Females 18+ that ever had any kind of sex with a woman (%)
Sexual Behavior - Average age people first had sex
Sexual Behavior - Average number of female sex partners in lifetime (males 18+)
Sexual Behavior - Average number of female vaginal sex partners in lifetime (males 18+)
Sexual Behavior - Average age people first performed oral sex on a woman (18+)
Sexual Behavior - Average number of woman performed oral sex on in lifetime (18+)
Sexual Behavior - Average number of male sex partners in lifetime (males 18+)
Sexual Behavior - Average number of male anal sex partners in lifetime (males 18+)
Sexual Behavior - Average age people first performed oral sex on a man (18+)
Sexual Behavior - Average number of male oral sex partners in lifetime (18+)
Sexual Behavior - People using protection when performing oral sex (%)
Sexual Behavior - Average number of times people have vaginal or anal sex a year
Sexual Behavior - People having sex without condom (%)
Sexual Behavior - Average number of male sex partners in lifetime (females 18+)
Sexual Behavior - Average number of male vaginal sex partners in lifetime (females 18+)
Sexual Behavior - Average number of female sex partners in lifetime (females 18+)
Sexual Behavior - Circumcised males 18+ (%)
Sleep Disorders - Average hours sleeping at night
Sleep Disorders - People that has trouble sleeping (%)
Smoking-Cigarette Use - People smoking cigarettes (%)
Taste & Smell - People 40+ having problems with smell (%)
Taste & Smell - People 40+ having problems with taste (%)
Taste & Smell - People 40+ that ever had wisdom teeth removed (%)
Taste & Smell - People 40+ that ever had tonsils teeth removed (%)
Taste & Smell - People 40+ that ever had a loss of consciousness because of a head injury (%)
Taste & Smell - People 40+ that ever had a broken nose or other serious injury to face or skull (%)
Taste & Smell - People 40+ that ever had two or more sinus infections (%)
Weight - Average height (inches)
Weight - Average weight (pounds)
Weight - Average BMI
Weight - People that are obese (%)
Weight - People that ever were obese (%)
Weight - People trying to lose weight (%)
Officers per 1,000 residents here:
2.00New Hampshire average:
2.14
Latest news from Somersworth, NH collected exclusively by city-data.com from local newspapers, TV, and radio stations
Ancestries: Irish (15.6%), Italian (13.0%), French Canadian (12.3%), English (9.6%), French (8.3%), German (4.7%).
Current Local Time:
Land area: 9.78 square miles.
Population density: 1,243 people per square mile (low).
730 residents are foreign born (3.8% Asia , 1.0% Europe , 0.9% Latin America ).
This city:
6.0%New Hampshire:
6.0%
Median real estate property taxes paid for housing units with mortgages in 2022: $5,930 (2.0%)Median real estate property taxes paid for housing units with no mortgage in 2022: $6,752 (2.2%)
Nearest city with pop. 50,000+: Manchester, NH
Nearest city with pop. 200,000+: Boston, MA
Nearest city with pop. 1,000,000+: Bronx, NY
Nearest cities:
Latitude: 43.25 N, Longitude: 70.88 W
Daytime population change due to commuting: -1,697 (-14.0%)Workers who live and work in this city: 1,391 (19.5%)
Somersworth tourist attractions:
Single-family new house construction building permits:
2022: 37 buildings , average cost: $251,8002021: 46 buildings , average cost: $253,4002020: 31 buildings , average cost: $224,9002019: 24 buildings , average cost: $185,6002018: 13 buildings , average cost: $177,3002017: 18 buildings , average cost: $171,5002016: 24 buildings , average cost: $118,7002015: 11 buildings , average cost: $175,4002014: 3 buildings , average cost: $162,3002013: 6 buildings , average cost: $186,7002012: 11 buildings , average cost: $58,1002011: 3 buildings , average cost: $220,3002010: 16 buildings , average cost: $112,0002009: 18 buildings , average cost: $225,3002008: 19 buildings , average cost: $220,2002007: 25 buildings , average cost: $203,8002006: 44 buildings , average cost: $126,9002005: 64 buildings , average cost: $121,9002004: 49 buildings , average cost: $109,3002003: 16 buildings , average cost: $109,0002002: 24 buildings , average cost: $122,9002001: 23 buildings , average cost: $100,8002000: 29 buildings , average cost: $94,9001999: 13 buildings , average cost: $70,5001998: 13 buildings , average cost: $70,4001997: 11 buildings , average cost: $70,800Unemployment in December 2023: Here:
2.2%New Hampshire:
2.5%
Population change in the 1990s: +277 (+2.5%).
Most common occupations in Somersworth, NH (%)
Both Males Females
Other production occupations, including supervisors (5.3%)
Other office and administrative support workers, including supervisors (4.4%)
Other management occupations, except farmers and farm managers (4.4%)
Electrical equipment mechanics and other installation, maintenance, and repair workers, including supervisors (3.6%)
Retail sales workers, except cashiers (3.3%)
Computer specialists (3.1%)
Material recording, scheduling, dispatching, and distributing workers (3.1%)
Electrical equipment mechanics and other installation, maintenance, and repair workers, including supervisors (6.5%)
Other production occupations, including supervisors (5.5%)
Computer specialists (4.6%)
Other management occupations, except farmers and farm managers (4.6%)
Driver/sales workers and truck drivers (4.5%)
Engineers (4.4%)
Building and grounds cleaning and maintenance occupations (4.2%)
Other office and administrative support workers, including supervisors (7.0%)
Bookkeeping, accounting, and auditing clerks (5.8%)
Other production occupations, including supervisors (5.1%)
Other management occupations, except farmers and farm managers (4.2%)
Retail sales workers, except cashiers (4.0%)
Secretaries and administrative assistants (3.9%)
Nursing, psychiatric, and home health aides (3.4%)
Tornado activity:
Somersworth-area historical tornado activity is near New Hampshire state average. It is 58% smaller than the overall U.S. average.
On 6/9/1953, a category F3 (max. wind speeds 158-206 mph) tornado 20.2 miles away from the Somersworth city center injured 5 people and caused between $5000 and $50,000 in damages.
On 5/14/1963, a category F2 (max. wind speeds 113-157 mph) tornado 2.6 miles away from the city center caused between $5000 and $50,000 in damages.
Earthquake activity:
Somersworth-area historical earthquake activity is significantly above New Hampshire state average. It is 73% smaller than the overall U.S. average. On 10/16/2012 at 23:12:25, a magnitude 4.7 (4.7 ML, Depth: 10.0 mi, Class: Light, Intensity: IV - V) earthquake occurred 26.2 miles away from Somersworth center On 4/20/2002 at 10:50:47, a magnitude 5.3 (5.3 ML, Depth: 3.0 mi, Class: Moderate, Intensity: VI - VII) earthquake occurred 165.4 miles away from Somersworth center On 1/19/1982 at 00:14:42, a magnitude 4.7 (4.5 MB, 4.7 MD, 4.5 LG) earthquake occurred 40.2 miles away from Somersworth center On 10/7/1983 at 10:18:46, a magnitude 5.3 (5.1 MB, 5.3 LG, 5.1 ML) earthquake occurred 180.2 miles away from the city center On 4/20/2002 at 10:50:47, a magnitude 5.2 (5.2 MB, 4.2 MS, 5.2 MW, 5.0 MW) earthquake occurred 165.4 miles away from the city center On 8/21/1996 at 07:54:14, a magnitude 3.8 (3.8 LG, 3.6 LG, Depth: 6.2 mi, Class: Light, Intensity: II - III) earthquake occurred 68.6 miles away from the city center Magnitude types: regional Lg-wave magnitude (LG), body-wave magnitude (MB), duration magnitude (MD), local magnitude (ML), surface-wave magnitude (MS), moment magnitude (MW) Natural disasters: The number of natural disasters in Strafford County (23) is greater than the US average (15).Major Disasters (Presidential) Declared: 14Emergencies Declared: 8Storms: 8, Floods: 6, Winter Storms: 6, Snowstorms: 5, Hurricanes: 3, Blizzard: 1, Ice Storm: 1, Snow: 1, Snowfall: 1, Tornado: 1, Tropical Storm: 1, Wind: 1, Other: 1 (Note: some incidents may be assigned to more than one category). Hospitals and medical centers in Somersworth: TRI-AREA VNA - HOSPICE (301 HIGH ST) Other hospitals and medical centers near Somersworth: WENTWORTH HOME CARE AND HOSPICE, AN AMEDISYS PARTNER (Home Health Center, about 2 miles away; DOVER, NH)
WENTWORTH-DOUGLASS HOSPITAL (about 3 miles away; DOVER, NH)
KINDRED TRANSITIONAL CARE AND REHABILITATION-DOVER (Nursing Home, about 3 miles away; DOVER, NH)
HOMEMAKERS HEALTH SERVICES (THE) (Home Health Center, about 4 miles away; ROCHESTER, NH)
RIVERSIDE REST HOME (Nursing Home, about 4 miles away; DOVER, NH)
COLONIAL HILL OF ROCHESTER CARE AND REHABILITATION (Nursing Home, about 5 miles away; ROCHESTER, NH)
ROCHESTER MANOR (Nursing Home, about 6 miles away; ROCHESTER, NH)
Amtrak stations near Somersworth: 4 miles: DOVER (33 CHESTNUT ST.) Services: ticket office, enclosed waiting area.
9 miles: DURHAM (3 DEPOT RD.) Services: ticket office.
15 miles: WELLS (696 SANFORD ST.) Services: ticket office, enclosed waiting area.
College/University in Somersworth: Empire Beauty School-Somersworth Full-time enrollment: 126; Location: 362 Rte 108; Private, for-profit; Website: www.empirebeautyschools.com)
Colleges/universities with over 2000 students nearest to Somersworth:
University of New Hampshire-Main Campus (about 9 miles; Durham, NH ; Full-time enrollment: 15,243)
University of New England (about 29 miles; Biddeford, ME ; FT enrollment: 4,539)
Southern New Hampshire University (about 33 miles; Manchester, NH ; FT enrollment: 16,552)
Northern Essex Community College (about 33 miles; Haverhill, MA ; FT enrollment: 4,737)
NHTI-Concord's Community College (about 34 miles; Concord, NH ; FT enrollment: 2,865)
Mount Washington College (about 36 miles; Manchester, NH ; FT enrollment: 2,187)
Saint Anselm College (about 37 miles; Manchester, NH ; FT enrollment: 2,059)
Public high school in Somersworth:
Private high school in Somersworth:
Public elementary/middle schools in Somersworth:
See full list of schools located in Somersworth Library in Somersworth: SOMERSWORTH PUBLIC LIBRARY Operating income: $316,822; Location: 25 MAIN STREET; 49,832 books ; 2,667 audio materials ; 3,111 video materials ; 22 state licensed databases ; 72 print serial subscriptions ; 2 electronic serial subscriptions )
Notable locations in Somersworth: (A) , Sunningdale Country Club (B) , Somersworth City Hall (C) , Somersworth Public Library (D) , The Works Athletic Club (E) , Somersworth Fire Department (F) , Greater Somersworth Chamber of Commerce (G) . Display/hide their locations on the map
Shopping Centers: (1) , Tri-City Shopping Center (2) , Washington Street Shopping Center (3) . Display/hide their locations on the map
Churches in Somersworth include: (A) , Faith Church (B) , Tri City Church (C) , Somersworth Pentecostal Church (D) . Display/hide their locations on the map
Cemeteries: (1) , Hussy Cemetery (2) , Forest Glade Cemetery (3) , Holy Trinity Cemetery (4) . Display/hide their locations on the map
Lakes and reservoirs: (A) , Willand Pond (B) , Salmon Falls River Reservoir (C) . Display/hide their locations on the map
Streams, rivers, and creeks: (A) , Peters Marsh Brook (B) . Display/hide their locations on the map
Parks in Somersworth include: (1) , Hilltop Fun Center (2) , Forest Glade Park (3) , Noble Pines Park (4) . Display/hide their locations on the map
Birthplace of: John Sullivan - Revolutionary War general, Edward H. Rollins - Politician, John Wentworth Jr..
Strafford County has a predicted average indoor radon screening level between 2 and 4 pCi/L (pico curies per liter) - Moderate Potential Drinking water stations with addresses in Somersworth and their reported violations in the past:
MACS CAMPING AREA LLC (Serves ME, Population served: 75, Groundwater):
Past health violations:
MCL, Acute (TCR) - In JUN-2005, Contaminant: Coliform. Follow-up actions: St Compliance Meeting conducted (JUN-24-2005), St Public Notif requested (JUN-24-2005), St Violation/Reminder Notice (JUN-24-2005), St Tech Assistance Visit (JUN-24-2005), St Boil Water Order (JUN-24-2005), St Public Notif received (2 times from JUL-12-2005 to JUL-12-2005), St Compliance achieved (JUL-22-2010)
Past monitoring violations:
One routine major monitoring violation
Average household size: This city:
2.4 peopleNew Hampshire:
2.5 people
Percentage of family households: This city:
62.6%Whole state:
66.3%
Percentage of households with unmarried partners: This city:
11.3%Whole state:
8.3%
Likely homosexual households (counted as self-reported same-sex unmarried-partner households)
Lesbian couples: 0.5% of all households Gay men: 0.5% of all households
11 people in group homes for juveniles (non-correctional) in 2010People in group quarters in Somersworth in 2000:
18 people in homes for abused, dependent, and neglected children
8 people in homes for the mentally retarded
7 people in other noninstitutional group quarters
Banks with branches in Somersworth (2011 data):
RBS Citizens, National Association: Tri-City Plaza Drive-Up Branch, Somersworth Branch, Somersworth-Walmart Branch. Info updated 2007/09/19: Bank assets: $106,940.6 mil, Deposits: $75,690.2 mil, headquarters in Providence, RI, positive income , 1135 total offices , Holding Company: Uk Financial Investments Limited
Profile Bank, FSB: Route 108 Branch at 154 Route 108, branch established on 2008/09/09. Info updated 2011/07/21: Bank assets: $165.2 mil, Deposits: $141.6 mil, headquarters in Rochester, NH, positive income , Mortgage Lending Specialization, 4 total offices
Bank of America, National Association: Somersworth Branch at One John Parsons Drive, branch established on 1865/01/01. Info updated 2009/11/18: Bank assets: $1,451,969.3 mil, Deposits: $1,077,176.8 mil, headquarters in Charlotte, NC, positive income , 5782 total offices , Holding Company: Bank Of America Corporation
For population 15 years and over in Somersworth:
Never married: 36.8%Now married: 41.5%Separated: 0.3%Widowed: 4.2%Divorced: 17.1% For population 25 years and over in Somersworth:
High school or higher: 94.6%Bachelor's degree or higher: 27.8%Graduate or professional degree: 8.3%Unemployed: 3.9%Mean travel time to work (commute): 23.7 minutes
Education Gini index (Inequality in education) Here:
8.8New Hampshire average:
10.3
Religion statistics for Somersworth, NH (based on Strafford County data)
Religion Adherents Congregations Catholic 22,112 11 Mainline Protestant 5,299 21 Evangelical Protestant 4,143 37 Other 1,504 13 Orthodox 575 2 None 89,510 -
Source: Clifford Grammich, Kirk Hadaway, Richard Houseal, Dale E.Jones, Alexei Krindatch, Richie Stanley and Richard H.Taylor. 2012. 2010 U.S.Religion Census: Religious Congregations & Membership Study. Association of Statisticians of American Religious Bodies. Jones, Dale E., et al. 2002. Congregations and Membership in the United States 2000. Nashville, TN: Glenmary Research Center. Graphs represent county-level data
Food Environment Statistics: Number of grocery stores : 21This county :
1.73 / 10,000 pop.New Hampshire :
2.14 / 10,000 pop.
Number of supercenters and club stores : 1Here :
0.08 / 10,000 pop.State :
0.15 / 10,000 pop.
Number of convenience stores (no gas) : 30This county :
2.48 / 10,000 pop.State :
1.78 / 10,000 pop.
Number of convenience stores (with gas) : 46Strafford County :
3.80 / 10,000 pop.New Hampshire :
4.02 / 10,000 pop.
Number of full-service restaurants : 99This county :
8.17 / 10,000 pop.New Hampshire :
9.70 / 10,000 pop.
Adult diabetes rate : This county :
8.8%New Hampshire :
7.6%
Adult obesity rate : Strafford County :
26.2%State :
24.4%
Low-income preschool obesity rate : This county :
14.0%New Hampshire :
15.9%
Health and Nutrition: Healthy diet rate : This city:
54.2%State:
51.2%
Average overall health of teeth and gums : Somersworth:
54.1%New Hampshire:
49.1%
Average BMI : Somersworth:
28.2New Hampshire:
28.5
People feeling badly about themselves : Somersworth:
19.6%New Hampshire:
20.9%
People not drinking alcohol at all : Somersworth:
8.4%State:
9.3%
Average hours sleeping at night : Somersworth:
7.0New Hampshire:
6.9
Overweight people : Somersworth:
32.8%State:
34.3%
General health condition : This city:
62.1%New Hampshire:
58.1%
Average condition of hearing : Somersworth:
81.0%New Hampshire:
79.1%
More about Health and Nutrition of Somersworth, NH Residents
Local government employment and payroll (March 2022)
Function
Full-time employees
Monthly full-time payroll
Average yearly full-time wage
Part-time employees
Monthly part-time payroll
Elementary and Secondary - Instruction
231 $989,024 $51,378 30 $38,550 Elementary and Secondary - Other Total
30 $122,922 $49,169 5 $9,030 Police Protection - Officers
25 $181,735 $87,233 0 $0 Firefighters
17 $105,298 $74,328 0 $0 Streets and Highways
16 $80,914 $60,686 0 $0 Financial Administration
7 $37,798 $64,797 0 $0 Other Government Administration
7 $44,321 $75,979 19 $1,755 Water Supply
7 $31,647 $54,252 0 $0 Sewerage
6 $30,513 $61,026 0 $0 Police - Other
6 $26,421 $52,842 2 $2,724 Other and Unallocable
3 $11,625 $46,500 4 $5,390 Local Libraries
2 $10,314 $61,884 4 $5,363 Housing and Community Development (Local)
1 $4,871 $58,452 0 $0 Parks and Recreation
1 $4,849 $58,188 1 $1,453 Welfare
1 $4,721 $56,652 0 $0 Fire - Other
0 $0 1 $3,623
Totals for Government
360 $1,686,975 $56,233 66 $67,885
Somersworth government finances - Expenditure in 2021 (per resident):
Construction - Regular Highways: $3,800,000 ($312.53)
Elementary and Secondary Education: $1,614,000 ($132.74)Current Operations - Elementary and Secondary Education: $27,171,000 ($2234.64)
Police Protection: $4,180,000 ($343.78)Water Utilities: $2,388,000 ($196.40)Sewerage: $2,337,000 ($192.20)Regular Highways: $2,308,000 ($189.82)Local Fire Protection: $2,214,000 ($182.09)Central Staff Services: $984,000 ($80.93)Financial Administration: $808,000 ($66.45)Solid Waste Management: $777,000 ($63.90)Libraries: $255,000 ($20.97)Protective Inspection and Regulation - Other: $204,000 ($16.78)General - Other: $203,000 ($16.70)General Public Buildings: $154,000 ($12.67)Public Welfare, Vendor Payments for Other Purposes: $130,000 ($10.69)Parks and Recreation: $129,000 ($10.61)General - Interest on Debt: $847,000 ($69.66)
Intergovernmental to Local - Other - Regular Highways: $190,000 ($15.63)
Other - Water Utilities: $116,000 ($9.54)Other - Sewerage: $116,000 ($9.54)Other - Elementary and Secondary Education: $40,000 ($3.29)Other Capital Outlay - Elementary and Secondary Education: $433,000 ($35.61)
Regular Highways: $266,000 ($21.88)Parks and Recreation: $243,000 ($19.99)Police Protection: $23,000 ($1.89)Financial Administration: $3,000 ($0.25)Total Salaries and Wages: $12,255,000 ($1007.90)
Water Utilities - Interest on Debt: $115,000 ($9.46)
Somersworth government finances - Revenue in 2021 (per resident):
Charges - Sewerage: $3,149,000 ($258.99)
Solid Waste Management: $601,000 ($49.43)Other: $103,000 ($8.47)Parks and Recreation: $15,000 ($1.23)Elementary and Secondary Education School Lunch: $2,000 ($0.16)Federal Intergovernmental - Other: $270,000 ($22.21)
Education: $1,000 ($0.08)Miscellaneous - General Revenue - Other: $366,000 ($30.10)
Rents: $140,000 ($11.51)Interest Earnings: $107,000 ($8.80)Sale of Property: $63,000 ($5.18)Fines and Forfeits: $6,000 ($0.49)Revenue - Water Utilities: $3,046,000 ($250.51)
State Intergovernmental - Education: $15,580,000 ($1281.36)
General Local Government Support: $862,000 ($70.89)Highways: $224,000 ($18.42)Tax - Property: $32,569,000 ($2678.59)
Other License: $294,000 ($24.18)Occupation and Business License - Other: $43,000 ($3.54)
Somersworth government finances - Debt in 2021 (per resident):
Long Term Debt - Outstanding Unspecified Public Purpose: $11,981,000 ($985.36)
Beginning Outstanding - Unspecified Public Purpose: $9,691,000 ($797.02)Issue, Unspecified Public Purpose: $3,800,000 ($312.53)Retired Unspecified Public Purpose: $1,510,000 ($124.19)Short Term Debt Outstanding - End of Fiscal Year: $1,000,000 ($82.24)
Somersworth government finances - Cash and Securities in 2021 (per resident):
Other Funds - Cash and Securities: $36,722,000 ($3020.15)
Businesses in Somersworth, NH
Name Count Name Count
AT&T 1 MasterBrand Cabinets 2 Advance Auto Parts 1 Nissan 1 AutoZone 1 Payless 1 Burger King 1 Penske 1 CVS 1 RadioShack 1 Chevrolet 1 Rite Aid 1 Circle K 1 Starbucks 1 Dressbarn 1 Subaru 1 Dunkin Donuts 2 Subway 1 Fashion Bug 1 T-Mobile 2 FedEx 1 T.J.Maxx 1 GNC 2 Taco Bell 1 GameStop 1 Target 1 H&R Block 1 U-Haul 2 Home Depot 1 UPS 1 Hyundai 1 Walmart 1 KFC 1
Strongest AM radio stations in Somersworth:
WGIN (930 AM; 10 kW; ROCHESTER, NH; Owner: CAPSTAR TX LIMITED PARTNERSHIP)
WTSN (1270 AM; 5 kW; DOVER, NH; Owner: GARRISON CITY BROADCASTING, INC.)
WRKO (680 AM; 50 kW; BOSTON, MA; Owner: ENTERCOM BOSTON LICENSE, LLC)
WEEI (850 AM; 50 kW; BOSTON, MA; Owner: ENTERCOM BOSTON LICENSE, LLC)
WBZ (1030 AM; 50 kW; BOSTON, MA; Owner: INFINITY BROADCASTING OPERATIONS, INC.)
WGIP (1540 AM; 5 kW; EXETER, NH; Owner: CAPSTAR TX LIMITED PARTNERSHIP)
WMTW (870 AM; 10 kW; GORHAM, ME; Owner: RADIO PARTNERS OF MAINE, L.P.)
WWZN (1510 AM; 50 kW; BOSTON, MA; Owner: ROSE CITY RADIO CORPORATION)
WKOX (1200 AM; 50 kW; FRAMINGHAM, MA; Owner: CAPSTAR TX LIMITED PARTNERSHIP)
WCRN (830 AM; 50 kW; WORCESTER, MA; Owner: CARTER BROADCASTING CORPORATION)
WBIX (1060 AM; 40 kW; NATICK, MA; Owner: LANGER BROADCASTING CORPORATION)
WDER (1320 AM; 10 kW; DERRY, NH; Owner: BLOUNT COMMUNICATIONS, INC. OF NH)
WGIR (610 AM; 5 kW; MANCHESTER, NH; Owner: CAPSTAR TX LIMITED PARTNERSHIP)
Strongest FM radio stations in Somersworth:
WBYY (98.7 FM; SOMERSWORTH, NH; Owner: GARRISON CITY BROADCASTING, INC.)
WOKQ (97.5 FM; DOVER, NH; Owner: CITADEL BROADCASTING COMPANY)
WQSO (96.7 FM; ROCHESTER, NH; Owner: CAPSTAR TX LIMITED PARTNERSHIP)
WUBB (95.3 FM; YORK CENTER, ME; Owner: CAPSTAR TX LIMITED PARTNERSHIP)
WSHK (105.3 FM; KITTERY, ME; Owner: CITADEL BROADCASTING COMPANY)
WPHX-FM (92.1 FM; SANFORD, ME; Owner: FNX BROADCASTING LLC)
WSEW (88.5 FM; SANFORD, ME; Owner: WORD RADIO EDUCATIONAL FOUNDATION)
WUNH (91.3 FM; DURHAM, NH; Owner: UNIVERSITY OF NEW HAMPSHIRE)
WMEX (106.5 FM; FARMINGTON, NH; Owner: WIMMEX, LLC)
WSCY (106.9 FM; MOULTONBOROUGH, NH; Owner: NORTHEAST COMMUNICATIONS CORPORATION)
WMEA (90.1 FM; PORTLAND, ME; Owner: MAINE PUBLIC BROADCASTING CORPORATION)
WPKQ (103.7 FM; NORTH CONWAY, NH; Owner: CITADEL BROADCASTING COMPANY)
WHEB (100.3 FM; PORTSMOUTH, NH; Owner: CAPSTAR TX LIMITED PARTNERSHIP)
WHOM (94.9 FM; MT. WASHINGTON, NH; Owner: CITADEL BROADCASTING COMPANY)
WLKZ (104.9 FM; WOLFEBORO, NH; Owner: TELE-MEDIA COMPANY OF NEW HAMPSHIRE, L.L.C.)
WERZ (107.1 FM; EXETER, NH; Owner: CAPSTAR TX LIMITED PARTNERSHIP)
WNHI (93.3 FM; BELMONT, NH; Owner: CONCORD BROADCASTING, L.L.C.)
WVFM (105.7 FM; CAMPTON, NH; Owner: DEVON BROADCASTING COMPANY, INC.)
WBLM (102.9 FM; PORTLAND, ME; Owner: CITADEL BROADCASTING COMPANY)
W282AB (104.3 FM; DOVER, NH; Owner: NEW HAMPSHIRE PUBLIC RADIO, INC.)
TV broadcast stations around Somersworth:
WMEA-TV (Channel 26; BIDDEFORD, ME; Owner: MAINE PUBLIC BROADCASTING CORP.)
WENH-TV (Channel 11; DURHAM, NH; Owner: UNIVERSITY OF NEW HAMPSHIRE)
WHDN-LP (Channel 26; BOSTON, MA; Owner: GUENTER MARKSTEINER)
WMTW-TV (Channel 8; POLAND SPRING, ME; Owner: WMTW BROADCAST GROUP, LLC)
WCSH (Channel 6; PORTLAND, ME; Owner: PACIFIC AND SOUTHERN COMPANY, INC.)
WGME-TV (Channel 13; PORTLAND, ME; Owner: WGME LICENSEE, LLC)
WFXZ-CA (Channel 24; BOSTON, MA; Owner: BOSTON BROADCASTING CORP.)
WPXG (Channel 21; CONCORD, NH; Owner: PAXSON BOSTON-68 LICENSE, INC.)
National Bridge Inventory (NBI) Statistics 3 Number of bridges36ft / 10.7m Total length $9,426,000 Total costs15,984 Total average daily traffic798 Total average daily truck traffic23,654 Total future (year 2042) average daily traffic
FCC Registered Antenna Towers: 10 (
See the full list of FCC Registered Antenna Towers in Somersworth )
FCC Registered Broadcast Land Mobile Towers: 6
Somersworth Police Dept 5 Main St (Lat: 43.259806 Lon: -70.867000), Call Sign: KQL828, Assigned Frequencies: 155.475 MHz, 156.090 MHz, Grant Date: 04/27/2022, Expiration Date: 07/01/2032, Registrant: Nh Dept. Of Safety/Emergency Services And Communications, 33 Hazen Dr (Mailing), Concord, NH 03305, Phone: (603) 528-7541, Fax: (603) 271-6629, Email:
5 Main St (Lat: 43.263417 Lon: -70.861444), Call Sign: KTG678, Licensee ID: L00053284, Assigned Frequencies: 154.725 MHz, Grant Date: 10/24/2001, Expiration Date: 11/17/2011, Cancellation Date: 03/03/2011, Registrant: County Of Strafford, 5 Main St, Somersworth, NH 03878, Phone: (603) 692-3131 Lat: 43.236556 Lon: -70.882556, Call Sign: WQFD967, Assigned Frequencies: 467.762 MHz, 467.837 MHz, 467.850 MHz, 467.875 MHz, 467.900 MHz, Grant Date: 03/30/2016, Expiration Date: 06/23/2026, Certifier: Michael Celeste, Registrant: Home Depot Inc, 2455 Paces Ferry Rd, Atlanta, GA 30339, Phone: (770) 433-8211, Fax: (770) 384-3935, Email:
Lat: 43.256611 Lon: -70.906472, Call Sign: WQFT479, Assigned Frequencies: 72.3000 MHz, Grant Date: 07/07/2016, Expiration Date: 09/28/2026, Certifier: George Vierra, Registrant: Business Radio Licensing, 30251 Golden Lantern, Suite E #501, Laguna Niguel, CA 92677, Phone: (949) 348-8510, Fax: (949) 348-8514, Email:
SOMERSWORTH, NH, Lat: 43.260000 Lon: -70.862222, Call Sign: WQXW849, Assigned Frequencies: 456.537 MHz, 456.562 MHz, 456.612 MHz, 456.637 MHz, 457.412 MHz, 457.637 MHz, 457.687 MHz, 457.887 MHz, 467.462 MHz, Grant Date: 06/30/2016, Expiration Date: 06/30/2026, Certifier: Brian Mcnamara, Registrant: Aclara Technologies LLC, 30400 Solon Road, Solon, OH 44139, Phone: (440) 528-7260, Email:
SOMERSWORTH, NH, Lat: 43.260000 Lon: -70.862222, Call Sign: WRDB732, Assigned Frequencies: 456.237 MHz, 456.387 MHz, 456.412 MHz, 456.462 MHz, 457.112 MHz, 457.762 MHz, 457.862 MHz, 467.512 MHz, Grant Date: 03/21/2019, Expiration Date: 03/21/2029, Certifier: Brian Mcnamara, Registrant: Aclara Technologies LLC, 30400 Solon Road, Solon, OH 44139, Phone: (440) 528-7260, Email:
FCC Registered Amateur Radio Licenses: 63 (
See the full list of FCC Registered Amateur Radio Licenses in Somersworth )
FAA Registered Aircraft: 10 (
See the full list of FAA Registered Aircraft in Somersworth )
Home Mortgage Disclosure Act Aggregated Statistics For Year 2009(Based on 2 full tracts) A) FHA, FSA/RHS & VA B) Conventional C) Refinancings D) Home Improvement Loans E) Loans on Dwellings For 5+ Families F) Non-occupant Loans on G) Loans On Manufactured Number Average Value Number Average Value Number Average Value Number Average Value Number Average Value Number Average Value Number Average Value
LOANS ORIGINATED 67 $194,821 45 $143,489 200 $163,630 24 $68,083 4 $626,250 19 $120,947 11 $36,182 APPLICATIONS APPROVED, NOT ACCEPTED 5 $212,200 7 $158,429 14 $173,000 4 $9,750 0 $0 2 $142,500 1 $20,000 APPLICATIONS DENIED 11 $165,545 19 $79,368 107 $179,738 17 $24,235 0 $0 8 $99,000 26 $37,500 APPLICATIONS WITHDRAWN 3 $165,333 11 $111,545 57 $189,140 1 $10,000 0 $0 7 $142,429 3 $38,667 FILES CLOSED FOR INCOMPLETENESS 0 $0 0 $0 18 $193,222 0 $0 0 $0 0 $0 0 $0
Aggregated Statistics For Year 2008(Based on 2 full tracts) A) FHA, FSA/RHS & VA B) Conventional C) Refinancings D) Home Improvement Loans E) Loans on Dwellings For 5+ Families F) Non-occupant Loans on G) Loans On Manufactured Number Average Value Number Average Value Number Average Value Number Average Value Number Average Value Number Average Value Number Average Value
LOANS ORIGINATED 39 $214,718 67 $161,806 130 $174,877 29 $58,379 3 $136,667 28 $137,393 10 $37,600 APPLICATIONS APPROVED, NOT ACCEPTED 2 $260,000 6 $190,000 27 $192,111 3 $55,667 0 $0 3 $197,333 2 $41,000 APPLICATIONS DENIED 8 $193,500 26 $76,923 104 $188,981 22 $59,727 0 $0 13 $144,615 21 $26,952 APPLICATIONS WITHDRAWN 4 $190,750 9 $175,000 44 $196,636 3 $185,000 0 $0 3 $145,333 4 $60,500 FILES CLOSED FOR INCOMPLETENESS 3 $239,333 2 $102,500 6 $156,667 2 $35,000 1 $495,000 0 $0 1 $45,000
Aggregated Statistics For Year 2007(Based on 2 full tracts) A) FHA, FSA/RHS & VA B) Conventional C) Refinancings D) Home Improvement Loans E) Loans on Dwellings For 5+ Families F) Non-occupant Loans on G) Loans On Manufactured Number Average Value Number Average Value Number Average Value Number Average Value Number Average Value Number Average Value Number Average Value
LOANS ORIGINATED 7 $235,714 138 $161,087 179 $163,637 89 $63,034 2 $298,500 25 $156,200 19 $47,684 APPLICATIONS APPROVED, NOT ACCEPTED 0 $0 23 $137,217 37 $164,000 5 $101,400 0 $0 5 $152,600 2 $66,000 APPLICATIONS DENIED 3 $298,333 21 $96,238 139 $183,331 35 $68,029 0 $0 8 $170,750 16 $49,125 APPLICATIONS WITHDRAWN 0 $0 11 $110,182 68 $183,794 8 $93,750 1 $350,000 7 $171,571 8 $58,250 FILES CLOSED FOR INCOMPLETENESS 0 $0 5 $128,400 19 $228,474 4 $88,000 0 $0 2 $143,500 2 $45,500
Aggregated Statistics For Year 2006(Based on 2 full tracts) A) FHA, FSA/RHS & VA B) Conventional C) Refinancings D) Home Improvement Loans E) Loans on Dwellings For 5+ Families F) Non-occupant Loans on G) Loans On Manufactured Number Average Value Number Average Value Number Average Value Number Average Value Number Average Value Number Average Value Number Average Value
LOANS ORIGINATED 9 $226,556 267 $146,172 243 $151,379 102 $55,863 3 $1,128,333 46 $155,065 23 $48,000 APPLICATIONS APPROVED, NOT ACCEPTED 0 $0 14 $118,857 35 $183,771 9 $51,778 0 $0 4 $184,500 2 $54,500 APPLICATIONS DENIED 1 $344,000 52 $113,981 103 $167,350 37 $41,324 0 $0 15 $132,533 21 $34,762 APPLICATIONS WITHDRAWN 1 $260,000 25 $140,840 85 $190,447 11 $55,273 0 $0 4 $124,500 7 $70,714 FILES CLOSED FOR INCOMPLETENESS 0 $0 7 $103,286 34 $199,235 0 $0 0 $0 1 $199,000 3 $54,333
Aggregated Statistics For Year 2005(Based on 2 full tracts) A) FHA, FSA/RHS & VA B) Conventional C) Refinancings D) Home Improvement Loans E) Loans on Dwellings For 5+ Families F) Non-occupant Loans on G) Loans On Manufactured Number Average Value Number Average Value Number Average Value Number Average Value Number Average Value Number Average Value Number Average Value
LOANS ORIGINATED 11 $220,545 276 $149,764 320 $147,984 64 $64,266 6 $594,000 54 $155,593 22 $49,500 APPLICATIONS APPROVED, NOT ACCEPTED 1 $240,000 40 $128,725 42 $149,500 8 $76,500 0 $0 6 $130,667 10 $47,500 APPLICATIONS DENIED 0 $0 69 $91,043 106 $152,604 35 $84,943 0 $0 7 $107,286 40 $41,475 APPLICATIONS WITHDRAWN 1 $271,000 59 $138,898 131 $153,176 11 $125,455 1 $14,000 11 $225,818 13 $56,154 FILES CLOSED FOR INCOMPLETENESS 0 $0 14 $135,286 40 $179,200 2 $90,000 0 $0 1 $155,000 1 $67,000
Aggregated Statistics For Year 2004(Based on 2 full tracts) A) FHA, FSA/RHS & VA B) Conventional C) Refinancings D) Home Improvement Loans E) Loans on Dwellings For 5+ Families F) Non-occupant Loans on G) Loans On Manufactured Number Average Value Number Average Value Number Average Value Number Average Value Number Average Value Number Average Value Number Average Value
LOANS ORIGINATED 11 $188,909 203 $146,729 340 $136,318 75 $53,853 5 $251,000 50 $159,240 30 $45,300 APPLICATIONS APPROVED, NOT ACCEPTED 0 $0 19 $169,211 49 $149,755 9 $48,222 1 $315,000 1 $171,000 2 $73,500 APPLICATIONS DENIED 4 $185,750 85 $101,388 144 $135,819 44 $35,773 0 $0 16 $143,688 56 $44,804 APPLICATIONS WITHDRAWN 1 $160,000 32 $164,469 126 $141,643 10 $35,000 2 $461,500 8 $130,875 11 $46,909 FILES CLOSED FOR INCOMPLETENESS 1 $211,000 7 $191,143 36 $157,917 1 $33,000 0 $0 6 $173,667 0 $0
Aggregated Statistics For Year 2003(Based on 2 full tracts) A) FHA, FSA/RHS & VA B) Conventional C) Refinancings D) Home Improvement Loans E) Loans on Dwellings For 5+ Families F) Non-occupant Loans on Number Average Value Number Average Value Number Average Value Number Average Value Number Average Value Number Average Value
LOANS ORIGINATED 17 $170,118 164 $135,872 682 $120,965 60 $62,100 2 $167,500 83 $129,530 APPLICATIONS APPROVED, NOT ACCEPTED 4 $189,250 26 $100,192 88 $112,080 21 $64,429 0 $0 7 $96,143 APPLICATIONS DENIED 2 $193,500 97 $60,433 199 $132,910 37 $32,838 0 $0 12 $127,417 APPLICATIONS WITHDRAWN 5 $138,000 14 $96,786 106 $124,509 11 $47,273 0 $0 5 $171,800 FILES CLOSED FOR INCOMPLETENESS 1 $120,000 1 $123,000 17 $129,706 0 $0 0 $0 2 $113,500
Aggregated Statistics For Year 2002(Based on 1 full tract) A) FHA, FSA/RHS & VA B) Conventional C) Refinancings D) Home Improvement Loans F) Non-occupant Loans on Number Average Value Number Average Value Number Average Value Number Average Value Number Average Value
LOANS ORIGINATED 12 $165,917 75 $124,453 174 $110,770 23 $27,696 5 $75,000 APPLICATIONS APPROVED, NOT ACCEPTED 0 $0 12 $39,417 27 $114,889 5 $49,200 2 $156,000 APPLICATIONS DENIED 1 $152,000 63 $46,746 55 $99,036 17 $30,647 2 $132,000 APPLICATIONS WITHDRAWN 0 $0 15 $72,800 27 $126,519 1 $43,000 0 $0 FILES CLOSED FOR INCOMPLETENESS 0 $0 5 $102,600 11 $111,909 0 $0 1 $88,000
Aggregated Statistics For Year 2001(Based on 1 full tract) A) FHA, FSA/RHS & VA B) Conventional C) Refinancings D) Home Improvement Loans E) Loans on Dwellings For 5+ Families F) Non-occupant Loans on Number Average Value Number Average Value Number Average Value Number Average Value Number Average Value Number Average Value
LOANS ORIGINATED 13 $138,385 69 $89,203 117 $103,957 28 $22,321 3 $221,667 4 $73,000 APPLICATIONS APPROVED, NOT ACCEPTED 0 $0 13 $50,615 13 $111,769 4 $58,250 0 $0 2 $144,000 APPLICATIONS DENIED 1 $135,000 55 $43,327 42 $85,952 24 $18,042 0 $0 0 $0 APPLICATIONS WITHDRAWN 1 $124,000 5 $69,800 40 $100,650 4 $9,500 0 $0 0 $0 FILES CLOSED FOR INCOMPLETENESS 0 $0 3 $90,000 5 $58,200 0 $0 0 $0 1 $70,000
Aggregated Statistics For Year 2000(Based on 1 full tract) A) FHA, FSA/RHS & VA B) Conventional C) Refinancings D) Home Improvement Loans F) Non-occupant Loans on Number Average Value Number Average Value Number Average Value Number Average Value Number Average Value
LOANS ORIGINATED 15 $128,400 68 $73,618 37 $82,946 24 $18,208 2 $16,500 APPLICATIONS APPROVED, NOT ACCEPTED 0 $0 12 $64,583 10 $69,200 2 $12,500 0 $0 APPLICATIONS DENIED 1 $38,000 65 $32,523 31 $51,032 15 $15,667 1 $14,000 APPLICATIONS WITHDRAWN 1 $121,000 9 $45,889 16 $67,500 0 $0 1 $22,000 FILES CLOSED FOR INCOMPLETENESS 0 $0 2 $84,000 1 $25,000 0 $0 0 $0
Aggregated Statistics For Year 1999(Based on 2 full tracts) A) FHA, FSA/RHS & VA B) Conventional C) Refinancings D) Home Improvement Loans E) Loans on Dwellings For 5+ Families F) Non-occupant Loans on Number Average Value Number Average Value Number Average Value Number Average Value Number Average Value Number Average Value
LOANS ORIGINATED 57 $100,954 119 $80,453 136 $78,225 43 $23,650 1 $316,510 28 $83,768 APPLICATIONS APPROVED, NOT ACCEPTED 2 $104,820 18 $59,371 20 $67,584 11 $20,775 0 $0 4 $74,978 APPLICATIONS DENIED 2 $111,240 73 $40,731 80 $72,614 23 $12,677 0 $0 5 $81,884 APPLICATIONS WITHDRAWN 2 $73,510 11 $81,922 52 $70,557 3 $30,563 0 $0 5 $102,896 FILES CLOSED FOR INCOMPLETENESS 0 $0 2 $83,545 8 $77,066 1 $19,600 0 $0 1 $114,670
Detailed HMDA statistics for the following Tracts:
0830.01
, 0830.02
Private Mortgage Insurance Companies Aggregated Statistics For Year 2009(Based on 2 full tracts) A) Conventional B) Refinancings Number Average Value Number Average Value
LOANS ORIGINATED 3 $226,667 9 $215,556 APPLICATIONS APPROVED, NOT ACCEPTED 2 $212,500 0 $0 APPLICATIONS DENIED 0 $0 8 $200,375 APPLICATIONS WITHDRAWN 0 $0 1 $118,000 FILES CLOSED FOR INCOMPLETENESS 0 $0 0 $0
Aggregated Statistics For Year 2008(Based on 2 full tracts) A) Conventional B) Refinancings C) Non-occupant Loans on Number Average Value Number Average Value Number Average Value
LOANS ORIGINATED 25 $208,280 21 $240,000 1 $138,000 APPLICATIONS APPROVED, NOT ACCEPTED 3 $152,667 7 $250,857 1 $138,000 APPLICATIONS DENIED 2 $152,000 5 $235,000 0 $0 APPLICATIONS WITHDRAWN 0 $0 0 $0 0 $0 FILES CLOSED FOR INCOMPLETENESS 1 $148,000 1 $294,000 0 $0
Aggregated Statistics For Year 2007(Based on 2 full tracts) A) Conventional B) Refinancings Number Average Value Number Average Value
LOANS ORIGINATED 41 $227,268 23 $250,000 APPLICATIONS APPROVED, NOT ACCEPTED 4 $224,500 3 $292,667 APPLICATIONS DENIED 3 $272,667 0 $0 APPLICATIONS WITHDRAWN 2 $198,500 1 $257,000 FILES CLOSED FOR INCOMPLETENESS 0 $0 0 $0
Aggregated Statistics For Year 2006(Based on 2 full tracts) A) Conventional B) Refinancings C) Non-occupant Loans on D) Loans On Manufactured Number Average Value Number Average Value Number Average Value Number Average Value
LOANS ORIGINATED 20 $204,600 9 $252,222 2 $156,000 1 $48,000 APPLICATIONS APPROVED, NOT ACCEPTED 4 $214,250 2 $200,500 1 $171,000 0 $0 APPLICATIONS DENIED 2 $94,000 0 $0 0 $0 0 $0 APPLICATIONS WITHDRAWN 2 $188,500 1 $200,000 0 $0 0 $0 FILES CLOSED FOR INCOMPLETENESS 0 $0 0 $0 0 $0 0 $0
Aggregated Statistics For Year 2005(Based on 2 full tracts) A) Conventional B) Refinancings C) Non-occupant Loans on Number Average Value Number Average Value Number Average Value
LOANS ORIGINATED 34 $215,794 17 $209,706 2 $159,000 APPLICATIONS APPROVED, NOT ACCEPTED 7 $232,714 0 $0 2 $270,000 APPLICATIONS DENIED 0 $0 0 $0 0 $0 APPLICATIONS WITHDRAWN 1 $161,000 0 $0 0 $0 FILES CLOSED FOR INCOMPLETENESS 0 $0 0 $0 0 $0
Aggregated Statistics For Year 2004(Based on 2 full tracts) A) Conventional B) Refinancings C) Non-occupant Loans on Number Average Value Number Average Value Number Average Value
LOANS ORIGINATED 49 $202,347 18 $187,222 15 $197,800 APPLICATIONS APPROVED, NOT ACCEPTED 9 $178,667 8 $159,000 1 $166,000 APPLICATIONS DENIED 3 $159,000 0 $0 0 $0 APPLICATIONS WITHDRAWN 0 $0 2 $256,000 0 $0 FILES CLOSED FOR INCOMPLETENESS 0 $0 1 $135,000 0 $0
Aggregated Statistics For Year 2003(Based on 2 full tracts) A) Conventional B) Refinancings C) Non-occupant Loans on Number Average Value Number Average Value Number Average Value
LOANS ORIGINATED 53 $164,057 20 $172,350 9 $152,111 APPLICATIONS APPROVED, NOT ACCEPTED 8 $175,375 3 $153,333 2 $143,000 APPLICATIONS DENIED 4 $177,750 1 $162,000 1 $245,000 APPLICATIONS WITHDRAWN 2 $110,500 0 $0 0 $0 FILES CLOSED FOR INCOMPLETENESS 0 $0 1 $203,000 1 $203,000
Aggregated Statistics For Year 2002(Based on 1 full tract) A) Conventional B) Refinancings Number Average Value Number Average Value
LOANS ORIGINATED 27 $146,704 8 $157,625 APPLICATIONS APPROVED, NOT ACCEPTED 2 $191,000 2 $90,500 APPLICATIONS DENIED 0 $0 0 $0 APPLICATIONS WITHDRAWN 4 $176,500 0 $0 FILES CLOSED FOR INCOMPLETENESS 0 $0 0 $0
Aggregated Statistics For Year 2001(Based on 1 full tract) A) Conventional B) Refinancings C) Non-occupant Loans on Number Average Value Number Average Value Number Average Value
LOANS ORIGINATED 20 $136,300 4 $129,750 2 $100,000 APPLICATIONS APPROVED, NOT ACCEPTED 3 $158,667 2 $133,500 0 $0 APPLICATIONS DENIED 1 $143,000 0 $0 0 $0 APPLICATIONS WITHDRAWN 2 $137,000 0 $0 0 $0 FILES CLOSED FOR INCOMPLETENESS 0 $0 0 $0 0 $0
Aggregated Statistics For Year 2000(Based on 1 full tract) A) Conventional B) Refinancings Number Average Value Number Average Value
LOANS ORIGINATED 14 $104,429 5 $135,400 APPLICATIONS APPROVED, NOT ACCEPTED 5 $126,400 2 $87,000 APPLICATIONS DENIED 0 $0 0 $0 APPLICATIONS WITHDRAWN 1 $70,000 0 $0 FILES CLOSED FOR INCOMPLETENESS 0 $0 0 $0
Aggregated Statistics For Year 1999(Based on 2 full tracts) A) Conventional B) Refinancings C) Non-occupant Loans on Number Average Value Number Average Value Number Average Value
LOANS ORIGINATED 41 $107,892 12 $99,707 6 $112,377 APPLICATIONS APPROVED, NOT ACCEPTED 5 $69,330 5 $123,010 1 $90,170 APPLICATIONS DENIED 0 $0 1 $74,490 1 $74,490 APPLICATIONS WITHDRAWN 0 $0 1 $112,760 0 $0 FILES CLOSED FOR INCOMPLETENESS 0 $0 0 $0 0 $0
Detailed PMIC statistics for the following Tracts:
0830.01
, 0830.02 Somersworth compared to New Hampshire state average:
Unemployed percentage significantly below state average. Median age below state average. Length of stay since moving in significantly above state average. Somersworth on our top lists :
#24 on the list of "Top 101 cities with the most residents born in Indonesia (population 500+)"
#79 on the list of "Top 101 cities with the most residents born in Ghana (population 500+)"
#88 on the list of "Top 101 cities with the biggest property tax revenues per resident (population 10,000+)"
#91 on the list of "Top 101 cities with the largest percentage of unmarried partner households (population 5,000+)"
#91 on the list of "Top 101 cities with the lowest cost per building permit(population 5,000+)"
#78 on the list of "Top 101 counties with the lowest percentage of residents that keep firearms around their homes"
#82 on the list of "Top 101 counties with the highest average weight of females"
#85 on the list of "Top 101 counties with the lowest number of births per 1000 residents 2007-2013"
#91 on the list of "Top 101 counties with the highest percentage of residents that smoked 100+ cigarettes in their lives"
Top Patent Applicants
Chad M. Greenlaw (10)
David Clarke Pollock (6)
Abhishek D. Saxena (3)
Srinivas K. Guntur (3)
Ravi K. Tangirala (3)
Aaron Christian Sakash (3)
James Ducharme (3)
David J. Flanagan (2)
Jacob Thomas Shawley (2)
David John Gagnon (2)
Total of 50 patent applications in 2008-2024.

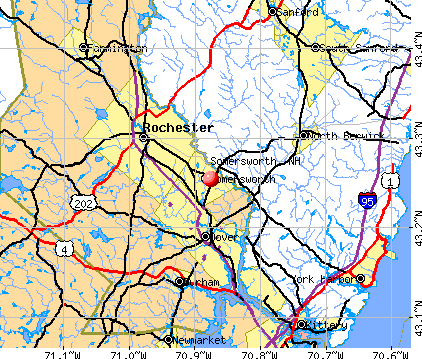


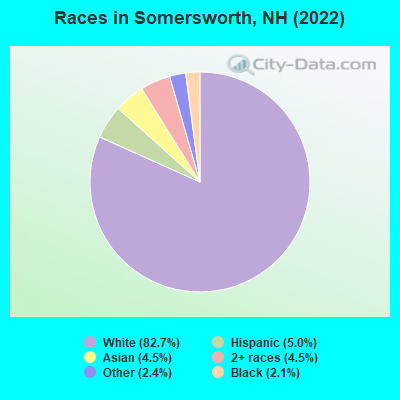
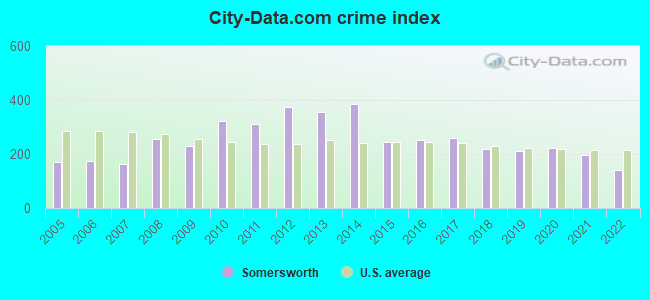
 Recent articles from our blog. Our writers, many of them Ph.D. graduates or candidates, create easy-to-read articles on a wide variety of topics.


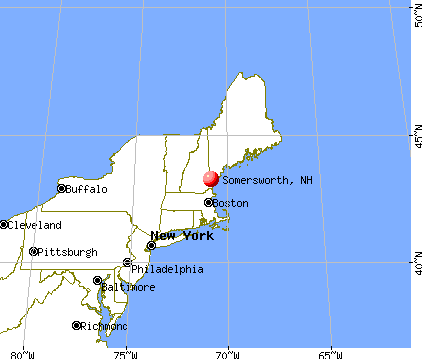
 (34.5 miles
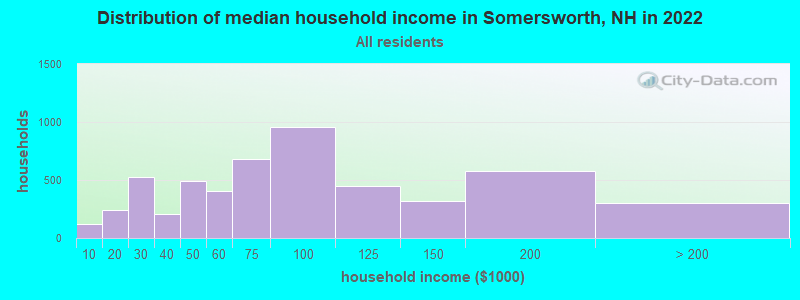
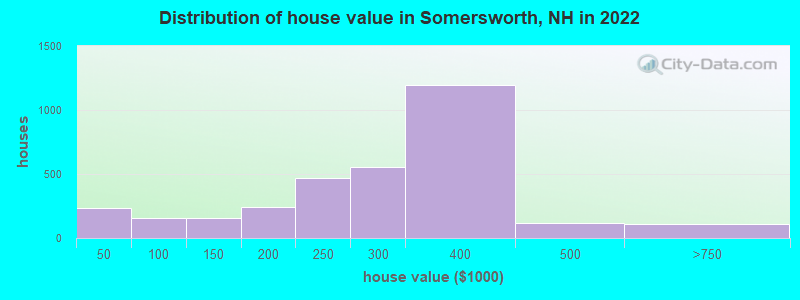

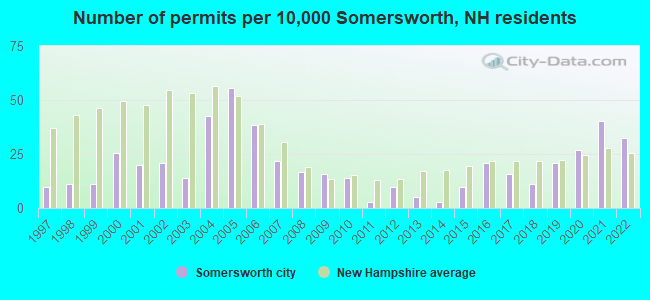
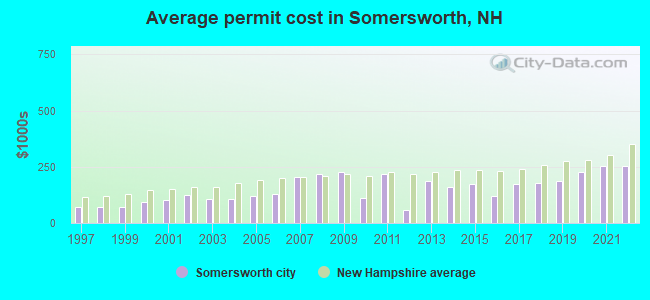
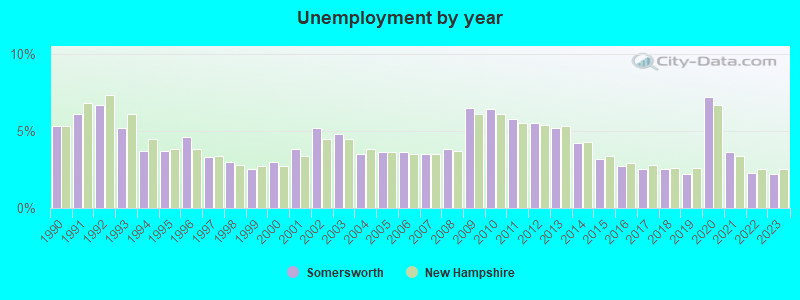
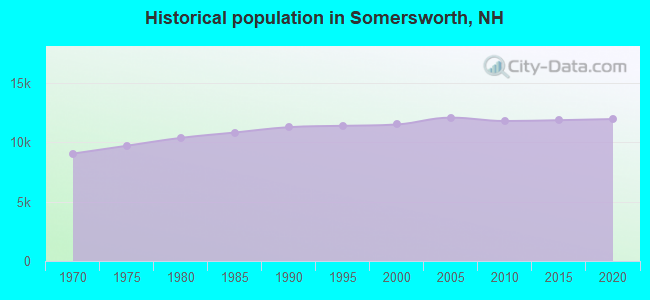
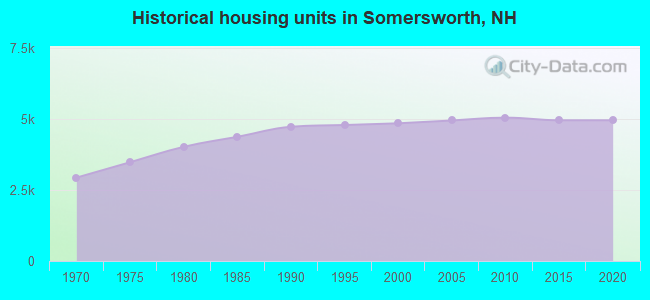
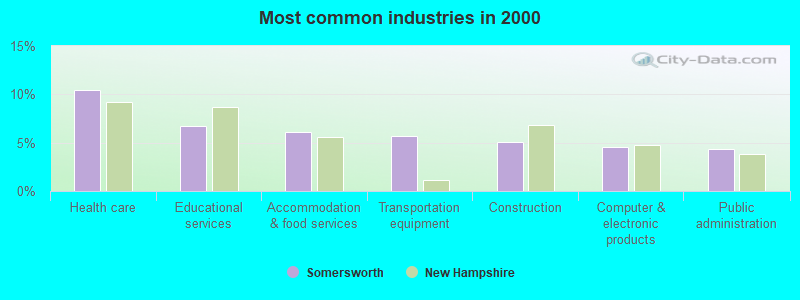
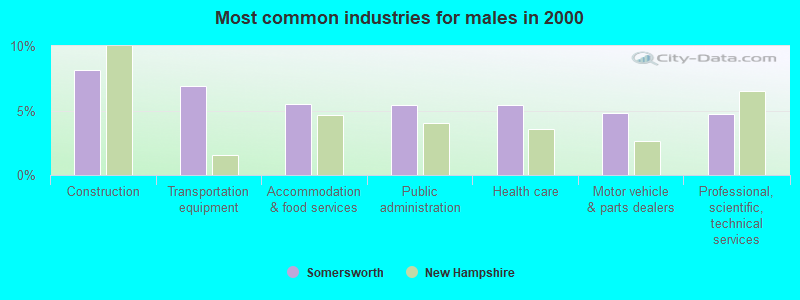
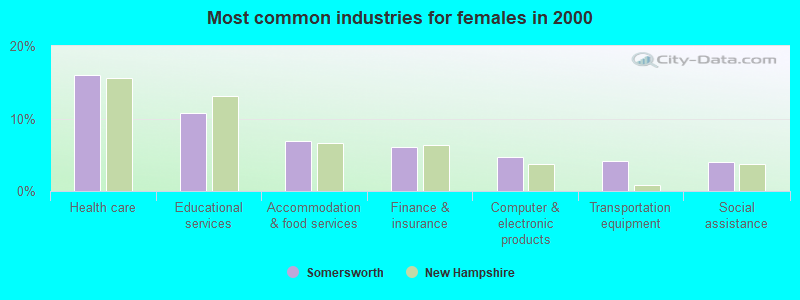
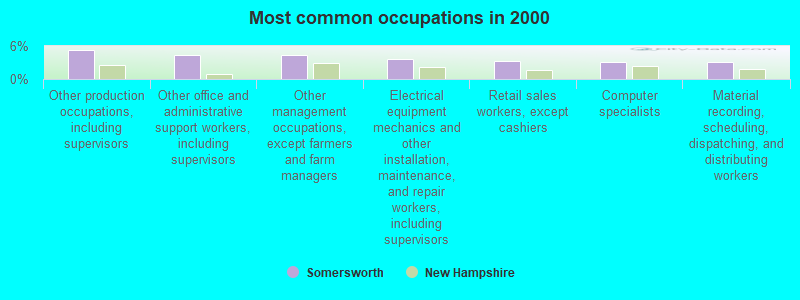
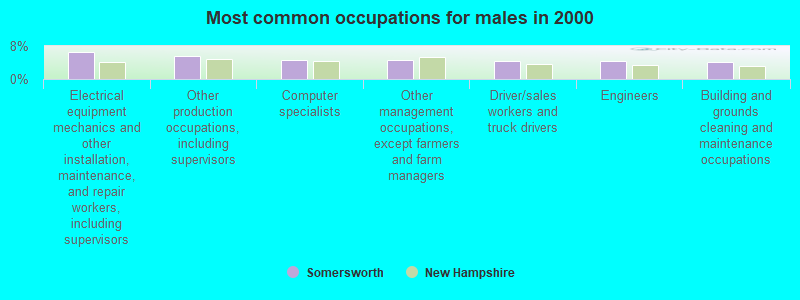
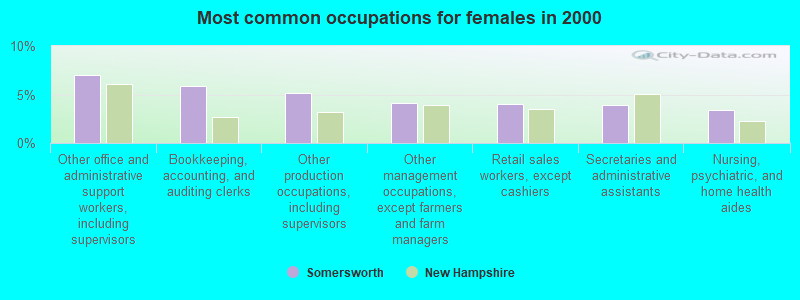
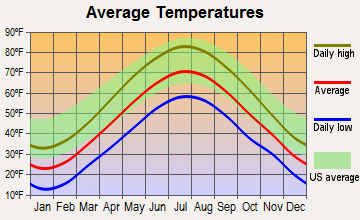
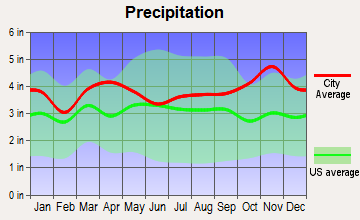
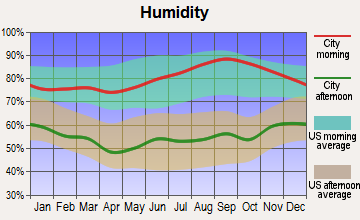
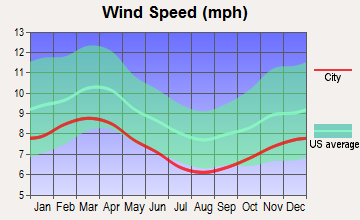
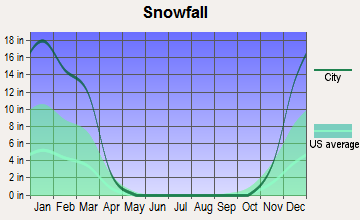
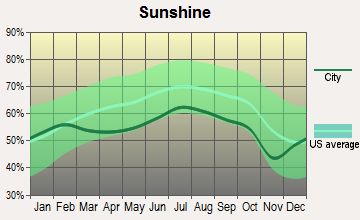
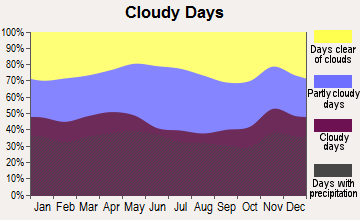
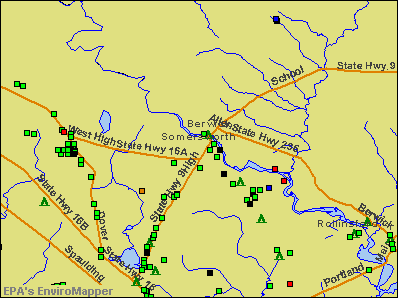

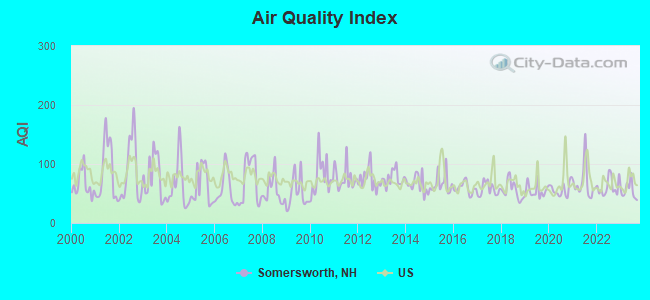
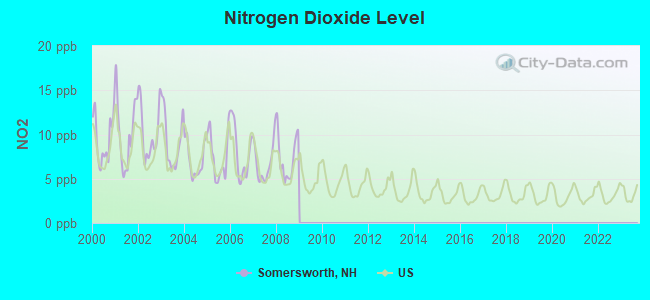
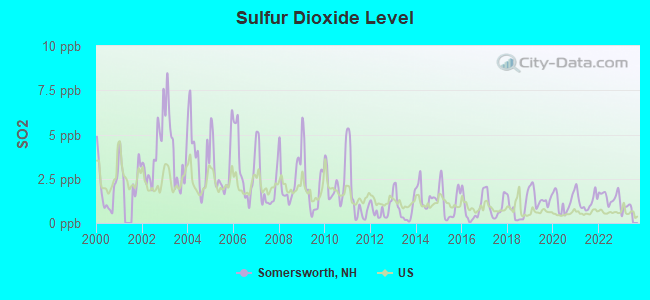
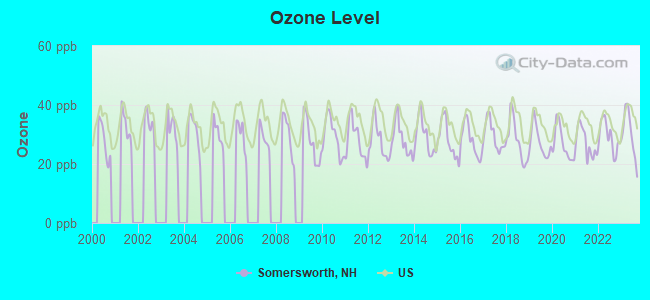
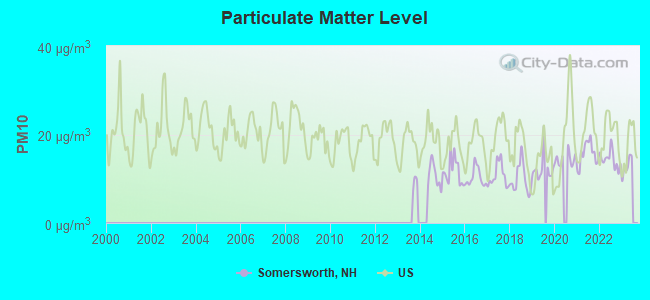
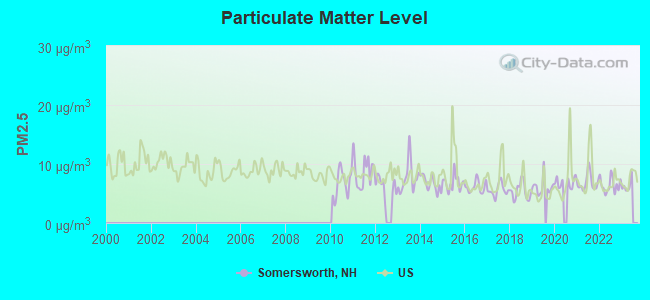
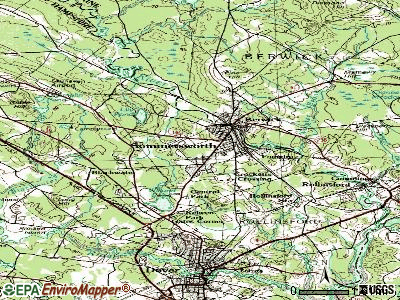
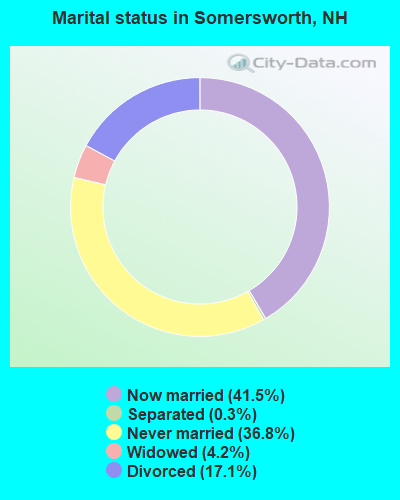
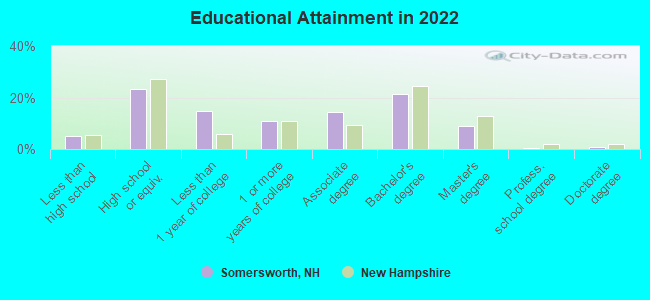
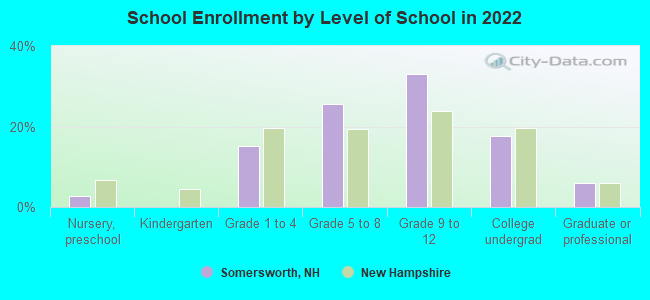
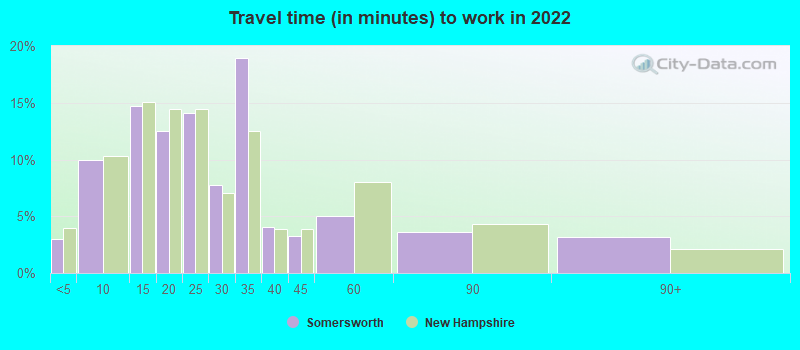
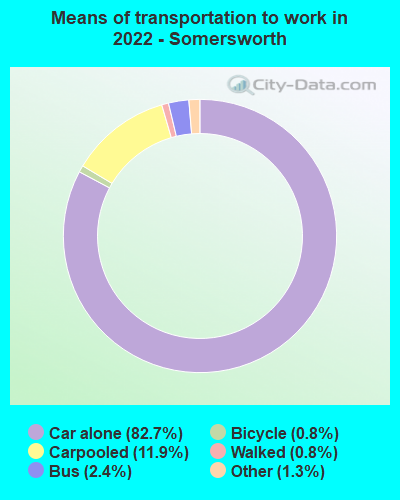
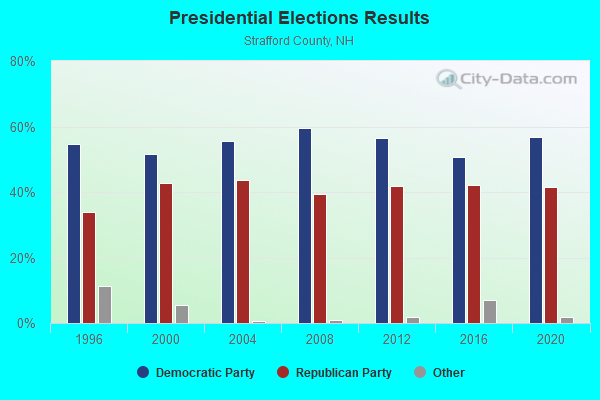
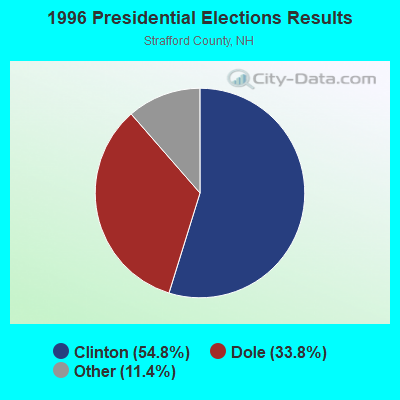
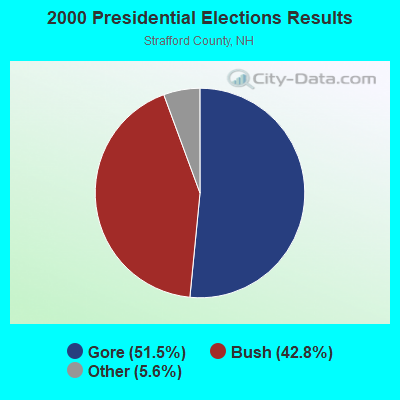
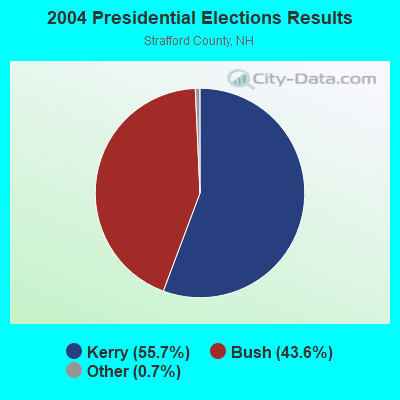
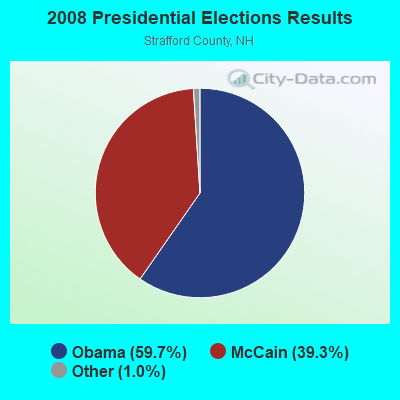
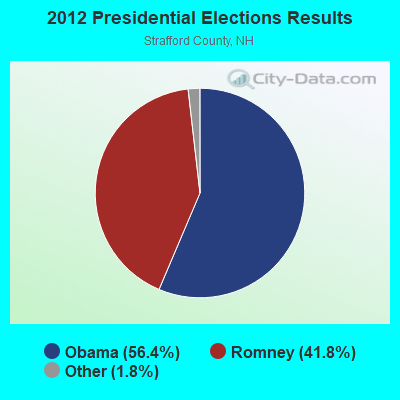
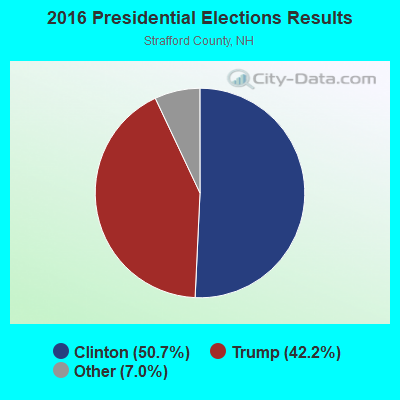
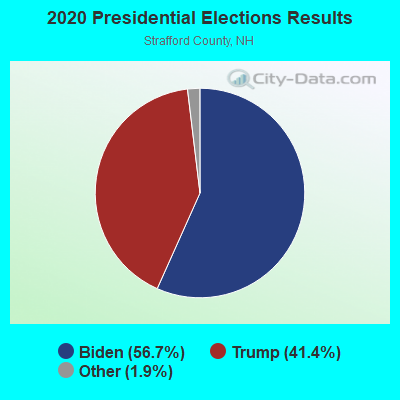
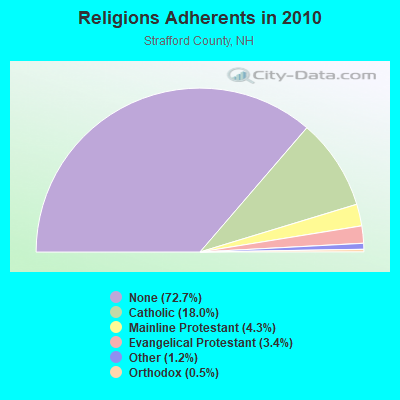
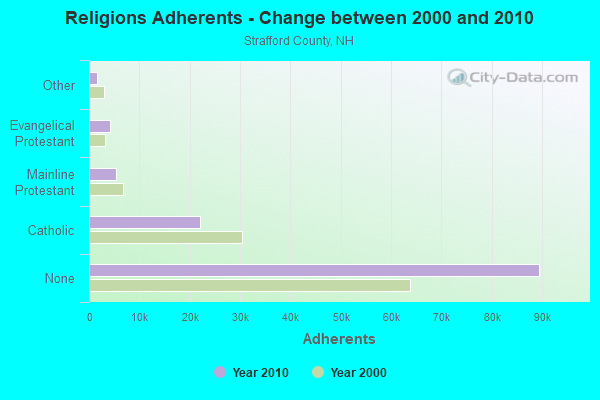
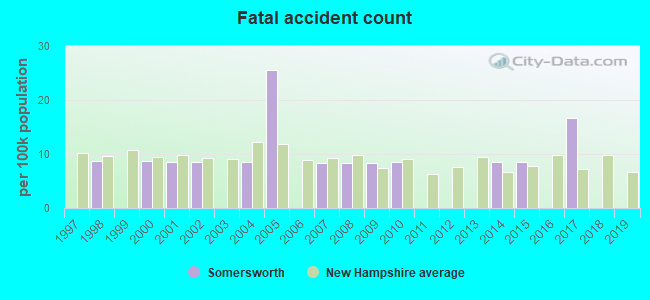
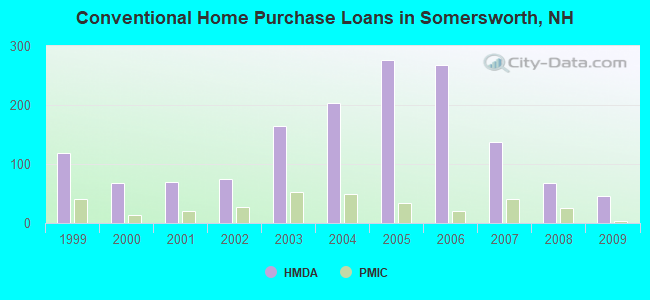
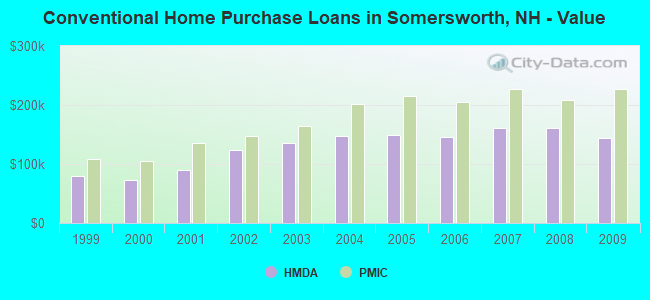
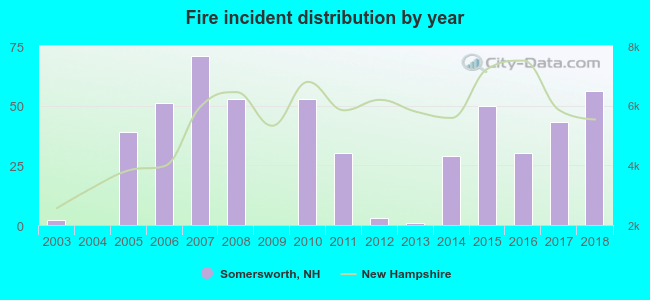 According to the data from the years 2003 - 2018 the average number of fires per year is 32. The highest number of fire incidents - 71 took place in 2007, and the least - 0 in 2004. The data has a growing trend.
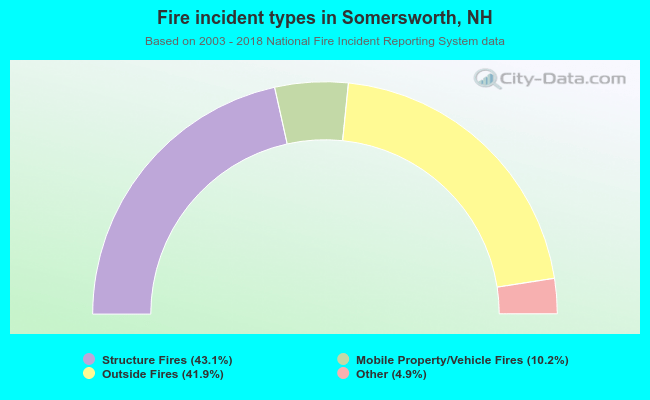 When looking into fire subcategories, the most reports belonged to: Structure Fires (43.1%), and Outside Fires (41.9%).